 Zengguo Liang
 Si Li
Si Li Xiangyuan Ma
 Fenghuan Li1
- 1School of Computer Science and Technology, Guangdong University of Technology, Guangzhou, Guangdong, China
- 2Department of Biomedical Engineering, College of Engineering, Shantou University, Shantou, Guangdong, China
Single-photon emission computed tomography (SPECT) is a widely used diagnostic tool, but radioactive radiation during imaging poses potential health risks to subjects. Accurate low-dose single-photon emission computed tomography reconstruction is crucial in clinical applications of single-photon emission computed tomography. However, it remains a challenging problem due to the high noise and low spatial resolution of the low-dose reconstructed single-photon emission computed tomography images. The aim of the study is to develop a deep learning based framework for high quality low-dose single-photon emission computed tomography reconstruction. In the proposed framework, the conditional generative adversarial network (CGAN) was used as backbone structure and a Residual Attention CSwin Transformer (RACT) block was introduced as the basic building block for the generator of conditional generative adversarial network. The proposed residual attention CSwin transformer block has a dual-branch structure, which integrates the local modeling capability of CNN and the global dependency modeling capability of Transformer to improve the quality of single-photon emission computed tomography reconstructed images. More importantly, a novel loss term based on the geometric tight framelet (GTF) was designed to better suppress noise for the single-photon emission computed tomography reconstructed image while preserving the details of image to the greatest extent. Monte Carlo simulation software SIMIND was used to produce low-dose single-photon emission computed tomography images dataset to evaluate the performance of the proposed method. The simulation results showed that the proposed method can reduce more noise and preserve more details of various situations compared to several recent methods. To further validate the performance of the proposed method, we also verified the generalization ability of the proposed method, which is more adaptable to different noise level scenarios than other methods. Our results indicated that the proposed framework has the potential to reduce the tracer dose required for single-photon emission computed tomography imaging without compromising the quality of the reconstructed images.
1 Introduction
Single-photon emission computed tomography (SPECT) is a non-invasive projection-based imaging modality using gamma rays. It has been widely used in clinical practice and research. However, gamma ray from SPECT radiotracers poses a certain degree of threat to human health and significantly increases the risk of cancer in subjects later in life [1]. Therefore, the well-known ALARA (As Low As Reasonably Achievable) principle is recommended in clinical practice to minimize radiation exposure [2].
In the clinical practice of SPECT, decreasing the activity of the administered radiotracer is a simple and cost-effective approach to reduce the radiation dose. However, lower radioactive doses inevitably lead to projection data with lower photon count rates. Using conventional image reconstruction methods to reconstruct projection data with low photon count rates usually yields images with high Poisson noise, severe artifacts, and low spatial resolution, which might compromise the diagnostic accuracy [3]. Therefore, it is an important and promising research topic in SPECT reconstruction to reduce radiation exposure while maintaining high image quality.
To improve the quality of reconstructed images at low doses, previous works can be mainly classified into two categories: handcrafted and data-driven methods. The commonly-used handcrafted methods consist of analytic reconstruction methods [4, 5] and model-based iterative reconstruction (MBIR) methods [6–14]. In particular, the MBIR methods tend to improve the quality of reconstructed images by constructing a high-fidelity forward model that contains the detailed physical acquisition process and the mathematical formulation of measurement statistics. Therefore, this category of methods has a solid mathematical foundation and theoretical support. However, MBIR methods are computationally intensive due to the huge number of operations required in the forward- and backward-projection steps for each iteration. Moreover, the empirically determined model parameters usually have low generalizability to projection data at various noise levels. These deficiencies limit their clinical application.
In recent years, with the development of deep learning techniques in medical imaging, many data-driven based models have been proposed to reconstruct images with convolution neural networks (CNN) [15]. In contrast to MBIR, data-driven deep learning methods can automatically learn discriminative features directly from the training data without relying on hand-crafted feature engineering. In the past few years, various deep learning-based low-dose reconstruction methods have been proposed, which can be roughly classified into three categories.
In the first category, end-to-end reconstruction methods take projection data or k-space data as input and directly produce high-quality reconstructed images. Among them, the deep learning methods based on algorithm unrolling are one of the most widely investigated approaches [16–18]. To be specific, each step in the iterative reconstruction algorithm can be unrolled into one layer/block of the network and concatenated to form a deep neural network. These approaches combine deep networks with traditional iterative algorithms and provide a way to design novel deep neural network architectures. However, it usually makes the neural networks overly complicated, which leads to high computational costs. An alternative line of research for this category is to directly learn the mapping from raw projection data to reconstructed images using a neural network [19–23]. These approaches have great potential but are limited by their critical dependency on massive data and expensive computational costs.
The second category is the method of pre-processing sinograms with deep neural networks [24–30]. Specifically, these methods mainly consist of two steps. The first step uses a neural network to reduce noise on the sinogram domain, and the second step reconstructs the image from the high-quality sinogram using conventional algorithms such as iterative reconstruction. These methods restrict the denoising problem to the sinogram domain, but they often suffer the loss of partial original information while denoising.
The third category is post-processing methods that use the reconstructed image under low doses as the input of a neural network to restore high quality image. An advantage of these methods is that they do not require access to proprietary data from the scanning device, such as sinogram data. These methods are more convenient to combine with current imaging systems, and therefore more research works exist. For instance, [31] proposed the RED-CNN model, which combined the encoder-decoder structure with the residual mechanism, to improve the quality of low-dose computed tomography (LDCT) images. Similarly, [32] proposed DD-Net by combining the advantages of DenseNet and deconvolution, which showed great potential for sparse-view CT image reconstruction. In addition, [33] proposed a PET image denoising method that combines residual mechanism and U-Net [34], which effectively improves the accuracy of treatment validation and shortens the PET measurement time. On the other hand, the method based on generative adversarial networks (GAN) [35] has been proposed to improve the quality of the reconstructed image. For example, [36] presented a novel CT image denoising technique based on the GAN with Wasserstein distance and perceptual similarity. [37] proposed a technique for generating synthetic digital mammography (SDM) using a deep convolutional neural network with gradient guided cGANs, which aims to reduce the radiation dose for breast cancer screening. [38] proposed a 3D attention least-square (LS) GAN to generate high-quality PET images. These methods achieved encouraging image reconstruction performance. The advancements in deep network architectures and algorithms have contributed to the success of the aforementioned methods. The decisive factor behind it is mainly attributed to the image-specific inductive bias of CNNs in dealing with scale invariance and modeling local visual structures. These intrinsic properties improve the effectiveness of CNN-based models. However, since CNNs are limited by fixed receptive fields, their ability to model global contextual information or long-range spatial dependencies has been impaired [39].
Transformer [40] gradually emerging as the solution to the global contextual information impairment problem in recent years due to its excellent remote dependency modeling capability. As a novel attention-driven building block, the transformer was initially designed for sequence modeling and machine translation tasks. [41] proposed the Vision Transformer Model (ViT) to demonstrate that transformers are also appropriate for computer vision tasks and achieve superior performance. Subsequently, Shifted Window (Swin) Transformer [42] and Cross-Shaped Window (CSwin) Transformer [43] were proposed, which limit the self-attention computation to non-overlapping local windows to reduce the computational cost.
In medical image tasks, the global context modeling capability of the transformer can facilitate accurate encoding for the organs spread over a large receptive field. To this end, [44] proposed TransUNet, which combines the advantages of transformer and U-Net, as a solid alternative to medical image segmentation. Later, TransMed was proposed by [45] for multi-modal medical image classification by combining the merits of transformer and CNN. For the low-dose reconstruction task, there has been some work based on transformer architecture. For instance, [46] proposed TransCT, which applied the transformer for LDCT image enhancement with high and low frequency decomposition. In the other study, [47] proposed the Eformer, which combines a transformer architecture with residual learning for CT image denoising. Furthermore, [48] proposed a convolution-free T2T vision transformer-based Encoder-decoder Dilation Network (TED-Net) for low-dose CT denoising. We note that most current transformer-based work in medical imaging uses hybrid architecture of transformer and CNN. While pure Transformer is excellent at long-range dependencies modeling, it exhibits limitations in capturing fine-grained details due to the lack of inductive bias inherent in modeling local visual features.
The hybrid architecture of transformer and CNN approaches can combine the complementary strengths of transformers and CNNs to facilitate more accurate image generation. In this study, we proposed a deep learning framework combining the conditional generative adversarial network (CGAN) and CSwin transformer for high quality low-dose SPECT reconstruction. A novel loss term based on the geometric tight framelet (GTF) was designed for this framework to better suppress noise for the reconstructed image while preserving the important details of image to the greatest extent. The main contributions of this paper are listed as follows.
(1) We proposed a Residual Attention CSwin Transformer (RACT) block to serve as the basic building block for the generator of CGAN network. In particular, the proposed RACT block has a dual-branch structure, which applies residual convolution block and CSwin Transformer block to capture the local feature and the long-range dependencies to improve the quality of SPECT reconstructed images. It is worth mentioning that, in contrast to previous research work [44, 46, 49], the proposed RACT block can be regarded as a plug-and-play building block that can be readily inserted into various backbone networks.
(2) We proposed a novel loss term based on a geometric tight framelet, namely, GTF loss. The GTF loss constrains the output of generator by minimizing the high-order and multi-orientational feature differences between the low-dose SPECT reconstructed image and the corresponding normal-dose reconstructed image. With the effect of GTF loss, the generated reconstruction is able to preserve image details while the noise is suppressed.
The remainder of this paper is organized as follows. In Section 2, we describe in detail the SPECT reconstruction framework including the design of the proposed RACT block and GTF loss. In Section 3, we present training details and evaluation results, along with the ablation studies to demonstrate the effectiveness of the proposed RACT block and GTF loss. Furthermore, we investigate the robustness and convergence speed of proposed reconstruction framework. Finally, Section 4 and Section 5 conclude this paper with discussions and a brief summary.
2 Materials and methods
The proposed SPECT reconstruction framework consists of two stages, as the flowchart illustrated in Figure 1A. In stage one, we reconstruct the low-dose SPECT sinogram by the preconditioned alternating projection algorithms (PAPA) [50], obtaining the initial reconstructed image and restricting the image reconstruction problem to the image domain. The PAPA algorithm can preliminarily suppress the sinogram’s noise during the SPECT reconstruction to improve the quality of initial reconstructed image, which contributes to reducing the difficulty of post-processing. In addition, the PAPA algorithm has the advantage of lower computational effort than other traditional iterative algorithms.
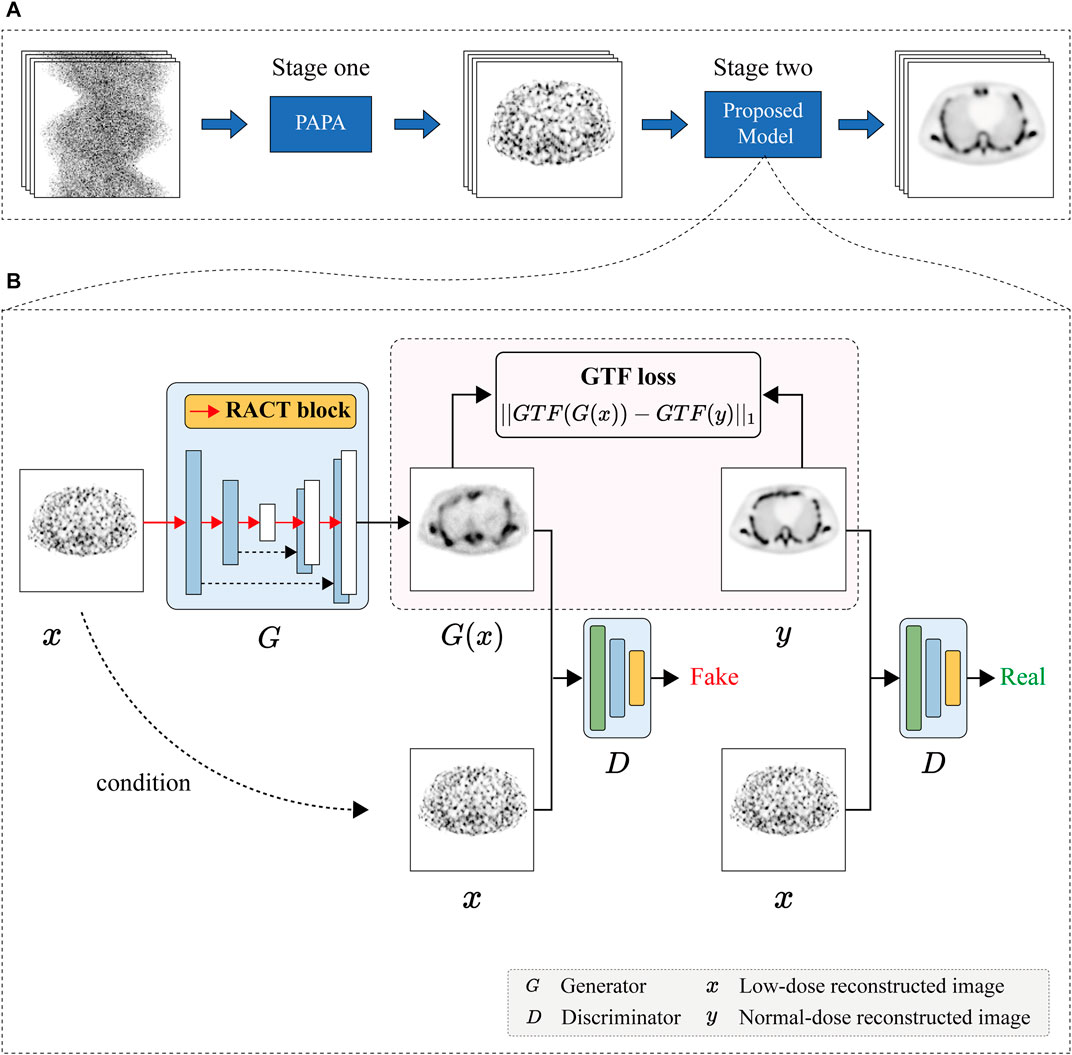
FIGURE 1. Schematic diagram of the SPECT reconstruction framework. (A) The flowchart of SPECT reconstruction framework. (B) The architecture of the proposed CGAN-based network.
In this study, we focus on post-processing stage two. In this stage, we design a deep learning based on CGAN model to improve the quality of the low-dose SPECT reconstructed image by learning the mapping between the low-dose and normal-dose reconstructed image, as shown in Figure 1B. In particular, the proposed RACT block and GTF loss served as the building block and loss function of the CGAN model’s generator. The details of the proposed reconstruction framework are described in the next section.
2.1 Adversarial training
In this study, the proposed model is based on the CGAN architecture to improve the quality of low-dose reconstructed images. The proposed model consists of an U-Net with proposed RACT block as generator to generate candidate reconstructed images and a PatchGAN [51] classifier as the discriminator to evaluate the authenticity of the generated images.
The training procedure of the proposed model is illustrated in Figure 1B. To be specific, given a low-dose reconstructed image
2.1.1 Generator
In this study, the generator network of CGAN follows the U-Net [34] architecture, as shown in Figure 2A. In the encoder path, we replaced the convolution block in the original U-Net with the proposed RACT block in order to enhance the modeling capability of the encoder for long- and short-range dependencies, which facilitated high-quality SPECT image generation. Moreover, in order to mitigate the loss of spatial feature information due to the downsampling of the original U-Net, we employed the mixed-pooling [52] operation instead of the maximum pooling.
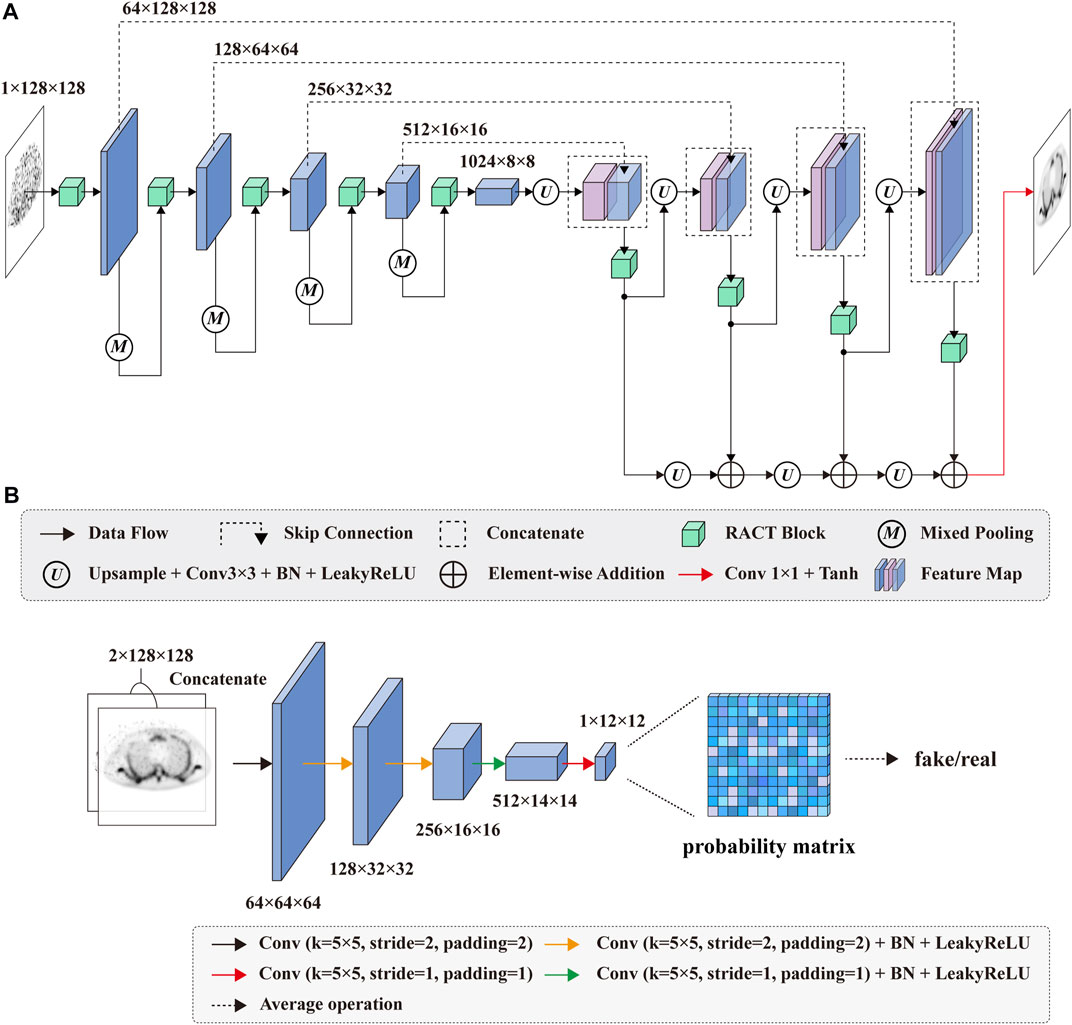
FIGURE 2. The architecture of the proposed (A) generator and (B) discriminator networks.
The decoder path subsequently restores the spatial resolution of the feature maps output by the encoder path. To compensate for the lack of spatial information in the decoding operation, we retained the skip connections of the original U-Net. The feature maps in the encoder path were directly copied to the corresponding layer in the decoder path. The decoder path in the original U-Net consists of a series of stacked convolution blocks. We consider that the convolution block of original U-Net might not be adequate for fusing high-level semantic information with low-level spatial feature information. To this end, we continued using RACT blocks instead of the convolution blocks in the decoder path. It improves the performance of feature fusion and extraction, which ultimately facilitates more accurate SPECT reconstructed image generation. Finally, the feature maps from the previous layer were added to the generated feature maps by residual and upsampling operations to improve the stability of the training and speed up the network convergence.
2.1.2 Discriminator
We adopt the PatchGAN [51] classifier as the discriminator of the proposed model since the PatchGAN can achieve comparable performance to full-image discriminative networks while containing fewer parameters. As depicted in Figure 2B, the adopted PatchGAN in this study consists of five convolution layers. The convolution layer with the stride of 2 is utilized to downsample the feature maps. Except for the first and last convolution layers, the other convolution layers are followed by a batch normalization layer and a LeakyReLU layer.
In our numerical simulations, the generated or normal-dose reconstructed image was respectively concatenated with the corresponding low-dose reconstructed image along the channel dimension and served as the input of PatchGAN. The output of PatchGAN is a probability matrix of size 12 × 12. Each value in the probability matrix represents the discriminative result for the corresponding patches in the input images. Finally, the global classification decision for the entire input image is obtained by averaging over all patches.
2.2 RACT block
To improve the quality of low dose SPECT reconstructed images, we design a residual attention CSwin Transformer (RACT) block that is able to better capture the local feature and the long-range dependencies simultaneously. As seen in Figure 3A, the RACT block consists of two 1 × 1 convolution layers, split and concatenation operations, and two parallel feature extraction branches (i.e., global and local branches). The local branch consists of two stacked Residual Convolution (RConv) blocks and a Convolutional Block Attention Module (CBAM) [53]. The global branch consists of CSwin Transformer (CSwinT) block [43]. To be specific, suppose an arbitrary input feature maps
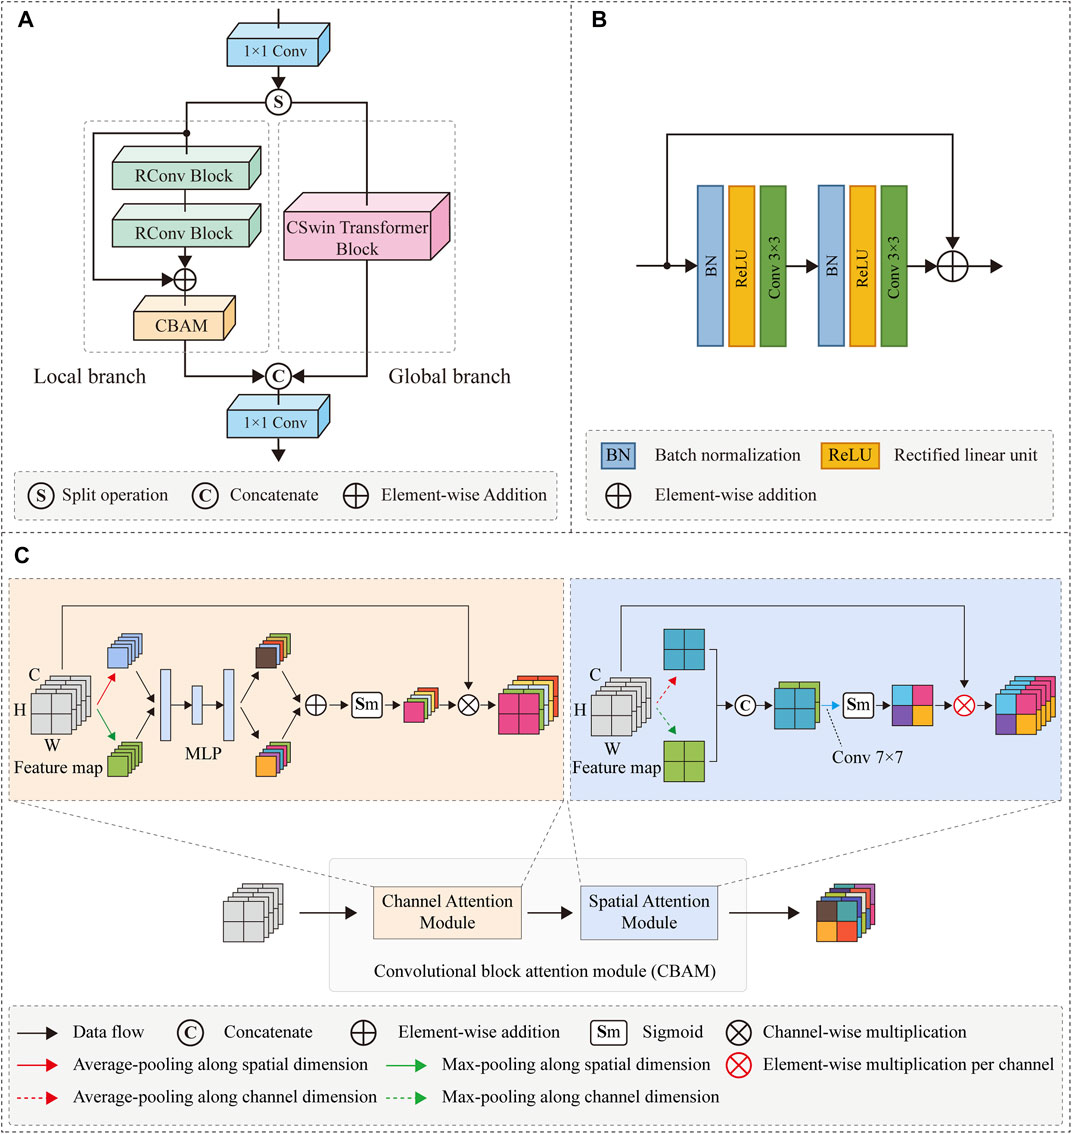
FIGURE 3. (A) The overall architecture of the proposed RACT block, which has a structure of dual branches to extract global and local features in parallel. (B) The architecture of RConv block. (C) The architecture of CBAM.
After that,
On the other hand,
Finally, the feature maps
2.2.1 Local feature extraction branch
The local feature extraction branch consists of two residual convolution blocks with the same structure, a residual operation, and a CBAM [53] module. The residual convolution blocks were used for feature extraction of the low-dose reconstructed images. However, as a functional imaging modality, SPECT suffers from the inherent problems of low resolution and sensitivity to noise. The utilization of residual convolution blocks in local branches alone might still not be achieved to extract critical feature information from a large amount of noisy data. Inspired by the attention mechanism, we attempted to mitigate this problem by introducing the attention module by emphasizing important feature information and suppressing irrelevant information. In this study, we choose a lightweight CBAM module and insert it into the end of the local branch to improve the local feature extraction capability with negligible computational overheads.
The design of residual structure can deepen the network while simplifying the training difficulty of the network. As depicted in Figure 3B, the residual convolution block in this study is composed of the batch normalization layer, the activation layer, and the convolution layer. In addition, the order of different layers in the residual block leads to different results, whereas the pre-activated arrangement enables the inputs to the weight layers to constantly be normalized, thereby allowing the residual blocks to achieve optimal performance [54]. Therefore, we followed the pre-activation method to obtain better results than the original residual blocks.
The CBAM consists of a sequentially combined channel and spatial attention modules, as depicted in Figure 3C. In order to compute channel attention, the spatial dimension of each feature map is first compressed by the average-pooling and max-pooling operations. The results are delivered to a multi-layer perceptron (MLP) in order to model the correlation between channels and obtain the channel attention maps. After element-wise addition for two groups of channel attention maps, a sigmoid operation is performed to produce the final channel attention map. The input feature map is multiplied channel-by-channel with the computed channel attention map to implement recalibration in the channel dimension. In a similar fashion, the spatial attention module uses global average-pooling and global max-pooling operations to aggregate the channel information of feature maps and obtain two spatial feature maps. After the spatial feature maps have been fused using the convolution layer, an activation function (sigmoid) operation is performed to obtain the spatial attention map. In the final step, the per channel component of the input feature map is multiplied by the spatial attention map via element-wise multiplication to obtain a spatially recalibrated feature map. The CBAM block refines the input features in both channel and spatial dimensions, emphasizing critical features while suppressing unnecessary ones, enabling the network to restore more precise SPECT image details.
2.2.2 Global feature extraction branch
In the global branch, we employed the CSwin Transformer block [43] to extract global contextual information. The CSwin Transformer can be used to capture potential long-range dependencies in feature maps for enhancing the quality of low-dose SPECT reconstruction while achieving a trade-off between computational loads and modeling capability. As shown in Figure 4A, the CSwin Transformer block consists of layer normalization (LN), multi-layer perceptron (MLP), skip connection operations, and cross-shaped window self-attention (CSWA). The LN normalizes the features to accelerate model convergence and stabilize the training procedure. The MLP is composed of two neural layers with non-linearity Gaussian Error Linear Units (GELU) [55] to record the learned relation coefficient. In addition, the CSWA is utilized to compute the attention relationships between pixels.
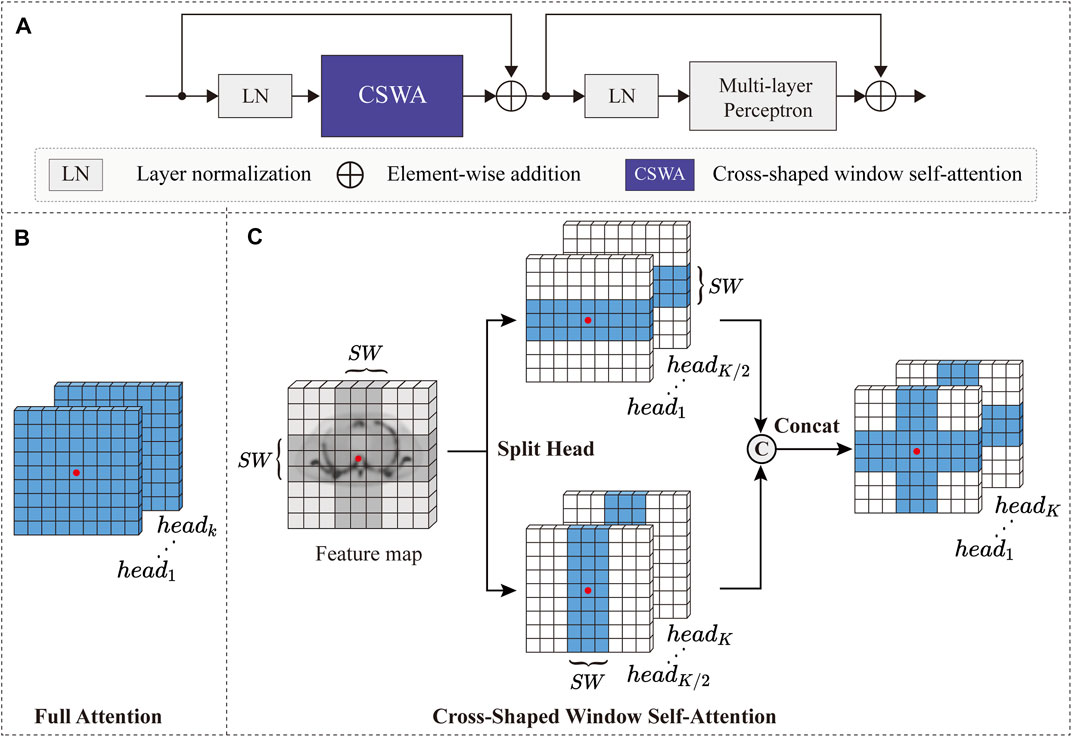
FIGURE 4. (A) The architecture of CSwin transformer block. (B) Full attention. (C) Cross-shaped window self-attention with SW representing the width of strip.
It is well known that the full-attention mechanism of the original vision transformer [41] has powerful long-distance pixel modeling capability, but it incurs a high computational cost. Figure 4B depicts a specific instance of full-attention mechanism. To obtain the contextual relationship of the red pixel in Figure 4B, the full-attention mechanism must calculate its attention relationship with the pixels of the whole image, hence the computational complexity is square related to the size of the feature map [42].
To solve the problem of high computational complexity, CSWA splits a cross area of the feature map into two strip-shaped areas in the horizontal and vertical directions and limits the calculation of self-attention to these horizontal or vertical strip areas, as shown in Figure 4C. To be specific, according to the multi-head attention mechanism [40], a given feature map
Here,
2.3 Loss function
The loss function of our proposed model consists of two parts: adversarial loss and GTF loss. In particular, the adversarial loss forces the generator network to produce images closer to the training data distribution. The GTF loss facilitates the generated images to preserve more high frequency details while the noise is suppressed. We employ a simple additive form for the joint loss function, which is described as follows:
where
2.3.1 Adversarial loss
In image-to-image translation tasks, the objective of the adversarial loss is to force the generator network to learn a mapping between images in the source domain and those in the target domain. In this study, we employed cross-entropy as the adversarial loss function. It can be described as follows:
Here,
2.3.2 GTF loss
The edges and boundaries are the important high frequency features of SPECT images, which play a vital role in distinguishing anatomical structures. [56] applied the geometric tight framelet (GTF) system [57] as an effective noise suppression regularizer to SPECT image denoising task and showed that the GTF system could well preserve the edges and boundaries of SPECT images. The GTF system has significant advantages in detecting multi- orientational and high-order variations of the images and thus can be used to extract the edges and boundaries of SPECT images. Inspired by the above works, we developed a loss function (the GTF loss) that imposes similarity constraints on the edges and boundaries features between generated and normal dose reconstructed images while noise suppression. The GTF loss can be described as follows:
where
In this study, we utilized the GTF loss to measure the multi-orientational and high-order differences between the generated and normal dose reconstructed images in a high-level feature space instead of the pixel space for better feature comparison. The details of the GTF system are provided as follows.
The GTF transform
The matrices
Then, we define
3 Performance evaluation and results
3.1 Datasets
The simulation data in this study were obtained by the SIMIND Monte Carlo simulation program [58], which is well established for SPECT with low-energy photons. It simulates a SIEMENS E.CAM gamma camera with a low energy high resolution (LEHR) collimated beam collimator based on a Monte Carlo simulation method.
To generate the dataset for this study, we simulated three digital phantoms using SIMIND, including an anatomical whole-body model from XCAT [59] library (WB), an anatomical head and torso model for ECT bone imaging (ECT), and a digital geometric phantom (geometric). The ECT and WB phantoms consist mainly of bones, and the geometric phantom consists of activity gradients and uniform cylinders. Figure 5 shows projection data for three phantoms at two specific view angles.
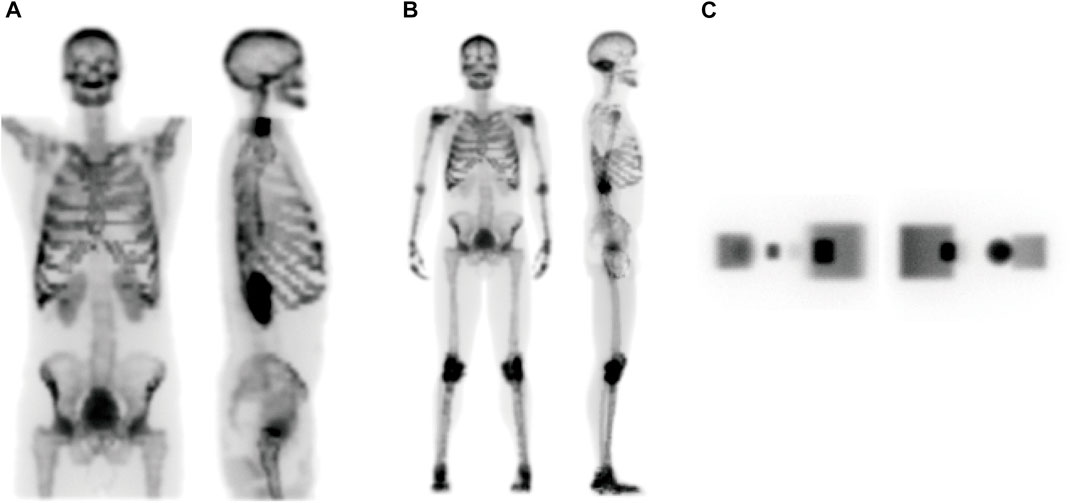
FIGURE 5. The projection data at coronal (left panel) and sagittal (right panel) view angles of (A) ECT, (B) WB, and (C) geometric phantoms, respectively.
For each phantom, we simulated the normal dose projection data with
Low dose projection data for each phantom used in this study contained two levels, which were simulated with
Furthermore, to investigate the robustness of the proposed reconstruction framework, we simulated the viscera of the heart, kidney, liver, and small bowel in ECT phantom under different noise levels using SIMIND. The projection data were simulated using the aforementioned SIMIND configuration, and the total number of detected photon counts in the normal dose projection data is
3.2 Implementation details
3.2.1 Training parameters
In this study, the weights of all deep learning-based models were optimized using the Adam algorithm [60]. For the proposed model, the momentum parameters of Adam were set to
3.2.2 Baseline methods
We compared the proposed method to the other four reconstruction methods, including TV-PAPA, RED-CNN, U-Net, CGAN and SPECTnet. All methods were well-tuned to achieve the best performance and they are described in detail as follows.
(1) TV-PAPA is a traditional iterative reconstruction method with TV regularization [50]. In this study, TV-PAPA achieved the best noise suppression performance for ECT, WB and geometric phantom when the TV regularization term was set to 1.2, 0.2 and 0.15, respectively. The number of iterations of TV-PAPA was set to
(2) The RED-CNN is a method based on the residual encoder-decoder structure proposed by [31]. and applied for low-dose CT denoising. We consider that the SPECT reconstructed images have a lower resolution compared to CT, and the original RED-CNN model might not be adequate for the SPECT image denoising task. Therefore, we modified the original RED-CNN model to enhance its denoising capability. These modifications mainly include increasing the codec depth from
(3) The U-Net was implemented with reference to the article [34]. Compared to the original U-Net, we employed two convolutional layers with batch normalization and rectified linear unit activation function as the basic building block of the U-Net model to improve the performance of network. In addition, all convolutional layers have padding operations that equalize the size of the feature maps on the encoder and decoder of the corresponding layers, which facilitates feature fusion more than the original U-Net. The U-Net was trained with Adam optimizer and L1 loss function.
(4) The implementation of CGAN refers to the work of Isola et al. [51], and its generator adopts the same structure and parameters as U-Net and uses PatchGAN as the discriminator.
(5) The implementation of SPECTnet is based on the work of [23]. The SPECTnet is an end-to-end SPECT reconstruction method that utilizes a two-step network training strategy.
3.3 Evaluation metrics
To evaluate the global reconstruction performance of the reconstructed images, three global image quality metrics were employed, including peak signal to noise ratio (PSNR), structural similarity index measure (SSIM), root mean square error (RMSE). In addition, two local image quality metrics were used to assess the quality of local recovery of the reconstructed images, including coefficient of variation (CV) and mean lesion contrast (MLC). These performance evaluation metrics are described in detail as follows.
In this study, reconstructed images of ECT and WB phantoms were used for the evaluation of global image quality. For the local image quality evaluation, the geometric phantom was used because it has a good geometric structure and can be conveniently used for evaluating the local image quality metrics.
3.3.1 Global image quality metrics
PSNR is a traditional image quality metric for evaluating image restoration, and its formula is shown in Eq. 10. The reconstructed image has higher quality if higher PSNR values are obtained.
where
SSIM is an index that evaluates the similarity of two images based on brightness, contrast, and structure. It can be formulated as Eq. 11. As a similarity measure, a higher value of SSIM means a better match of structural information.
where
As a global image metric, RMSE is used to measure the error between images. It is defined as follows:
where
3.3.2 Local image quality metrics
Coefficient of variation (CV) is used as a noise indicator, reflecting the pixel-to-pixel variability in the image. It is defined as follows:
where
Mean lesion contrast (MLC) is a local quality metric used to evaluate the quality of contrast restoration in lesions. It is calculated by means of the 2D ROI on the largest cross-section through the center of the hot sphere. The background ROIs are maintained at the same shape and size as the target. The MLC is then defined as:
where
3.4 Visual results
To visually evaluate the performance of the proposed method, a representative chest slice from the ECT phantom was chosen. The results with different methods are shown in Figures 6A–F and Figures 7A–F. It can be observed that TV-PAPA roughly restored the overall contour of the bone but lost many image details. In contrast, the deep learning-based methods both restored the overall structure of the image while recovering the image details. As a reference, we present the PSNR (the first value in the bracket) and SSIM (the second value in the bracket) metrics of the slice obtained with different methods in the caption of Figure 6.
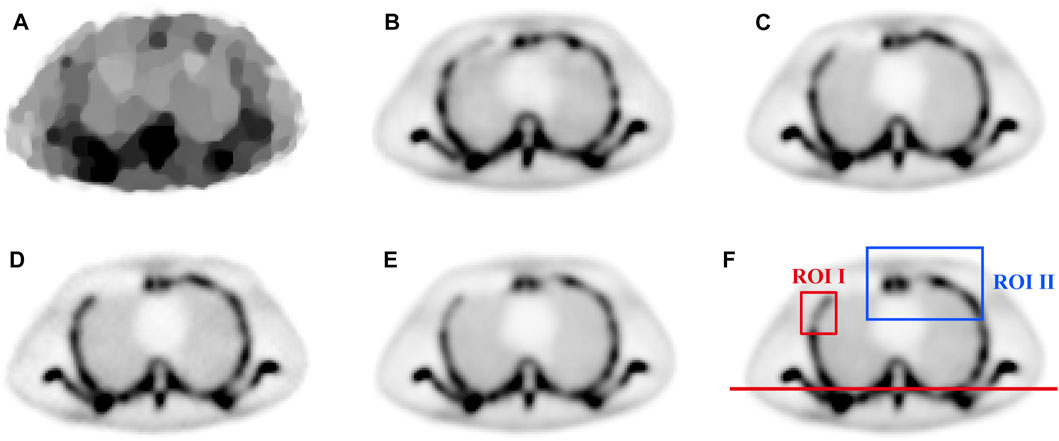
FIGURE 6. The comparison of chest image in ECT phantom reconstructed by different methods: (A) TV-PAPA (24.2632,0.8310), (B) RED-CNN (31.5704, 0.9561), (C) U-Net (36.8849, 0.9826), (D) CGAN (37.7868, 0.9824), (E) Ours (40.9380, 0.9927), and (F) the normal-dose reconstructed image.
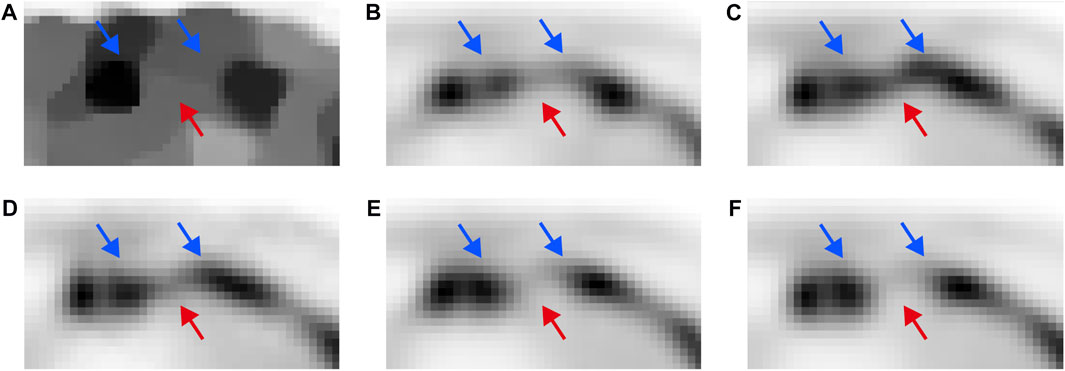
FIGURE 7. The zoomed-in images of ROI II in Figure 6: (A) TV-PAPA, (B) RED-CNN, (C) U-Net, (D) CGAN, (E) Ours, and (F) the normal-dose reconstructed image.
To further examine the performance of image detail reconstruction with different methods, we chose two ROIs for comparison. Comparing the results with different methods in ROI I marked in Figure 6F, it can be observed that the proposed method outperforms other methods in maintaining the bone structure and restoring image contrast. The ROI II for different methods is zoomed in and displayed in Figure 7. As indicated by the red and blue arrows in Figure 7, the proposed method gave more accurate image reconstruction results than the other methods.
To provide a more quantitative comparison, we draw the line profile along the straight red line in Figure 6F. The comparison results are shown in Figure 8. It was observed that the proposed method has a smallest deviation from the normal-dose reconstructed image than the other methods.
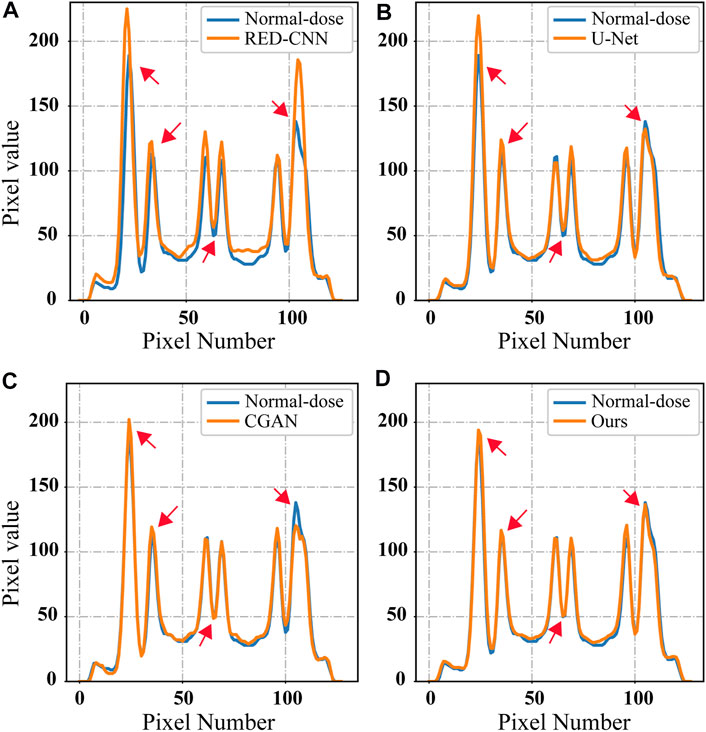
FIGURE 8. The line profiles indicated by the red line in Figure 6F for different methods: (A) RED-CNN, (B) U-Net, (C) CGAN, and (D) Ours.
3.5 Quantitative results
3.5.1 Global metrics
Table 1 shows the global metrics quantitative results of different methods on the 5-fold cross-validation in terms of means ± SDs (average scores ± standard deviations). It can be seen that the traditional iteration-based TV-PAPA performs worse than the deep learning-based methods. The proposed method achieves the best performance among competing methods and increases PSNR by 2.94 dB compared to CGAN. The evaluation results demonstrated the proposed method achieves better reconstruction performance compared to other methods in this study.
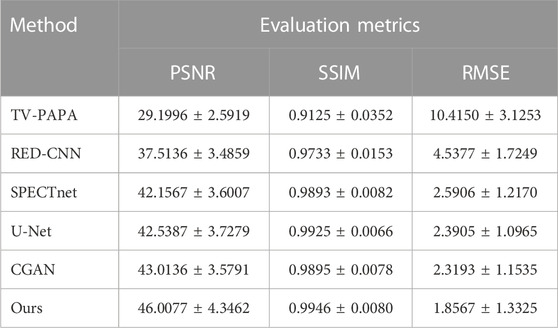
TABLE 1. The global metrics quantitative results (mean ± std) of different methods.
3.5.2 Local metrics
The average coefficient of variation (CV) was used to evaluate the local image performance of the proposed method. As marked by the yellow box in Figure 9, the ROIs with the same position and size were chosen for calculating the average CV in the geometric phantom images reconstructed with different methods. The results (mean ± SDs) are listed in Table 2 and indicated that the proposed method has better noise suppression performance than competing methods.
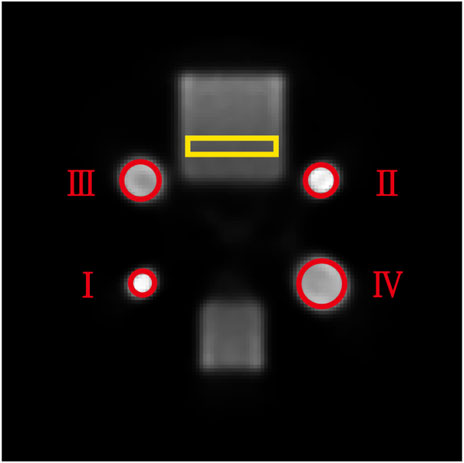
FIGURE 9. Schematic illustration of a reconstructed slice of the geometric phantom under normal-dose acquisition. The yellow rectangular ROI was used for CV calculation and the four red circular ROIs were used for MLC calculation.
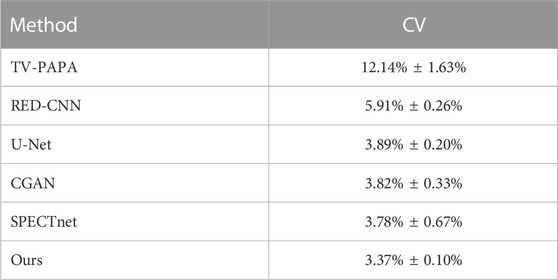
TABLE 2. The CV values (mean ± std) of different reconstruction methods.
In addition, we calculated the mean lesion contrast (MLC), which is obtained by calculating and averaging the given ROIs over different reconstructed images. The MLC metric was used to evaluate the contrast recovery quality at lesions in reconstructed images. In this study, we selected four 2D ROIs on the thermosphere cross-section of the geometric phantom, as highlighted in Figure 9 by the red circles. We plotted the MLC results of different deep-learning methods in Figure 10 to evaluate their local restoration ability. It can be observed that the proposed method provides the optimal mean lesion contrast across the four ROIs compared to other methods. The evaluation results imply that the proposed method can effectively improve the lesion contrast in reconstructed images compared to other methods in this study.
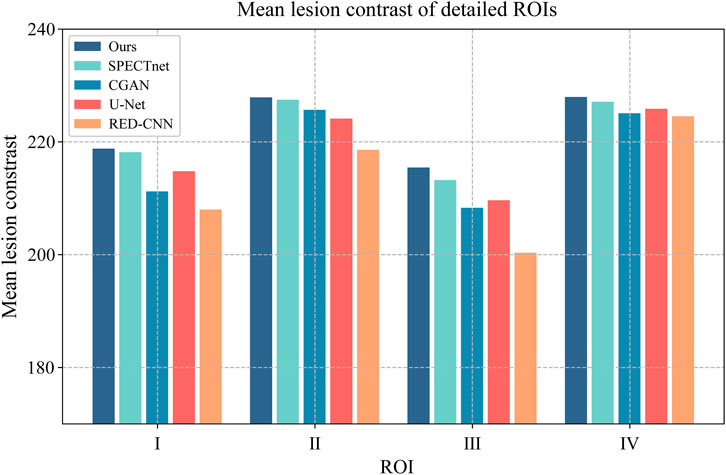
FIGURE 10. The MLC results of four circular ROIs for different methods. The x-axis represents the ROI number, and the y-axis represents the value of the MLC.
3.6 Noise suppression capacity of different methods
In addition, a representative reconstructed image of the geometric phantom was chosen to further evaluate the noise suppression capacity of the different methods. The images reconstructed with different methods are shown in the first column of Figure 11. The surface and contour plots of the red rectangle ROI are displayed in the second and third columns of Figure 11, respectively. In general, the surface map is smoother and the contour map has fewer closed loops, corresponding to less noise and artifacts in the reconstructed image.
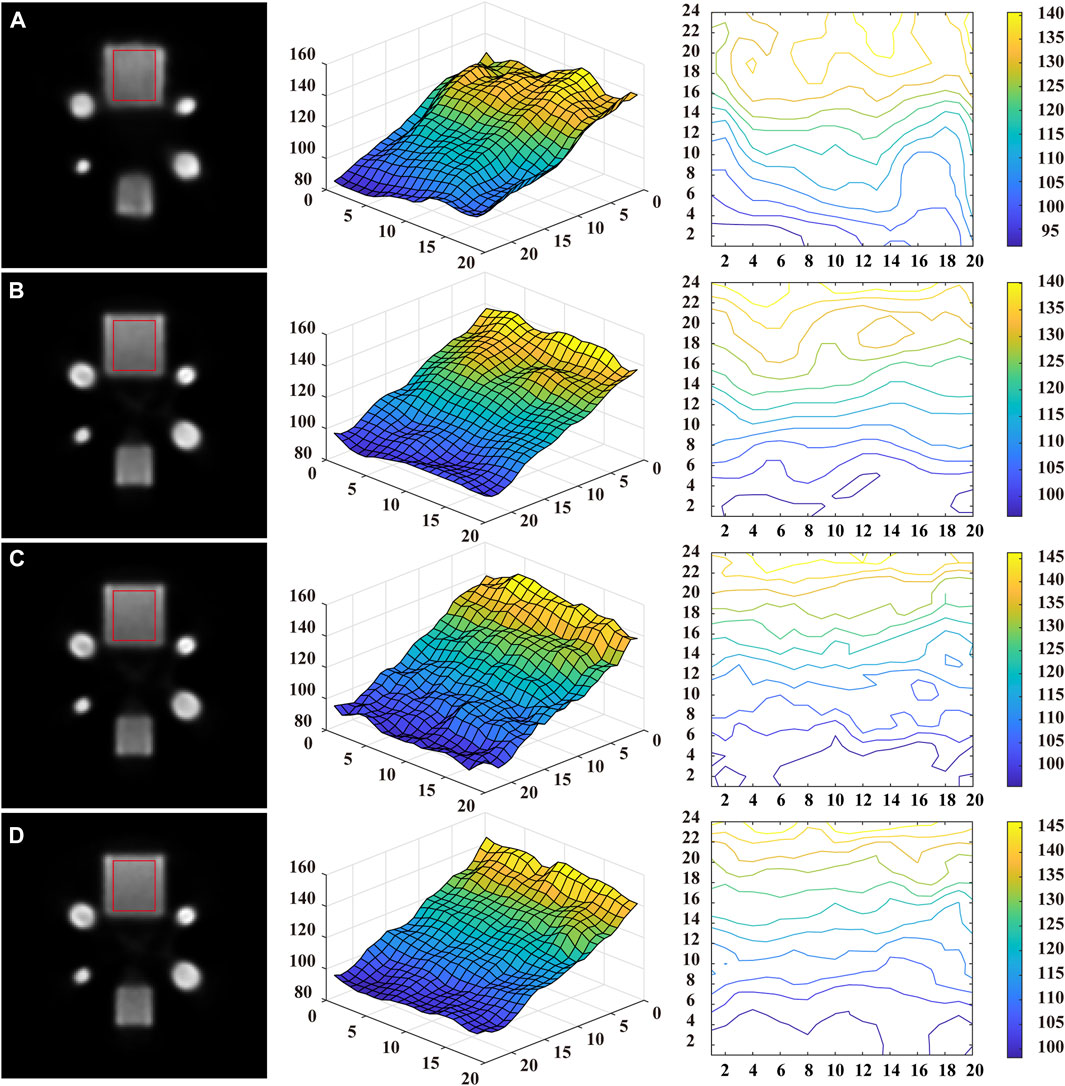
FIGURE 11. The reconstructed images (the first column), the surface plots (the second column), and the contour plots (the third column) of the red rectangular ROI for different methods: (A) RED-CNN, (B) U-Net, (C) CGAN, and (D) Ours.
It can be observed that the surface plots of all the methods exhibit approximately linear variation. In regions of high intensity, the result of the RED-CNN exhibited a degree of oscillation, while the contour plots display a degree of distortion. In contrast, the surface map with U-Net is smoother and slightly better than the one of RED-CNN. The surface plot of the reconstructed image with CGAN has some degree of tiny oscillations, but it has fewer closed loops in the contour plot than the U-Net. The proposed method outperforms the others in the sense that it can better preserve the linearly varying contours along the vertical direction while avoiding closed contour lines that indicate local oscillations. The evaluation results suggest that the proposed method may have superior noise suppression capacity.
3.7 Robustness of proposed method
In our numerical simulations, the Poisson noise of the reconstructed images in both the training and testing sets was maintained at an equivalent level. However, different noise levels exist in clinical applications of SPECT. A clinically meaningful SPECT reconstruction method should have strong robustness to adapt to situations where the actual data may have a higher noise level than the training data. Therefore, we evaluated the robustness of the proposed method on the ECT-viscera dataset. The three competing methods based on deep learning were applied to the same dataset for comparison.
Two representative reconstructed images of the chest (the first row) and abdomen (the second row) in the testing set were chosen to visually compare the performance of different methods, as shown in Figure 12. Comparing the first row in Figure 12, it can be observed that the proposed method provides a clearer and more accurate structure of the heart wall, as pointed out by the red arrows in zoomed box. Comparing the second row in Figure 12, it can be observed that the proposed method better maintains the cross-sectional shape of the kidney, as exhibited by the green zoomed box.
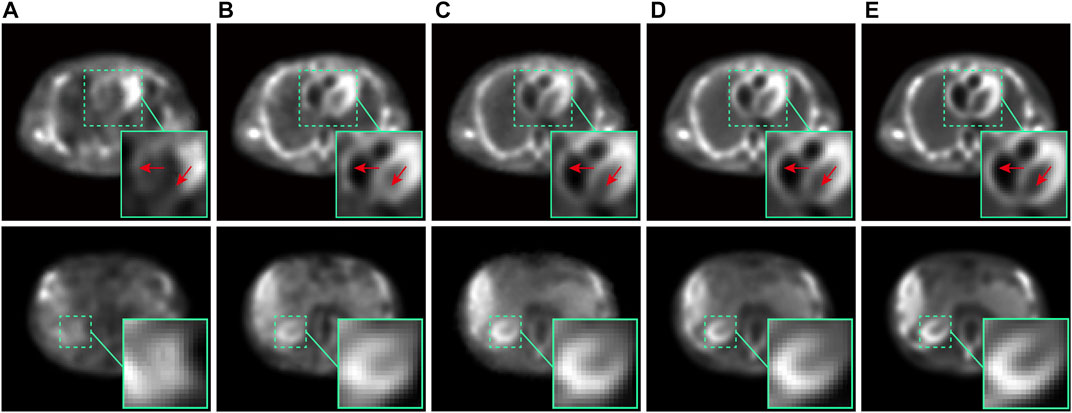
FIGURE 12. The comparison of the chest (first row) and abdominal (second row) images in ECT-viscera phantom reconstructed by different methods: (A) RED-CNN, (B) U-Net, (C) CGAN, (D) Ours, and (E) the nomal-dose reconstructed images.
We further used the PSNR, SSIM and RMSE to evaluate different methods quantitatively. The results are reported in Table 3. It can be observed that the proposed method achieved the best performance. The evaluation showed that the proposed method has better robustness than other methods.
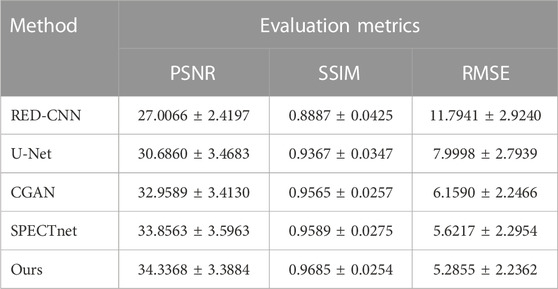
TABLE 3. The quantitative results (mean ± std) of different methods on the ECT-viscera dataset.
3.8 Ablation study
3.8.1 Effectiveness of RACT block and GTF loss
In this section, we conducted an ablation study to investigate the effectiveness of the proposed RACT block and GTF loss. For comparison purposes, we applied CGAN as the baseline network. To ensure the results are valid, we performed the 5-fold cross-validation to evaluate the performance of each model.
The results (mean) are presented in the module ablation section in Table 4, which indicates the proposed model obtains the best performance and verify the effectiveness of the proposed RACT block and GTF loss. For the convenience of discussion, we focus mainly on the PSNR metric. It is seen that after adding the GTF loss to the baseline network, the PSNR increased by 0.66 dB compared to the baseline. Additionally, when the standard convolution block of the baseline network was replaced with the RACT block, the PSNR increased by 1.67 dB compared to the baseline. When the GTF and RACT blocks were applied at the same time, the PSNR increased by 2.99 dB compared to the baseline. The evaluation results demonstrate that both the GTF loss and the RACT block can effectively contribute to the network performance and hence enhance image quality.
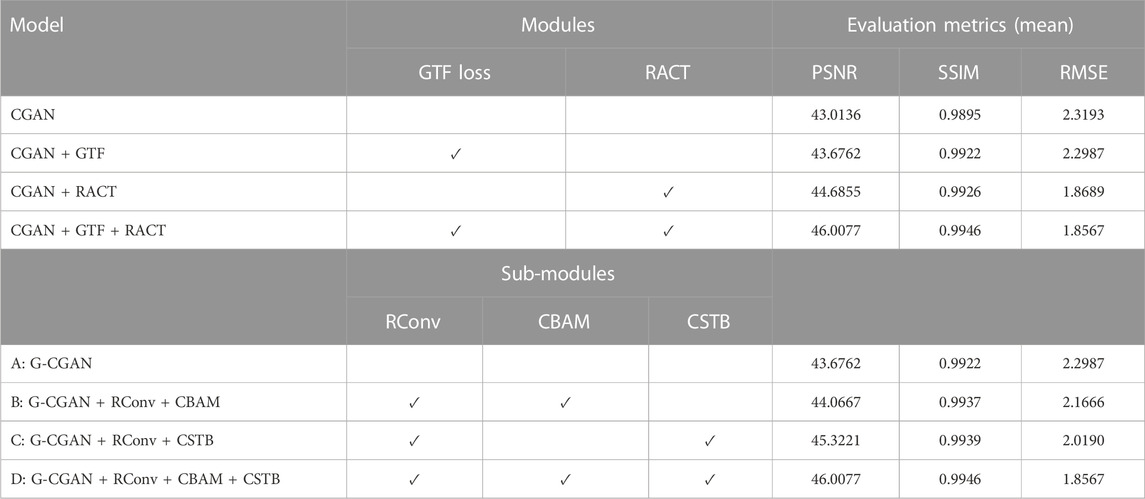
TABLE 4. The ablation study for the proposed modules and sub-modules in the proposed RACT block.
3.8.2 Effectiveness of sub-modules in RACT block
As described in Section 2, the dual branch of the RACT block is specifically composed of the residual convolution block (RConv), the feature refinement module (CBAM), and the CSwin Transformer block (CSTB). We further conducted an ablation study to investigate the performance and necessity of these components. The CGAN with GTF loss was applied to as baseline network, referred to as G-CGAN (Model A) for short.
The results (mean) are listed in the sub-module ablation section in Table 4, which proves the effectiveness of the RACT block we proposed. To verify the effectiveness of local branch in RACT block, we replaced the building blocks of model A with RACT blocks that have only local branches and referred to as model B. Compared with model A, the result of model B increases the PSNR by 0.39 dB and demonstrates the effectiveness of local branch in RACT block. Model D was designed to verify the effectiveness of the global branch, and model D further enabled the global branch in the RACT block based on model B. Compared with model B, the result of model D increases the PSNR by 1.94 dB and demonstrates the effectiveness of global branch in RACT block. In addition, we designed model C to verify the effectiveness of CBAM in RACT block. In model C, the CBAM module of the RACT block was removed while retaining the other sub-modules. It can be observed that the result of model C decreases the PSNR by 0.68 dB compared to model D. The evaluation results verified the effectiveness of the sub-modules in the RACT block.
3.9 Convergence of different models
In this section, we investigated the convergence speed of the proposed model. Several different deep learning-based models were trained and tested on the same datasets in different epochs for performance comparison. To ensure the validity of results, we conducted 5-fold cross-validation for each model. The average PSNR, SSIM, and RMSE results obtained during the network testing were recorded and plotted as the convergence curves shown in Figures 13A–C. It can be seen that the proposed model reaches the convergence state within 400 training epochs, as shown in Figure 13A. Furthermore, it is worth noting that in the early stages of model training (e.g., 200 epochs), the PSNR value of the proposed model is higher than the PSNR value of other models at the final convergence state, as indicated by the black dashed line in Figure 13A. The evaluation results indicated that the proposed model has a faster convergence speed and achieves better performance compared to competing models.
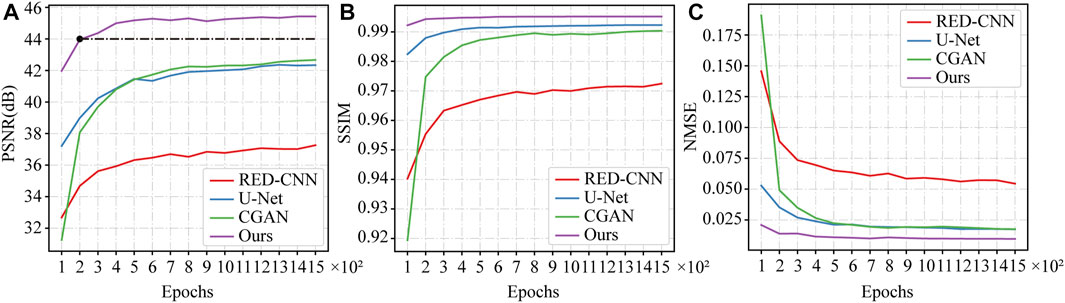
FIGURE 13. The curves of convergence speed in terms of (A) PSNR, (B) SSIM and (C) RMSE for different models.
4 Discussion
Lowering the radioactive dose during SPECT imaging is significant, but it will compromise the quality of reconstructed images. In this paper, we propose a SPECT reconstruction framework aimed at providing high quality reconstructed images from low-dose projection data. The proposed framework uses the CGAN as backbone, which combines the U-Net with proposed RACT blocks as the generator and PatchGAN as the discriminator. The RACT block consists of a local feature extraction branch and a global feature extraction branch to model and fuses the potential short-range and long-range dependencies in the feature maps. In addition, we design a novel GTF loss function based on a geometric tight framelet to suppress the noise while preserving the image details to the maximum. The evaluations show that the proposed SPECT reconstruction framework has advantages over some existing deep learning methods.
We selected representative reconstructed slices from the ECT dataset for visual comparison. It can be observed that the results of the proposed reconstruction framework are closer to the normal-dose reconstructed image than other methods, whether it is the restoration of contrast or the preservation of bone structure. We attribute that some organs (e.g., bones) cover a large receptive field in the reconstructed images, and therefore image reconstruction using the Transformer that is excellent at modeling remote dependencies is superior to traditional CNNs. Meanwhile, we performed cross-validation and calculated PNSR, SSIM, and RMSE for reconstructed images from ECT and WB phantoms. The proposed framework achieved the best performance in the metrics relative to other methods, which is consistent with the performance of visual effects.
A slice from the geometric phantom was used to compare the noise suppression performance of different methods. The proposed framework exhibits fewer closed loops and oscillations for processing linearly smooth slopes, which shows that the proposed framework has superior noise suppression capacity. We further used the CV and MLC metrics to verify the local image reconstruction quality with different methods using the geometric phantom. The evaluation results show that the proposed framework achieve the best performance compared to competing methods. We consider that the long-range dependence might still be useful to improve the quality of reconstruction in regions with smaller receptive fields.
The ablation study results showed that the proposed GTF loss function and the RACT block contribute to improving the reconstructed performance. Furthermore, we verified the effectiveness of the submodules of the RACT block. We found that the refinement of local features is still essential even after the long-range dependent modeling was introduced. Specifically, when the feature refinement module (CBAM) in the local branch was removed, the quality of the reconstruction decreased. We consider that the best reconstruction performance is achieved when meaningful local features and global features are combined.
Furthermore, we utilized the ECT-viscera phantom to generate datasets with more details in reconstruction image and multiple noise levels. The evaluation results showed that the proposed reconstruction framework has better robust performance compared to other methods. Due to radiation dose limitations, patients cannot be scanned repeatedly in the hospital to acquire data on multiple noise levels. We believe that the stronger robustness allows the model to retain a degree of image reconstruction capability, despite the lack of training for specific noise levels. It has great significance for clinical application. Finally, we investigated the convergence speed of the proposed framework and found that the proposed framework had achieved high reconstruction quality in the early stage of training compared to other methods.
Although the proposed framework can effectively improve the quality of low-dose reconstructed images, it still needs improvement in our future work. In the future, we intend to conduct more in-depth studies of the proposed SPECT reconstruction framework using clinical data while applying the reconstruction framework to more medical imaging modalities.
5 Conclusion
In this paper, we proposed SPECT reconstruction framework to improve the quality of low-dose reconstructed image. The proposed framework effectively extracts and models the long-range and short-range dependencies in the feature map by the proposed RACT block, while utilizing the proposed GTF loss function to constrain the generator network to preserve image details maximum while denoising. The evaluation results showed that the proposed framework has the potential to reduce the tracer dose required for SPECT imaging without compromising the quality of the reconstructed images.
Data availability statement
The original contribution presented in the study is included in the article/Supplementary Material; further inquiries can be directed to the corresponding author.
Author contributions
ZL and SL designed the research and ZL also wrote the manuscript. SL and XM supervised the study and revised the manuscript. FL and LP performed the data analysis. All authors contributed to the article and approved the submitted version.
Funding
This work is supported in part by the Natural Science Foundation of Guangdong Province under grant 2022A1515012379, and by the Opening Project of Guangdong Province Key Laboratory of Computational Science at Sun Yat-sen University under grant 2021007, and by the Science and Technology Program of Guangzhou under grant 201804020053. This work is also supported by Shantou University (STU Scientific Research Foundation for Talents: NTF21004).
Conflict of interest
The authors declare that the research was conducted in the absence of any commercial or financial relationships that could be construed as a potential conflict of interest.
Publisher’s note
All claims expressed in this article are solely those of the authors and do not necessarily represent those of their affiliated organizations, or those of the publisher, the editors and the reviewers. Any product that may be evaluated in this article, or claim that may be made by its manufacturer, is not guaranteed or endorsed by the publisher.
References
1. Brenner DJ, Sachs RK, Estimating radiation-induced cancer risks at very low doses: Rationale for using a linear no-threshold approach. Radiat Environ Biophys (2006) 44:253–6. doi:10.1007/s00411-006-0029-4
2. Bevelacqua JJ, Practical and effective ALARA. Health Phys (2010) 98:39–47. doi:10.1097/HP.0b013e3181d18d63
3. Wells RG, Dose reduction is good but it is image quality that matters. J Nucl Cardiol (2020) 27:238–40. doi:10.1007/s12350-018-1378-5
4. Bruyant PP, Sau J, Mallet JJ. Streak artifact reduction in filtered backprojection using a level line–based interpolation method. J Nucl Med (2000) 41:1913–9. Available at: https://jnm.snmjournals.org/content/41/11/1913 (Accessed April 25, 2023).
5. Bruyant PP, Analytic and iterative reconstruction algorithms in SPECT. J Nucl Med (2002) 43:1343–58. Available at: https://jnm.snmjournals.org/content/43/10/1343 (Accessed April 25, 2023).
6. Lehovich A, Bruyant PP, Gifford HS, Schneider PB, Squires S, Licho R, et al. Impact on reader performance for lesion-detection/localization tasks of anatomical priors in SPECT reconstruction. IEEE Trans Med Imaging (2009) 28:1459–67. doi:10.1109/TMI.2009.2017741
7. Fessler JA, Model-based image reconstruction for MRI. IEEE Signal Process Mag (2010) 27:81–9. doi:10.1109/msp.2010.936726
8. Lougovski A, Hofheinz F, Maus J, Schramm G, Will E, Van den Hoff J. A volume of intersection approach for on-the-fly system matrix calculation in 3D PET image reconstruction. Phys Med Biol (2014) 59:561–77. doi:10.1088/0031-9155/59/3/561
9. Iriarte A, Marabini R, Matej S, Sorzano COS, Lewitt RM. System models for PET statistical iterative reconstruction: A review. Comput Med Imaging Graph (2016) 48:30–48. doi:10.1016/j.compmedimag.2015.12.003
10. Jiang Y, Li S, Xu Y. A higher-order polynomial method for SPECT reconstruction. IEEE Trans Med Imaging (2019) 38:1271–83. doi:10.1109/tmi.2018.2881919
11. Chen Y, Huang J, Li S, Lu Y, Xu Y. A content-adaptive unstructured grid based integral equation method with the TV regularization for SPECT reconstruction. Inverse Probl Imaging (2020) 14:27–52. doi:10.3934/ipi.2019062
12. Tang X, Schmidtlein CR, Li S, Xu Y. An integral equation model for PET imaging. Int J Numer Anal Model (2021) 18:834–64.
13. Chen Y, Lu Y, Ma X, Xu Y. A content-adaptive unstructured grid based regularized CT reconstruction method with a SART-type preconditioned fixed-point proximity algorithm. Inverse Probl (2022) 38:035005. doi:10.1088/1361-6420/ac490f
14. Luo Y, Wei M, Li S, Ling J, Xie G, Yao S. An effective co-support guided analysis model for multi-contrast MRI reconstruction. IEEE J Biomed Health (2023) 27:2477–88. doi:10.1109/JBHI.2023.3244669
15. Wang G, Ye JC, De Man B. Deep learning for tomographic image reconstruction. Nat Mach Intell (2020) 2:737–48. doi:10.1038/s42256-020-00273-z
16. Yang Y, Sun J, Li H, Xu Z. Deep ADMM-Net for compressive sensing MRI. In: Proceeding of the 30th International Conference on Neural Information Processing Systems (NIPS); 5-10 December 2016; Barcelona, Spain. New York: Curran Associates Inc. (2016). p. 10–8. doi:10.5555/3157096.3157098
17. Adler J, Öktem O. Learned primal-dual reconstruction. IEEE Trans Med Imaging (2018) 37:1322–32. doi:10.1109/TMI.2018.2799231
18. Zhang H, Dong B, Liu B. JSR-Net: A deep network for joint spatial-radon domain CT reconstruction from incomplete data. In: Proceeding of the 44th IEEE International Conference on Acoustics, Speech and Signal Processing (ICASSP); 12-17 May 2019; Brighton, United kingdom. New York: IEEE (2019). p. 3657–61. doi:10.1109/ICASSP.2019.8682178
19. Zhu B, Liu JZ, Cauley SF, Rosen BR, Rosen MS. Image reconstruction by domain-transform manifold learning. Nature (2018) 555:487–92. doi:10.1038/nature25988
20. Fu L, De Man B, A hierarchical approach to deep learning and its application to tomographic reconstruction. In: Proceeding of the 15th International Meeting on Fully Three-Dimensional Image Reconstruction in Radiology and Nuclear Medicine; 2-6 June 2019; Philadelphia, PA, USA (2019). 1107202. doi:10.1117/12.2534615
21. Häggström I, Schmidtlein CR, Campanella G, DeepPET FTJ, DeepPET: A deep encoder–decoder network for directly solving the PET image reconstruction inverse problem. Med Image Anal (2019) 54:253–62. doi:10.1016/j.media.2019.03.013
22. Shao W, Pomper MG, Du Y. A learned reconstruction network for SPECT imaging. IEEE Trans Radiat Plasma Med Sci (2020) 5:26–34. doi:10.1109/TRPMS.2020.2994041
23. Shao W, Rowe SP, Du Y. SPECTnet: A deep learning neural network for SPECT image reconstruction. Ann Transl Med (2021) 9:819. doi:10.21037/atm-20-3345
24. Li Z, Zhang W, Wang L, Cai A, Liang N, Yan B, et al. A sinogram inpainting method based on generative adversarial network for limited-angle computed tomography. In: Proceeding of the 15th International Meeting on Fully Three-Dimensional Image Reconstruction in Radiology and Nuclear Medicine; 2-6 June 2019; Philadelphia, PA, USA (2019). doi:10.1117/12.2533757
25. Chrysostomou C, Koutsantonis L, Lemesios C, Papanicolas CN. SPECT angle interpolation based on deep learning methodologies. In: Proceeding of the IEEE Nuclear Science Symposium and Medical Imaging Conference; October 31-November 7 2020; Boston, MA, USA. New York: IEEE (2020). doi:10.1109/NSS/MIC42677.2020.9507966
26. Tang C, Zhang W, Wang L, Cai A, Liang N, Li L, et al. Generative adversarial network-based sinogram super-resolution for computed tomography imaging. Phys Med Biol (2020) 65:235006. doi:10.1088/1361-6560/abc12f
27. Wang YZ, Zhang WK, Cai AL, Wang LY, Tang C, Feng ZW, et al. An effective sinogram inpainting for complementary limited-angle dual-energy computed tomography imaging using generative adversarial networks. J X-ray Sci Technol (2021) 29:37–61. doi:10.3233/xst-200736
28. Li S, Ye W, Li F. LU-Net: Combining LSTM and U-Net for sinogram synthesis in sparse-view SPECT reconstruction. Math Biosci Eng (2022) 19:4320–40. doi:10.3934/mbe.2022200
29. Chen X, Zhou B, Xie H, Miao T, Liu H, Holler W, et al. DuDoSS: Deep-learning-based dual-domain sinogram synthesis from sparsely sampled projections of cardiac SPECT. Med Phys (2023) 50:89–103. doi:10.1002/mp.15958
30. Li S, Peng L, Li F, Liang Z. Low-dose sinogram restoration enabled by conditional GAN with cross-domain regularization in SPECT imaging. Math Biosci Eng (2023) 20:9728–58. doi:10.3934/mbe.2023427
31. Chen H, Zhang Y, Kalra MK, Lin F, Chen Y, Liao P, et al. Low-Dose CT with a residual encoder-decoder convolutional neural network. IEEE Trans Med Imaging (2017) 36:2524–35. doi:10.1109/TMI.2017.2715284
32. Zhang Z, Liang X, Dong X, Xie Y, Cao G. A sparse-view CT reconstruction method based on combination of DenseNet and deconvolution. IEEE Trans Med Imaging (2018) 37:1407–17. doi:10.1109/TMI.2018.2823338
33. Sano A, Nishio T, Masuda T, Karasawa K. Denoising PET images for proton therapy using a residual U-net. Biomed Phys Eng Express (2021) 7:025014. doi:10.1088/2057-1976/abe33c
34. Ronneberger O, Fischer P, Brox T, U-net: Convolutional networks for biomedical image segmentation, In Proceeding of the 18th International Conference on Medical Image Computing and Computer-Assisted Intervention (MICCAI); 5-9 October 2015; Munich, Germany (2015) 234–41. doi:10.1007/978-3-319-24574-4_28
35. Goodfellow IJ, Pouget-Abadie J, Mirza M, Xu B, Warde-Farley D, Ozair S, et al. Generative adversarial nets. In: Proceeding of the 27th Conference on Neural Information Processing Systems (NIPS); 8-13 December 2014; Montreal, QC, Canada. Cambridge: MIT Press (2014). p. 2672–80. doi:10.1145/3422622
36. Yang QS, Yan PK, Zhang YB, Yu HY, Shi YY, Mou XQ, et al. Low-dose CT image denoising using a generative adversarial network with Wasserstein distance and perceptual loss. IEEE Trans Med Imaging (2018) 37:1348–57. doi:10.1109/tmi.2018.2827462
37. Jiang G, Wei J, Xu Y, He Z, Zeng H, Wu J, et al. Synthesis of mammogram from digital breast tomosynthesis using deep convolutional neural network with gradient guided cGANs. IEEE Trans Med Imaging (2021) 40:2080–91. doi:10.1109/TMI.2021.3071544
38. Xue HZ, Teng YY, Tie CJ, Wan Q, Wu J, Li M, et al. A 3D attention residual encoder-decoder least-square GAN for low-count PET denoising. Nucl Instrum Methods Phys Res Sect A-accel Spectrom Dect Assoc Equip (2020) 983:164638. doi:10.1016/j.nima.2020.164638
39. Shamshad F, Khan S, Zamir SW, Khan MH, Hayat M, Khan FS, et al. Transformers in medical imaging: A survey. Med Image Anal (2023):102802.doi:10.1016/j.media.2023.102802
40. Vaswani A, Shazeer N, Parmar N, Uszkoreit J, Jones L, Gomez AN, et al. Attention is all you need. In: Proceeding of the 31st International Conference on Neural Information Processing Systems (NIPS); 4-9 December 2017; Long Beach, CA, USA. New York: Curran Associates Inc. (2017). p. 5999–6009. doi:10.5555/3295222.3295349
41. Dosovitskiy A, Beyer L, Kolesnikov A, Weissenborn D, Zhai X, Unterthiner T, et al. An image is worth 16x16 words: Transformers for image recognition at scale. In: Proceeding of the 9th International Conference on Learning Representations (ICLR); 3–7 May 2021; Virtual Event, Austria. OpenReview.net (2021). Available at: https://dblp.org/rec/conf/iclr/DosovitskiyB0WZ21 (Accessed August 31, 2022).
42. Liu Z, Lin Y, Cao Y, Hu H, Wei Y, Zhang Z, et al. Swin transformer: Hierarchical vision transformer using shifted windows. In: Proceeding of the 18th IEEE/CVF International Conference on Computer Vision (ICCV); 11-17 October 2021; Virtual, Online, Canada. New York: IEEE (2021). p. 9992–10002. doi:10.1109/ICCV48922.2021.00986
43. Dong X, Bao J, Chen D, Zhang W, Yu N, Yuan L, et al. CSWin transformer: A general vision transformer backbone with cross-shaped windows. In: Proceeding of the IEEE/CVF Conference on Computer Vision and Pattern Recognition (CVPR); 19-24 June 2022; New Orleans, LA, USA (2022). p. 12114–24. doi:10.1109/CVPR52688.2022.01181
44. Chen J, Lu Y, Yu Q, Luo X, Adeli E, Wang Y, et al. (2021), TransUNet: Transformers make strong encoders for medical image segmentation. arXiv preprint. doi:10.48550/arXiv.2102.04306
45. Dai Y, Gao YF, Liu FY. TransMed: Transformers advance multi-modal medical image classification. Diagnostics (2021) 11:1384. doi:10.3390/diagnostics11081384
46. Zhang Z, Yu L, Liang X, Zhao W, TransCT XL, Dual-path transformer for low dose computed tomography. In: Proceeding of the International Conference on Medical Image Computing and Computer Assisted Intervention (MICCAI); September 27-October 1 2021 (2021). p. 55–64. Virtual, Online. doi:10.1007/978-3-030-87231-1_6
47. Luthra A, Sulakhe H, Mittal T, Iyer A, Yadav S. Eformer: Edge enhancement based transformer for medical image denoising (2021). arXiv preprint. Available at:https://arxiv.org/abs/2109.08044 (Accessed August 31, 2022). doi:10.48550/arXiv.2109.08044
48. Wang D, Wu Z, Yu H. TED-Net: Convolution-Free T2T vision transformer-based encoder-decoder dilation network for low-dose CT denoising. In: Proceeding of the 12th International Workshop on Machine Learning in Medical Imaging (MLMI); 27 September 2021 (2021). p. 416–25. Virtual, Online. doi:10.1007/978-3-030-87589-3_43
49. Zhang Y, Liu H, Hu Q. TransFuse: Fusing transformers and CNNs for medical image segmentation. In: Proceeding of the International Conference on Medical Image Computing and Computer Assisted Intervention (MICCAI); September 27-October 1 2021 (2021). p. 14–24. Virtual, Online. doi:10.1007/978-3-030-87193-2_2
50. Krol A, Li S, Shen L, Xu Y. Preconditioned alternating projection algorithms for maximum a posteriori ECT reconstruction. Inverse Probl (2012) 28:115005. doi:10.1088/0266-5611/28/11/115005
51. Isola P, Zhu J-Y, Zhou T, Efros AA. Image-to-image translation with conditional adversarial networks. In: Proceeding of the 30th IEEE/CVF Conference on Computer Vision and Pattern Recognition (CVPR); 21-26 July 2017; Honolulu, HI, USA (2017). p. 5967–76. doi:10.1109/CVPR.2017.632
52. Yu D, Wang H, Chen P, Wei Z. Mixed pooling for convolutional neural networks. In: Proceeding of the 9th International Conference on Rough Sets and Knowledge Technology (RSKT); 24-26 October 2014; Shanghai, China (2014). p. 364–75. doi:10.1007/978-3-319-11740-9_34
53. Woo S, Park J, Lee J-Y, Kweon IS. Cbam: Convolutional block attention module. In: Proceeding of the 15th European Conference on Computer Vision (ECCV); 8-14 September 2018; Munich, Germany (2018). p. 3–19. doi:10.1007/978-3-030-01234-2_1
54. He K, Zhang X, Ren S, Sun J. Identity mappings in deep residual networks. In: 14th European Conference on Computer Vision (ECCV); 3-7 November 2014; Scottsdale, AZ, USA (2016). p. 630–45. doi:10.1007/978-3-319-46493-0_38
55. Hendrycks D, Gimpel K. Gaussian error linear units (GELUs). arXiv preprint (2020). Available at: https://arxiv.org/abs/1606.08415 (Accessed August 31, 2022).doi:10.48550/arXiv.1606.08415
56. Zheng W, Li S, Krol A, Schmidtlein CR, Zeng XY, Xu YS. Sparsity promoting regularization for effective noise suppression in SPECT image reconstruction. Inverse Probl (2019) 35:115011. doi:10.1088/1361-6420/ab23da
57. Li Y-R, Dai D-Q, Shen L. Multiframe super-resolution reconstruction using sparse directional regularization. IEEE Trans Circuits Syst Video Technol (2010) 20:945–56. doi:10.1109/TCSVT.2010.2045908
58. Ljungberg M, Strand S-E, King MA. Monte Carlo calculations in nuclear medicine. In: Applications in diagnostic imaging. Boca Raton: CRC Press (2013). doi:10.1118/1.4869177
59. Segars WP, Sturgeon G, Mendonca S, Grimes J, Tsui BM. 4D XCAT phantom for multimodality imaging research. Med Phys (2010) 37:4902–15. doi:10.1118/1.3480985
60. Kingma DP, Ba JL. Adam: A method for stochastic optimization. In: Proceeding of the 3rd International Conference on Learning Representations (ICLR); 7-9 May 2015; San Diego, CA, USA (2015). Available at: https://dblp.org/rec/journals/corr/KingmaB14 (Accessed August 31, 2022).
61. Hensel M, Ramsauer H, Unterthiner T, Nessler B, Hochreiter S. GANs trained by a two time-scale update rule converge to a local nash equilibrium. In: Proceeding of the 31st International Conference on Neural Information Processing Systems (NIPS); 4-9 December 2017; Long Beach, CA, US. New York: Curran Associates Inc. (2017). p. 6627–38. doi:10.5555/3295222.3295408
Keywords: low-dose SPECT reconstruction, CGAN, transformer, geometric tight framelet, noise suppression
Citation: Liang Z, Li S, Ma X, Li F and Peng L (2023) High quality low-dose SPECT reconstruction using CGAN-based transformer network with geometric tight framelet. Front. Phys. 11:1162456. doi: 10.3389/fphy.2023.1162456
Received: 09 February 2023; Accepted: 15 May 2023;
Published: 06 June 2023.
Edited by:
Junxin Chen, Dalian University of Technology, ChinaReviewed by:
Zhehui Wang, Los Alamos National Laboratory (DOE), United StatesYao Lu, Sun Yat-sen University, China
Yun Chen, Xiangtan University, China
Copyright © 2023 Liang, Li, Ma, Li and Peng. This is an open-access article distributed under the terms of the Creative Commons Attribution License (CC BY). The use, distribution or reproduction in other forums is permitted, provided the original author(s) and the copyright owner(s) are credited and that the original publication in this journal is cited, in accordance with accepted academic practice. No use, distribution or reproduction is permitted which does not comply with these terms.
*Correspondence: Xiangyuan Ma, bWF4aWFuZ3l1YW5Ac3R1LmVkdS5jbg==
†These authors have contributed equally to this work