- 1School of Automation and Information Engineering, Xi’an University of Technology, Xi’an, China
- 2Shaanxi Key Laboratory of Complex System Control and Intelligent Information Processing, Xi’an University of Technology, Xi’an, China
Most of the existing studies on the improvement of entropy are based on the theory of single entropy, ignoring the relationship between one entropy and another. Inspired by the synergistic relationship between bubble entropy (BE) and permutation entropy (PE), which has been pointed out by previous authors, this paper aims to explore the relationship between bubble entropy and dispersion entropy. Since dispersion entropy outperforms permutation entropy in many aspects, it provides better stability and enhances the computational efficiency of permutation entropy. We also speculate that there should be potential synergy between dispersion entropy and bubble entropy. Through experiments, we demonstrated the synergistic complementarity between BE and DE and proposed a double feature extraction method based on BE and DE. For the single feature extraction experiment, dispersion entropy and bubble entropy have better recognition performance for sea state signals and bearing signals, respectively; in double feature extraction, the combination of bubble entropy and dispersion entropy makes the recognition rate of sea state signals increase by 10.5% and the recognition rate of bearing signals reach 99.5%.
1 Introduction
In the field of non-linear dynamics, it is important to study about the feature of complexity, which characterizes the complexity of the signal from a physical point of view [1, 2]. In fact, the existing time-domain and frequency-domain analysis techniques are applicable to periodic stationary signals and linear signals. However, for complex non-linear signals, the traditional methods cannot well reflect the non-linear characteristics and implied information. For time series, entropy and Lempel–Ziv complexity and other non-linear dynamic indexes are used as an evaluation criterion for signal complexity [3–10], among which the development of entropy is the most mature.
The entropy theory has been developed to date with a variety of characterizations in different forms. In 2002, Bandt et al. [11] first proposed the permutation entropy theory, which can represent the complexity of the permutation order of a one-dimensional time series with suitable parameters [12]. However, PE does not consider the relationship between individual magnitudes in a time series and thus has limitations for the analysis of the time series [13]. Based on the original theory of PE, many scholars have studied various improvements, such as the proposed weighted-permutation entropy as a complexity measure for time series incorporating amplitude information [14], reverse permutation entropy as a method to identify different sleep stages by using electroencephalogram data [15], and multiscale permutation entropy to solve the problem of PE’s inability to fully characterize the dynamics of complex EEG sequences [16] as well as refined composite processing based on multiscale cases [17].
In 2016, Mostafa Rostaghi and Hamed Azami [18] proposed dispersion entropy, an algorithm that overcomes the deficiencies of PE and provides better stability and increased computational efficiency. By processing the steps on the original DE algorithm accordingly, scholars have proposed refined composite multiscale dispersion entropy that is similar to refined composite multiscale permutation entropy [19], fluctuation-based dispersion entropy as a measure to deal with only the fluctuations of time series [20], reverse dispersion entropy as a new complexity measure for sensor signals [21], and hierarchical dispersion entropy as a new method of fault feature extraction [22].
In 2017, George Manis et al. [23] first proposed a new time series complexity metric, bubble entropy, which is an entropy with almost no parameters, and the algorithm is extensive by creating a more coarse-grained distribution through a sorting process that better reduces the impact of parameter selection.
Research on improvement and optimization based on a single entropy is more common, often adding weight, reverse, multiscale, refined composite, fluctuation, and other operations to the original entropy. Conversely, some scholars proposed new theories based on the combination of the core of a single primitive entropy approach; for example, permuted distribution entropy is the combination of PE and distribution entropy [24], fuzzy dispersion entropy is inspired by fuzzy entropy (FE) and DE [25], fractional order fuzzy dispersion entropy is proposed to introduce fractional order calculation and fuzzy membership function [26].
However, few people study the relationship between one entropy and another. David Cuesta-Frau and Borja Vargas studied the synergistic relationship between BE and PE in 2019 [27], and if DE is the improvement of PE, then BE and DE may also have a synergistic and complementary relationship with each other. Therefore, this paper proposed a double feature extraction method based on BE and DE and applied it to the sea state signal in the field of hydro-acoustics and the bearing signal for fault diagnosis.
The remainder of the paper is organized as follows: Section 2 describes detailed algorithm theories of BE and DE; Section 3 indicates the theoretical logic of BE, PE, DE, and FE and process of the proposed feature extraction method; Section 4 conducts the single feature extraction experiments of sea state signals and bearing signals; Section 5 performs the double feature extraction experiments of the same practical signals with different combinations, as well as carries out the analysis and comparison of experimental results; and ultimately, Section 6 elaborates the essential conclusion of this paper.
2 BE and DE
2.1 Theory of BE
As an entropy with almost no parameters, the theory of BE is very simple, similar to PE. The algorithm makes the distribution more coarse-grained by sorting, thus better reducing the impact of parameter selection and expanding the limitations of use.
Step 1:. Given that the time series
Step 2:. The
Step 3The probability
Step 3:. The entropy value
Step 4:. The value of
Step 5:. The value of BE is available as follows:
2.2 Theory of DE
DE often appears as the optimization of PE, and its characteristics lie in the mapping process and the selection of the dispersion mode. Compared with PE, this theory provides good stability and increased computational efficiency.
Step 1Given that the time series
where
Step 2 The phase space reconstruction of
step 3 According to Step 1 and Step 2, each element in the component has
3 Algorithm analysis and method proposal
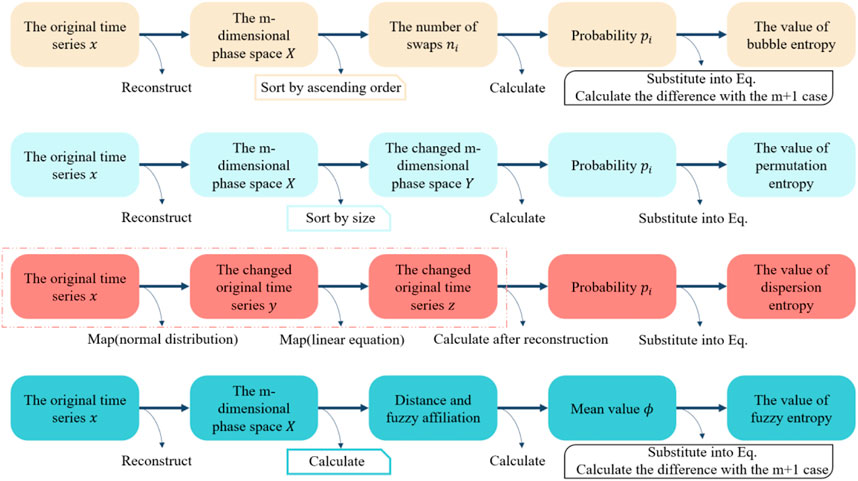
In this paper, four entropies are introduced and applied to sea state signals and bearing signals, each of which has a unique theory and different focus, so the algorithms are also different. Figure 1 briefly describes the theoretical logic of BE, PE, DE, and FE.
For BE, the original time series is first reconstructed to get the m-dimensional phase space, and then the number of swaps is obtained by sorting each vector in ascending order, then the corresponding probabilities are calculated, and finally the value is attained by substituting into the BE-specific formula.
For PE, the original time series is first reconstructed to get the m-dimensional phase space, and then the changed m-dimensional phase space is constructed by sorting each element in each vector according to the value size, then the corresponding probability is calculated, and finally the value is obtained by substituting into the PE-specific formula.
For DE, the original time series is first mapped by the normal distribution function to get the changed time series and then mapped again by using the linear equation to change the time series again. After this step, the m-dimensional phase space is obtained by reconstruction, then the dispersion pattern probability is calculated, and finally the value is obtained by substituting into the DE-specific formula.
For FE, the original time series is first reconstructed to obtain the m-dimensional phase space, then the distance and fuzzy affiliation are calculated, later its mean value is calculated, and finally the value is obtained by substituting into the FE-specific formula.
By comparing the four entropies as a whole, it is obvious that: BE, PE, and FE reconstruct the phase space first and then perform other operations afterward, where BE and PE both get the corresponding results by sorting, while DE is a direct processing of the time series through two mappings before reconstructing the phase space; both BE and FE need to calculate the difference in the
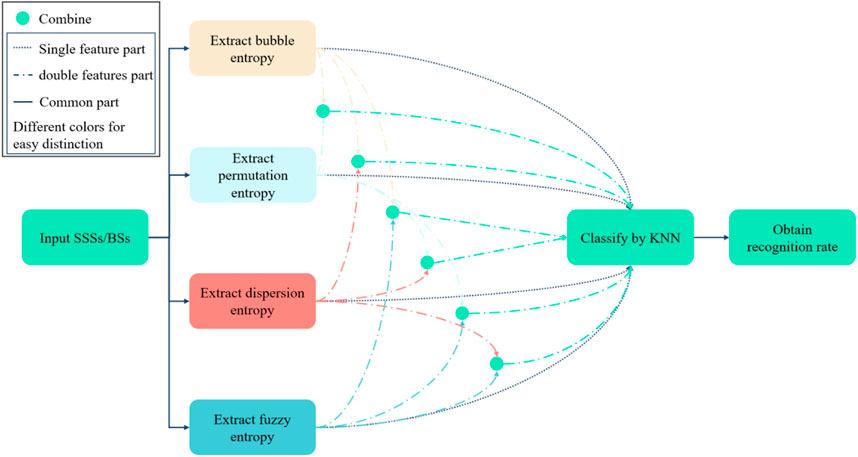
The aforementioned description is the theoretical part of the four entropies, based on which we propose the feature extraction methods of single and double features. Figure 2 provides the flow chart of the feature extraction methods of single and double features taken in this paper.
Based on the analysis and comparison of the algorithm, we apply it to the feature extraction experiment for verification and further research. The feature extraction method includes four main steps:
Step 1:. Diverse types of sea state signals (SSSs) and bearing signals (BSs) are applied as the input of the feature extraction experiment, where the length of each type of sea state or bearing signals is the same with identical sampling points.
Step 2:. For four types of sea state or bearing signals, the values of BE, PE, DE, and FE can be extracted. For double feature extraction, one step needs to be added: the values of BE, PE, DE, and FE are combined two by two, and thus there are six combination forms.
Step 3:. The K-nearest neighbor (KNN) [28] is accepted to classify each type of sea state or bearing signals.
Step 4:. The recognition rate can be attained and employed for the expression of recognition ability.
4 Single feature extraction
4.1 Sea state signals and bearing signals
In this study, four different types of SSS and BS from website1 and website2 are selected for feature extraction and classification recognition in the form of complexity. For SSSs and BSs, the size of sample points is
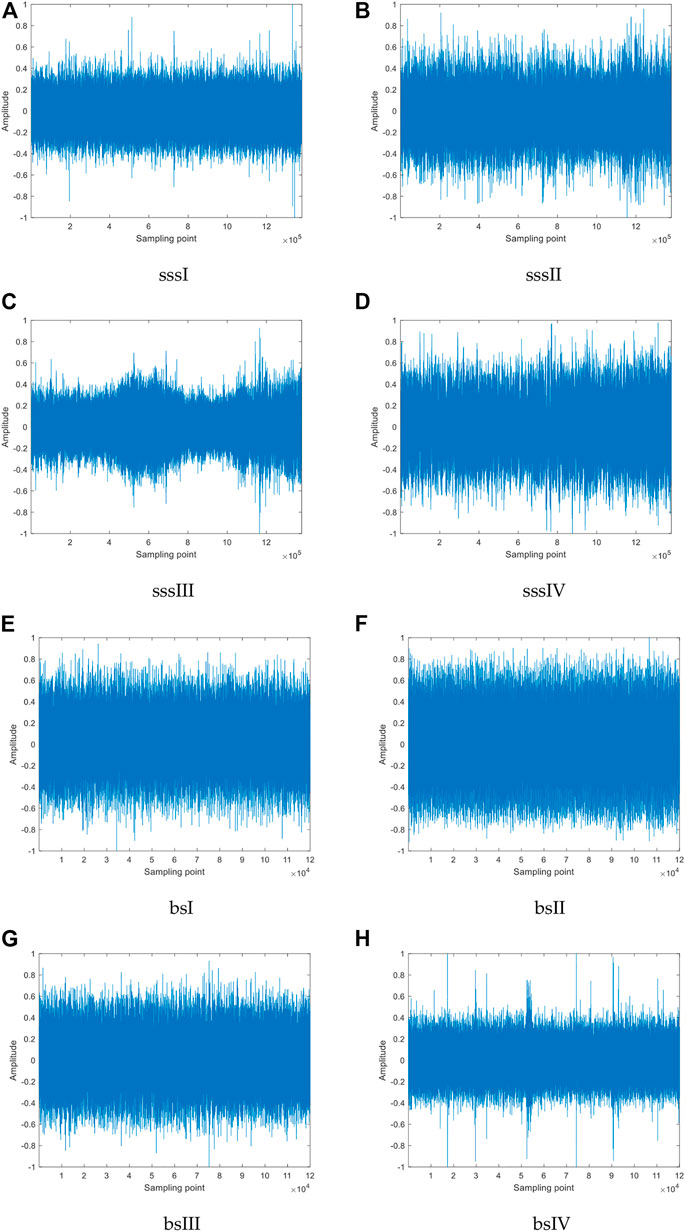
FIGURE 3. Normalized time-domain waveforms of four diverse types of SSSs and BSs: (A) sssI, (B) sssII, (C) sssIII, (D) sssIV, (E) bsI, (F) bsII, (G) bsIII, (H) bsIV.
4.2 Feature extraction
For the 100 samples selected, we introduce BE, PE, DE, and FE and calculate the entropy values as the complexity feature. Table 1 illustrates the parameter settings for each type of entropy.
As can be seen from Table 1, the time delay

FIGURE 4. Distributions of BE, PE, DE, and FE for the selected 100 samples under specific parameter settings: (A–D) Distribution of SSSs, (E–H) Distribution of BSs.
According to the observation in Figure 4, the distributions of different entropies have specificity; for SSSs, DE has better distribution characteristics, and all kinds of signals are almost located in the same line with a small amount of an overlapping phenomenon, while BE and PE have obvious deficiencies in distinguishing sssI and sssIII, as well as sssII and sssIV; for BSs, the distribution of bsII and bsIII are too close to each other for PE, DE, and FE, and even a large mixing occurs, which is obviously not easy to differentiate, while BE overcomes this problem, and there appears only a small number of confusing sample points when differentiating bsIII and bsIV.
4.3 Feature classification and recognition
To further explore the ability of BE, PE, DE, and FE to classify and recognize the four diverse types of SSSs and BSs, KNN was appointed to classify and recognize by taking the first 50 sample points as a training sample set and the rest as a test sample set. Table 2 and Table 3 summarize the feature classification and recognition results obtained for SSSs and BSs separately.
From Table 2 and Table 3, it can be seen that BE, PE, DE, and FE have different numbers of misidentified samples for each type of sea state and bearing signals, meaning that they have specificity in recognizing the four diverse types of SSSs and BSs; as far as the average recognition rate is concerned, the average recognition rate of DE for SSSs is the highest, and that of PE, BE, and FE is in the decreasing trend; for BSs, BE has the best recognition capability, whose average recognition rate reaches up to 92.5%.
In the single feature extraction method, DE and BE have the best classification recognition properties to mine the unique features of different types of signals. Nevertheless, their average recognition rates under single feature still have a lot of room for improvement, especially for DE.
In order to further improve the average recognition rate, we propose to combine BE with other entropies to make full use of their specificity for the recognition of various types of signals, that is, the unique advantages of each other, to form a complementary double feature, so as to optimize the feature extraction method based on BE, which would make the final average recognition rate and the recognition efficiency better.
5 Double feature extraction
5.1 Double feature extraction method based on two-by-two combination
For the sake of the full utilization of specificity, we combine all the entropies mentioned two by two and denote the combination as A&B, where A and B represent any two of the four entropies. For example, BE&DE represents the combined form of BE and DE, and their order does not matter. Therefore, for BE, PE, DE, and FE, there exist six combination forms. Figures 5, 6 list the entropy distribution and classification recognition results for BE&PE, BE&DE, BE&FE, PE&DE, PE&FE, and DE&FE for SSSs and BSs separately.
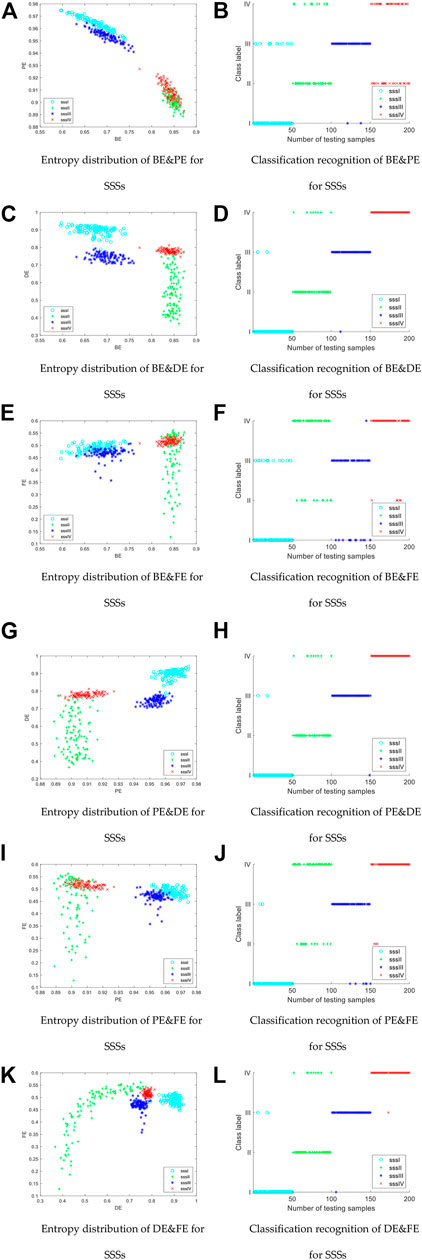
FIGURE 5. Entropy distribution and classification recognition results of BE&PE, BE&DE, BE&FE, PE&DE, PE&FE, and DE&FE of SSSs: distribution of different entropy combinations (Left column); classification recognition results (Right column).
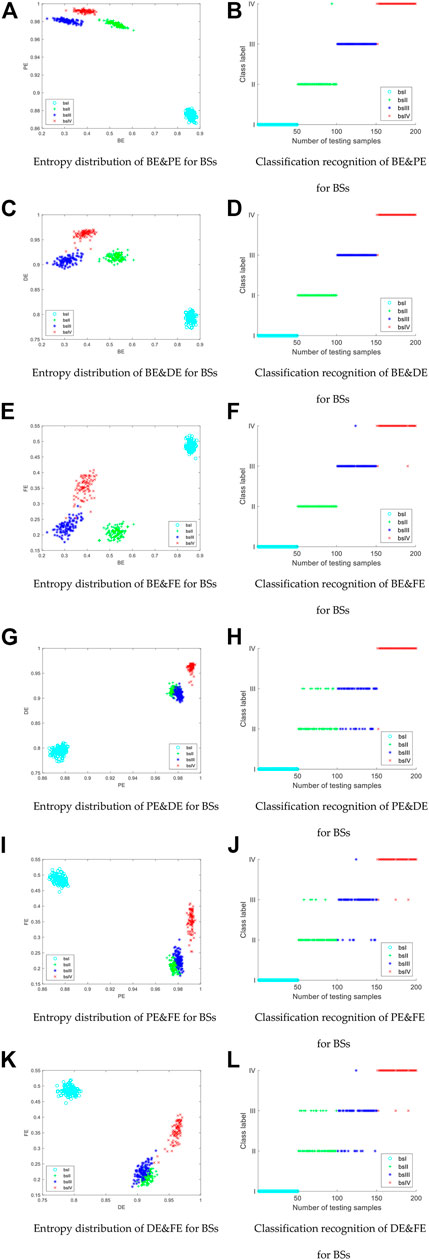
FIGURE 6. Entropy distribution and classification recognition results of BE&PE, BE&DE, BE&FE, PE&DE, PE&FE, and DE&FE of BSs: distribution of different entropy combinations (Left column); classification recognition results (Right column).
Comparing the various combinations shown in Figures 5, 6, we can see that the entropy distributions for SSSs and BSs are different for each type of combination, and therefore have different classification recognition results.
For SSSs, the entropy values between sssI and sssIII as well as between sssII and sssIV are obviously mixed and consequently difficult to distinguish, especially for sssII, which are often misidentified as sssIV. By comparison, it is found that BE&DE has the best recognition rate among all combinations.
For BSs, the entropy distribution of bsI is far from the other signals and is distinguishable, while the misidentification mainly occurs in bsII, bsIII, and bsIV, among which the combination BE&DE has only one sample point misidentification and has an obvious classification advantage.
5.2 Comparison and analysis of the results of single and double feature extraction experiments
For the sake of more intuitively comparing the difference in the average recognition rates under single and double feature extraction methods, Table 4 indicates the average recognition rate of each combination of categories for SSSs and BSs under double features.
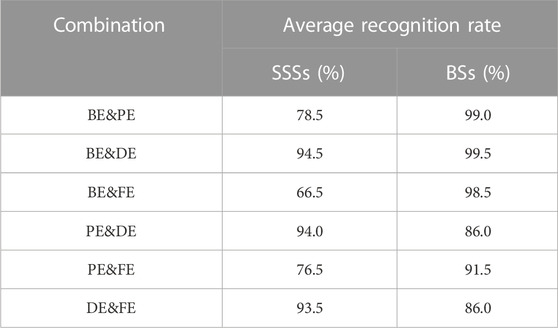
TABLE 4. Average recognition rate of each combination of categories for SSSs and BSs under double features.
In accordance with the information in Table 4, the average recognition rate of the single and double features differed greatly before and after the combination of entropies, compared with Table 2 and Table 3; in the case of double feature extraction, the average recognition rate achieves 94% for all combinations involving DE for SSSs and up to 99% for all combinations involving BE for BSs, which revealed that the initial capability to classify a single feature can be effectively modified by adding BE and DE as another feature; comparing the data in each column of the table confirms that BE&DE has the highest average recognition rate, that is, 94.5% for SSSs and 99.5% for BSs.
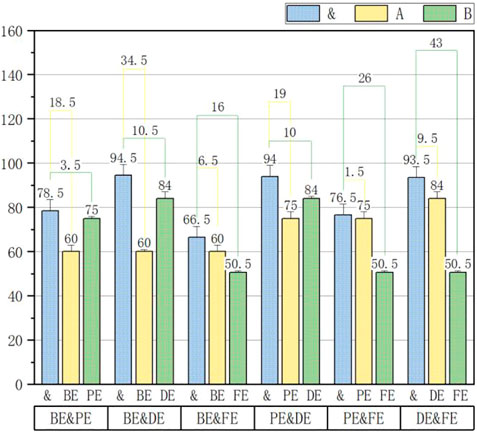
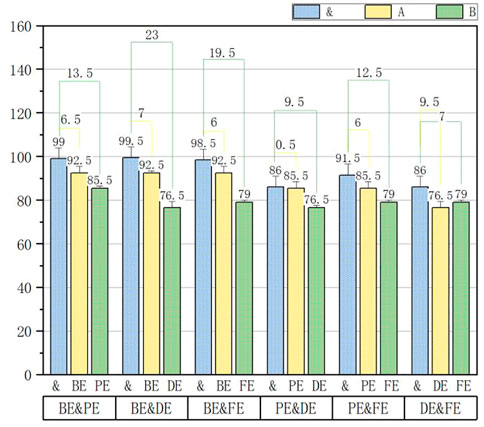
Figures 7, 8 show the average recognition rate and the difference analysis for SSSs and BSs, respectively. In the legend, & represents the combination, while A and B represent two of the four entropies, as described previously.
It is obvious from the aforementioned figures that the original recognition ability is improved by adding another feature. For SSSs, DE has the best recognition ability when used as a single feature and BE has a very poor recognition ability of 60%, while the combination of both achieves the highest recognition effect of 94.5%. For BSs, the situation is the opposite: BE is the entropy with the highest average recognition rate in the single feature extraction, while DE just has the lowest average recognition rate among the four entropies mentioned in this paper, but the combination of both can even reach 99.5%.
Generally speaking, combining two entropies with the highest average recognition rate and the second highest average recognition rate in single feature extraction should have a stronger combination to yield the highest final recognition rate, but for both SSSs and BSs, BE&DE has the best recognition rate, which implies that there is some synergy between BE and DE that can promote and improve each other.
6 Conclusion
In this study, we proposed BE&DE as a double feature extraction method based on the potential synergistic complementarity between BE and DE and applied it to the sea state signal in the field of hydro-acoustics and the bearing signal for fault diagnosis. The main conclusions drawn from this paper are as follows:
(1) Through the comparison and analysis of the algorithms, it can be seen that the essential difference between DE and BE is that DE makes use of the mapping relationship, while BE utilizes the number of exchanges to construct the vector, so it is speculated that there may be an assisting role between BE and DE.
(2) For sea state signals, DE has significant superiority, and for bearing signals, BE has better recognition performance. For different practical signals, different methods are applied in different suitable areas, but DE and BE are more effective compared to PE and FE.
(3) Based on the synergistic and complementary relationship between BE and DE, we proposed the combination form BE&DE and experimentally verified that the method possesses the best efficiency of signal classification and recognition.
Data availability statement
Publicly available datasets were analyzed in this study. These data can be found at: Sea state signal: https://www.nps.gov/glba/learn/nature/soundclips.htm. Bearing signal: https://engineering.case.edu/bearingdatacenter/download-data-file.
Author contributions
YY provided experimental ideas and financial support. XJ completed the experiment and wrote the article. JW was responsible for the revision of the article. All authors contributed to the article and approved the submitted version.
Funding
The research was supported by the Key Research and Development Plan of Shaanxi Province (2020ZDLGY06-01), Key Scientific Research Project of Education Department of Shaanxi Province (21JY033), and Science and Technology Plan of University Service Enterprise of Xi’an (2020KJRC0087).
Conflict of interest
The authors declare that the research was conducted in the absence of any commercial or financial relationships that could be construed as a potential conflict of interest.
Publisher’s note
All claims expressed in this article are solely those of the authors and do not necessarily represent those of their affiliated organizations, or those of the publisher, the editors, and the reviewers. Any product that may be evaluated in this article, or claim that may be made by its manufacturer, is not guaranteed or endorsed by the publisher.
Footnotes
1[Online]. Available: https://www.nps.gov/glba/learn/nature/soundclips.htm.
2[Online]. Available: http://csegroups.case.edu/bearingdatacenter/pages/download-data-file.
References
1. Berger A, Della Pietra SA, Della Pietra VJ. A maximum entropy approach to natural language processing. Comput linguistics (1996) 22:39–71.
2. Thuraisingham RA. Examining nonlinearity using complexity and entropy. Chaos (2019) 29:063109. doi:10.1063/1.5096903
3. Martyushev LM, Seleznev VD. Maximum entropy production principle in physics, chemistry and biology. Phys Rep (2006) 426:1–45. doi:10.1016/j.physrep.2005.12.001
4. Rajaram R, Castellani B. An entropy based measure for comparing distributions of complexity. Physica A (2016) 453:35–43. doi:10.1016/j.physa.2016.02.007
5. Li Y, Tang B, Yi Y. A novel complexity-based mode feature representation for feature extraction of ship-radiated noise using VMD and slope entropy. Appl Acoust (2022) 196:108899. doi:10.1016/j.apacoust.2022.108899
6. Li Y, Gao P, Tang B, Yi Y, Zhang J. Double feature extraction method of ship-radiated noise signal based on slope entropy and permutation entropy. Entropy (2022) 24(1):22. doi:10.3390/e24010022
7. Li Y, Geng B, Jiao S. Dispersion entropy-based Lempel-Ziv complexity: A new metric for signal analysis. Chaos, Solitons Fractals (2022) 161:112400. doi:10.1016/j.chaos.2022.112400
8. Yi Y, Li Y, Wu J. Multi-scale permutation Lempel-Ziv complexity and its application in feature extraction for Ship-radiated noise. Front Mar Sci (2022) 9:1047332. doi:10.3389/fmars.2022.1047332
9. Li Y, Jiao S, Geng B. Refined composite multiscale fluctuation-based dispersion Lempel–Ziv complexity for signal analysis. ISA Trans (2023) 133:273–84. doi:10.1016/j.isatra.2022.06.040
10. Li Y, Geng B, Tang B. Simplified coded dispersion entropy: A nonlinear metric for signal analysis. Nonlinear Dyn (2023). doi:10.1007/s11071-023-08339-4
11. Bandt C, Pompe B. Permutation entropy: A natural complexity measure for time series. Phys Rev Lett (2002) 88:174102. doi:10.1103/physrevlett.88.174102
12. Myers A, Khasawneh FA. On the automatic parameter selection for permutation entropy. Chaos (2020) 30:033130. doi:10.1063/1.5111719
13. Chen Z, Li Y, Liang H, Yu J. Improved permutation entropy for measuring complexity of time series under noisy condition. Complexity (2019) 2019:1–12. doi:10.1155/2019/1403829
14. Fadlallah B, Chen B, Keil A, Principe J. Weighted-permutation entropy: A complexity measure for time series incorporating amplitude information. Phys Rev E (2013) 87:022911. doi:10.1103/physreve.87.022911
15. Bandt C. A new kind of permutation entropy used to classify sleep stages from invisible EEG microstructure. Entropy (2017) 19:197. doi:10.3390/e19050197
16. Li D, Li X, Liang Z, Voss LJ, Sleigh JW. Multiscale permutation entropy analysis of EEG recordings during sevoflurane anesthesia. J Neural Eng (2010) 7:046010. doi:10.1088/1741-2560/7/4/046010
17. Humeau-Heurtier A, Wu CW, Wu SD. Refined composite multiscale permutation entropy to overcome multiscale permutation entropy length dependence. IEEE Signal Processing Letters (2015) 22:2364–7. doi:10.1109/lsp.2015.2482603
18. Rostaghi M, Azami H. Dispersion entropy: A measure for time-series analysis. IEEE Signal Process. Lett (2016) 23:610–4. doi:10.1109/lsp.2016.2542881
19. Azami H, Rostaghi M, Abásolo D, Escudero J. Refined composite multiscale dispersion entropy and its application to biomedical signals. IEEE Trans Biomed Eng (2017) 64:2872–9. doi:10.1109/TBME.2017.2679136
20. Azami H, Escudero J. Amplitude-and fluctuation-based dispersion entropy. Entropy (2018) 20:210. doi:10.3390/e20030210
21. Li Y, Gao X, Wang L. Reverse dispersion entropy: A new complexity measure for sensor signal. Sensors (2019) 19:5203. doi:10.3390/s19235203
22. Chen P, Zhao X, Jiang HM. A new method of fault feature extraction based on hierarchical dispersion entropy. Shock and Vibration (2021) 2021:1–11. doi:10.1155/2021/8824901
23. Manis G, Aktaruzzaman MD, Sassi R. Bubble entropy: An entropy almost free of parameters. IEEE Trans Biomed Eng (2017) 64:2711–8. doi:10.1109/TBME.2017.2664105
24. Dai Y, He J, Wu Y, Chen S, Shang P. Generalized entropy plane based on permutation entropy and distribution entropy analysis for complex time series. Physica A (2019) 520:217–31. doi:10.1016/j.physa.2019.01.017
25. Rostaghi M, Khatibi MM, Ashory MR, Azami H. Fuzzy dispersion entropy: A nonlinear measure for signal analysis. IEEE Trans Fuzzy Syst (2021) 30:3785–96. doi:10.1109/tfuzz.2021.3128957
26. Li Y, Tang B, Geng B, Jiao S. Fractional order fuzzy dispersion entropy and its application in bearing fault diagnosis. Fractal and Fractional (2022) 6(10):544. doi:10.3390/fractalfract6100544
27. Cuesta Frau D, Vargas-Rojo B. Permutation Entropy and Bubble Entropy: Possible interactions and synergies between order and sorting relations. Math Biosciences Eng (2020) 17:1637–58. doi:10.3934/mbe.2020086
Keywords: bubble entropy, permutation entropy, dispersion entropy, synergistic complementarity, feature extraction, sea state signals, bearing signals
Citation: Jiang X, Yi Y and Wu J (2023) Analysis of the synergistic complementarity between bubble entropy and dispersion entropy in the application of feature extraction. Front. Phys. 11:1163767. doi: 10.3389/fphy.2023.1163767
Received: 11 February 2023; Accepted: 03 March 2023;
Published: 31 March 2023.
Edited by:
Govind Vashishtha, Sant Longowal Institute of Engineering and Technology, IndiaReviewed by:
Ke Qu, Guangdong Ocean University, ChinaGuanni Ji, Xi’an Traffic Engineering Institute, China
Copyright © 2023 Jiang, Yi and Wu. This is an open-access article distributed under the terms of the Creative Commons Attribution License (CC BY). The use, distribution or reproduction in other forums is permitted, provided the original author(s) and the copyright owner(s) are credited and that the original publication in this journal is cited, in accordance with accepted academic practice. No use, distribution or reproduction is permitted which does not comply with these terms.
*Correspondence: Yingmin Yi, eWl5bUB4YXV0LmVkdS5jbg==
 Xinru Jiang1
 Junxian Wu