 Mark H. Cunningham
 David L. Frost*
- Department of Mechanical Engineering, McGill University, Montreal, QC, Canada
The influence of an ambient fluid flow on the fragmentation of hot molten tin droplets (initially at 800°C) and cold low melting point alloy droplets (initially at 70°C) in water is investigated with high-speed photography and flash radiography. The water is accelerated using a converging nozzle to a constant speed of up to 30 m/s using a double piston arrangement designed to eliminate the formation of a shock wave that is present in most earlier studies. At low flow velocities, the fragmentation of hot droplets is governed by thermal effects and vapour formation, growth, and collapse. At high flow velocities, vapour formation is suppressed and the droplet fragmentation is determined by hydrodynamic effects in which hydrodynamic instabilities (Rayleigh-Taylor and Kelvin-Helmholtz) and wavecrest stripping all play a role in the droplet breakup. At intermediate flow velocities, both thermal and hydrodynamic effects play a role. Quantitative image analysis of the radiographs is used to determine the spatial distribution of the droplet mass during the fragmentation process. Comparison with earlier work in which the ambient flow is preceded by a strong shock wave indicates that the transition from thermal to hydrodynamic breakup is strongly dependent on the pressure field.
1 Introduction
If a liquid droplet is suddenly accelerated by the differential velocity of an ambient fluid, the droplet will deform and eventually break up into smaller droplets if the relative velocity is sufficient. In the field of atomization, this is often denoted secondary atomization to distinguish it from the primary breakup of a bulk liquid to form filaments and large droplets [1]. The rate of droplet fragmentation is primarily governed by the Weber number, or ratio of inertial to surface tension forces. If the Weber number is based on the original droplet diameter d, it is defined as follows:
where ρ is the density, U is the relative convective flow velocity between the droplet and the ambient fluid, σ is the droplet surface tension, and the subscript c refers to the continuous fluid phase. Alternatively, the droplet breakup can also be related to the Eötvös (or Bond) number, or the ratio of acceleration to surface tension forces, which is given by
where a is the droplet acceleration, and the subscript d refers to the droplet. The Eötvös number can also be shown to be proportional to the product of the Weber number and the droplet drag coefficient [2]. For viscous fluids, the Ohnesorge number (Oh), or ratio of viscous to surface tension forces, i.e.,
where μ is the dynamic viscosity, may also influence the breakup process.
There is a large body of literature on the aerodynamic breakup of liquid drops suddenly introduced into a high-speed airstream or accelerated by the passage of a shock wave in a shock tube (e.g., [1–7], among others). Of particular interest is determining the droplet velocity history, the dependence of the morphology of the droplet breakup on the Weber and Ohnesorge numbers, the time for the droplet to break up, and the size distribution of the fine droplets produced [3]. Various mechanisms play a role in the droplet breakup, including interfacial instabilities and boundary layer stripping. For example, the acceleration of the droplet leads to surface perturbations developing on the upstream droplet surface due to the Rayleigh-Taylor instability which may grow to a sufficient size to penetrate the droplet and cause multiple smaller droplets to form. As the droplet deforms, interfaces parallel to the flow direction develop perturbations due to the Kelvin-Helmholtz instability. Fluid near the surface of the droplet is convected to the droplet equator by the ambient flow and may be stripped off the droplet surface forming fluid filaments that further breakup downstream.
In contrast with droplet breakup in an airstream, there is relatively less information on droplet breakup in liquid-liquid systems comprised of a liquid droplet surrounded by an immiscible liquid. Patel and Theofanous [8] studied the breakup of mercury, gallium, and acetylene tetrabromide droplets accelerated by a shock wave in a hydrodynamic shock tube. Ciccarelli and Frost [9] investigated the breakup of both cold liquid metal droplets and hot molten metal droplets in water accelerated with strong shock waves generated with either an underwater exploding wire or high explosive detonator. Some aspects of droplet breakup in liquid-liquid systems are similar to liquid-gas systems, yet others are different. Pilch and Erdman [3] reviewed previous work on the breakup of mercury and gallium drops in water and concluded that “. . .the magnitude of liquid-liquid system breakup times is comparable to total breakup times for gas-liquid systems.” Gelfand [2] carried out a thorough review of fragmentation in liquid-liquid systems and found that the breakup behaviour in a liquid-liquid system is similar to that of a liquid-gas system with a high initial pressure. However, he also observed that some of the breakup modes observed in liquid-gas systems were not present in liquid-liquid systems.
Much of the work on fragmentation of hot droplets dispersed in a cold continuous fluid has been carried out with molten metal droplets immersed in a coolant such as water. In this case, the presence of vapour surrounding the hot droplet influences the droplet fragmentation process. Destabilization of the vapour film can also lead to an explosive production of vapour. The dynamics of explosive melt-coolant interactions has largely been motivated by the potential severe consequences of such an event following a hypothetical loss-of-coolant accident in a nuclear reactor, although such explosions (also referred to as fuel-coolant-interactions or FCIs in this context, or more generally as vapour, or steam explosions) are also a hazard in the metallurgical and pulp and paper industries and can occur during magma-water interactions (see reviews [10, 11]).
In a typical accident scenario, fragments of melt are dispersed in a coolant and a triggering event leads to the propagation of a coherent interaction through the mixture. In a propagating melt-coolant interaction, the fine fragmentation of the melt governs the rapid increase of interfluid surface area and heat transfer. Previous studies of propagating vapour explosions [12, 13] have shown that the fragmentation mechanisms of single melt drops can be classified into two main groups: thermally-induced mechanisms, driven by vapour film collapse and subsequent bubble dynamics, or hydrodynamic fragmentation mechanisms due to the relative velocity between the melt and coolant. Although much is known about each class of fragmentation mechanism, the transition from thermal to hydrodynamic fragmentation as the ambient flow velocity is increased, which is relevant to the developing phase of a steam explosion, is poorly understood. In addition, the critical ambient flow velocity for which thermal effects are negligible and its dependence on pressure and fluid properties is not known. For melts with small superheats, solidification of the melt may also influence the fragmentation rate [14].
In previous studies on the effect of flow on the fragmentation process, the flow was generated either by the motion of a piston driven by an exploding wire [15], the underwater discharge of an exploding wire or high explosive charge which produces an expanding volume of gas [9], or by the flow behind a shock wave propagating in a water shock tube [16]. In each case the coolant flow is preceded by an underwater shock wave which disturbs the droplet prior to the flow disturbance and may initiate a melt-coolant interaction. The characteristic risetime of the pressure across the shock front is considerably shorter than the risetime associated with the pressure front in a propagating steam explosion in a confined multiphase fuel-coolant mixture. For example, the risetime of the propagating pressure wave in molten tin-water interactions in a confined geometry is typically on the order of 0.1 ms [17]. Therefore, the pressure and flow fields that occur in the above single droplet studies are often not representative of those occurring in propagating interactions in complex melt-coolant mixtures. Hence, care must be taken in extrapolating the fragmentation behaviour observed in single droplet studies to models of propagating interactions.
The present work addresses the breakup of both hot and cold liquid metal droplets in water. The hot molten metal droplets have the added complication of the presence of vapour surrounding the droplets. In this case, the use of flash X-ray radiography is necessary to distinguish the metal droplet from the vapour bubble and to directly visualize the droplet breakup process. The apparatus in the present investigation was designed to eliminate the leading strong shock wave during the acceleration of the coolant. In this way, the role of the ambient flow velocity on the fragmentation process can be studied without the interference of shock wave effects. The present results are particularly relevant to the fragmentation behaviour that occurs during the triggering and escalation phase of a steam explosion. The objective of the present work was to determine how the fragmentation of a single melt droplet changes as the relative velocity between the coolant and melt increases and to identify the possible reasons for the discrepancies between the results of previous work. This was carried out by experimentally studying the breakup of hot tin drops at different coolant velocities and comparing the breakup to that of isothermal liquid metal drops (i.e., at the same temperature as the coolant) at the same velocities, while keeping all other variables constant. A measure of the melt distribution during the fragmentation process was obtained using a quantitative analysis of the radiographs taken at various stages of the process.
2 Experimental
The experimental facility, shown in Figure 1, is designed to investigate the melt-coolant interaction of a single melt droplet initiated by the relative motion between the melt and coolant. The apparatus consists of a test section attached to a water “cannon” used to accelerate the water, and a dump tank containing the melt oven. Inside the oven, which consists of a ceramic crucible and electrical resistive heater, the melt droplet is heated to the desired temperature in an argon gas environment to avoid oxidation. The test droplet is then released from the oven by raising a boron nitride ceramic rod which blocks the central hole in the crucible. When the droplet has reached the viewing windows of the test section, the water cannon rapidly accelerates the water in the test section and drives it at a constant velocity, initiating the melt-coolant interaction. The interaction is recorded using either high-speed photography or flash radiography.
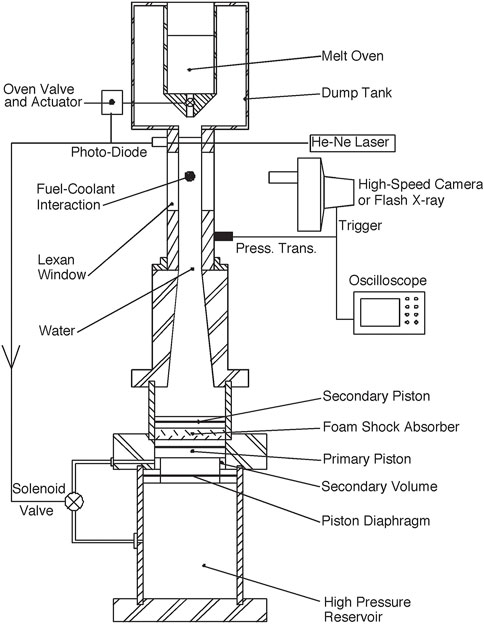
FIGURE 1. Schematic of experimental apparatus.
Tin and a low melting point eutectic alloy commercially called Cerrolow-117 (having a composition of 44.7% bismuth, 22.6% lead, 19.1% indium, 8.3% tin, and 5.3% cadmium) were used as melts for all of the experiments. Cerrolow-117 has a melting point of 47°C, which with a water temperature of 70°C gives test conditions in which the melt remains a liquid throughout the interaction and only hydrodynamic fragmentation is possible.
The test section consists of an aluminum block with a circular inner cross-section 50.8 mm in diameter. Two plane Lexan windows (38 mm wide, 127 mm long, and 25.4 mm thick), are mounted on opposite sides of the test section to provide viewing access. Two light tubes are mounted above the window section to allow a helium-neon laser beam to pass through the test section and across the path of the falling melt drop. A photodiode mounted opposite the laser is used to detect a change in the intensity of the laser light caused by the passage of the drop, providing a signal for triggering the water cannon. A piezoelectric pressure transducer, flush mounted in the test section wall at approximately the location of the melt-coolant interaction, records the transient pressure pulse generated when the flow is accelerated. Two transducers (PCB Piezotronics, NY) with different ranges were used due to the large range in transient pressures generated by the cannon at different velocities (PCB 109A, 10.15 mV/MPa; PCB 113A, 0.716 mV/MPa).
The water cannon was designed to accelerate the water rapidly to a nearly constant velocity. The cannon consists of water and high-pressure gas reservoirs separated by a double piston. The primary piston, with a “T”-shaped cross section, is held in place at its base with a Mylar or steel diaphragm. The diaphragm and piston form a small secondary volume that is sealed off from the gas reservoir using O-rings. Before triggering, only the base of the piston is exposed to the high-pressure reservoir so that the stress on the diaphragm is initially 60%–80% of that required to rupture the diaphragm. Upon triggering, a valve connecting the secondary volume to the gas reservoir is opened, doubling the force on the piston, rupturing the diaphragm and the piston and water are then driven upwards by the high-pressure gas. The water is accelerated into the test section through a conical nozzle, with an inlet:outlet area ratio of 9:1. The use of a double piston separated with foam accelerates the water rapidly and reduces the magnitude of the pressure pulse generated by the firing of the cannon.
Since the velocity in the test section could not be measured during an experiment, it was calibrated against the pressure in the gas reservoir by observing the motion of a neutrally-buoyant piston placed in the test section using high-speed photography. Velocities of 9, 15, 22, and 28 m/s were used. The variability in the velocity calibration was found to be less than 10%. The calibration trials showed that the velocity reached a constant value within a time of between 50 and 150 µs, depending on velocity, which corresponds to approximately 5% of the droplet breakup time. The point at which the velocity reached a constant level was taken as time t = 0, and the coolant velocities were constant over the duration of the droplet breakup.
A Cordin Dynafax rotating-drum 16 mm camera was used to take back-lit photographs at 20,000 frames per second for a maximum duration of 224 frames (∼11 ms). A Scandiflash (Uppsala, Sweden) Model 150 kV flash X-ray system was used to take radiographs of the melt-coolant interactions. The X-ray unit delivered 25 mREM of soft X-rays in a 35 ns pulse. Kodak XAR-5 high-speed X-ray film was used with a Kodak Min-R intensifying screen and cassette. The X-ray head was positioned 50 cm in front of the droplet and the film 6 cm behind the drop. These positions for the head and film gave the best combination of contrast and penetration of the melt. As only one X-ray image could be taken per trial, a number of trials had to be conducted with different time delays in order to obtain a time resolved sequence of radiographs for a given set of initial conditions.
The radiographs were quantitatively analyzed to extract thickness and mass distribution data of the fragmenting drop. The X-ray absorption was calibrated against material thickness by placing a gauge of varying thickness in the field of view of each radiograph. Image analysis was performed on the radiographs to correct for 1) spatial variations in the X-ray intensity, 2) X-ray scattering (the fragmenting droplet and calibration gauges were not located in the same plane and hence their images were affected by different amounts of scattering), and 3) the presence of vapour bubbles. A detailed description of the analysis procedure is given in [18]. Typical results of the analysis are shown in Figure 2, which shows an original X-ray radiograph A), and a contour plot of mass distribution B), in which each of the 5 contours corresponds to 20% of the droplet mass calculated with the lightest and darkest shades corresponding to the mass with the lowest and greatest thickness, respectively. The wavelength of the perturbations that develop on the upstream side of the droplet is indicated by the lines on the radiograph, and corresponds to a value of about 2.5 mm. Also shown in Figure 2 is a plot of the cumulative mass with thickness, calculated after applying the various correction factors. In this example, the mass from the fragmented droplet is distributed over an area such that the thickness of the tin at any point in the image was less than about 1.5 mm.
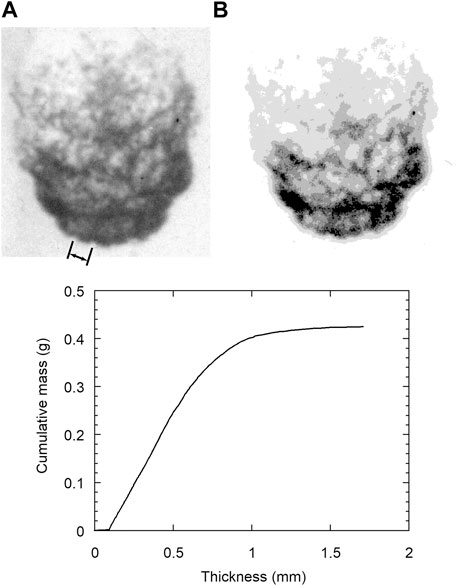
FIGURE 2. Original radiograph of fragmenting tin droplet (A) and contour image (B), with each gray-level corresponding to 20% of mass, after quantitative corrections applied. Plot shows cumulative mass determined from contour image as a function of tin thickness. The wavelength of the perturbations on the upstream surface of the droplet is indicated by the lines in the radiograph and corresponds to a value of about 2.5 mm.
The quantitative analysis of the radiographs showed that the computed total droplet mass was most reliable for tin thicknesses below about 0.5 mm. Above this thickness, the exponential nature of the absorption of X-rays with material thickness, combined with the lack of penetrating power of the X-rays resulted in a small error in the optical density of the image translating into a large error in material thickness. Therefore, at early times where a substantial portion of the droplet had a thickness greater than 0.5 mm, only ∼20% of the original mass could be recovered from the image analysis. At later times when the drops were extensively fragmented, ∼80% of the mass was recovered.
3 Results
Many single droplet experiments were carried out using tin drops initially at 800°C and Cerrolow-117 drops at 70°C. In all cases, the droplet mass was 0.50 ± 0.01 g, the coolant temperature was 70°C ± 2°C, and the temperature of the tin at the time of the interaction was estimated to be ∼700°C, due to cooling of the droplet during free-fall. Experiments were conducted to visualize the droplet fragmentation using high-speed photography for both hot and cold drops with coolant velocities of 9, 15, 22, and 28 m/s. The experiments were then repeated using flash radiography at nondimensional time intervals of ΔT = 0.4 to closely examine the breakup of the droplet with the nondimensional time T given by:
where ρ = density, U = convective flow velocity, t = time, d = droplet diameter, and the subscripts c and d refer to coolant and droplet quantities, respectively. A nondimensional time of one corresponds physically to the time for a droplet to move one droplet diameter when accelerated by the drag force acting on the droplet due to a constant relative flow velocity between the coolant and the drop. With the surface tension for molten tin taken to be 0.524 N/m, the coolant velocities of 9, 15, 22, and 28 m/s tested correspond to Weber numbers of 786, 2184, 4697, and 7609, respectively. The corresponding Weber numbers for the experiments with Cerrolow-117 drops were estimated to be about 4% higher, based on the mass-weighted average surface tension of 0.455 N/m.
3.1 Pressure field
The pressures measured at the time of the interaction at the approximate location of the droplet for the four velocities are shown in Figure 3. For any given velocity, the peak pressures were very consistent, with a variation of only ±15% from trial to trial. In all cases the risetime of the pressure was relatively long and a shock did not form. The shape of the traces was also similar for the four velocity cases, but the magnitudes differed greatly. For trials at 9, 15, and 22 m/s the pressure always remained below the critical pressure of water (i.e., below 22.1 MPa), but at 28 m/s the peak pressure was well above the critical pressure for a duration of T = 0.3. The most significant difference between the trials is that the nondimensional duration of the pressure pulse is greater at the higher velocities than at the lower velocities. This results in the pressure being at elevated levels for almost the complete droplet breakup at 28 m/s, but only for the initial 25% of the breakup time for trials at 9 m/s.
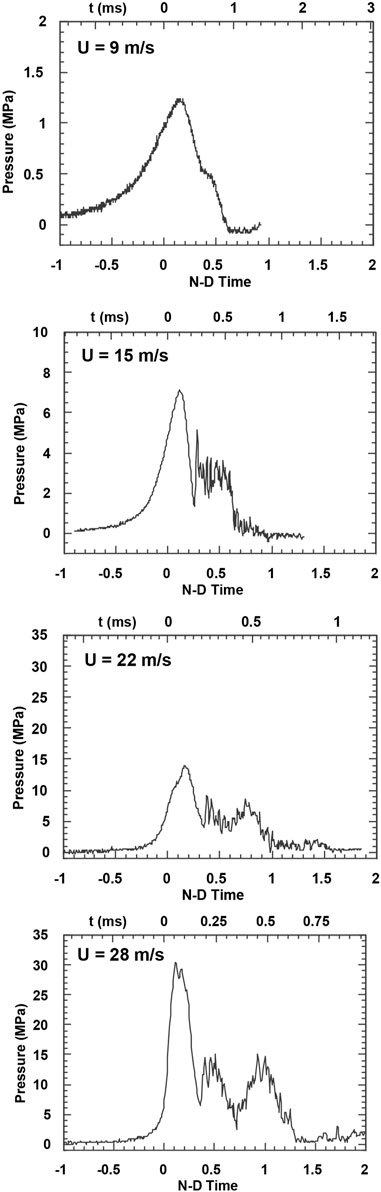
FIGURE 3. Pressure recorded at wall of test section as a function of nondimensional time, T, for four different coolant velocities tested. Dimensional time is indicated on the top axis of each plot.
3.2 Isothermal droplet breakup
For the range of Weber numbers investigated (820–7920), the isothermal Cerrolow-117 drops displayed a similar breakup mechanism at all coolant velocities. Figure 4 shows a selection of radiographs of the breakup of Cerrolow-117 drops for a coolant velocity of 15 m/s (Figures 4A–D) together with several radiographs at higher velocities at later times (Figures 4E, F). Since only one radiograph can be taken at a time, each radiograph in Figure 4 corresponds to a different trial. Overall, the morphology of the droplet breakup was essentially identical at 9 and 15 m/s and at 22 and 28 m/s.
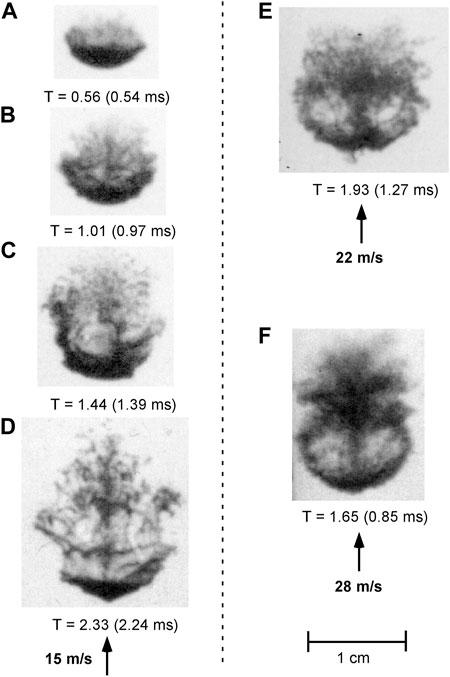
FIGURE 4. Radiographs of fragmenting liquid metal alloy (Cerrolow-117) drops at the same temperature as the surrounding water (70°C) for 3 different water flow velocities. Nondimensional and dimensional times are noted for each radiograph.
As the drops free-fall through the test section prior to triggering of the water cannon, the pressure distribution on the surface causes the drops to assume an initially ellipsoidal shape. Upon initiation of the flow, small fragments are stripped from the droplet surface to create a cloud of fine particles at the leeward side of the droplet (see Figure 4A). These fine fragments are probably created by the stripping of wave crests of small-scale instabilities on the front and side surfaces of the drop. After the initial period of fine fragmentation, larger scale perturbations, with a wavelength on the order of millimeters, form on the front surface of the droplet and are convected towards the equator (see Figures 4B, C). As these surface perturbations are torn away from the parent drop, they form filaments downstream of the droplet in addition to the micromist of fine fragments. As the fragmentation process progresses, the filaments break up into fine fragments and more filaments are drawn off until the parent droplet effectively ceases to exist and all the droplet material is contained in the fragment cloud (Figure 4D). For coolant velocities of 22 and 28 m/s, at late times (T > 1.5), a recirculating flow is evident at the back of the fragmented droplet (see Figures 4E, F) that is not present at the lower velocities.
There is no evidence from the radiographs that the parent droplet experiences the so-called “catastrophic” breakup defined by Pilch and Erdman [3] as the penetration of the droplet by large-amplitude surface waves, which can occur during the breakup of liquid droplets in air at large Weber numbers. The primary fragmentation mechanism is associated with the formation of surface perturbations that are convected to the droplet equator and stripped off. The wavelengths of the perturbations range from 1–4 mm. The physical mechanism for the growth of the perturbations will be addressed later with reference to linearized instability theory.
3.3 Hot droplet breakup
For hot drops, the formation, growth, and, in some cases, the collapse of a vapour bubble play a significant role in the breakup of the melt drop. Figure 5 shows the effect of ambient flow velocity on the bubble growth history for hot tin drops, as determined from high-speed film records. For no ambient flow, the droplet breakup process, after the melt coolant interaction is initiated by a weak shock wave, is dominated by a cycle of bubble growth and collapse [9]. With an ambient flow velocity of 9 m/s, bubble growth and collapse still occurs, but a second bubble growth cycle does not occur. For velocities of 15 m/s and 22 m/s, a vapour bubble forms and grows, but does not collapse. In these cases, the vapour region eventually condenses and disappears. For a flow velocity of 28 m/s, a negligible amount of vapour is formed.

FIGURE 5. Growth of vapour bubble with time for four different coolant velocities. Curve fits for flow velocities of 9 and 15 m/s are second order polynomials whereas curve fits for flow velocities of 0 and 22 m/s are smooth fits through the data points.
Figures 6–8 show X-ray radiographs of the breakup of 0.5 g tin drops at an initial temperature of 800°C for water flow velocities of 9, 15 and 28 m/s, respectively (the results at 22 m/s are not shown since they are similar to those at 28 m/s). Also included in the figures are mass contour plots of the drops developed using the X-ray analysis technique. The contour plots give the mass distribution within the droplet and fragment cloud and reveal details of the droplet breakup not as visible in the original radiographs.
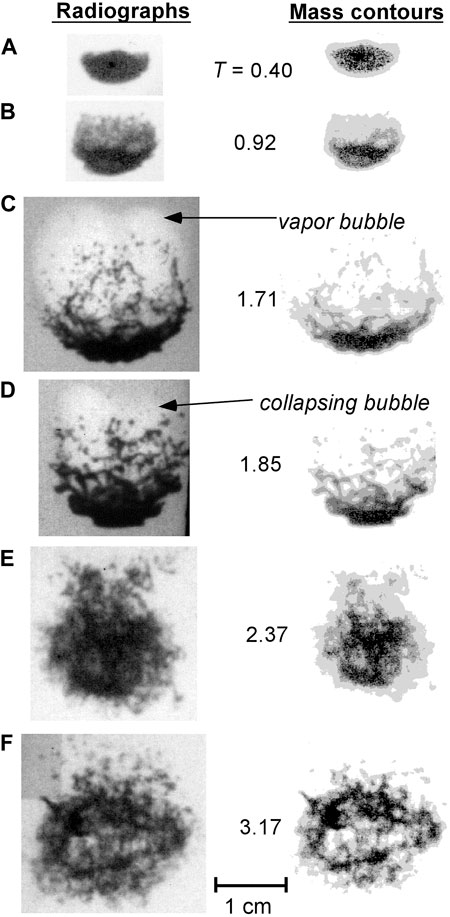
FIGURE 6. Radiographs (left) and corresponding mass contours (right) at various times for tin drops subjected to a 9 m/s water flow. Nondimensional time T is indicated for each image pair. Each image pair is identified with a letter to facilitate reference to a particular image within the text.
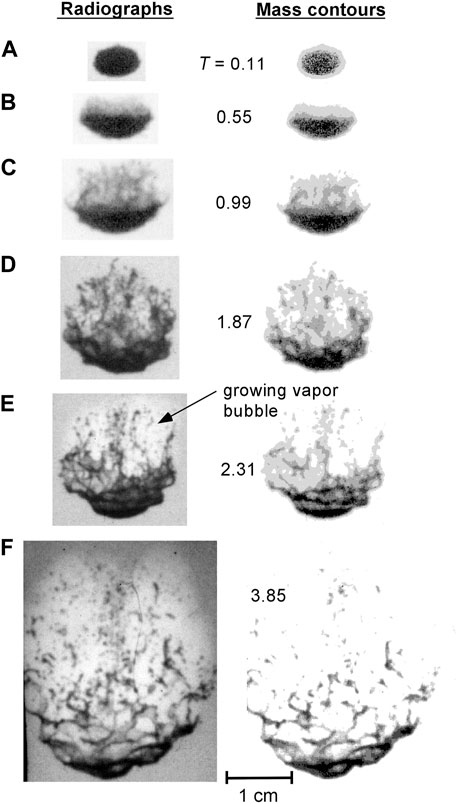
FIGURE 7. Radiographs (left) and corresponding mass contours (right) at various times for tin drops subjected to a 15 m/s water flow. Nondimensional time T is indicated for each image pair. Each image pair is identified with a letter to facilitate reference to a particular image within the text.
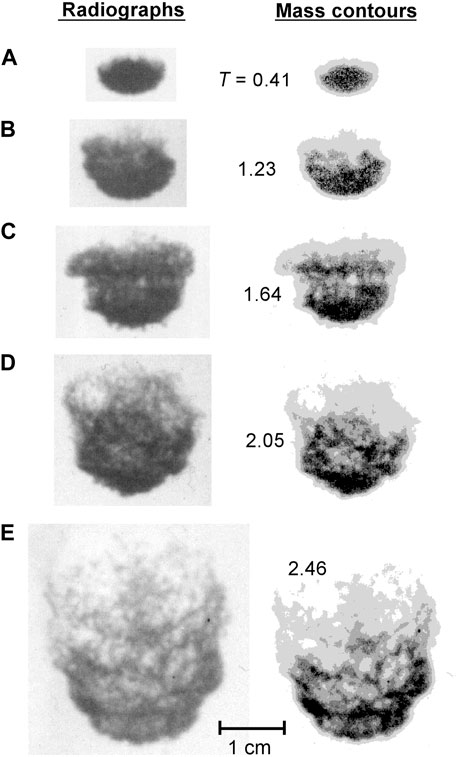
FIGURE 8. Radiographs (left) and corresponding mass contours (right) at various times for tin drops subjected to a 28 m/s water flow. Nondimensional time T is indicated for each image pair. Each image pair is identified with a letter to facilitate reference to a particular image within the text.
It is evident from the figures that for the different velocities, the droplet breakup mechanisms are similar at early times. Up to T = 1.0 the breakup process over the range of velocities is very similar in each case and resembles that of the isothermal droplet trials, i.e., fine fragmentation with the formation of a micromist downstream of the drop. However, at later times the fragmentation mechanisms at the different velocities differ significantly.
Figure 6 shows that for an ambient flow velocity of 9 m/s, after the initial fine fragmentation, a vapour bubble forms downstream of the droplet and reaches a maximum diameter at about T ∼ 1.7 (Figure 6C). The vapour bubble is visible on the high-speed photographs and appears on the radiographs as a lighter region due to the lower X-ray absorption of the water vapour in comparison with liquid water (see Figure 6C). With the expansion of the bubble, the fragments in the cloud are dispersed over a large area and the parent droplet is stretched and elongated. The bubble then collapses, completely fragmenting the remaining coherent pieces of melt and forming a symmetrical fragment cloud (Figure 6E). By T ∼ 3.2 (Figure 6F), the mass contour plot shows that the mass is nearly uniformly distributed throughout the fragment cloud. There is no evidence of the growth of a second bubble from the radiographs or high-speed photographs.
When the coolant velocity is increased to 15 m/s (see Figure 7), after the initial fine hydrodynamic stripping, a bubble also grows in the wake of the droplet (visible, e.g., in Figure 7E) but does not subsequently collapse. As the bubble expands, the fragments in the cloud are dispersed and the remainder of the parent drop, located just upstream of the bubble, is stretched and distorted. Perturbations on the droplet surface grow and break off, forming long horizontal filaments (Figure 7E) which are convected downstream and breakup. This formation of liquid “threads” during droplet fragmentation has been observed by previous investigators [5]. This process continues until the parent droplet is completely broken up. The vapour bubble formed does not collapse and at later times (T > 5), from high-speed photographs, droplet fragments are visible in the water upstream of the front surface of the bubble as the bubble begins to condense. The bubble eventually completely condenses due to the convective cooling from the ambient flow. No further vapour is formed indicating that the majority of the thermal energy of the melt has been transferred to the coolant at this point.
At higher ambient flow velocities, the amount of vapour formed is reduced and at the highest velocity (28 m/s), a negligible amount of vapour forms. In this case (see Figure 8) the breakup mechanism is similar to that for an isothermal drop, although the intense recirculation pattern visible in the droplet wake for cold drops (e.g., Figure 4F) is not evident for the hot drops. The perturbations visible on the upstream surface of the droplet (see Figure 8C) may be evidence of local coolant/melt contacts leading to the ejection of fine melt fragments. In general, for high coolant velocities, a large number of fine fragments are stripped off the parent droplet causing the mass distribution within the fragment zone to be more uniform than at lower velocities (e.g., compare Figure 8D with Figure 7D).
3.4 Fragment distribution: hot drop
The distribution of the melt fragments during the fragmentation of the droplet is strongly dependent on the type of breakup that the melt droplet undergoes. The thickness of the fragmenting drops along the streamwise centre line, shown in Figure 9, illustrates how, over time, the fragmented mass is distributed. Although the thicknesses shown are determined from the analysis of the radiographs and are not numerically accurate for thicknesses above 0.5 mm, the general trends are still valid since the thickness calibration follows the exponential trend of X-ray absorption. The droplet thicknesses have been normalized with the maximum thickness found in each profile to account for any calibration variations between trials.
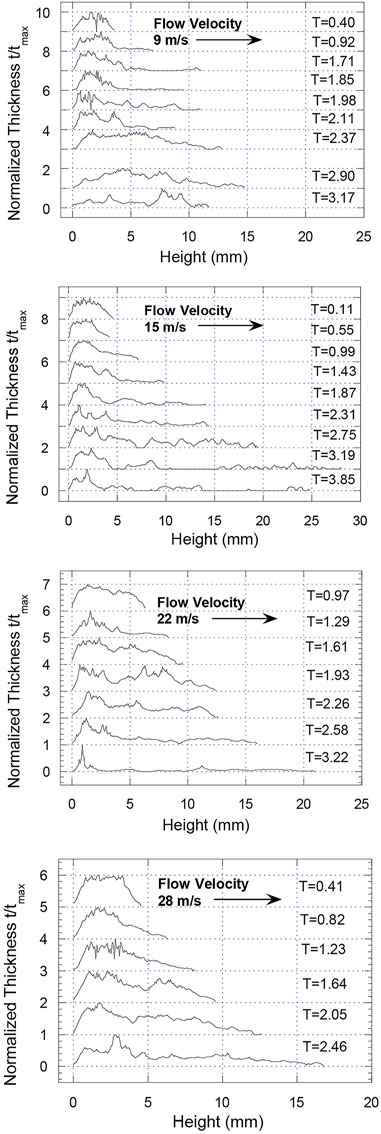
FIGURE 9. Variation of droplet fragment thickness along streamwise centerline from radiographs as a function of time for four ambient flow velocities.
Figure 9 shows that at 9 m/s a long thin fragment cloud forms at the back of the droplet due to the initial hydrodynamic stripping of fine fragments. At T ∼ 2.4 the fragments become more evenly distributed due to the collapse of the vapour bubble and symmetrical dispersion of the droplet fragments. A thin fragment cloud also forms initially for the tests at 15 m/s. However, even at late times, there is a large concentration of fragments at the front of the drop. The parent droplet at the front of the bubble is stretched and breaks up due to the growth of surface perturbations, but the droplet mass is not distributed throughout the bubble. Therefore, even though the projected area of the fragment cloud at 15 m/s has a value four times that at 9 m/s, the fragments are not as well distributed. For coolant velocities of 22 and 28 m/s, fragments are stripped off the parent droplet forming a fragment cloud at the rear of the drop, the thickness of which decreases as it moves away from the drop. This gives a more even distribution of fragments than in the 15 m/s case, but there is still a significant concentration of fragments at the front of the drop, unlike the drops at 9 m/s.
4 Discussion
4.1 Droplet trajectories
Tracking the trajectory of a droplet with high-speed photography can be used to estimate the effective drag coefficient for the drop. The droplet drag influences the acceleration of the droplet and drop/coolant heat transfer and is an important parameter that is required for models of propagating melt-coolant interactions. Figures 10, 11 give the trajectories of isothermal (Cerrolow-117) drops and hot tin drops, respectively, for four different coolant velocities. The droplet displacement (the forward stagnation point is chosen as the reference point), nondimensionalized with the initial droplet diameter, is plotted as a function of nondimensional time. Also shown in Figure 10 are the theoretical displacements for a sphere with drag coefficients of 2.0, 2.5 and 3.0. These trajectories were plotted assuming that the drag force dominates all other forces on the droplet and that the droplet has constant projected area. With these assumptions, the trajectory of the droplet can be determined by integrating a force balance on the droplet giving
where Cd is the drag coefficient and Do is the initial droplet diameter. Although there is some scatter in the results in Figure 10, the average drag coefficient is about 2.5. There is more scatter in the trajectory data for the hot droplet trials. Figure 11 shows that the hot drops initially follow trajectories corresponding to a drag coefficient of about 2, but after T = 2, the effective drag coefficient is closer to unity. This effect is more pronounced at lower velocities, suggesting that the presence of vapour has an influence on the drag coefficient. For the isothermal alloy drops, the average effective drag coefficient of 2.5 is consistent with values reported by earlier investigators [8, 19]. The reduction in drag for the hot drops is analogous to the reduction in drag observed in [20] for hot spheres falling through water while undergoing film boiling as compared to unheated spheres. The reduction in drag is most likely due to the generation of vapour around the droplet which encapsulates the droplet and lowers the shear force on the ambient fluid and hence the droplet drag. Lowering the droplet drag increases the time required for the droplet to be accelerated to the velocity of the ambient liquid. For example, if the drag coefficient is reduced from 2.5 to 1, this time is increased by a factor of 2.5.
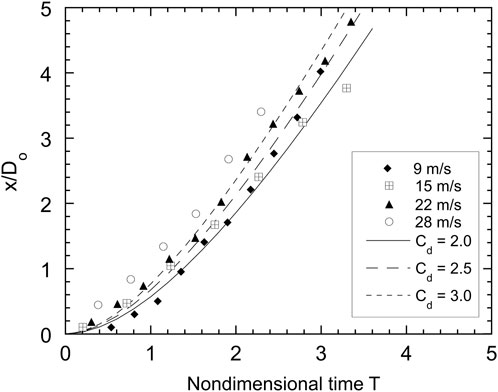
FIGURE 10. Trajectories, normalized with initial droplet diameter Do, of front droplet stagnation point for isothermal Cerrolow-117 drops as a function of nondimensional time.
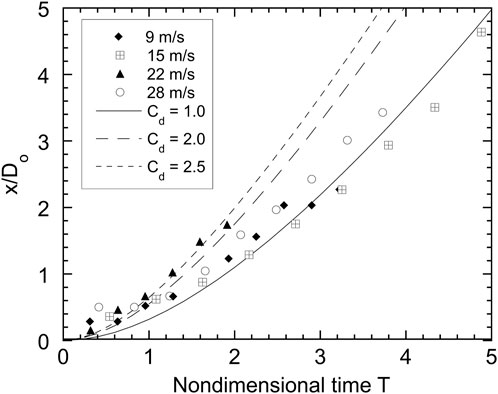
FIGURE 11. Droplet trajectories for hot tin drops as a function of nondimensional time.
4.2 Hydrodynamic instabilities
With the exception of pure thermal fragmentation, the hydrodynamic forces exerted on the melt droplet due to the relative velocity of the melt and coolant play a major role in the breakup of the drop. The hydrodynamic forces not only strip melt fragments from the drop, but also affect the heat transfer from the melt through the formation of fragments and generation of new surface area. The formation and stripping of small- and large-scale perturbations on the droplet surface due to the relative motion between the melt and coolant is the main mechanism for hydrodynamic breakup.
In the initial stages of fragmentation (T ∼ 0–1) for both hot and cold drops, fine particles are produced by wave-crest stripping of small perturbations, forming a cloud of fine fragments behind the drop. These surface perturbations cannot be resolved in the radiographs, but are most likely due to Kelvin-Helmholtz instabilities resulting from the relative flow between the coolant and the drop. From linearized theory, the most rapidly growing wavelength of the Kelvin-Helmholtz instability is on the order of 10−4 m, too small to be resolved visually but consistent with the very fine fragments produced.
After the initial period of fine fragmentation, larger scale perturbations develop on the front surface of the drop. These develop in a similar manner for both the hot and cold drops and at all velocities. Even at later times when vapour bubbles form, since they are located at the back of the droplet their presence does not significantly affect the formation and growth of instabilities. The perturbations are convected along the surface of the droplet towards the equator where they are stripped off, generating large fragments that are subsequently broken up. These large-scale instabilities are due to the Rayleigh-Taylor instability since they first develop on the front surface of the droplet where there is an acceleration from light to heavy fluid. The Rayleigh-Taylor instability of a droplet surface accelerated in an airstream has been extensively documented [5]. In the present liquid/liquid system, it is instructive to consider the predictions of the linear instability theory. If the original analysis of Taylor [21] is modified to include surface tension, then it can be shown that the instability wavelength with the maximum growth rate, λ* is given by (e.g., [22]):
where a is the acceleration of the interface. The above relation applies for instabilities in only one horizontal direction. If both horizontal directions are taken into account, the most dominant wavelength increases by a factor of 2.5 [12].
From the experimental droplet trajectories, the droplet acceleration and hence the most rapidly growing Rayleigh-Taylor wavelengths at the tin-water interface may be estimated for the four coolant velocities studied. Figure 12 compares the predicted instability wavelengths to the estimated wavelengths observed in the radiographs. Figure 2 shows an estimate of the wavelength (in this case about 2.5 mm) of one of the perturbations that develop on the upstream surface of a droplet. There is some subjectivity in the estimate of the wavelengths since radiographs provide a line-of-sight integration of the density field, as well as the resolution of the X-ray film, which is reflected in the error bars in the estimated values. The theoretically dominant wavelength increases with T since, as the droplet is accelerated, the relative velocity between the coolant and melt decreases and hence the acceleration force also decreases.
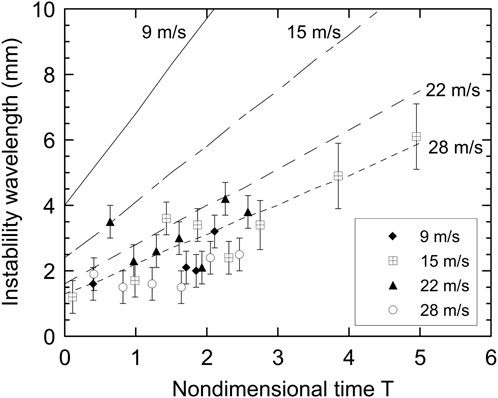
FIGURE 12. Predicted fastest growing wavelengths from linearized Rayleigh-Taylor instability theory (lines) in comparison with the scale of the droplet surface perturbations observed from radiographs (points) as a function of nondimensional time.
There is no trend of increasing wavelength with decreasing velocity in the experimental data, as predicted by theory. Since at the lower velocities the predicted dominant wavelengths are on the order of the droplet diameter, they cannot develop, and the wavelengths observed will be lower than predicted. At velocities of 22 and 28 m/s the theoretical instability wavelengths are smaller than the droplet diameter and are close to the observed values. In addition, the observed values of the wavelength increase with time in a manner similar to that predicted by the linearized theory. This agreement between theoretical estimates of wavelengths and the observed values provides evidence that the perturbations do grow initially as Rayleigh-Taylor instabilities.
As the perturbations are convected towards the equator, they grow in amplitude and wavelength. The predicted e-folding time (time in which the amplitude grows by a factor of e) for a 1.6 mm perturbation is T = 0.2 and for a 4 mm perturbation is T = 0.46. The high-speed photographs show that it takes T ∼ 1 for a perturbation on the front surface to be convected to the equator, and that the amplitude grows by a factor of two, less than the predicted factor of e2 ∼ 7.4 for a 4 mm perturbation. This will be partly due to the fact that as the perturbations are convected to the side of the drop, they are exposed only to a small component of the acceleration normal to the interface. Secondly, as the wavelengths and amplitudes become large, the perturbations depart from the ideal assumptions of a semi-infinite fluid. Finally, once the perturbations are convected to the side of the drop, effects due to the relative velocity may be stronger than the acceleration forces, making the perturbations subject to the Kelvin-Helmholtz instability.
In the case of hydrodynamic fragmentation, the formation and stripping of surface perturbations continues until the droplet is essentially completely broken up. This mode of fragmentation accounts for a large part of the droplet break-up, while the remainder of the droplet is broken up due to small-scale wave crest stripping that occurs during the entire fragmentation period. In the transition regime, the stripping continues until the effects of the vapour bubble growth and collapse dominate the fragmentation process.
This mechanism of instabilities developing and being stripped at the equator is similar in concept to the model proposed in [13] in which wave rings around the axis of the droplet in the flow direction, are stripped as they travel towards the equator of the drop. The main difference between the model and the experimental observations is the type of instability that is dominant. The model assumes that the wavelengths of the instabilities are based on modified Kelvin-Helmholtz theory while the experiments show that the instabilities, initiated at the front surface, have wavelengths closer to those predicted by Rayleigh-Taylor theory. Therefore, a model which uses the methods of Burger et al. [13] but estimates the initial wavelengths of the disturbances using Rayleigh-Taylor theory would be closer to the observations.
4.3 Breakup time
Although the development of perturbations on the front surface of the droplet is governed by the Rayleigh-Taylor instability, and which are then convected laterally and stripped off the droplet, it is not possible to determine analytically the total time for the droplet to break up. In the past, different definitions have been used to determine the breakup time for the droplet from experimental data due to the difficulty in interpreting visual images. Breakup time has often been estimated from shadowgraph images, although this can be misleading since the mist of fine particles that is generated and swept downstream can appear opaque causing the droplet to appear larger than in reality.
In the present investigation, three criteria were used to define at what point the melt drops were broken up: 1) quadrupling of the initial projected area, 2) doubling of the initial diameter perpendicular to the flow direction and 3) a visual interpretation of the radiographs. The reference area and diameter were taken to be that of an initially spherical droplet. The breakup times based on the area and diameter criteria were determined by plotting the area and diameter of the cloud of droplets and then linearly interpolating to the times corresponding to a quadrupling of the area and doubling of the diameter, respectively. Although radiographs provide a more quantitative visualization of the spatial distribution of the mass stripped from the droplet in comparison with a shadowgraph image, there is still some subjectivity in determining the total breakup time from the radiographs. As the droplet is accelerated to the same velocity as the water, a portion of the original droplet may survive the fragmentation process. The visual breakup times are an estimate of when the parent droplet largely ceases to exist based on a visual inspection of the radiographs, or only a small amount (less than 10%) of the original droplet mass remains intact. Figure 13 shows the nondimensional breakup time (Tb) as a function of Weber number for the cold droplet tests using the various criteria. The average breakup times were 1.8 for the diameter criterion and 1.0 for the area criterion. The area criterion appears to underpredict the breakup time since the radiographs show that at T = 1.0 a parent droplet is still present. The visual breakup times vary from about 1.5 to 3.5.
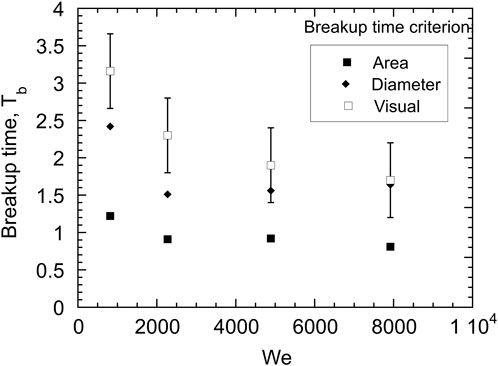
FIGURE 13. Variation of breakup times as a function of Weber number for isothermal Cerrolow-117 drops with various breakup time criteria.
In previous work, Ciccarelli and Frost [9] reported a breakup time of 2 for Cerrolow-117 droplets and Kim et al. [23] gave a range of 3.5 < Tb < 6.6 for the breakup of gallium drops based on the interpretation of high-speed photographs and Tb ∼ 2 for the quadrupling of the projected area. Considering the large amount of subjectivity in determining the complete breakup time, the values determined in the present investigation are consistent with those reported previously. In the past, some researchers have found a weak dependence of breakup time on Weber number (although Kim et al. [23] found no dependence on We). If the fragmentation mechanism is dominated by Rayleigh-Taylor instabilities, Patel and Theofanous [8] have shown that the breakup time should scale with We−1/4. Given the error in estimating the total breakup time from visual inspection of the radiographs shown in Figure 13, the present results cannot be used to support the validity of this scaling law. Furthermore, the change in the flow pattern at higher water velocities (i.e., the presence of a recirculation zone downstream of the droplet at water velocities of 22 and 28 m/s), further complicates the dependence of breakup time on Weber number.
The breakup times for hot tin drops are shown in Figure 14. The average breakup times are Tb = 1.3 and 1.8, for the area and diameter criteria, respectively, whereas the breakup time visually varies between about 2 and 4. As for the cold droplets, the area criterion underpredicts the breakup time, and both the area and diameter criteria yield breakup times lower than the visual values. These values of breakup time agree with Tb = 1.5–2 reported by Ciccarelli and Frost [9] for tin drops in water with coolant velocities of up to 40 m/s. Overall, the breakup times show little dependence on We. In fact, correlating the breakup time with We−1/4 over the full range of We has no theoretical basis since it is evident from the radiographs that at the lower Weber numbers, the breakup mechanism for hot droplets is not due solely to Rayleigh-Taylor instabilities. For example, at a water speed of 9 m/s, from Figures 5, 6 it is clear that complete breakup of the droplet occurs shortly after the collapse of the vapour bubble and the initiation of a thermal interaction. Considering that the area and diameter breakup criteria effectively measure the geometrical dispersion of droplet fragments, rather than the degree of disintegration of the parent drop, the breakup criterion based on the visual inspection of the radiographs is considered to be the most reliable measure of the complete breakup time of the droplet.
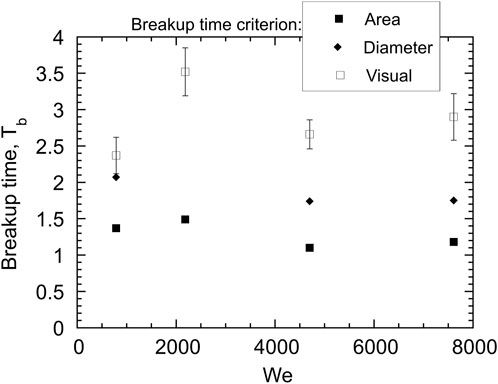
FIGURE 14. Variation of breakup times as a function of Weber number for hot tin drops with various breakup time criteria.
4.4 Effect of pressure pulse characteristics on fragmentation
Some observations about the effect of the characteristics of the pressure pulse passing over the droplet can be made by comparing the present results to previous studies. The pressure field influences the manner in which the initially stable vapour film surrounding the droplet compresses and collapses. This is important since it is the rapid rate of heat transfer associated with direct liquid-liquid contact that allows the rapid conversion of thermal to mechanical energy.
In the current tests, at 9 m/s the water cannon produced a pressure pulse with a peak pressure of 1.3 MPa and a rise time of 2 ms. From the radiographs and high-speed photographs of the current tests it is not possible to determine if this causes the initial vapour film to collapse or just compress. Although this peak pressure is well above the minimum shock pressure of 0.4 MPa that was found to be required to collapse the vapour film in experiments by Nelson and Duda [24], the risetime is two orders of magnitude greater than that reported by Nelson and Duda. Inoue et al. [25] experimentally and analytically studied the effect of pressure pulse magnitude and risetime on the collapse of a vapour film on a heated platinum ribbon. They showed analytically that the vapour layer does not collapse completely for pressure pulses with a long risetime. Therefore, due to the long risetime and the relatively low magnitude of the pressure pulse in the current work, it is unlikely that complete vapour film collapse occurred. As a result, without direct liquid-liquid contact, a layer of coolant did not superheat and flash to vapour and form a symmetrical bubble around the droplet as in the case of zero ambient flow velocity.
However, even without film collapse, high rates of heat transfer are still possible. Inoue et al. [25] found analytically that when a compressed vapour film was at its minimum thickness, the rate of heat transfer was up to 20 times that of steady-state film boiling due to the very thin minimum thickness of the vapour layer and the high conductivity in the vapour layer resulting from the high pressure generated in the vapour during the collapse (over 10 MPa for a vapour thickness below 10 μm). By comparison, they estimated that for direct liquid-solid contact, the heat transfer rate was at least 80 times greater than for steady-state heat transfer. If direct melt-coolant contact does not occur, the generation of vapour will depend on the competition between the heat transfer rate from the droplet to the coolant and the residence time of the coolant in the close vicinity of the drop. As the coolant velocity increases, the rate of convective heat transfer to the coolant will increase, but the residence time will decrease. The convective heat transfer for flow over a sphere scales on the order of U1/2 (e.g., Vliet and Leppert [26]) whereas the residence time will be proportional to D/U. Therefore, the decrease in the residence time with increasing velocity will dominate and vapour production will be reduced as the ambient flow velocity increases. At some critical velocity the convective flow rate will be so large that the heat transfer to the coolant will not be sufficient to heat the coolant to the saturation point and overcome the latent heat of vaporization and thermal effects will be suppressed altogether.
In comparison to the present results, earlier work on the effect of flow on droplet breakup resulted in a different droplet morphology during the breakup process. This is largely due to differences in the risetime and amplitude of the pressure field experienced by the droplets in the previous studies. For example, for similar velocity and melt conditions, the mechanics of the droplet breakup in the work of Ciccarelli and Frost [9] were significantly different than the present work. They observed that significant thermal effects (i.e., the formation of a vapour bubble that surrounded the drop) were still evident for experiments with single tin droplets in water at coolant velocities of 40 m/s. In this case, the flow was generated by a blasting cap or exploding wire which produced a high magnitude pressure pulse (typically 40 MPa with a blasting cap) with a duration of 20 µs? For a given velocity, the magnitudes of the pressure pulses were higher, and the risetimes at least an order of magnitude smaller than the current tests. Using a blasting cap or exploding wire, the shock from the explosion propagated through the coolant imparting a particle velocity of about U = P/ρ c for the duration of the pressure pulse, assuming the underwater shock wave can be treated as an acoustic wave. The bulk of the coolant was then accelerated after a finite delay by the expansion of the vapour bubble formed by the explosion. Due to the high magnitude and short risetime of the pressure pulse, it is likely that there were significant areas of complete film collapse, allowing direct liquid-liquid contact. During the delay between the arrival of the shock at the droplet and the onset of the bulk velocity, the water superheated during the direct liquid-liquid contact would have time to vaporize, generating a symmetrical bubble around the drop, isolating the droplet from the effects of the flow. For lower velocities (20 m/s), the vapour bubble was displaced downstream, but the droplet was still protected from the hydrodynamic forces and convective cooling of the coolant flow, and typical bubble growth and collapse cycles were observed. At 40 m/s the bubble was displaced downstream enough to change the fragmentation mechanism to one bubble cycle with significant fragmentation occurring within the bubble. This comparison indicates that the fragmentation mechanism is strongly influenced by the collapse of the stable vapour film around the drop. With the complete collapse of the vapour layer, rapid heat transfer leads to vapour formation, the presence of which significantly affects the remainder of the breakup process. Without the collapse of the vapour film, the heat transfer rates are significantly lower and there is a delay in, or complete suppression of, the contribution of the thermal energy.
Yuen et al. [27], and Chen et. al [16]. Studied the fragmentation of single melt drops in water accelerated by a shock wave. Chen et. al [16]. Accounted for thermal effects on fragmentation in their model by adjusting the hydrodynamic fragmentation time, tf, by a thermal augmentation factor, γt, i.e., t’f = tf/γt where t’f is the time for thermal fragmentation. To match their model results to experimental data for mass stripping rate and microinteraction volume (i.e., the volume over which the particles interact thermally with the water), they found that values of γt = 2 and γt = 4.2 were required for pressures of 204 bar and of 68 bar, respectively, and predicted that for very high pressures, γt would approach 1. This indicates that the breakup times at low pressures were up to four times faster than for purely hydrodynamic breakup. This is in contrast with Ciccarelli [28], Burger et al. [15] and the present work which found that the breakup times for hot drops were approximately the same as that for cold drops. The differences may be resolved by noting that in the tests of Chen et. al. [16], although the droplet experiences a strong shock wave similar to that in the work of Ciccarelli [28], the coolant velocity is lower. If it is again assumed that the underwater shock wave can be treated as an acoustic wave, the shock would impart coolant velocities of 4.5 m/s and 13.6 m/s for pressures of 68 bar and 204 bar, respectively. With these relatively low coolant velocities and the strength of the initial shock, one would expect thermal effects to dominate over hydrodynamic effects.
Using regular photography, Burger et al. [15] studied the breakup of hot gallium drops (550°C) in water (20°C) with high-speed photography and the results are in general agreement with the present work, i.e., initial hydrodynamic stripping followed by vapour formation. They found that at a fluid velocity of 3 m/s the droplet underwent the bubble growth-collapse-growth cycles typical of thermal fragmentation; at 7 m/s, hydrodynamic stripping initially occurred before the bubble growth; at 17 m/s, stripping dominated before bubble growth occurred; and at 40 m/s, no bubble growth occurred at all, with the breakup being due to hydrodynamic stripping and resembling that of the “cold” drops. In these experiments the flow was generated using a piston driven by an exploding wire. Although few details are given, one would expect the pressure characteristics to be similar to those in the present tests, hence the similar results.
Insight into what other parameters might affect the fragmentation of a droplet can be gained from studies on the collapse of layers of stable film boiling. In addition to the effects of the pressure rise time on the collapse of stable film boiling layers, Inoue et al. [25] found that the vapour layer collapsed more easily with increased shock pressure and decreased ambient pressure. They also found experimentally that the heat transfer rate reached a maximum at a wall temperature of 400°C–500°C after which it decreased. This was attributed to the greater difficulty in collapsing the vapour layer at higher wall temperatures, and in the event of liquid-solid contact, the rapid re-establishment of the vapour layer.
These studies and the current work suggest that melt temperature and the pressure magnitude, risetime, and impulse all strongly affect the fragmentation mechanism through the behaviour of the film collapse. Possible effects are.
1. An increase in the melt temperature may actually inhibit fragmentation by the growth and collapse of a vapour bubble by preventing complete film collapse and direct liquid-liquid contact. This would reduce the heat transfer rate and prevent the formation of a vapour bubble.
2. For a given temperature the velocity range in which thermal energy participates in the fragmentation may be increased by pressure pulses with higher magnitudes and shorter rise times. Under these pressure conditions, complete film collapse is more likely and the rapid generation of vapour would create a protective vapour layer around the droplet preventing direct hydrodynamic fragmentation.
3. As the ambient pressure is increased, the film becomes harder to collapse, again inhibiting thermal fragmentation.
4.5 Suppression of thermal effects
As noted above, if a short risetime, high amplitude pressure pulse is not present to ensure bubble collapse and direct liquid-liquid contact, the formation of vapour and hence the influence of thermal effects on the fragmentation process will be reduced as the coolant velocity increases. At some critical coolant velocity, the generation of vapour will no longer occur, and thermal effects will be suppressed altogether. The critical flow velocity at which the transition from thermal to hydrodynamic fragmentation mechanisms occurs will depend on the rate of heat transfer to the coolant and the residence time of the coolant in the vicinity of the drop. The rate of convective heat transfer to the coolant will be a function of the thermodynamic properties of the melt and coolant. Although an accurate estimate of the amount of heat transfer to the coolant is difficult to make due to the complexity of the droplet morphology during the breakup process, a qualitative estimate of the dependence of the heat transfer on the ambient velocity can be made for the following simplified situation. Consider the convective cooling of the melt droplet surface with no vapour present. The heat transfer to the coolant will induce a thin thermal boundary layer in the melt. If we assume that the thickness of the thermal boundary layer is small compared to the droplet radius (this is validated in the results below), and neglect convection within the melt droplet itself, then the heat transfer from the droplet can be estimated by modelling the droplet surface as a semi-infinite solid. This will represent a conservative estimate of the heat transfer since the growth and motion of perturbations at the droplet surface will enhance the energy transfer. The temperature distribution for conduction in a semi-infinite solid exposed to convective heat transfer on its surface is given by [29]:
where T is the temperature in the solid at depth x and time t, Ti is the initial temperature of the solid, T∞ is the temperature of the coolant, k = thermal conductivity, α = k/ρ cp is the thermal diffusivity of the solid, and h is the convective heat transfer coefficient that was evaluated using the correlation for spheres in liquids or oils [26]:
where µ is the viscosity of the fluid. If the residence time t for the fluid flowing over the droplet is taken to be D/U, then the two equations above can be solved to determine the amount of heat transferred from the melt to the coolant and the thickness of the thermal boundary layer, or penetration depth, which refers to the depth at the droplet surface at which the temperature change is very slight, i.e., (Ti—T)/(Ti—T∞) = 0.01.
Figure 15 shows the dependence of the energy transfer from the droplet and the penetration depth for a tin droplet for the characteristic residence time, with initial conditions corresponding to those of the experiments, as a function of coolant velocity. The values of the material constants used were as follows: k = 38.4 W/m°C, cp = 222.5 J/kg°C, α = 2.6 × 10⁻⁵ m2/s, Pr = 2.5, and µc/µ = 5. The magnitude of the thermal energy transfer is the same order as estimated by Ciccarelli and Frost [9] for the explosion of a tin droplet with negligible flow. They estimated a total energy transfer from a hot tin droplet to the water during the interaction of about 2.5 J, based on the dynamics of the vapour bubble. Both the energy transfer and the penetration depth decrease with increasing ambient flow velocity. This is consistent with the experimental observation that as the ambient flow velocity increases, the thermal effects become relatively less important in comparison to hydrodynamic effects. There will exist a critical flow velocity, which will depend on the thermodynamic properties of the droplet and coolant, for which the heat transfer to the coolant is not sufficient to produce additional vapour. Hence above this velocity, thermal effects (except near the front surface of the drop) will be suppressed. From the present experiments with tin drops, this critical velocity lies between 22 and 28 m/s. This corresponds to a critical Weber number range between 4697 and 7609 for the suppression of thermal effects, based on the experimental conditions. It should be noted that the droplet surface tension (and hence the Weber number) is a function of droplet temperature which will depend on the droplet cooling rate which in turn depends on the convective velocity. However, this dependence is relatively weak. The change in surface tension for liquid tin as a function of temperature is calculated to be −0.14 mNm-1K−1 by Iida and Guthrie [30]. The initial tin droplet temperature was 800°C and, as noted earlier, the temperature at the time of the interaction was about 700°C due to cooling during free-fall. With a temperature change of 100°C, for example, the surface tension is estimated to drop by less than 3%. Solidification effects may also influence the breakup of the parent droplet, but given the low melting point of tin (232°C) relative to the temperature at the time of the interaction, solidification effects are expected to be minimal.
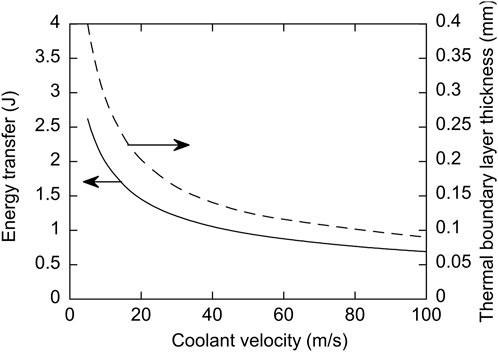
FIGURE 15. Dependence of heat transfer (solid line) and thermal boundary thickness (dashed line) on flow velocity for a hot tin droplet during the characteristic residence time of the fluid flowing around the drop, calculated using one-dimensional thermal analysis.
It is of interest to determine how the droplet material properties, such as thermal conductivity and heat capacity, influence the estimate of the energy transfer from the droplet and penetration depth calculated above. The sensitivity to these parameters was explored by increasing and decreasing k and cp by a factor of 2 and also doing a similar calculation for molten aluminum and bismuth droplets, and comparing the results to the baseline case of a molten tin droplet with a coolant velocity of 9 m/s [18]. It was found that the changes in the material properties had little effect on the results. Although k affects the thermal diffusivity, its inclusion in the convection correction term counters this effect. Heat capacity also affects the diffusivity, however when cp is increased, the diffusivity decreases so that the penetration depth of the droplet decreases and hence a lower percentage of the total energy is released. When the increase in thermal content is considered, due to the increase in cp, the total energy transferred is approximately the same. Even for the case of similar increase in both cp and k, the energy released does not increase by a large factor. Therefore, the heat released by bismuth and aluminum drops, which have values of cp and k different from tin, is not significantly different from that of tin, and in fact varied by less than 10% for all the different cases considered. Therefore, one would expect that the heat transfer from the melt to the coolant would not change considerably from that of tin for a droplet of aluminum or bismuth. If this is the case, the dynamics of the droplet breakup over a range of velocities will be similar for tin, aluminum, and bismuth.
5 Conclusion
The goal of the present study was to determine how changes in the coolant velocity affected the transition from thermal to hydrodynamic fragmentation, i.e., the relative contributions of thermal and kinetic energy to the droplet breakup process. Experiments showed that when the hot melt drops were suddenly subjected to an ambient coolant flow, in the absence of a strong shock wave, fine fragmentation of the droplet was initiated by the hydrodynamic forces acting on the droplet due to the relative coolant velocity. After a short delay, the thermal energy in the melt contributed to the droplet breakup process through the formation of a vapour bubble. The motion of the vapour within the bubble and, at low velocities, the collapse of the bubble, played a dominant role in the breakup of the remainder of the drop. The delay increased with increasing velocity until at high velocities the complete fragmentation of the droplet occurred solely due to the hydrodynamic forces acting on the droplet with a negligible amount of vapour formed.
Comparison with previous studies suggests that the magnitude and risetime of the pressure pulse passing over the melt droplet significantly influences the melt droplet fragmentation process. High magnitude, short risetime pressure pulses increase the contribution of the thermal energy in the melt to the breakup of the droplet via the collapse of the initially stable vapour film surrounding the droplet and subsequent formation of vapour. Thermal effects may play a role even if the droplet experiences supercritical pressure levels if the initial pressure rise is sufficiently rapid to induce the collapse of the initial vapour film and high rates of heat transfer to the coolant. Alternatively, thermal effects may be suppressed if a sufficiently high ambient flow velocity is generated irrespective of the magnitude of the ambient pressure level experienced by the drop.
Data availability statement
The raw data supporting the conclusion of this article will be made available by the authors, without undue reservation.
Author contributions
MC carried out the experiments and wrote the initial paper draft. DF provided input into the experimental work and editorial assistance and generated the final paper version and figures. All authors contributed to the article and approved the submitted version.
Funding
This research was sponsored by the Natural Sciences and Engineering Research Council of Canada.
Acknowledgments
The authors would like to thank Walter Lei for assistance with the development of the quantitative X-ray analysis and P. Kermani, M. Laperriere, S. Sauve, M. Tanguay, and J.F. Viau for their contributions to the design of the apparatus. The authors also acknowledge the helpful comments from the reviewers and editor.
Conflict of interest
The authors declare that the research was conducted in the absence of any commercial or financial relationships that could be construed as a potential conflict of interest.
Publisher’s note
All claims expressed in this article are solely those of the authors and do not necessarily represent those of their affiliated organizations, or those of the publisher, the editors and the reviewers. Any product that may be evaluated in this article, or claim that may be made by its manufacturer, is not guaranteed or endorsed by the publisher.
References
1. Guildenbecher DR, López-Rivera C, Sojka PE. Secondary atomization. Exp Fluids (2009) 46:371–402. doi:10.1007/s00348-008-0593-2
2. Gelfand BE. Droplet breakup phenomena in flows with velocity lag. Prog Energ Combustion Sci (1996) 22(3):201–65. doi:10.1016/s0360-1285(96)00005-6
3. Pilch M, Erdman CA. Use of breakup time data and velocity history data to predict the maximum size of stable fragments for acceleration-induced breakup of a liquid drop. Int J Multiphase Flow (1987) 13(6):741–57. doi:10.1016/0301-9322(87)90063-2
4. Hsiang L-P, Faeth GM. Near-limit drop deformation and secondary breakup. Int J Multiphase Flow (1992) 18:635–52. doi:10.1016/0301-9322(92)90036-g
5. Joseph DD, Belanger J, Beavers GS. Breakup of a liquid drop suddenly exposed to a high-speed airstream. J Multiphase Flow (1999) 25(6):1263–303. doi:10.1016/s0301-9322(99)00043-9
6. Theofanous TG, Li GJ. On the physics of aerobreakup. Phys Fluids (2008) 20:052103. doi:10.1063/1.2907989
7. Hopfes T, Wang Z, Giglmaier M, Adams NA. Experimental investigation of droplet breakup of oxide-forming liquid metals. Phys Fluids (2021) 33:102114. doi:10.1063/5.0064178
8. Patel PD, Theofanous TG. Hydrodynamic fragmentation of drops. J Fluid Mech (1981) 103:207–23. doi:10.1017/s0022112081001304
9. Ciccarelli G, Frost DL. Fragmentation mechanisms based on single drop steam explosion experiments using flash X-ray radiography. Nucl Eng Des (1994) 146:109–32. doi:10.1016/0029-5493(94)90324-7
10. Berthoud G. Vapor explosions. Ann Rev Fluid Mech (2000) 32:573–611. doi:10.1146/annurev.fluid.32.1.573
11. Simons A, Bellemans I, Crivits T, Verbeken K. Vapor explosions: Modeling and experimental analysis in both small- and large-scale setups: A review. JOM (2021) 73:3046–63. doi:10.1007/s11837-021-04767-y
12. Fletcher DF, Anderson RP. A review of pressure-induced propagation models of the vapour explosion process. Prog Nucl Energ (1990) 23(2):137–79. doi:10.1016/0149-1970(90)90010-3
13. Bürger M, Kim DS, Schwalbe W, Unger H, Hohmann H, Schins H. Two-phase description of hydrodynamic fragmentation processes within thermal detonation waves. J Heat Transfer (1984) 106:728–34. doi:10.1115/1.3246745
14. Haraldsson HO, Li HX, Yang ZL, Dinh TN, Sehgal R. Effect of solidification on drop fragmentation in liquid-liquid media. Heat Mass Transfer (2001) 37:417–26. doi:10.1007/s002310000097
15. Bürger M, Cho SH, vBerg E, Schatz A. Modelling of drop fragmentation in thermal detonation waves and experimental verification. In: Institut Fur Kernenergetik und Energiesysteme internal report IKE 2-FB15. Stuttgart, Germany: University of Stuttgart (1993).
16. Chen W, Yuen W, Theofanous T. On the constitutive description of the microinteractions concept in steam explosions. In: Proceedings of 7th International. Topical Meeting on Nuclear Reactor Thermal Hydraulics; September 10--15, 1995; Saratoga Springs, NY (1995).
17. Park HS, Corradini ML. The effect of constraint on fuel-coolant interaction in confined geometry. In: Proceedings of 7th International Topical Meeting on Nuclear Reactor Thermal Hydraulics; September 10--15, 1995; Saratoga Springs, NY (1995).
18. Cunningham MH. Effect of coolant velocity on the fragmentation of single melt drops in water. MEng. Thesis. Montreal: McGill University (1996).
19. Baines M, Board SJ, Buttery NE, Hall RW. The hydrodynamics of large-scale fuel-coolant interactions. Nucl Tech (1980) 49:27–39. doi:10.13182/nt80-a32503
20. Zvirin Y, Hewitt GF, Kenning DBR. Experimental study of drag and heat transfer during boiling on free falling spheres. Heat Tech (1989) 7(3-4):13–23.
21. Taylor GI. The instability of liquid surfaces when accelerated in a direction perpendicular to their planes. Proc Roy So A (1950) 201:192–6. doi:10.1098/rspa.1950.0052
22. Sharp DH. An overview of Rayleigh-Taylor instability. Physica (1984) 12:3–18. doi:10.1016/0167-2789(84)90510-4
23. Kim DS, Bürger M, Fröhlich G, Unger H. Experimental investigation of hydrodynamic fragmentation of gallium drops in water flows. In: Proceedings of the ANS/ENS International Meeting on Light Water Reactor Severe Accident Evaluation; August 28-September 1, 1983; Cambridge, MA (1983).
24. Nelson LS, Duda PM. Steam explosion experiments with single drops of iron oxide melted with a CO2 laser. High Temperature-High Press (1982) 14:259–81.
25. Inoue A, Aoki S, Aritome M, Kataoka H, Matsunaga A. Study on transient heat transfer of film boiling due to arrival of pressure shock. In: Proceedings of the Seventh International Heat Transfer Conference; September, 6-10, 1982; Munich (1982). p. 9–14.
26. Vliet GC, Leppert B. Forced convection heat transfer from an isothermal sphere to water. J Heat Transfer (1961) 83:163–70. doi:10.1115/1.3680504
27. Yuen WW, Theofanous TG. On the fundamental microinteractions that support the propagation of steam explosions. Nucl Eng Des (1994) 146:133–46. doi:10.1016/0029-5493(94)90325-5
28. Ciccarelli G. Investigation of vapor explosions with single molten metal drops in water using flash X-ray. PhD Thesis. Montreal: McGill University (1991).
Keywords: melt-coolant interaction, vapour explosion, hydrodynamic fragmentation, interfacial instabilities, flash radiography
Citation: Cunningham MH and Frost DL (2023) Fragmentation of a molten metal droplet in an ambient water flow. Front. Phys. 11:1171267. doi: 10.3389/fphy.2023.1171267
Received: 21 February 2023; Accepted: 06 June 2023;
Published: 13 June 2023.
Edited by:
Carole Planchette, Graz University of Technology, AustriaReviewed by:
Ivo Kljenak, Institut Jožef Stefan (IJS), SloveniaXiao Xiao, German Aerospace Center (DLR), Germany
Copyright © 2023 Cunningham and Frost. This is an open-access article distributed under the terms of the Creative Commons Attribution License (CC BY). The use, distribution or reproduction in other forums is permitted, provided the original author(s) and the copyright owner(s) are credited and that the original publication in this journal is cited, in accordance with accepted academic practice. No use, distribution or reproduction is permitted which does not comply with these terms.
*Correspondence: David L. Frost, ZGF2aWQuZnJvc3RAbWNnaWxsLmNh