- 1School of Electronic and Electrical Engineering, Baoji University of Arts and Sciences, Baoji, China
- 2School of Physical Education, Baoji University of Arts and Sciences, Baoji, China
Fault of rolling bearing signal is a common problem encountered in the production of life. Identifying the fault signal helps to locate the fault location and type quickly, react to the fault in time, and reduce the losses caused by the failure in production. In order to accurately identify the fault signal, this paper presents a triple feature extraction and classification method based on multi-scale dispersion entropy (MDE) and multi-scale permutation entropy (MPE), extracts the features of the signal of rolling bearing when it is working, and uses the classification algorithm to determine whether there is a fault in the bearing and the type of fault. Scale 2 of MDE is combined with scale 1 and scale 2 of MPE as the three features required for the experiment. As a comparison of recognition results, multi-scale entropy (MSE)is introduced. Ten scales of the three entropy are calculated, and all combinations of three feature extraction are obtained. K nearest neighbor algorithm is used for three feature recognition. The result shows that the combination recognition rate proposed in this paper reaches 96.2%, which is the best among all combinations.
1 Introduction
Today, mechanized equipment fault diagnosis is an unavoidable problem in all walks of life. Rolling bearing fault accounts for a large part of mechanical equipment fault [1, 2]. Rolling bearing, as a basic part of mechanical equipment, is easily damaged under long-term operation, resulting in many different types of faults, which affect the overall operation of equipment. However, early fault identification of bearings has always been a difficult problem to solve. In order to accurately identify and repair faults in time, various fault diagnosis methods have been put forward to distinguish fault types [3–5].
Vibration signals will be generated during normal operation of rolling bearings. By analyzing the characteristics of vibration signals, the fault categories of bearings can be effectively diagnosed. However, due to the influence of bearing load and friction between components, the vibration signals generated are always non-linear and non-stationary [6, 7]. For feature extraction and recognition of such signals, researchers have put forward many time-frequency analysis methods to extract information from the signals. For example, wavelet transform (WT), empirical mode decomposition (EMD) [8] and variational mode decomposition (VMD) [9], however, these methods also have their own disadvantages, such as WT only decomposes low frequency band of signal, mode overlap of EMD, etc. To solve these problems, some improved methods have been put forward successively, such as empirical WT (EWT) [10], complete ensemble EMD with adaptive noise (CEEMDAN) and so on [11, 12].
In recent years, entropy, as a non-linear dynamic method, has also been applied in the fields of fault diagnosis and underwater acoustic signal recognition [13–15]. It is used to describe the complexity of the signal. Sample entropy (SE) [16], approximate entropy (AE) [17], permutation entropy (PE) [18], dispersion entropy (DE) [19] and so on have been put into use successively, and some achievements have been made [20]. However, single-scale entropy cannot completely reflect the fault information, especially the limitations of mutation information. As a result, multi-scale signal analysis methods are gradually applied to signal recognition [21, 22]. MSE was proposed by Costa et al. in 2002 [23], which successfully quantifies the information of time series on multi-scales. Based on the proposal of multi-scale SE (MSE), in 2005, Aziz et al. also made improvements on PE, proposed multi-scale PE (MPE) [24], and made PE obtain higher noise resistance. The proposed multi-scale DE (MDE) is faster to compute and better reflects the characteristics of the real signal than MSE. Both MPE and MDE are widely used in the field of signal recognition [25, 26].
Considering that the DE is faster and more stable, this paper uses the DE to extract fault features, but the DE contains less information. In order to obtain more information about the signal, we introduce the concept of multi-scale and propose a triple feature extraction method based on MDE and MPE in fault diagnosis.
The remainder of this paper is as follows: Section 2 introduces the principle and calculation method of multi-scale and DE; Section 3 describes the specific steps of the triple feature experiments proposed in this paper. Section 4 shows the feature distribution and recognition results of the triple feature extraction experiments, which proves the feasibility of the experiment. Section 5 summarizes the entire experiment.
2 Dispersion entropy
DE is a measure of time complexity. It has a faster calculation speed, is less affected by sudden changes in the signal and can reflect the magnitude relationship. The calculation steps of DE are as follows.
(1) For a given set of time series,
The standard deviation
(2) Use round function to convert the time series mapped in the first step into integers between 1 and
(3) Construct the embedding vector based on the embedding dimension
(4) Set
(5)
(6) Based on the above steps, the formula for calculating DE is as follows.
3 Steps of the experiment
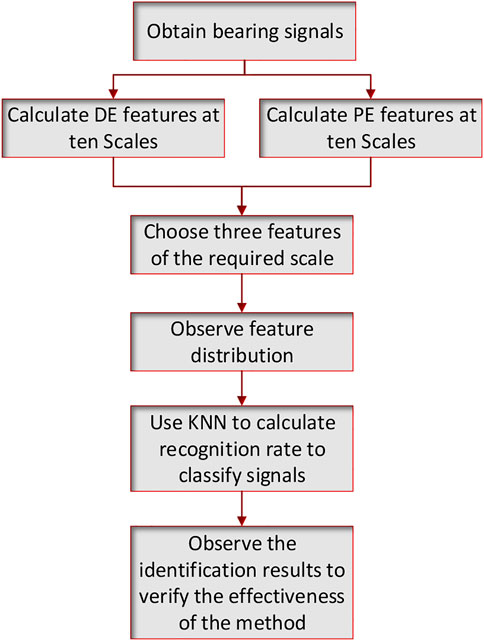
The method proposed in this paper is a triple feature extraction method based on MDE and MPE, which is shown in Figure 1. The method combines scale 2 of MDE with scale 1 and 2 of MPE as three features of the signal, and combines these three features to identify the signal using a classifier. The specific experimental steps are as follows:
(1) Select bearing signals of different fault categories and sizes and divide the samples.
(2) Extract MDE and MPE features at ten scales from samples of these ten types of signals.
(3) Draw the triple feature distribution of the ten types of signals according to the selection principle of the highest recognition rate.
(4) Triple feature recognition by using KNN (k nearest neighbor) algorithm.
(5) Draw the recognition result and calculate the recognition rate to verify the validity of the method.
4 Rolling bearing signals
In order to identify the fault of bearing signal, this article has selected ten bearing signals in different states from Case Western Reserve University [27]. The first one is normal working signal, named N-100, the other nine are working signals in failure state. According to their three sizes (0.007, 0.014 and 0.021 feet) and three different fault locations (ball fault, inner race fault and outer race fault), the nine working signals are named IR-007, B-007, OR-007, IR-014, B-014, OR-014, IR-021, B-021, OR-021. Ten types of bearing signals are shown in Figure 2.
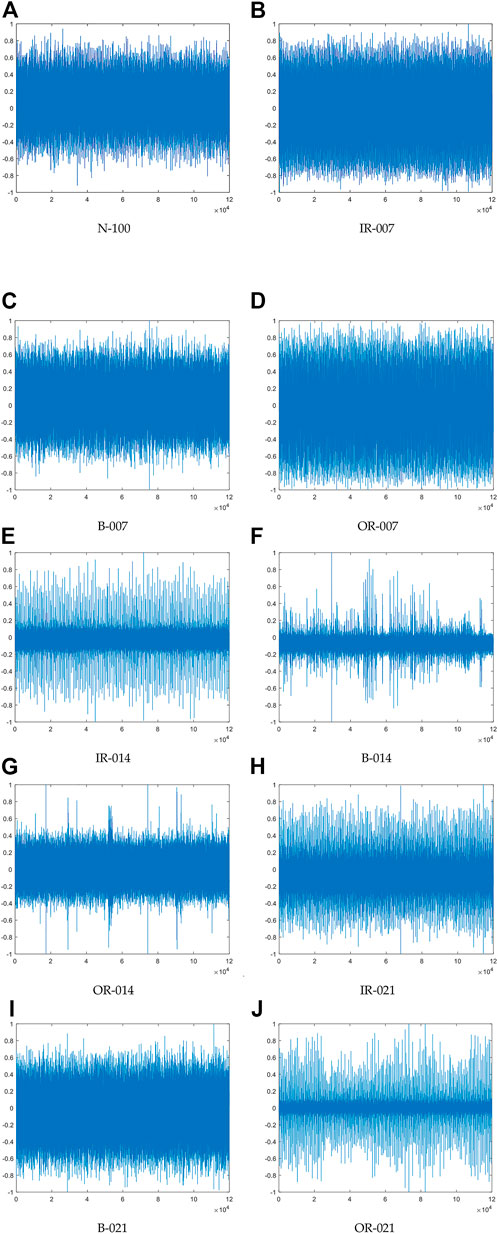
FIGURE 2. Ten types of bearing signals: (A) N-100, (B) IR-100, (C) B-100, (D) OR-100, (E) IR-014, (F) B-014, (G) OR-014, (H) IR-021, (I) B-021, (J) OR-021.
5 Feature extraction experiments
In this experiment, MDE at scale 2 and MPE at scale 1 and 2 are selected as the three features, and the entropy values at ten scales of these ten kinds of signals are calculated. When the scale is 1, the time series is itself. When the scale is larger than 1, the data used to calculate the entropy value is coarsened. The parameters used to calculate the entropy at different scales are the same. It is worth noting that after coarsening, the mean and variance of the data needed for calculating the normal distribution function within the dispersed entropy are still the original data. After calculating the entropy value features, the distribution and recognition of these features are observed and compared, and the feature extraction method used in this paper is verified.
5.1 Single feature extraction
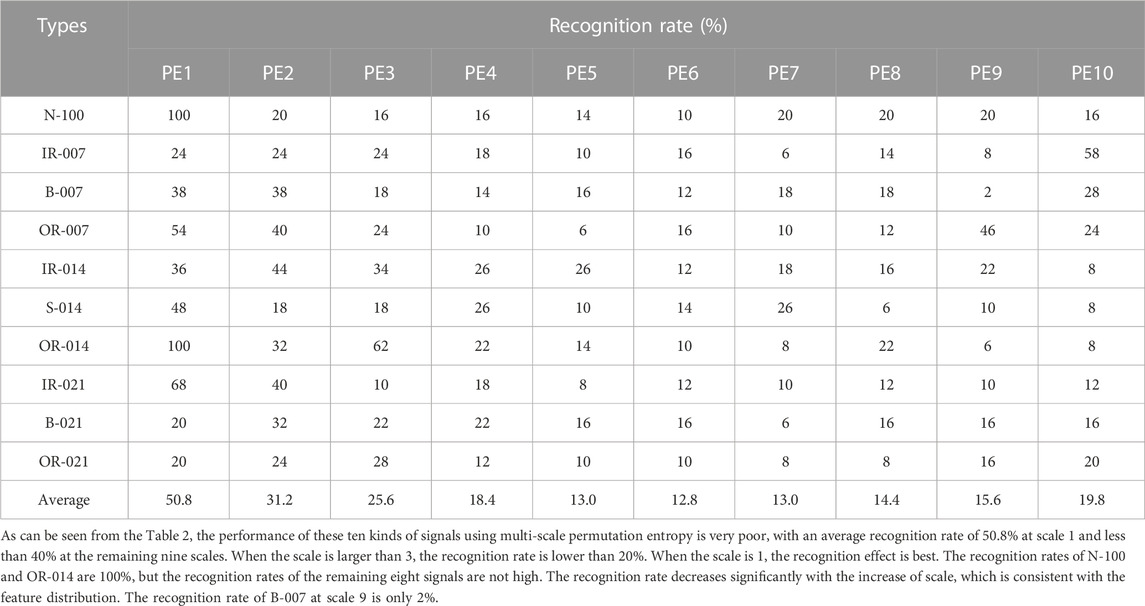
Firstly, the parameters and sampling ranges are determined. The data used are from the ten types of bearing signals selected above. From the 1000th data point of the ten types of signals, 1,024 data points are taken as a sample, and 100 samples are taken for each type of signal. The parameters of these entropy are set as embedding dimension, number of classes, time delay, feature distribution of the ten scales of the two entropy is calculated and plotted. The ten scales of MDE are named as DE1, DE2,.DE10, and MPE is similarly named as PE1, PE2, . PE10. The horizontal coordinates of the graph are the number of samples. The vertical coordinate is the entropy value, and single feature distribution of ten scales of MDE for ten signals are shown in Figure 3.
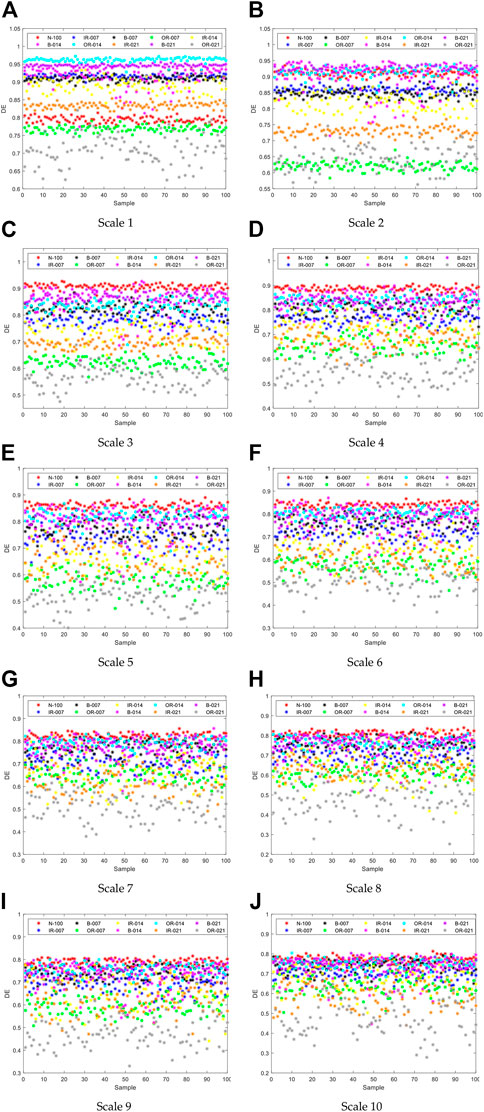
FIGURE 3. Single feature distribution of ten scales of MDE for ten signals: (A-J) represent Scale 1 to Scale10.
It can be seen from Figure 3 that at scale 1, entropy values of these ten types of signals are arranged orderly, but there are still different degrees of confusion between two different signals with adjacent distributions. With the increase of scale, the boundaries between various signals become blurred gradually, the effect of feature extraction becomes worse and the phenomenon of aliasing becomes more serious. From the point of view of distribution, the distribution of OR-021 is relatively scattered, while the distribution of other signals mostly concentrates in a certain interval. With the increase of scale, the entropy value gradually concentrates to around 0.8. Single feature distribution of ten scales of MPE for ten signals are drawn in Figure 4.
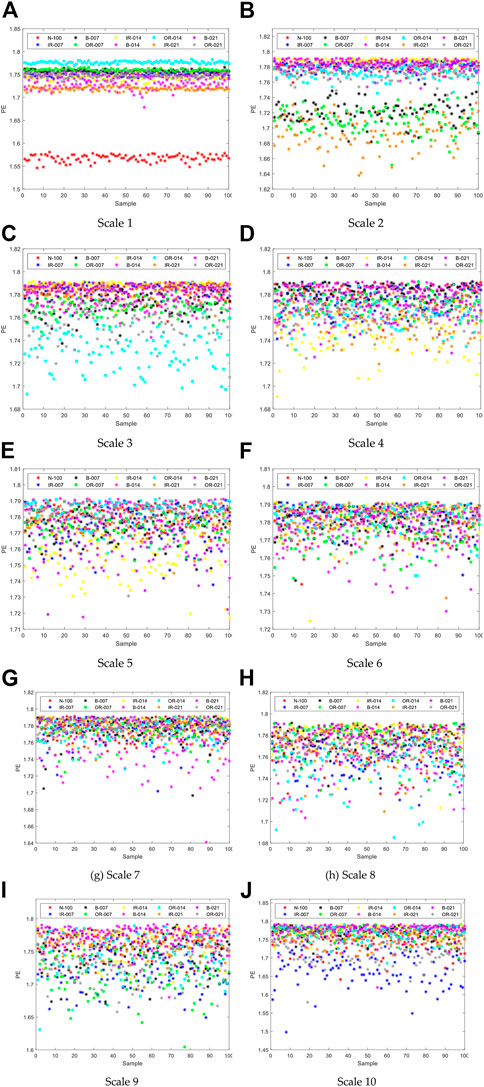
FIGURE 4. Single feature distribution of ten scales of MPE for ten signals: (A-J) represent Scale 1 to Scale10.
It can be seen from the Figure 4 that when scale 1 is used, the distribution of the entropy of all kinds of signals is relatively centralized, in which N-100 and OR-014 have less overlap with other signals. In other scales, the signal confusion is more serious. When the scale is 2, the signal entropy concentrates at 1.72 and 1.78. When the scale is greater than 3, the distribution of the ten types of signals is almost confounded. In order to obtain exact results, single feature recognition was performed on these features.
5.2 Single feature recognition
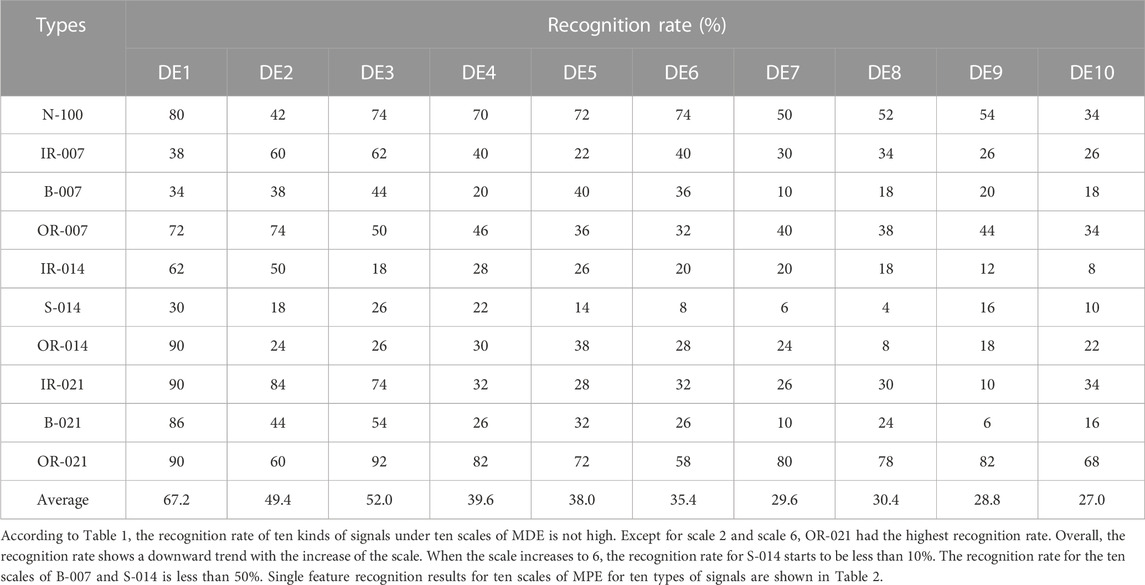
After obtaining the characteristic distribution of these ten kinds of signals, a classification algorithm is needed to distinguish them. In this paper, KNN algorithm is selected, 50 of 100 samples are taken as training samples to train the algorithm, and the remaining 50 samples are taken as test samples to observe the classification effect. According to the results of single feature extraction, the single feature recognition results for ten scales with MDE for ten types of signals are shown in Table 1.
5.3 Triple feature extraction
To compare with the feature extraction method proposed in this paper, MSE is introduced in this section, and three features of the ten scales of the three entropies are combined. Sample selection and parameter setting of the entropy still follow the rules of single feature. Since there are 4,060 methods to select three of the 30 features, the selection of scale combination is based on the highest recognition rate in the experimental results and only four of the best results are obtained in this section: 1) Scale 2 of MDE and scale 1 and 2 of MPE; 2) Scale 1 of MDE and scale 1 and 2 of MPE; 3) Scale 1 of MDE, scale 2 of MPE and scale 10 of MSE; 4) Scale 1 of MDE, Scale 2 of MPE and Scale 9 of MSE. The distribution of features for the four best combinations of recognition results are shown in Figure 5.
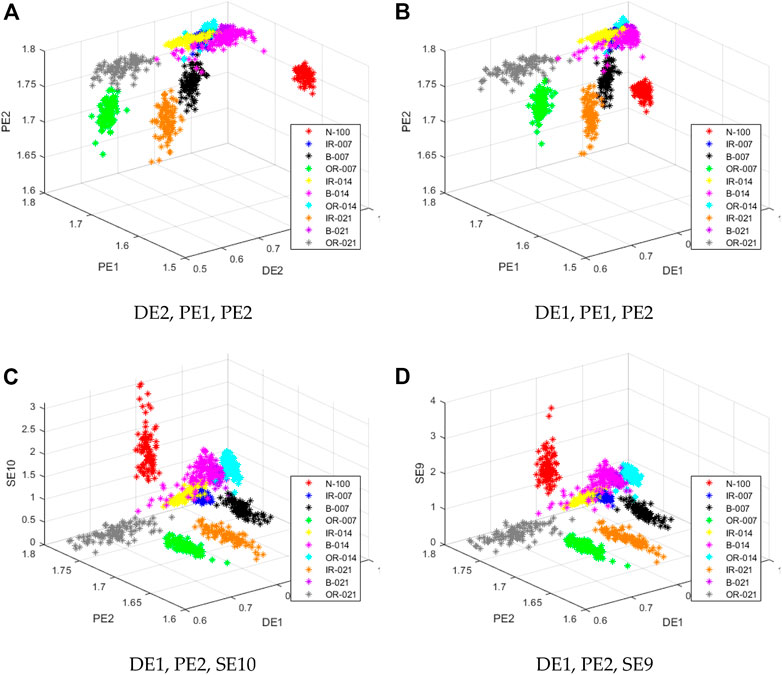
FIGURE 5. The distribution of features for the four best combinations of recognition results: (A) DE2, PE1, PE2 ; (B) DE1, PE1, PE2; (C) DE1, PE2, SE10; (D) DE1,PE2,SE9.
From Figure 5, it can be seen that the distribution of all types of signals has been significantly different under the three features, among which N-100, B-007, OR-007, IR-021, OR-021 signals have little mixing with other signals. The remaining five signals have less mixing; All four of the best recognition results have the feature of MPE scale 2. To get a more specific and clear signal distinction, triple feature recognition is used for these features.
5.4 Triple feature recognition
In this section, KNN algorithm is still used to identify the three feature of the feature extraction results. 50 training samples and 50 test samples are still selected. The parameter settings are still the same as those of single feature recognition. Four recognition results maps with the highest recognition rate are drawn. The result figure and recognition rate table of triple feature recognition for ten types of signals are shown in Figure 6 and Table 3.
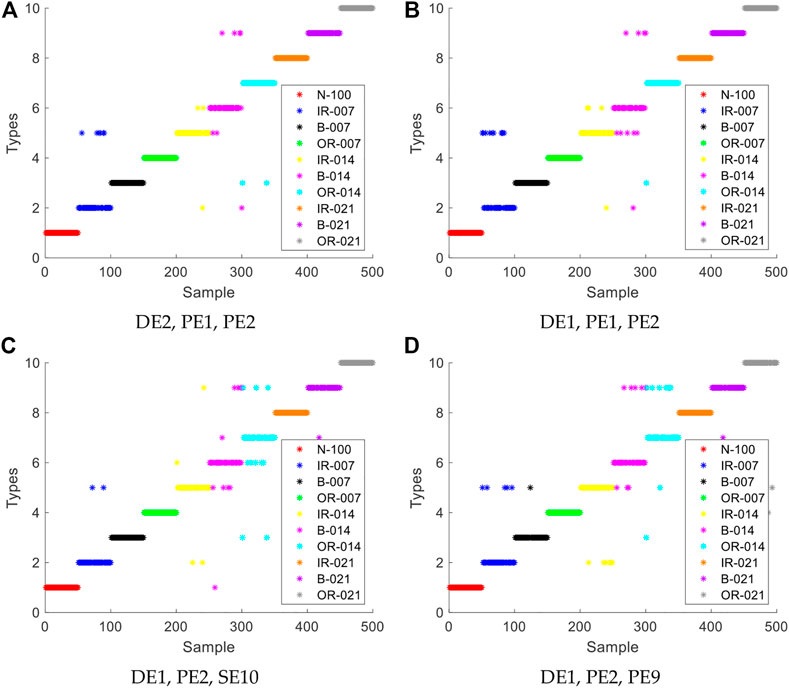
FIGURE 6. Triple feature recognition results for ten types of signals: (A) DE2, PE1, PE2 ; (B) DE1, PE1, PE2; (C) DE1, PE2, SE10; (D) DE1, PE2, SE9.
From Figure 6 and Table 3, it can be seen that the four combinations with the highest recognition rate have a considerable improvement over the recognition rate of single feature recognition, where the combination of scales are chosen based on the highest recognition rate in the experimental results. The average recognition rate of the four combinations has reached more than 90%, and only a few of the 100 samples of each type of signal have been misidentified. In the first combination with the highest recognition rate, the recognition rate of six types of signals is 100%, and the unreachable signals have considerable recognition results. The combination of DE2, PE1 and PE2 presented in this paper has the highest recognition rate.
6 Conclusion
Fault signal recognition is the classification of time series, first extracts the features of the fault signal, and then uses the classification algorithm to classify the signal according to the features. In this paper, the multi-scale method is used to obtain the signal features at different scales, where the selection of scale combination is based on the highest recognition rate in the experimental results and only four of the best results are obtained in this section. Combining scale 2 of MDE with scale 1 and 2 of MPE, a triple feature extraction method is proposed to extract and identify the signal features. To verify the superiority of this method, ten types of rolling bearing fault signals are identified. The following are the main research conclusions:
(1) In the field of fault diagnosis, this paper introduces a triple feature extraction method based on scale 2 of MDE, scale 1 and 2 of MPE, and achieves good recognition results with the highest recognition rate of 96.2%.
(2) Combining the three types of entropy which have poor recognition effect in single feature experiment, the recognition ability has been improved significantly, and the recognition rate has been improved by 29%.
(3) The triple feature extraction methods proposed in this paper have a recognition rate of at least 1.2% higher than the other combinations of the three entropies, which can better diagnose the fault.
Data availability statement
Publicly available datasets were analyzed in this study. This data can be found here: [Online]. Available: http://csegroups.case.edu/bearingdatacenter/pages/download-data-file.
Author contributions
NZ and LW jointly discuss and determine the idea and method of the experiment. NZ is responsible for the whole feature extraction experiment, LW is responsible for the writing of the experiment part, and finally, NZ and LW are jointly responsible for the inspection and revision of the article.
Conflict of interest
The authors declare that the research was conducted in the absence of any commercial or financial relationships that could be construed as a potential conflict of interest.
Publisher’s note
All claims expressed in this article are solely those of the authors and do not necessarily represent those of their affiliated organizations, or those of the publisher, the editors and the reviewers. Any product that may be evaluated in this article, or claim that may be made by its manufacturer, is not guaranteed or endorsed by the publisher.
References
1. Wang T, Xu X, Pan H, Chang X, Yuan T, Zhang X, et al. Rolling bearing fault diagnosis based on depth-wise separable convolutions with multi-sensor data weighted fusion. Appl Sci (2022) 12(15):7640. doi:10.3390/app12157640
2. Yan X, Jia M. A novel optimized SVM classification algorithm with multi-domain feature and its application to fault diagnosis of rolling bearing. Neurocomputing (2018) 313:47–64. doi:10.1016/j.neucom.2018.05.002
3. Gao Y, Yu D. Intelligent fault diagnosis for rolling bearings based on graph shift regularization with directed graphs. Adv Eng Inform (2021) 47:101253. doi:10.1016/j.aei.2021.101253
4. Yao C, Wang S, Chen B, Mei G, Zhang W, Peng H, et al. An improved envelope spectrum via candidate fault frequency optimization-gram for bearing fault diagnosis. J Sound Vibration (2022) 523:116746. doi:10.1016/j.jsv.2022.116746
5. Li Y, Geng B, Jiao S. Dispersion entropy-based lempel-ziv complexity: A new metric for signal analysis. Chaos, Solitons & Fractals. (2022) 161:112400. doi:10.1016/j.chaos.2022.112400
6. Yuan X, Fan Y, Zhou C, Wang X, Zhang G. Research on twin extreme learning fault diagnosis method based on multi-scale weighted permutation entropy. Entropy (Basel) (2022) 24(9):1181. doi:10.3390/e24091181
7. Yang E, Wang Y, Wang P, Guan Z, Deng W. An intelligent identification approach using VMD-CMDE and PSO-dbn for bearing faults. Electronics (2022) 11(16):2582. doi:10.3390/electronics11162582
8. Huang NE, Shen Z, Long SR, Wu MC, Shih HH, Zheng Q, et al. The empirical mode decomposition and the hilbert spectrum for nonlinear and non-stationary time series analysis. Proc Math Phys Eng Sci (1998) 454(1971):903–95. doi:10.1098/rspa.1998.0193
9. Dragomiretskiy K, Zosso D. Variational mode decomposition. IEEE Trans Signal Process (2013) 62(3):531–44. doi:10.1109/tsp.2013.2288675
10. Prasannamoorthy V, Devarajan N. Fault detection and classification in power electronic circuits using wavelet transform and neural network. J Comp Sci (2011) 7(1):95–100. doi:10.3844/jcssp.2011.95.100
11. Li Y, Mu L, Gao P. Particle swarm optimization fractional slope entropy: A new time series complexity indicator for bearing fault diagnosis. Fractal and Fractional (2022) 6(7):345. doi:10.3390/fractalfract6070345
12. Li Y, Tang B, Yi Y. A novel complexity-based mode feature representation for feature extraction of ship-radiated noise using VMD and slope entropy. Appl Acoust (2022) 196:108899. doi:10.1016/j.apacoust.2022.108899
13. Ying W, Tong J, Dong Z, Pan H, Liu Q, Zheng J. Composite multivariate multi-scale permutation entropy and laplacian score based fault diagnosis of rolling bearing. Entropy (2022) 24(2):160. doi:10.3390/e24020160
14. Fei C, Tian W, Zhang L, Li J, Chen D, Chen D, et al. fault diagnosis of power transformer based on time-shift multiscale bubble entropy and stochastic configuration network. Entropy (2022) 24(8):1135. doi:10.3390/e24081135
15. Li Y, Geng B, Tang B. Simplified coded dispersion entropy: A nonlinear metric for signal analysis. Nonlinear Dyn (2023) 2023. doi:10.1007/s11071-023-08339-4
16. Luis M, Rossana C, Leandro P. On the use of approximate entropy and sample entropy with centre of pressure time-series. J neuroengineering Rehabil (2018) 15(1):116. doi:10.1186/s12984-018-0465-9
17. Pincus SM. Approximate entropy as a measure of system complexity. Proc Natl Acad Sci United States America (1991) 88(6):2297–301. doi:10.1073/pnas.88.6.2297
18. Yan R, Liu Y, Robert X. Permutation entropy: A nonlinear statistical measure for status characterization of rotary machines. Mech Syst Signal Process (2012) 29:474–84. doi:10.1016/j.ymssp.2011.11.022
19. Rostaghi M, Reza Ashory M, Azami H. Application of dispersion entropy to status characterization of rotary machines. J Sound Vibration (2019) 438:291–308. doi:10.1016/j.jsv.2018.08.025
20. Li Y, Tang B, Geng B, Jiao S. Fractional order fuzzy dispersion entropy and its application in bearing fault diagnosis. Fractal and Fractional (2022) 6(10):544. doi:10.3390/fractalfract6100544
21. Costa M, Goldberger Ary L, Peng C-K. Multiscale entropy analysis of complex physiologic time series. Phys Rev Lett (2002) 89(6):068102. doi:10.1103/physrevlett.89.068102
22. Li Y, Jiao S, Geng B. Refined composite multiscale fluctuation-based dispersion Lempel–Ziv complexity for signal analysis. ISA Trans (2023) 133:273–84. doi:10.1016/j.isatra.2022.06.040
23. Costa M, Goldberger AL, Peng C-K. Multiscale entropy analysis of complex physiologic time series. Phys Rev Lett Americam Physiol Soc (2002) 89(6):068102. doi:10.1103/physrevlett.89.068102
24. Aziz W, Arif M. Multiscale permutation entropy of physiological time series. In: Proceedings of the 9th International Multitopic Conference; December 23-24, 2005; Karachi, Pakistan (2005).
25. Azami H, Escudero J. Coarse-graining approaches in univariate multiscale sample and dispersion entropy. Entropy (2018) 20(2):138. doi:10.3390/e20020138
26. Azami H, Rostaghi M, Escudero J. Refined composite multiscale dispersion entropy: A fast measure of complexity. IEEE Trans Biomed Eng (2016) 64:01379. doi:10.1109/TBME.2017.2679136
Keywords: rolling bearing signal, triple feature extraction, multi-scale dispersion entropy, multi-scale permutation entropy, fault diagnosis
Citation: Zhou N and Wang L (2023) Triple feature extraction method based on multi-scale dispersion entropy and multi-scale permutation entropy in sound-based fault diagnosis. Front. Phys. 11:1180595. doi: 10.3389/fphy.2023.1180595
Received: 06 March 2023; Accepted: 24 March 2023;
Published: 04 April 2023.
Edited by:
Yuxing Li, Xi’an University of Technology, ChinaReviewed by:
Xiaohui Yang, Inner Mongolia University of Science and Technology, ChinaGuanni Ji, Xi’an Traffic Engineering Institute, China
Copyright © 2023 Zhou and Wang. This is an open-access article distributed under the terms of the Creative Commons Attribution License (CC BY). The use, distribution or reproduction in other forums is permitted, provided the original author(s) and the copyright owner(s) are credited and that the original publication in this journal is cited, in accordance with accepted academic practice. No use, distribution or reproduction is permitted which does not comply with these terms.
*Correspondence: Nina Zhou, c3VtbWVybTIwMjNAMTI2LmNvbQ==
 Nina Zhou
 Li Wang2