 M. G. Boulay1,2V. Camillo1N. Canci1S. Choudhary3
 L. Consiglio1A. Flammini4C. Galbiati5,6C. Ghiano1A. Gola7,8S. Horikawa5P. Kachru5I. Kochanek1K. Kondo1G. Korga9
 M. Kuźniak3A. Mazzi7,8A. Moharana5G. Nieradka3
 G. Paternoster7,8
 A. Razeto1*D. Sablone1T. N. Thorpe5,10C. Türkoğlu3H. Wang10M. Rescigno11S. Sanfilippo12
- 1INFN Laboratori Nazionali del Gran Sasso, L’Aquila, Italy
- 2Department of Physics, Carleton University, Ottawa, ON, Canada
- 3AstroCeNT, Nicolaus Copernicus Astronomical Center of the Polish Academy of Sciences, Warsaw, Poland
- 4INFN Bologna, Bologna, Italy
- 5Gran Sasso Science Institute, L’Aquila, Italy
- 6Physics Department, Princeton University, Princeton, NJ, United States
- 7Fondazione Bruno Kessler, Povo, Italy
- 8Trento Institute for Fundamental Physics and Applications, Povo, Italy
- 9Department of Physics, Royal Holloway University of London, Egham, United Kingdom
- 10Physics and Astronomy Department, University of California, Los Angeles, CA, United States
- 11INFN Sezione di Roma, Roma, Italy
- 12INFN Roma Tre, Roma, Italy
SiPM-based readouts are becoming the standard for light detection in particle detectors given their superior resolution and ease of use with respect to vacuum tube photo-multipliers. However, the contributions of noise detection such as the dark rate, cross-talk, and after-pulsing (AP) may significantly impact their performance. In this work, we present the development of highly reflective single-phase argon chambers capable of displaying light yields up to 32 photo-electrons per keV, with approximately 12 being primary photo-electrons generated by the argon scintillation, while the rest are accounted by optical cross-talk. Furthermore, the presence of compound processes results in a generalized Fano factor larger than 2 already at an over-voltage of 5 V. Finally, we present a parametrization of the optical cross-talk for the FBK NUV-HD-Cryo SiPMs at 87 K that can be extended to future detectors with tailored optical simulations.
1 Introduction
In 1955, it was observed that a silicon junction emits light when a bias is applied across it [1]. More recently, a number of works have documented the emission of light by SiPMs during the avalanche process [2–5]. Internal cross-talk (iCT) happens when such a photon remains confined within the source SiPM and generates another avalanche in a neighboring cell. External cross-talk (eCT) happens when the generated photon escapes from the silicon bulk reaching another SiPM array in the experimental setup. Lastly, feedback cross-talk (fCT) happens when the photon undergoes reflection and is reabsorbed by the same SiPM array which emitted it. We define optical cross-talk (oCT) as the envelope that includes all three of these effects. As we will describe, optical cross-talk generates a compound process that leads to the amplification of the number of detected photo-electrons
Many particle detectors are designed to collect very faint light signals in chambers that host several thousands of photo-detectors, such as Borexino and Super-Kamiokande [6, 7]. Under these conditions, oCT between the photo-detectors can have a large impact on the physics results of the experiments. Argon is of particular interest as an active detector medium because of its high scintillation yield. Multiple large particle detectors have made, or will make, use of liquid argon (LAr) [8–11]. In this work, we present the development of two high-efficiency LAr chambers which were operated at 87 K to study the scintillation light produced by the interactions with calibration sources. We then present the deconvolution of the oCT into the individual contributions.
2 Experimental setups
The detectors were installed in a sealed dewar inside a container filled with approximately 4 L of high-purity LAr, within the STAR facility [12]. The system consists of a re-circulation loop with a volumetric flow of 5 sL/min and provides continuously purified argon via a getter (SAES PS4-MT3).
Two radioactive sources were used. The meta-stable isotope,
2.1 Cubic chamber
Figure 1 depicts the cubic LAr chamber. The chamber consists of four identical walls machined from polyetheretherketone (PEEK) which can host different reflectors. The results reported here refer to an enhanced specular reflector (Vikuiti ESR) from 3M company. The top and bottom windows are made of 1λ fused silica with dimensions of 50 × 50 × 4 mm3. All internal surfaces are coated with tetraphenyl butadiene (TPB) for the wavelength shifting of the scintillation photons (128 nm) to the visible range of the spectrum.
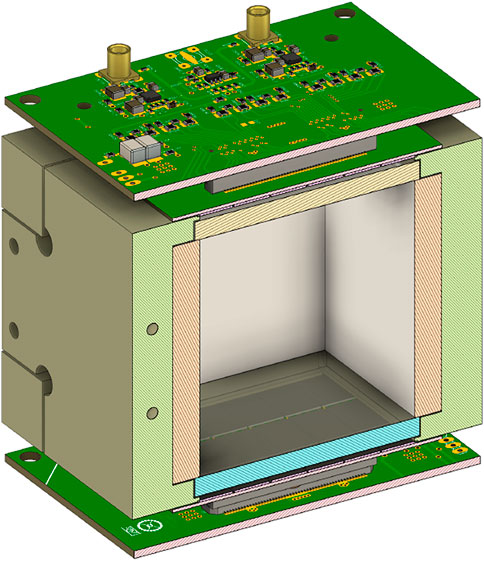
FIGURE 1. Drawing of the cubic chamber with inner dimensions of 50 × 50 × 50.8 mm3 (l × w × h). High-efficiency reflectors are installed on the chamber walls. Two 24 cm2 SiPM tiles, with their readout boards, facing UV-grade fused-silica windows, are installed at the top and the bottom. All the inner surfaces are evaporated with TPB.
The visible photons are detected by two SiPM arrays (tiles) installed at the top and bottom of the detector chamber. Each tile consists of 24 SiPMs (summed into quadrants) bonded to a FR4 PCB with cryo-grade epoxy [14]. The SiPMs of the FBK NUV-HD-Cryo family have a surface area of 7.9 × 11.7 mm2, with a cell size of 30 µm and a quenching resistor of 5 MΩ at 87 K [15]. The fill-factor of the tiles is 90%, where most of the dead space is reserved for the landing pad of the wire bonding.
2.2 Cylindrical chamber
A cylindrical chamber with inner dimensions of 46 × 50 mm2 (ø × h) is instrumented with the same photo-detectors as used in the cubic chamber. The cylinder is made of acrylic and internally lined with TPB-coated 3M reflector foil. In front of the SiPM surface, two 1-mm-thick TPB-coated fused-silica windows are installed. The cylindrical chamber is used for verifying the consistency of the results and the models developed for the cubic chamber.
2.3 Data acquisition
Each tile is connected to a readout board where the signals from the SiPMs are amplified by four cryo-grade low-noise trans-impedance amplifiers [16]. In this configuration, we achieve at an over-voltage (oV) of 5 V a signal-to-noise ratio1 (SNR) larger than 7 for the unfiltered signal and larger than 30 for the charge in 1 µs.
Waveforms are acquired using a V1720 CAEN digitizer, with each tile quadrant connected to a channel. A copy of the signal from the SiPMs is sent to a set of NIM discriminators that form a trigger logic unit. The trigger can be configured to act on a single tile or on both, depending on the experimental conditions. The trigger threshold is set significantly below the region of interest.
Data are acquired up to an over-voltage of 9.5 V with
A laser pulse is delivered in the chambers to monitor the behavior of the photo-detectors. Figure 2 shows the charge gain and the peak amplitude for one of the SiPMs in use. Both quantities are described being better than a few percent by linear models (as a function of over-voltage). The break-down voltages are measured as
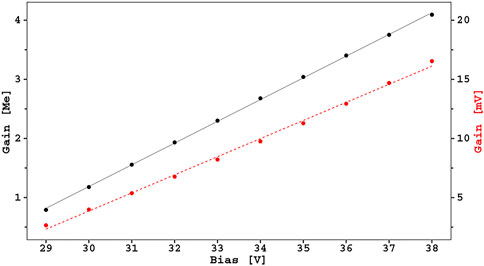
FIGURE 2. Gain in e− (black) and in peak amplitude (red) for the SiPMs in use as a function of the applied bias. The solid and dashed lines correspond to linear regressions, which describe the experimental data better than 1% and 4% for charge and amplitude, respectively.
3 Data analysis
The data analysis involves integrating the normalized waveforms over a gate of 7 µs, following the NIM trigger to obtain the photo-electron (PE) spectrum. Over this time scale, 99.5% of the Ar scintillation light is emitted [17], and delays introduced by the absorption and re-emission of photons in the wavelength shifter (WLS) and their optical path length inside the detector are slightly affected. The normalized waveforms are scaled by the gain of the photo-detectors, and the baseline, which is calculated in the pre-trigger region, is removed. The mean number of photo-electrons observed by both photo-detectors is extracted by fitting the calibration peak data with a Gaussian model [12].
The gross light yield, L
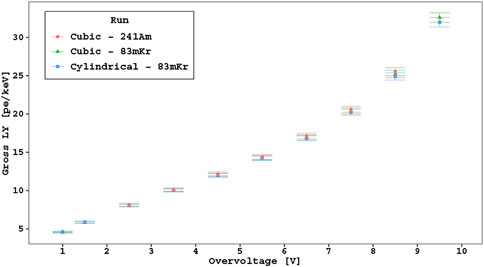
FIGURE 3. Gross light yield (without correcting for correlated noise) measured at different SiPM over-voltages for the cubic chamber using
3.1 Internal cross-talk and after-pulsing
Figure 4 shows two figures of merit for the iCT for the SiPMs in use, measured at 77 K. These measurements are performed with single SiPMs from the same lot as the photo-detectors of the cylindrical and cubic chambers. The SiPMs are exposed to laser pulses in a stable, low-noise environment, with a black masking tape to minimize the contribution of external photons and feedback cross-talk. During analysis, up to 20 photo-electron peaks are identified. We can assume that the number of detected laser photons follow a Poissonian distribution with a mean value, ϵoV (taken much smaller than unity).
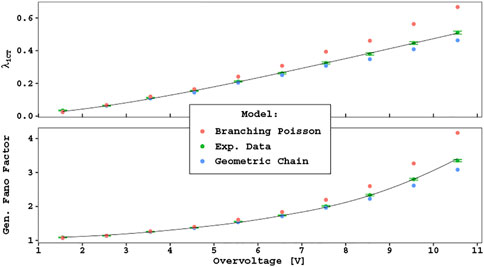
FIGURE 4. iCT analysis for the SiPMs used. The experimental data points (green) are extracted from raw data using Eq. 1, and the solid black lines represent best fits to the data using Eqs 2 (top) and 3 (bottom).
In this work, we assume that the cross-talk photons are emitted independently in a recursive process converging at ϵoV/(1 − λiCT), where λiCT is the average number of secondary avalanches following any avalanche in the process. As in Ref. [18], the model is valid for λiCT ≪ 1.
Using the charge spectra (aka “finger plots”), the relative population of each peak,
where Var[n] and ⟨n⟩ define the variance and mean of the photo-electron peak distribution,
The generalized Fano factor
We model the behavior of
where the two break-down voltages (
Equation 2 describes the iCT process in terms of emission and trigger probabilities [19]. The iCT photons are peaked in the red—infrared region [2], where the detection of the NUV SiPMs is carried out by holes. Therefore, in Eq. 2, only the hole triggering probability
The triggering probabilities for hole- and electron-initiated avalanches (
where Vh and Ve describe the temperature-dependent mean energy required by a drifting carrier to extract charge with inelastic scattering. We found that the triggering probabilities for our data are better described in terms of
The fits of Eqs 2, 3 converge at Vh = 5.4(3) V and ξiCT = (53 ± 1)/kV with χ2/d.o.f. = 9/8, and α = −1.68(1) and δ = 1.031(8) with χ2/d.o.f. = 13/8. Figure 4 (solid black lines) shows the prediction of the model using these parameters.
Figure 4 also shows the branching Poisson (BP) and geometric chain (GC) models as described by Vinogradov [18, 24]. The top panel shows
Both models depart from data by more than 10% at the highest over-voltages. Our data are better modeled by the sum of two binomial processes with probabilities 85% ⋅ λiCT and 15% ⋅ λiCT. In this way, each avalanche can generate 0, 1, or 2 photo-electrons in neighboring cells, where a similar process occurs recursively. The accuracy of this effective model is better than 0.2% for the resulting mean number of iCT photo-electrons and their generalized Fano factors.
After-pulsing was studied by Ref. [12], and the over-voltages used here do not exceed 10%. The primary dark rate (DCR) does not exceed 20 cps per photo-sensor under cryogenic conditions. As a first approximation, we do not consider these quantities.
3.2 External cross-talk
The eCT contribution is measured directly by scanning over-voltages with one photo-detector (source) while holding the other (target) at a constant value.
Figure 5 shows the relative increase in LYG measured by the target versus the over-voltage of the source. In this case, the calibration peak can no longer be modeled as a Gaussian model. The LYG of the target detector is estimated by the mean of the distribution, with the
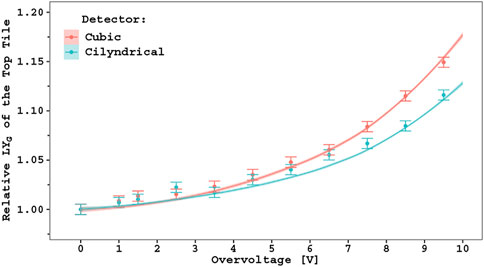
FIGURE 5. External cross-talk versus over-voltage. This shows the relative amount of light observed at the top photo-detector (target at the over-voltage of 8.5 V) for different over-voltages set at the bottom photo-detector (source). The light yield is scaled to 0 V over-voltage. The solid lines represent the toy Monte Carlo fit to the data described in Section 3.3. The small confidence intervals around the lines come from the statistical fluctuation of approximately 109 photons in the simulation, not from the uncertainty of the fit parameters.
With equal tile biases (Figure 3), similar values of L
3.3 Toy Monte Carlo simulation
To quantify the different oCT components, a toy Monte Carlo (tMC) simulation is developed. The tMC models the detection of primary photons and the intertwined cross-talk photo-electrons as a recursive binomial process, similar to the geometric compound process from Vinogradov [18] described in Section 3.1. Photon tracking is not part of the tMC, and only the overall acceptances (ξx) for each sub-process (primary photo-electrons, iCT, fCT, and eCT) are used.
The tMC assumes a symmetric detector, which is justified by Figure 6, where the top–bottom asymmetry (TBA) is shown for the cubic chamber. The TBA is defined, at the event level, as the difference in photo-electrons observed at the top and bottom tiles normalized to the total number of collected photo-electrons. Under this hypothesis, the following quantities are defined:
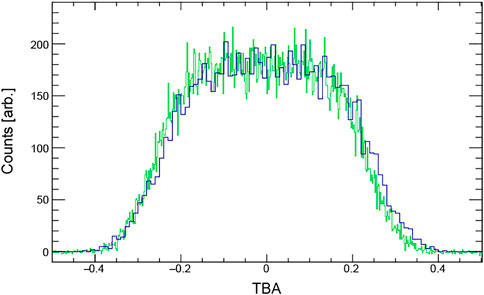
FIGURE 6. Top–bottom asymmetry (TBA) using the
Equation 5 defines the probability of detecting a primary photon absorbed in the sensitive regions of the SiPM. It is given as the sum of the triggering probabilities, as defined in Eq. 4, weighted for the fraction of the avalanches induced by electrons (ζ) or holes (1 − ζ), see Ref. [22], and asymptotically approaches to unity. The photon-detection efficiency (PDE) can be modeled as PDE = a ⋅ PPDE, with an acceptance coefficient (a < 1) that includes the surface reflections and probability of photons materializing outside the sensitive regions. Equation 6 generalizes Eq. 2, modeling the probability of emission and detection of cross-talk photo-electrons as a function of the bias of the source and of the target photo-detectors. For iCT and fCT, VS and VT coincide. The acceptance parameters are ξfCT, ξeCT, and ξiCT, the last of which is set to the value obtained from Eq. 2.
χ2 is minimized by comparing the experimental data of the over-voltage scan against the simulated curves by variation of five free parameters, as shown in Figure 5. The resulting parameters for both the cubic and cylindrical chambers are reported in Table 1. An average accuracy better than 1.5 photo-electrons is achieved, with a relative resolution better than 0.3%.
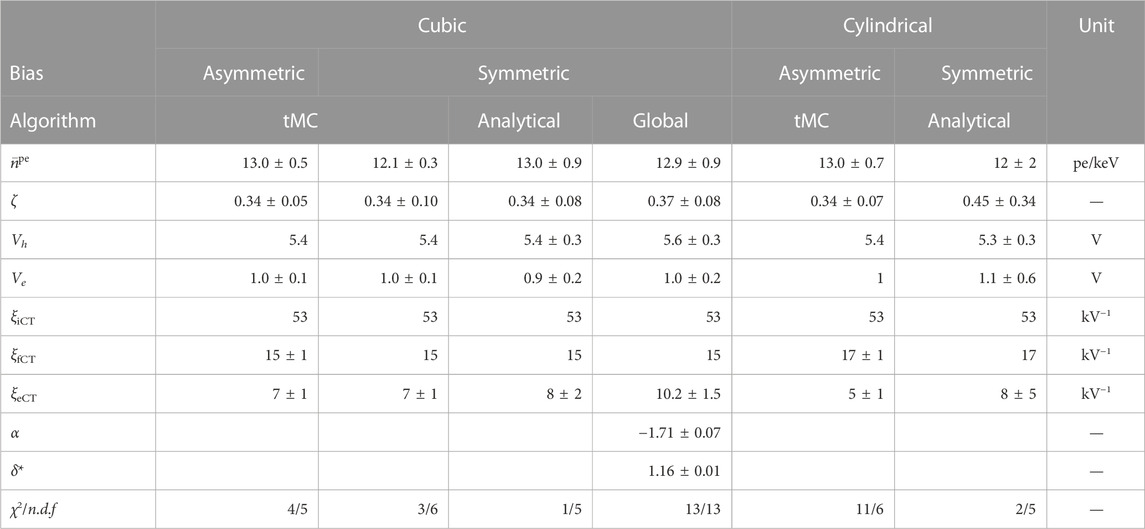
TABLE 1. Results of the fits to the data for the cubic and the cylindrical chambers. Asymmetric biasing refers to the eCT scan where one photo-detector (target) is kept at constant bias and the other (source) is scanned over the range 0–10 V over-voltage, see Section 3.2. Symmetric biasing corresponds to normal operation where both photo-detectors are held at the same bias. The tMC, the analytical model, and the global fits are reported for the cubic chamber. The parameters without errors are fixed, while Vh (when not fixed) has a penalty in χ2 at (5.4 ± 0.3) V (see text).
3.4 Analytical model
An analytical model is independently developed based on simple mathematical assumptions; the tMC helps validate this model. The basic assumption of the model is that the iCT recursive process introduces a photo-electron gain (μ) that can be generalized in the presence of mutually interacting iCT and fCT (described by λfCT in analogy to λiCT) as follows:
which is valid only for λiCT + λfCT ≪ 1.
Equation 8 represents the mean number of photo-electrons in the presence of iCT and fCT for an event of energy, E.
where the parameter
With two SiPM arrays and in the presence of external cross-talk, we can define
Assuming a symmetric chamber with the same bias for both photo-detectors, Eq. 9 simplifies as if there was only a single photo-detector with λoCT = λiCT + λfCT + λeCT:
Equation 11 can be fit to the experimental data: it contains seven parameters:
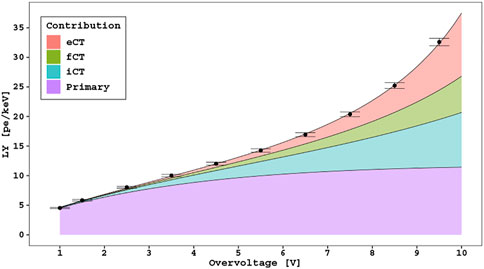
FIGURE 7. Breakdown of the CT components from the analytical model for the measured LYG for the cubic chamber using
3.5 Energy resolution
Another quantity of primary importance for particle detectors is the energy resolution. In our case, due to iCT, the resolution diverges from the Poissonian limit as described by a larger-than-unity generalized Fano factor, which is introduced in Section 3.1. The presence of fCT and eCT further increases this divergence. Analogous with Eq. 3, we define a global generalized Fano factor from cross-talk contributions as
where α is the same as defined for the iCT only (Section 3.1). δ* includes the contribution from the SiPMs, plus the spread introduced by the argon scintillation [25] and TPB wavelength shifter [26]. This results in
which can be fit to the experimental data.
For the cubic chamber, with
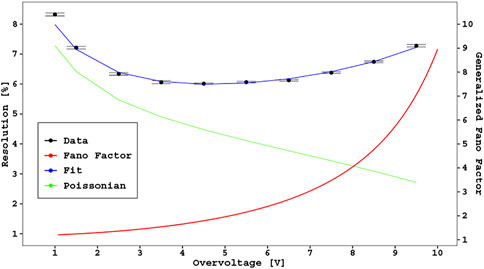
FIGURE 8. Energy resolution of the cubic chamber using
3.6 Global fit
We combine LYG, and the resolution fits into a global χ2 with the goal of reducing the uncertainty on the results. We obtain
where LYG(V) is predicted by the analytical model instead of the experimental data. The results of the χ2 minimization of Eq. 14 are summarized in Table 1.
4 Optics
Dedicated Monte Carlo simulation software based on Geant4 [27] is developed, with the main focus on tracking the photons in the detectors under study. The simulation includes wavelength shifting, reflection, refraction, and absorption. Additionally, it incorporates the LAr scintillation process originating from particle interactions in LAr. The inner surface of the active LAr volume is almost entirely covered with TPB, and the wavelength-shifting efficiency of TPB is set to unity in the model.
A full model of the system is implemented, along with the surrounding LAr buffer and the detector geometry. Refractive indices, attenuation lengths, and surface properties of LAr, TPB, ESR foil, fused-silica windows, and SiPMs are included with adequate approximations. Some of these parameters were taken from the literature, and some were measured in dedicated setups. In particular, measurements of the wavelength-dependent reflectivity of the TPB-coated ESR foil (approximately 96%) and SiPM surface (approximately 17%) are reported in Ref. [12].
To estimate the light collection efficiency of the detector under study, 41.5 keV electrons are generated uniformly over the active volume, simulating the energy deposition from the
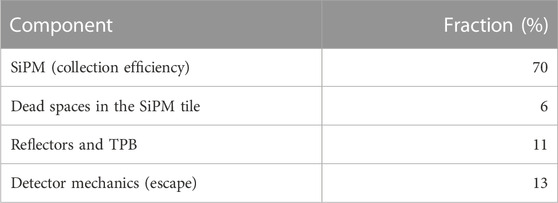
TABLE 2. Fraction of simulated photons absorbed by different detector components. Absorption by SiPMs represents the light collection efficiency of the system. Absorption by detector mechanics implies that the light escapes from the optical system of the detector.
Several issues arise when modeling the optics, the most important of which are: (1) the nature of the optical interface between the fused-silica window and TPB not being well understood and (2) the reflectivity of the SiPM, which has a multi-layer anti-reflective coating, is measured in air and projected to the LAr medium [12]. These issues affect the aforementioned light collection efficiency, and, hence, we estimate a systematic uncertainty of ±5% on its absolute value.
With the collection efficiency, it is possible to predict the LY of the system. Assuming that the PDE of the SiPM does not change by more than 10% with respect to the measurements at room temperature [11] and 100% for the TPB VUV conversion efficiency [28], the optical model predicts a net light yield of 11.7 ± 1.3 photo-electrons/keV at the over-voltage of 6 V, which is in agreement with the value reported in Figure 7.
5 Conclusion
In this work, we parametrized the over-voltage dependence of optical cross-talk (oCT) in two small LAr chambers equipped with large SiPM arrays using an inclusive oCT model. The model involving internal (iCT) and external (fCT and eCT) components well describes the observed gross light yield and energy resolution, thus providing a plausible estimate of the contributions from primary photo-electrons and different cross-talk components. We obtain a net light yield value of up to 12 ± 1 photo-electrons/keV, which is one of the best light yield values obtained for an experimental setup using LAr. Despite the high net light yield, the oCT of the SiPMs becomes dominant above 7.7 V, significantly compromising the energy resolution of the detectors. Since SiPMs from any vendor are affected by external cross-talk, we recommend that previous results obtained using silicon readouts should be re-evaluated with a similar analysis.
Encouragingly, an effective parametrization of the oCT generation at cryogenic temperatures has been provided for the FBK NUV-HD-Cryo SiPMs. Even if the optical model of the chamber is tuned for the argon scintillation photons (in the UV/blue) and the optical cross-talk happens at longer wavelengths, we can use the collection efficiency as a first approximation to estimate the acceptances of fCT and eCT: ξfCT + eCT ≃ .6 ξiCT. This implies that for every two photons trapped in the silicon bulk (candidates for iCT), one escapes through the front window.
Data availability statement
The raw data supporting the conclusion of this article will be made available by the authors, without undue reservation.
Author contributions
All authors listed have made a substantial, direct, and intellectual contribution to the work and approved it for publication. All authors contributed to the article and approved the submitted version.
Acknowledgments
The authors acknowledge support from the Istituto Nazionale di Fisica Nucleare (Italy) and Laboratori Nazionali del Gran Sasso (Italy) of INFN, from NSF (US, Grants PHY-1622415 and PHY-1812540 for Princeton University), from the Royal Society United Kingdom and the Science and Technology Facilities Council (STFC), part of the United Kingdom Research and Innovation, from the European Union’s Horizon 2020 Research and Innovation Programme under grant agreement no. 952480 (DarkWave project), and from the International Research Agenda Programme AstroCeNT (MAB/2018/7) funded by the Foundation for Polish Science (FNP) from the European Regional Development Fund.
Conflict of interest
The authors declare that the research was conducted in the absence of any commercial or financial relationships that could be construed as a potential conflict of interest.
Publisher’s note
All claims expressed in this article are solely those of the authors and do not necessarily represent those of their affiliated organizations, or those of the publisher, the editors, and the reviewers. Any product that may be evaluated in this article, or claim that may be made by its manufacturer, is not guaranteed or endorsed by the publisher.
Footnotes
1The SNR is defined as an average signal for the single photo-electron over the baseline noise at one sigma, both under the same filtering condition.
References
1. Newman R. Visible light from a silicon p − n junction. Phys Rev (1955) 100:700–3. doi:10.1103/PhysRev.100.700
2. Mirzoyan R, Kosyra R, Moser HG. Light emission in Si avalanches. Nucl Instrum Methods Phys Res A (2009) 610:98–100. doi:10.1016/j.nima.2009.05.081
3. Nepomuk Otte A. On the efficiency of photon emission during electrical breakdown in silicon. Nucl Instr Methods Phys Res Sect A: Acc Spectrometers, Detectors Assoc Equip (2009) 610:105–9. doi:10.1016/j.nima.2009.05.085
4. Nagai A, Alispach C, Berghöfer T, Bonanno G, Coco V, della Volpe D, et al. Sense: A comparison of photon detection efficiency and optical crosstalk of various SiPM devices. Nucl Instr Methods Phys Res Sect A: Acc Spectrometers, Detectors Assoc Equip (2018) 912:182–5. doi:10.1016/j.nima.2017.11.018
5. McLaughlin JB, Gallina G, Retière F, De St Croix A, Giampa P, Mahtab M, et al. Characterisation of SiPM photon emission in the dark. Sensors (2021) 21:5947. doi:10.3390/s21175947
6. Agostini M, Altenmüller K, Appel S, Atroshchenko V, Bagdasarian Z, Basilico D, et al. Comprehensive measurement of pp-chain solar neutrinos. Nature (2018) 562:505–10. doi:10.1038/s41586-018-0624-y
7. Richard E, Okumura K, Abe K, Haga Y, Hayato Y, Ikeda M, et al. Measurements of the atmospheric neutrino flux by super-kamiokande: Energy spectra, geomagnetic effects, and solar modulation. Phys Rev D (2016) 94:052001. doi:10.1103/PhysRevD.94.052001
8. Amerio S, Amoruso S, Antonello M, Aprili P, Armenante M, Arneodo F, et al. Design, construction and tests of the ICARUS T600 detector. Nucl Instrum Meth A (2004) 527:329–410. doi:10.1016/j.nima.2004.02.044
9. Abi B, Acciarri R, Acero MA, Adamov G, Adams D, Adinolfi M, et al. Prospects for beyond the standard model physics searches at the deep underground neutrino experiment. Eur Phys J C (2021) 81:322. doi:10.1140/epjc/s10052-021-09007-w
10. Ajaj R, Amaudruz PA, Araujo GR, Baldwin M, Batygov M, Beltran B, et al. Search for dark matter with a 231-day exposure of liquid argon using DEAP-3600 at SNOLAB. Phys Rev D (2019) 100:022004. doi:10.1103/PhysRevD.100.022004
11. Aalseth CE, Acerbi F, Agnes P, Albuquerque IFM, Alexander T, Alici A, et al. DarkSide-20k: A 20 tonne two-phase LAr TPC for direct dark matter detection at LNGS. Eur Phys J Plus (2018) 133:131. doi:10.1140/epjp/i2018-11973-4
12. Boulay MG, Camillo V, Canci N, Choudhary S, Consiglio L, Flammini A, et al. Direct comparison of PEN and TPB wavelength shifters in a liquid argon detector. Eur Phys J C (2021) 81:1099. doi:10.1140/epjc/s10052-021-09870-7
13. Agnes P, Alexander T, Alton A, Arisaka K, Back H, Baldin B, et al. First results from the DarkSide-50 dark matter experiment at Laboratori Nazionali del Gran Sasso. Phys Lett B (2015) 743:456–66. doi:10.1016/j.physletb.2015.03.012
14. Kochanek I. Packaging strategies for large SiPM-based cryogenic photo-detectors. Nucl Instrum Methods Phys Res A (2020) 980:164487. doi:10.1016/j.nima.2020.164487
15. Gola A, Acerbi F, Capasso M, Marcante M, Mazzi A, Paternoster G, et al. NUV-sensitive silicon photomultiplier technologies developed at Fondazione Bruno Kessler. Sensors (2019) 19:308. doi:10.3390/s19020308
16. D’Incecco M, Galbiati C, Giovanetti GK, Korga G, Li X, Mandarano A, et al. Development of a novel single-channel, 24 cm2, SiPM-based, cryogenic photodetector. IEEE Trans Nucl Sci (2018) 65:591–6. doi:10.1109/TNS.2017.2774779
17. Adhikari P, Ajaj R, Araujo G, Batygov R, Beltran B, Bina C, et al. The liquid-argon scintillation pulseshape in DEAP-3600. Eur Phys J C (2020) 80:303. doi:10.1140/epjc/s10052-020-7789-x
18. Vinogradov S, Vinogradova T, Shubin V, Shushakov D, Sitarsky K. Probability distribution and noise factor of solid state photomultiplier signals with cross-talk and afterpulsing. In: 2009 IEEE Nuclear Science Symposium Conference Record (NSS/MIC) (2009). p. 1496–500. doi:10.1109/NSSMIC.2009.5402300
19. Nagai A, Alispach C, Barbano A, Coco V, della Volpe D, Heller M, et al. Characterization of a large area silicon photomultiplier. Nucl Instr Methods Phys Res Section A: Acc Spectrometers, Detectors Associated Equipment (2019) 948:162796. doi:10.1016/j.nima.2019.162796
20. McIntyre RJ. Theory of microplasma instability in silicon. J Appl Phys (1961) 32:983–95. doi:10.1063/1.1736199
21. Otte ANO, Garcia D, Nguyen T, Purushotham D. Characterization of three high efficiency and blue sensitive silicon photomultipliers. Nucl Instr Methods Phys Res Section A: Acc Spectrometers, Detectors Assoc Equip (2017) 846:106–25. doi:10.1016/j.nima.2016.09.053
22. Zappalà G, Acerbi F, Ferri A, Gola A, Paternoster G, Regazzoni V, et al. Study of the photo-detection efficiency of FBK high-density silicon photomultipliers. J Instrum (2016) 11:P11010. doi:10.1088/1748-0221/11/11/p11010
23. Dinu N, Nagai A, Para A. Breakdown voltage and triggering probability of SiPM from IV curves at different temperatures. Nucl Instr Methods Phys Res Section A: Acc Spectrometers, Detectors Assoc Equip (2017) 845:64–8. doi:10.1016/j.nima.2016.05.110
24. Vinogradov S. Analytical models of probability distribution and excess noise factor of solid state photomultiplier signals with crosstalk. Nucl Instrum Methods Phys Res A (2012) 695:247–51. doi:10.1016/j.nima.2011.11.086
25. Doke T, Hitachi A, Kubota S, Nakamoto A, Takahashi T. Estimation of Fano factors in liquid argon, krypton, xenon and xenon-doped liquid argon. Nucl Instr Methods (1976) 134:353–7. doi:10.1016/0029-554X(76)90292-5
26. Francini R, Montereali RM, Nichelatti E, Vincenti MA, Canci N, Segreto E, et al. VUV-Vis optical characterization of tetraphenyl-butadiene films on glass and specular reflector substrates from room to liquid argon temperature. J Instrum (2013) 8:P09006. doi:10.1088/1748-0221/8/09/p09006
27. Allison J, Amako K, Apostolakis J, Arce P, Asai M, Aso T, et al. Recent developments in Geant4. Nucl Instrum Methods Phys Res A (2016) 835:186–225. doi:10.1016/j.nima.2016.06.125
Keywords: liquid argon detector, light yield, SiPM, cross-talk, correlated noises
Citation: Boulay MG, Camillo V, Canci N, Choudhary S, Consiglio L, Flammini A, Galbiati C, Ghiano C, Gola A, Horikawa S, Kachru P, Kochanek I, Kondo K, Korga G, Kuźniak M, Mazzi A, Moharana A, Nieradka G, Paternoster G, Razeto A, Sablone D, Thorpe TN, Türkoğlu C, Wang H, Rescigno M and Sanfilippo S (2023) SiPM cross-talk in liquid argon detectors. Front. Phys. 11:1181400. doi: 10.3389/fphy.2023.1181400
Received: 07 March 2023; Accepted: 24 April 2023;
Published: 16 May 2023.
Edited by:
Bayarto Lubsandorzhiev, Institute for Nuclear Research (RAS), RussiaReviewed by:
Atanu Pathak, Purdue University Northwest, United StatesIvashkin Alexander, Institute for Nuclear Research (RAS), Russia
Copyright © 2023 Boulay, Camillo, Canci, Choudhary, Consiglio, Flammini, Galbiati, Ghiano, Gola, Horikawa, Kachru, Kochanek, Kondo, Korga, Kuźniak, Mazzi, Moharana, Nieradka, Paternoster, Razeto, Sablone, Thorpe, Türkoğlu, Wang, Rescigno and Sanfilippo. This is an open-access article distributed under the terms of the Creative Commons Attribution License (CC BY). The use, distribution or reproduction in other forums is permitted, provided the original author(s) and the copyright owner(s) are credited and that the original publication in this journal is cited, in accordance with accepted academic practice. No use, distribution or reproduction is permitted which does not comply with these terms.
*Correspondence: A. Razeto, cmF6ZXRvQGluZm4uaXQmI3gwMjAwYTs=