 Dario Giannotti1,2†
 Edoardo Suerra2,3†
 Francesco Canella2,4†
 Simone Cialdi2,3†Paolo Laporta1,4†
 Gianluca Galzerano2,4*†
- 1Politecnico di Milano, Milano, Italy
- 2Istituto Nazionale di Fisica Nucleare, Milano, Italy
- 3Università Degli Studi di Milano, Milano, Italy
- 4Istituto di Fotonica e Nanotecnologie, CNR, Milano, Italy
A general-purpose method based on the implementation of the asymmetric Pound–Drever–Hall (PDH) technique is proposed to measure the carrier-envelope offset (CEO) frequency of a mode-locked laser using an external optical cavity. By analyzing the synchronously demodulated signal of the spectrally filtered cavity reflection when the optical resonator is locked to the mode-locked laser, a discriminating signal depending on the relative frequency offset between the mode-locked and optical cavity comb-like spectra is obtained. For a given geometry and group delay dispersion (GDD) of the cavity parameters (i.e., a known cavity mode offset), this signal can be used to retrieve the laser CEO. This approach turns out to be advantageous in terms of setup complexity with respect to other well-known techniques that rely on non-linear frequency generation, such as f–2f interferometers. In addition, this method can be used to precisely determine the laser–cavity spectral coupling, which is an important topic in cavity-enhanced spectroscopy and non-linear optics applications. After the theoretical description of the generalized asymmetric PDH signal, an experimental validation of the proposed method is reported using an Er-doped fiber frequency comb source centered at 1,550 nm, with a repetition rate of 250 MHz, locked to a linear optical cavity with a 1 GHz free spectral range. The theoretical effect of the GDD is confirmed experimentally using different cavity configurations. Moreover, the comparison with the CEO frequency values measured using an f–2f interferometer demonstrates the feasibility of the proposed method.
1 Introduction
The measurement and control of the spectral properties of optical frequency comb synthesizers [1–3], namely, the carrier-envelope offset (CEO) frequency and comb frequency spacing (repetition rate), are a fundamental experimental aspect for high-resolution and precision spectroscopy [4–6] and extreme light generation [7–10], especially when enhanced by the use of passive high-finesse optical cavities [11]. Although the comb repetition rate frequency can be easily measured using a simple fast photodetector, the measurement of the CEO frequency requires dedicated complex experimental methods. Usually, the CEO frequency can be detected using a so-called f–2f interferometer [12, 13] via a beat note between the higher-frequency end of the comb spectrum and the frequency-doubled lower-frequency end, if the optical spectrum covers an optical octave. Other methods that are less demanding in terms of spectral width of the comb spectrum make use of higher-order non-linear processes, such as 2f-to-3f schemes [14, 15]. However, non-linear interferometry requires the generation of a broadband supercontinuum and high-order harmonics that may be difficult to achieve with a frequency comb with a large mode spacing higher than 10 GHz as in microresonator and quantum cascade combs [16, 17], due to the very low peak power of the pulses. Several research groups have proposed alternative techniques that do not involve non-linear interferometry to measure the CEO frequency. For example, multi-heterodyning methods (or dual-comb methods) were developed in 2011 but at the price of increasing the complexity of the experimental setup using an additional CEO-stabilized frequency comb with a different repetition rate [18]. In 2015, the combination and manipulation of different beat note signals between the optical frequency comb and an additional reference CW laser have been proposed to extract the contribution of the CEO frequency [19], while spectrally and spatially resolved multiple-path interferometry [20] and Fabry–Perot interference transmission pattern analysis [21] demonstrated a precision of a few MHz only in determining the CEO value, but without providing any information on the CEO noise spectrum.
Here, we propose a spectral interferometric method for measuring the CEO frequency of an optical frequency comb based on an external optical resonator and the asymmetric Pound–Drever–Hall technique. The measurement of the asymmetric Pound–Drever–Hall signal allows the determination of the CEO frequency with a fractional precision of 0.87% of the comb repetition rate, as confirmed by the experimental comparison with respect to the traditional f–2f non-linear interferometer. The paper first presents the detailed theory of the proposed method and then describes the experimental validation using a commercial Er-doped fiber frequency comb operating at 1.5 μm and equipped with a non-linear f–2f interferometer module.
2 Theory
The technique presented in this work relies on a variation of the well-known Pound–Drever–Hall (PDH) technique [22] called asymmetric PDH (a-PDH). In particular, a mode-locked laser oscillator is coupled to an external enhancement optical cavity, and its reflected beam is exploited to retrieve an electric signal, which in turn is proportional to the carrier-envelope offset (CEO) of the laser. For this reason, we start our theoretical discussion by modeling the coupling between a mode-locked laser oscillator and an enhancement optical cavity.
In the time domain, a mode-locked laser produces a train of pulses separated by time trt. In the frequency domain, these pulses produce a comb of frequencies equally spaced by the repetition rate
where
The uncompensated oscillator’s intracavity dispersion causes a phase displacement between one pulse and the following, usually called carrier-envelope phase (CEP) slippage ϕcep [25]. The CEP induces a frequency shift of the whole comb structure of
where n is an integer, k = 2πν/c is the wave vector, L is the total cavity length, ϕG is the Gouy phase, and ϕD is an additional phase term due to the dispersion of the elements of the cavity (e.g., air and mirror dielectric coatings). By expanding the phase term in Eq. 3 around the frequency
The term
so that the laser and the enhancement cavity mode frequencies have the same comb-like structure. The resonance condition between the laser and cavity is kept in time exploiting the well-known PDH technique [22], which consists of frequency modulating the laser field at a frequency Ω and then demodulating the cavity-reflected field at the same frequency Ω. In a few algebraic steps, it can be shown that the field A (ν) reflected from the cavity can be expressed as [29]
where r(ν) is the reflectivity of the cavity at the frequency ν, expressed as the ratio between the input and the reflected fields. The PDH error signal ϵpdh corresponding to each laser mode νm can be written as [29]
where Φ is the phase shift between the signal and the local oscillator. We obtain the total error signal by adding together the contributions given by all the comb modes, weighted over their spectral power:
Let m0 be the index of the laser mode corresponding to the barycenter of the spectrum S(ν), such that ∑S (νm) (m − m0) = 0. If we want to lock the comb of the laser to the comb of the cavity, the highest coupling is achieved when m0 = n0, so that the highest number of modes is matched. For small frequency variations around νm, the function ɛtot is proportional to the detuning between the laser and the cavity frequencies. Therefore, we can write ɛtot from Eq. 8, using Eqs 2–5, as
The PDH technique acts to minimize the mode detuning, and this happens when ɛtot = 0. Typically, a piezoelectric (PZT) actuator serves this purpose: ɛtot = 0 is processed by a proportional-integrator-derivative (PID) controller and then applied to a PZT-actuated mirror of the laser cavity, so that frep is modified. Alternatively, electro-optical modulators can be exploited for this scope, when a larger control bandwidth is required. Since m0 is the barycenter of the spectrum S (νm), ɛtot = 0 if
where we have introduced the relative offset foff = fceo − fcav. If foff = 0, the highest cavity–laser coupling is achieved for frep = FSR (Eq. 10), and the laser modes perfectly overlap with the cavity modes for each m. On the other hand, if foff ≠ 0, each mth mode has a detuning Δνc which depends on its distance from the spectrum barycenter δm = m − m0. This last condition is shown in Figure 1, where both the laser and the cavity combs are reported.The condition of Eq. 10 is satisfied, and the detuning Δνc can be written as
Therefore, the presence of the offset foff distances the lateral modes, resulting in less-efficient coupling [30]. We can conveniently rewrite Eq. 11 in terms of frequency detuning
where
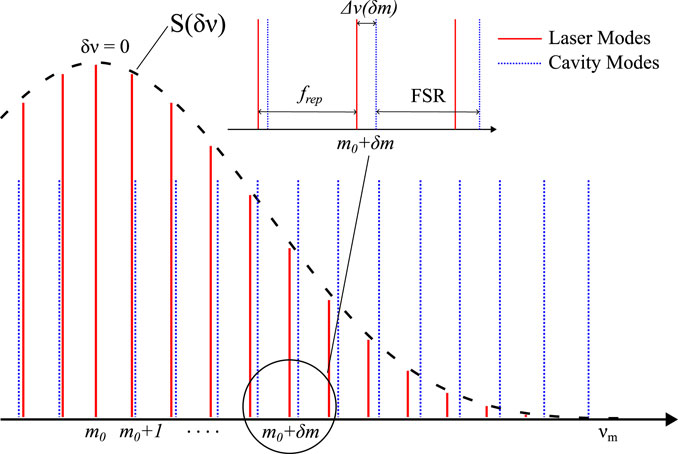
FIGURE 1. Laser (red, straight) and cavity (blue, dashed) frequency combs, when they are resonant at their respective tooth m0. Since foff ≠ 0, laser and cavity modes different from m0 are detuned by
At this point, we describe the effect of foff on the PDH error signal. The cavity reflectivity r in Eq. 6 can be written as a function of a generic detuning Δν between a laser and a cavity mode as
where
Note that, actually, ɛtot (foff) = 0 for every value of foff due to the PDH stabilization. In particular, the leftmost teeth with respect to m0 have a positive (or negative) detuning, while the rightmost teeth have a negative (or positive) detuning: the opposite contributions to the PDH are cancelled. For this reason, to retrieve a signal sensitive to foff, it is sufficient to perform spectral filtering of the PDH signal, so that the symmetrical compensation in the PDH signal is broken: we refer to this signal as asymmetric PDH (a-PDH). In the literature, similar spectral selections on the PDH signal have been used by Jones et al. [31] for a different purpose, namely, to lock the CEO of a mode-locked laser. Moreover, in [31], both the right and left wings of the spectrum were exploited simultaneously. If we perform a single-side spectral selection, the PDH signal of Eq. 15 becomes
where M(δν) is a generic filtering function, which is asymmetric with respect to the center of the spectrum (e.g., Heaviside step). ɛA changes depending on M(δν), as explained in Section 3, where we compare theoretical and experimental trends.
In the previous model, we have neglected the effect of the group delay dispersion (GDD). Now, we extend the theory of the a-PDH signal to take into account a non-negligible GDD. In particular, the dispersion in the enhancement cavity is taken into account by including an additional phase term ϕD in the round trip. When the laser and the cavity are coupled with the PDH technique, this term can be written in terms of the detuning δν and it is given by
where GDDi is the dispersion of the ith cavity elements, defined as the derivative of the group delay. As mentioned previously, the phase term of Eq. 17 causes a further frequency shift between the laser and cavity modes of
It is clear from Eq. 18 that ΔνD is an even function with respect to δν, and thus, the effect of the GDD translates every tooth of the comb in the same direction. From Eqs 13–18, the total detuning Δν results are obtained as
where
Note that, in this case, the term γ cannot be 0; thus, the cavity is not locked to the barycenter of the spectrum. To find γ and then obtain Δν from Eq. 20, we impose the conditions
and
Eq. 22 refers to the case of negligible GDD, while Eq. 23 gives us the displacement of the modes when the laser and the cavity are locked in the case of non-negligible GDD. It results in
where Δ2 corresponds to the variance of the spectrum S (δν). Finally, from Eqs 20, 24, the displacement
Using the reflectivity in Eq. 14 and the displacement in Eq. 25, the trend of the a-PDH signal can be obtained as a function of the offset foff, following the same calculations shown up to Eq. 16. As explained in Section 3, the effect of the GDD unbalances the a-PDH signal. In particular, looking at Eq. 21, if foff = 0, such that α = 0, the signum of the error signal ɛA (0) only depends on the sign of the total cavity dispersion ∑iGDDi.
Lastly, we have shown the mathematical treatment to describe the a-PDH signal, which depends on the mode offset foff = fceo − fcav between a laser and enhancement cavity combs, and we have shown the effect of the presence of GDD. Finally, by exploiting the linear region of ϵa, it is possible to invert the function using this signal to retrieve foff and, in turn, the CEO of the laser. As we show in the following sections, this can be performed by properly calibrating the a-PDH signal and by calculating the offset fcav of the cavity comb from the cavity geometry. The limitation to this technique is not tracking the phase of the CEO and therefore not providing a phase-coherent link between the optical oscillation and the microwave frequency. However, this does not represent an issue for many applications, such as stabilization [31].
3 Experimental setup
In this section, we describe the experimental setup used to validate the technique described in Section 2 and to measure the CEO of a mode-locked laser.
The setup used in this experiment is schematically shown in Figure 2.We used an M-comb Er-fiber mode-locked laser from Menlo Systems, whose spectrum is centered at 1,550 nm, with a repetition rate of 250 MHz. A computer allows the control of the frep and the CEO laser through a motorized translator and an intracavity wedge, respectively. The output laser beam is first spectrally selected with a 12 nm FWHM bandwidth, centered at 1,530 nm, with an interferometric filter (IF), and then frequency-modulated by an acoustic–optical modulator (AOM) at Ω = 1.54 MHz (AOM carrier frequency 81.274 MHz, and frequency modulation of ±1 MHz around the carrier) obtained from Gooch & Housego. The diffracted beam from the AOM (first order) is finally coupled to a two-mirror optical cavity with 1 GHz FSR. The input mirror is flat with a power reflection coefficient of 99.0%, while the other mirror is curved and with high reflectivity

FIGURE 2. Experimental setup. Red lines represent the laser beams, while black lines represent the electrical connections. IF, interferometer filter; HWP and QWP, λ/2 and λ/4 plates; PBS and BS, polarized beam splitter and beam splitter; MM lenses, mode-matching lenses; PD1/2/3, photodetector 1/2/3; DG, diffraction grating; L, lens; MS, mobile slit; LP filter, low-pass filter; OSC, oscilloscope.
4 Results
In this section, we experimentally characterize the a-PDH model as described previously, showing its dependence on the selected optical spectrum and the GDD. Then, we apply our technique to measure the CEO of a mode-locked laser, and we compare the results with the measurement obtained using an f–2f interferometer.
4.1 Effect of spectral selection
Figure 3A shows two spectral slices of approximately 2 nm FWHM, selected by the slit mount and collected by the spectral analyzer, in the position of PD2. The two selections, C1 and C2, lie at 5.5 nm (dashed blue line) and at 1.0 nm (solid red line) from the center of the full spectrum (black line), respectively. Figure 3B displays the experimental measurements and the theoretical curves from Eq. 16 of the a-PDH signal in the two respective spectral regions. The experimental points are collected using the following procedure. As mentioned in Section 2, the condition of optimal coupling between the laser and cavity, which allows having the greatest number of resonant modes, is when fceo = fcav, i.e., foff = 0. This condition, as shown in Refs [6, 30, 32], can be easily reached by observing the transmission peaks while fcav (or FSR) is scanning. The optimum coupling point is achieved when the side peaks to the central one (the highest) have symmetric heights. Setting this working point, we know that foff = 0, and we can record through PD2 and the demodulation process the value of ɛA (foff). From here, by moving the laser CEO frequency to other working points, it is possible to collect the values of the a-PDH signal for several foff and thus reconstruct the whole curve. In these measurements, the CEO of the laser is kept monitored, thanks to the f–2f interferometer. The experimental points E_C1 and E_C2, shown in Figure 3B, are averaged over 100 acquisitions and normalized to the maximum to directly compare the two configurations C1 and C2. As visualized, ɛA (0) = 0, and therefore, as mentioned previously in Section 2, the dispersion of the cavity is negligible. It is important to note a central area where the signal grows linearly with foff and then returns to 0 at both extremes. The two curves T_C1 and T_C2 are instead drawn following the equations of the previous theoretical section: we calculated the reflectivity of the cavity from Eq. 14, with the reflectances of the mirrors obtained from the cavity finesse, measured following the method described in [33]. Then, using the spectrum analyzer, we have recorded the C1 and C2 cuts as a function of the wavelength (M(λ)S(λ)). Finally, we calculated ɛA from Eqs 7–16 and plotted in Figure 3B. Since the spectra deal with wavelength, we made a change in variables in the mentioned equations as
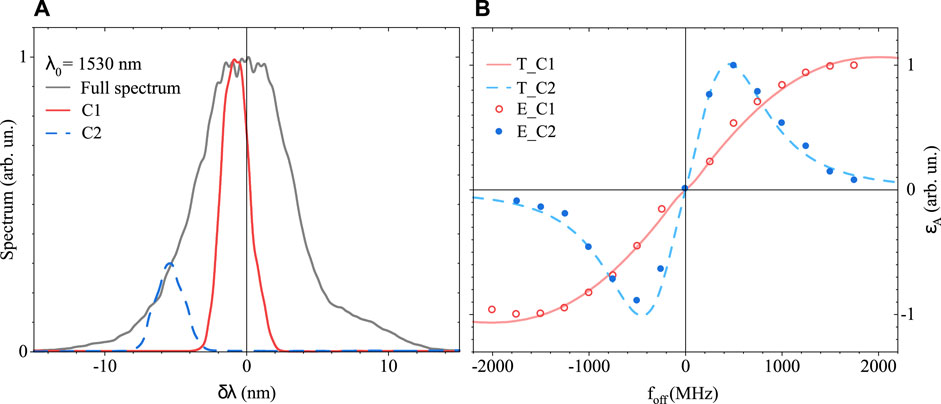
FIGURE 3. (A) Full spectrum (black line) reflected from the cavity and the two cuts C1 (red line) and C2 (dashed blue line) collected by the spectral analyzer in the PD2 position. (B) Experimental measure (E_C1 and E_C2 dots) of the a-PDH signal compared with our developed theory of ɛA (T_C1 and T_C2 curves), taken in the two configurations C1 (red line) and C2 (dashed blue line). Data are normalized to the maximum.
Our model faithfully reconstructs the a-PDH signal taken for different spectra, emphasizing the flexibility of the technique. Selecting a spectrum closer to the center (red trace), the range of signal linearity is increased (from approximately 480 MHz to 1.1 GHz in our case), which is fundamental for the direct measurement of foff. The shape of the a-PDH curve, especially where its dependence on foff is linear, can be modified to meet different requirements. Therefore, the choice of the spectrum cut makes the signal adaptable to multiple needs, allowing tuning its sensitivity and range.
4.2 Effect of group delay dispersion
Another parameter that distorts the a-PDH signal is the group delay dispersion of the cavity. As mentioned previously, in our configuration, since the resonator has two mirrors and an FSR of 1 GHz (2Lcav = 30 cm), the effects of the total group delay dispersion (GDD), given by the air (GDDair < 5 fs2) and the individual mirror (GDDmirror = 5 fs2) on the a-PDH curve, are negligible. Therefore, to study a case with different GDDs, we acted on the cavity by flipping the entrance mirror. In this way, the laser pulses pass through the mirror silica substrate before being reflected from the coating, experiencing additional dispersion. Knowing its thickness (7.5 mm) and the material (fused silica [34]), we have estimated a dispersion of approximately GDDcavity = −1,700 fs2 for this second configuration. (Note that the pulses cross the mirror eight times in a round trip of frep = 250 MHz). Figure 4 shows the experimental results of these two configurations of low dispersion (D1) and high dispersion (D2). Figure 4A shows the selected spectrum: for both cases, the same region was selected (5.0 nm from the center; 3 nm FWHM width). The experimental points, E_D1 and E_D2, and the theoretical curves of T_D1 and T_D2, are taken into account with the procedure previously described and are shown in Figure 4B. As predicted by our model, the effect of the GDD is to distort the a-PDH signal (the heights of the two peaks are no longer symmetrical) and to shift the foff frequency for which the signal is 0. With a GDD of approximately −1,700 fs2, the ɛA (foff) reaches 0 when the foff frequency is approximately 200 MHz. Moreover, as mentioned in Section 2, the negative sign of the dispersion in our second configuration is noticeable by examining the sign of ɛA (0) < 0. For both low-GDD (green line) and high-GDD (orange line) cases, our theoretical model follows the experimental data well, demonstrating the correct dependence of the a-PDH curve on the cavity dispersion.
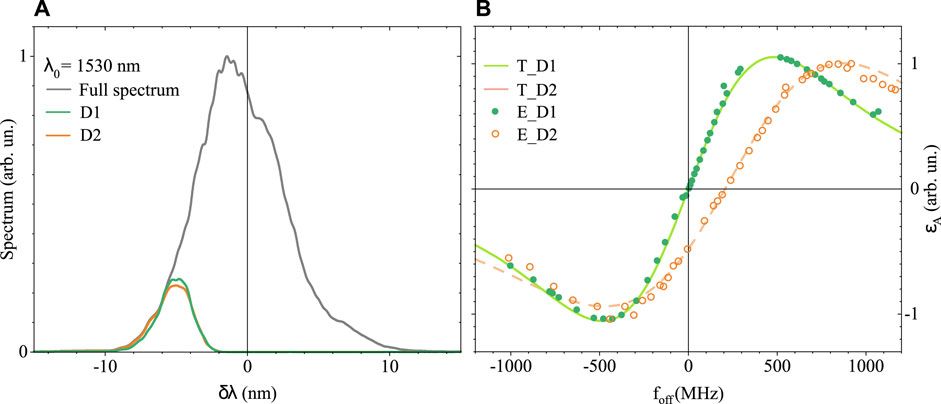
FIGURE 4. (A) Full spectrum (black line) reflected from the cavity and the cuts of the two configurations of low dispersion D1 (green line) and high dispersion D2 (orange line) collected by the spectral analyzer in the PD2 position. (B) Experimental measure (E_D1 and E_D2 dots) of the a-PDH signal compared with our developed theory of ɛA (T_D1 and T_D2 curves), taken in the two dispersion configurations D1 (green line) and D2 (orange line). Data are normalized to the maximum. The T_D2 curve is plotted for GDD = −1,700 fs2.
4.3 CEO measurement
The second aim of our work is to exploit the a-PDH error signal of Eq. 16 to retrieve the value of the fceo. This is possible due to the one-to-one relationship between fceo and ϵA in the linear region of the error signal. Note that this signal needs to be calibrated first, and we perform this task as follows. The schematic of the calibration principle is shown in Figure 5. First, we performed a scan of frep by acting on the laser cavity, while monitoring the transmission of the external resonator. We set foff = 0 by changing the laser CEO until condition (Figure 5B) is reached, so that the transmission peaks are symmetrical with respect to the main one (k = 0). This condition corresponds to a perfect overlap of the laser and cavity combs, as clear from the central column of the figure, and thus, ϵA = 0. If we now stabilize to a secondary transmission peak of order k [conditions (Figure 5A) and (Figure 5C)], this corresponds to stabilizing the m0 tooth of the cavity to the m0 + k tooth of the laser. Thus, the detuning between two generic teeth m becomes
where we assume frep = 250 MHz because when
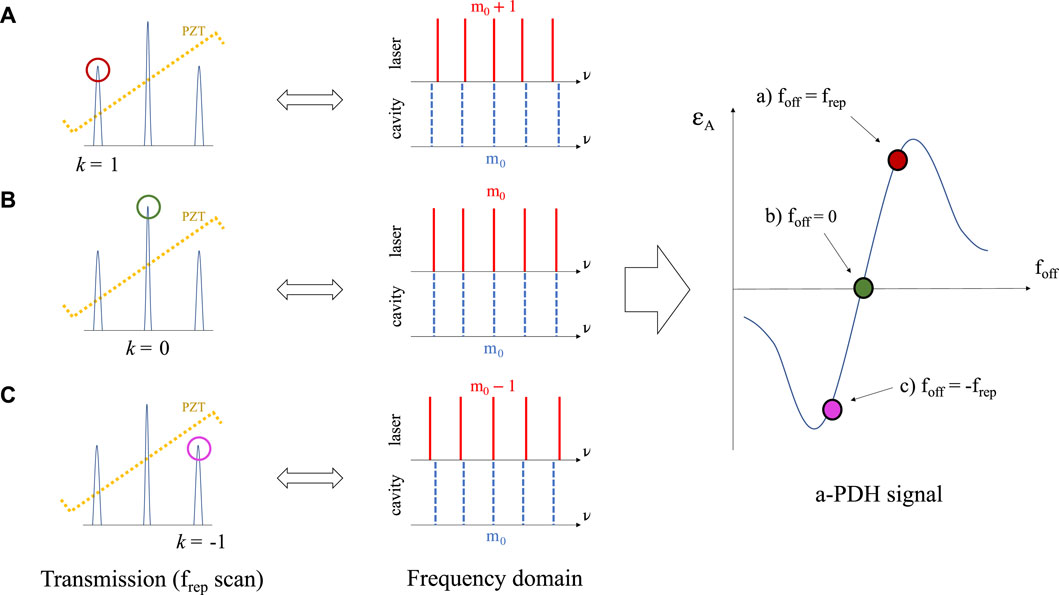
FIGURE 5. Scheme of the calibration method of the ɛA curve. Left column: the resonance peaks transmitted during the scan of the frep by the PZT actuator for foff = 0. Central column: the laser and cavity comb coupling corresponding to the stabilization conditions of cases (A–C) of the left column. Right column: calibration points of ɛA in conditions (A–C) (red, green, and purple points, respectively). Stabilizing the peaks closest to the main peak—case (B)—is equivalent to imposing foff = ±frep (conditions (A) and (C) of the left column).
Figure 6 shows the calibration made in our experimental setup, where, in the left box, the total and selected spectra for the a-PDH signal are reported, while in the right box, the calibration data and the fit of ϵA are plotted. As explained previously, the calibration process provides a one-to-one correspondence between the demodulated signal collected by PD2 and the foff within the linear region of ɛA. Once we have access to foff, we know that, by definition, foff = fceo − fcav, and therefore, we can obtain the CEO of the laser by fceo = foff − fcav. Figure 7 shows the measurement of fceo calculated from foff. After setting the laser CEO to the determined values, we compared the a-PDH signal with the previously calibrated curve to obtain the foff points. Exploiting an optical cavity with well-known parameters (e.g., geometry and Gouy phase), where fcav is known, the a-PDH signal provides access to the CEO of the laser. For a cavity with cylindrical symmetry, the resonant modes are regarded as Laguerre–Gaussian, and the offset fcav is given as
where mp is the stability parameter, which depends on the geometry of the cavity, and it is related to the coefficients of the roundtrip matrix [23]. In our experiment, we have fcav = 376 MHz. In Figure 7A, the values of the CEO obtained from the definition of foff are compared with those measured, at the same time, using the f–2f interferometer. For the comparison, the offset frequency is corrected to 81.247 MHz, due to the downshift introduced by the AOM. The CEO values are measured around the linear region of the a-PDH signal, ranging approximately from −70 MHz to 150 MHz, corresponding to a ɛA signal of −7.5 mV and 8 mV, respectively. Figure 7B shows the graph of the residuals: the average value is
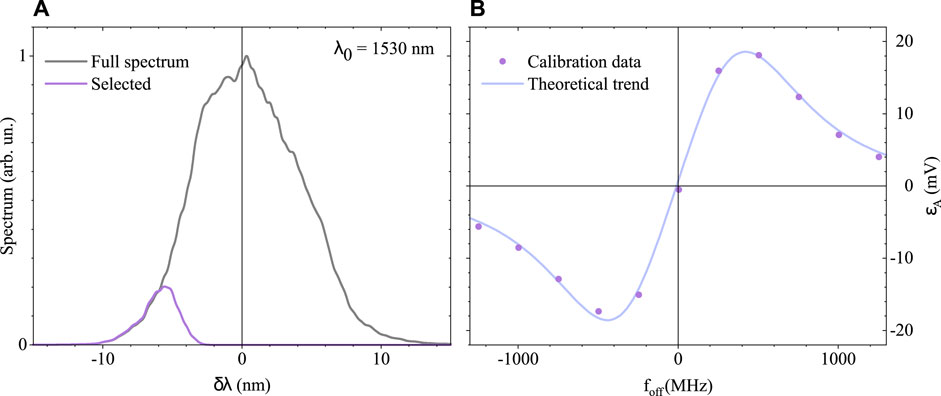
FIGURE 6. (A) Full spectrum (black line) reflected from the cavity and the chosen cut for the calibration measurement. (B) Dots: experimental data of the a-PDH taken at the secondary transmitted peaks (in our case, they are each frep = 250 MHz) used to calibrate the theoretical trend (line) of ɛA. The curve here is in mV.
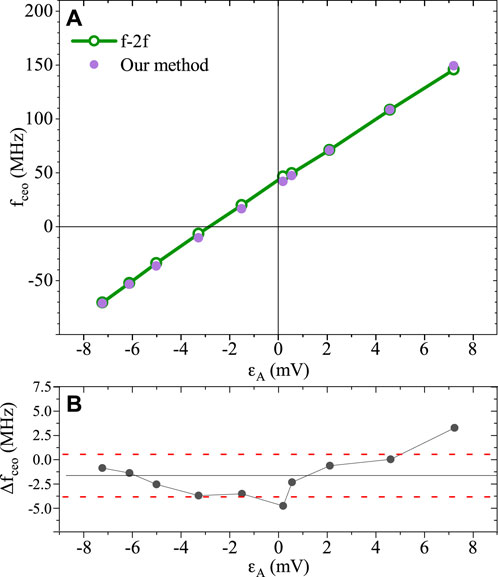
FIGURE 7. (A) Comparison of measurement of fceo of the laser using our method with the measurement made using an f–2f interferometer. The CEO was obtained from the a-PDH signal, previously calibrated knowing fcav of the cavity. (B) Graph of the residual value between the CEO measurements taken using a-PDH and f–2f interferometer. The dotted red lines represent the standard deviation ± σst.dev = 2.18 MHz for approximately
Briefly, once the a-PDH function has been calibrated, and the laser is locked to the cavity, the CEO of the laser can easily be measured via the PD2 photodetector in real time. Our technique for obtaining ɛA can be used with any known cavity. The theoretical treatment of the a-PDH signal thus opens up a series of possibilities in those techniques that exploit the signal reflected by the cavity after a suitable spectral selection.
5 Conclusion
We presented a theoretical description of the a-PDH signal as a function of the laser–cavity comb offset foff, showing its dependence on the selected spectrum and the group delay dispersion of the cavity. We experimentally proved the trends in different setup configurations, where both these parameters were varied. Then, exploiting a properly calibrated a-PDH signal, we measured the laser CEO of a commercial Er-doped fiber mode-locked laser, ranging between −70 MHz and 150 MHz, and validated the results with precise f–2f interferometer measurements. We obtained CEO values with a fractional precision of 0.87% with respect to the laser repetition rate. Because this technique does not require any non-linear frequency conversion, it has clear advantages in terms of the complexity of the experimental setup.
Data availability statement
The raw data supporting the conclusion of this article will be made available by the authors, without undue reservation.
Author contributions
DG, ES, and FC contributed to the conception and design of the study, data acquisition and analysis, and manuscript preparation. SC contributed to the conception and design of the study and the theory development. PL contributed to the conception and design of the study. GG contributed to the conception and design of the study and manuscript preparation. All authors contributed to the article and approved the submitted version.
Funding
The authors acknowledge financial support by the European Union’s NextGenerationEU Programme with the I-PHOQS Infrastructure (IR0000016, ID D2B8D520, CUP B53C22001750006), the Integrated Infrastructure Initiative in Photonic and Quantum Sciences, and Gruppo V of the INFN with the Ethiopia experiment.
Conflict of interest
The authors declare that the research was conducted in the absence of any commercial or financial relationships that could be construed as a potential conflict of interest.
Publisher’s note
All claims expressed in this article are solely those of the authors and do not necessarily represent those of their affiliated organizations, or those of the publisher, the editors, and the reviewers. Any product that may be evaluated in this article, or claim that may be made by its manufacturer, is not guaranteed or endorsed by the publisher.
References
1. Reichert J, Holzwarth R, Udem T, Hänsch TW. Measuring the frequency of light with mode-locked lasers. Opt Commun (1999) 172(1):59–68. doi:10.1016/s0030-4018(99)00491-5
2. Ye J, Hall JL, Diddams SA. Precision phase control of an ultrawide-bandwidth femtosecond laser: A network of ultrastable frequency marks across the visible spectrum. Opt Lett (2000) 25(22):1675. doi:10.1364/ol.25.001675
3. Fortier T, Baumann E. 20 years of developments in optical frequency comb technology and applications. Commun Phys (2019) 2:153. doi:10.1038/s42005-019-0249-y
4. Sulzer P, Högner M, Raab A-K, Fürst L, Fill E, Gerz D, et al. Cavity-enhanced field-resolved spectroscopy. Nat Photon (2022) 16(10):692–7. doi:10.1038/s41566-022-01057-0
5. Bernhardt B, Ozawa A, Jacquet P, Jacquey M, Kobayashi Y, Udem T, et al. Cavity-enhanced dual-comb spectroscopy. Nat Photon (2010) 4(1):55–7. doi:10.1038/nphoton.2009.217
6. Adler F, Thorpe MJ, Cossel KC, Ye J. Cavity-enhanced direct frequency comb spectroscopy: Technology and applications. Annu Rev Anal Chem (Palo Alto, Calif.) (2010) 3:175–205. doi:10.1146/annurev-anchem-060908-155248
7. Zhang C, Schoun SB, Heyl CM, Porat G, Gaarde MB, Ye J. Noncollinear enhancement cavity for record-high out-coupling efficiency of an extreme-uv frequency comb. Phys Rev Lett (2020) 125:093902. doi:10.1103/physrevlett.125.093902
8. Huang Z, Ruth RD Laser-electron storage ring. Phys Rev Lett (1998) 80:976–9. doi:10.1103/physrevlett.80.976
9. Suerra E, Giannotti D, Canella F, Drebot I, Capra S, Cipriani D, et al. A new method for spatial mode shifting of stabilized optical cavities for the generation of dual-color X-rays. Nucl Instrum Methods Phys Res A: Accel Spectrom Detect Assoc Equip (2021) 1019(0168-9002):165852. doi:10.1016/j.nima.2021.165852
10. Pupeza I, Zhang C, Högner M, Ye J. Extreme-ultraviolet frequency combs for precision metrology and attosecond science. Nat Photon (2021) 15(3):175–86. doi:10.1038/s41566-020-00741-3
11. Jason Jones R, Ye J. Femtosecond pulse amplification by coherent addition in a passive optical cavity. Opt Lett (2002) 27(20):1848–50. doi:10.1364/ol.27.001848
12. Telle HR, Steinmeyer G, Dunlop AE, Stenger J, Sutter DH, Keller U Carrier-envelope offset phase control: A novel concept for absolute optical frequency measurement and ultrashort pulse generation. Appl Phys B (1999) 69(4):327–32. doi:10.1007/s003400050813
13. Jones DJ, Diddams SA, Ranka JK, Stentz A, Windeler RS, Hall JL, et al. Carrier-envelope phase control of femtosecond mode-locked lasers and direct optical frequency synthesis. Science (2000) 288(5466):635–9. doi:10.1126/science.288.5466.635
14. Locke CR, Ivanov EN, Light PS, Benabid F, Luiten AN Frequency stabilisation of a fibre-laser comb using a novel microstructured fibre. Opt Express (2009) 17(7):5897–904. doi:10.1364/oe.17.005897
15. Hitachi K, Ishizawa A, Tadanaga O, Nishikawa T, Mashiko H, Sogawa T, et al. Frequency stabilization of an er-doped fiber laser with a collinear 2f-to-3f self-referencing interferometer. Appl Phys Lett (2015) 106(23):231106. doi:10.1063/1.4922553
16. Gaeta AL, Lipson M, Kippenberg TJ Photonic-chip-based frequency combs. Nat Photon (2019) 13(3):158–69. doi:10.1038/s41566-019-0358-x
17. Hugi A, Villares G, Blaser S, Liu HC, Faist J. Mid-infrared frequency comb based on a quantum cascade laser. Nature (2012) 492(7428):229–33. doi:10.1038/nature11620
18. Akbulut M, Davila-Rodriguez J, Ozdur I, Quinlan F, Ozharar S, Hoghooghi N, et al. Measurement of carrier envelope offset frequency for a 10 ghz etalon-stabilized semiconductor optical frequency comb. Opt Express (2011) 19(18):16851–65. doi:10.1364/oe.19.016851
19. Brochard P, Schilt S, Wittwer VJ, Südmeyer T. Characterizing the carrier-envelope offset in an optical frequency comb without traditional f-to-2f interferometry. Opt Lett (2015) 40(23):5522–5. doi:10.1364/ol.40.005522
20. Osvay K, Görbe M, Grebing C, Günter S. Bandwidth-independent linear method for detection of the carrier-envelope offset phase. Opt Lett (2007) 32(21):3095–7. doi:10.1364/ol.32.003095
21. Basnak DV, Bikmukhametov KA, AleksandrDmitriev K, Dmitrieva NI, Lugovoi AA, Pokasov PV, et al. Measurement of the carrier envelope offset frequency of a femtosecond frequency comb using a fabry—Perot interferometer. Quan Electro (2010) 40(8):733–8. doi:10.1070/qe2010v040n08abeh014354
22. Drever RWP, Hall JL, Kowalski FV, Hough J, Ford GM, Munley AJ, et al. Laser phase and frequency stabilization using an optical resonator. Appl Phys B (1983) 31(2):97–105. doi:10.1007/bf00702605
24. Helbing FW, Steinmeyer G, Keller U Carrier-envelope offset phase-locking with attosecond timing jitter. IEEE J Selected Top Quan Electro (2003) 9(4):1030–40. doi:10.1109/jstqe.2003.819104
25. Brabec T, Krausz F. Intense few-cycle laser fields: Frontiers of nonlinear optics. Rev Mod Phys (2000) 72:545–91. doi:10.1103/revmodphys.72.545
26. Siegman AE Lasers. Melville, NY: University Science Books (1986). Available at: https://books.google.it/books?id=1BZVwUZLTkAC.
27. Durand M, Wang Y, Lawall J. Accurate gouy phase measurement in an astigmatic optical cavity. Appl Phys B (2012) 108(4):749–53. doi:10.1007/s00340-012-5147-x
28. Petersen JC, Luiten AN Short pulses in optical resonators. Opt Express (2003) 11(22):2975–81. doi:10.1364/oe.11.002975
29. Eric D. An introduction to Pound–Drever–Hall laser frequency stabilization. Am J Phys (2001) 69(1):79–87. doi:10.1119/1.1286663
30. Canella F, Suerra E, Giannotti D, Galzerano G, Cialdi S. Low frequency-to-intensity noise conversion in a pulsed laser cavity locking by exploiting carrier envelope offset. Appl Phys B (2022) 128(11):205. doi:10.1007/s00340-022-07924-6
31. Jason Jones R, Diels J-C. Stabilization of femtosecond lasers for optical frequency metrology and direct optical to radio frequency synthesis. Phys Rev Lett (2001) 86:3288–91. doi:10.1103/physrevlett.86.3288
32. Arissian L, Diels JC. Investigation of carrier to envelope phase and repetition rate: Fingerprints of mode-locked laser cavities. J Phys B: At Mol Opt Phys (2009) 42(18):183001. doi:10.1088/0953-4075/42/18/183001
33. Galzerano G, Suerra E, Giannotti D, Canella F, Vicentini E, Cialdi S. Accurate measurement of optical resonator finesse. IEEE Trans Instrumentation Meas (2020) 69(11):9119–23. doi:10.1109/tim.2020.3001369
Keywords: optical frequency comb (OFC), optical cavity, carrier-envelope offset frequency, Pound–Drever–Hall laser frequency stabilization, active stabilization
Citation: Giannotti D, Suerra E, Canella F, Cialdi S, Laporta P and Galzerano G (2023) Carrier-envelope offset frequency measurement by means of an external optical resonator. Front. Phys. 11:1197654. doi: 10.3389/fphy.2023.1197654
Received: 31 March 2023; Accepted: 05 May 2023;
Published: 24 May 2023.
Edited by:
Marco Lamperti, University of Insubria, ItalyReviewed by:
Gabriele Santambrogio, National Institute of Metrological Research, ItalyAntonio Castrillo, Università della Campania “Luigi Vanvitelli”, Italy
Akira Ozawa, Max Planck Institute of Quantum Optics, Germany
Copyright © 2023 Giannotti, Suerra, Canella, Cialdi, Laporta and Galzerano. This is an open-access article distributed under the terms of the Creative Commons Attribution License (CC BY). The use, distribution or reproduction in other forums is permitted, provided the original author(s) and the copyright owner(s) are credited and that the original publication in this journal is cited, in accordance with accepted academic practice. No use, distribution or reproduction is permitted which does not comply with these terms.
*Correspondence: Gianluca Galzerano, Z2lhbmx1Y2EuZ2FsemVyYW5vQHBvbGltaS5pdA==, Z2lhbmx1Y2EuZ2FsemVyYW5vQGNuci5pdA==
†ORCID ID: Dario Giannotti, orcid.org/0000-0001-9160-8895; Edoardo Suerra, orcid.org/0000-0002-5695-698X; Francesco Canella, orcid.org/0000-0001-8663-6138; Simone Cialdi, orcid.org/0000-0002-2733-927X; Paolo Laporta, orcid.org/0000-0003-2673-6983; Gianluca Galzerano, orcid.org/0000-0002-4388-1421