- China Academy of Space Technology, Xi’an, China
The geostationary orbit microwave multi-channel radiometer has the advantages of high real-time performance and large coverage, which plays an important role in typhoon, strong precipitation detection, and medium-to-short-term meteorological/oceanic forecasting. However, due to the difficulty in engineering development of the payload, its application on-orbit has not yet been achieved at present. To satisfy the requirements of fine and quantitative application of satellite observation data, a geostationary orbit microwave multi-channel radiometer with a 10-m-caliber is developed, in which the spatial resolution at horizontal polarization is better than 24 km at 54 GHz. In geostationary orbit microwave multi-channel radiometer, a quasi-optical feed network covering nearly 28 frequency octave bands and ranging from 23.8 to 664 GHz is proposed to solve the technical problem of multi-frequency sharing in the system. Meanwhile, a high-precision reflector preparation method and a high-precision unfolding scheme are proposed, which are considered as a solution for the large-diameter reflector with a high maintaining surface accuracy. A high-precision antenna prototype with 0.54-m is developed, and the tests are performed to verify the key technologies, such as the preparation of high-precision grating reflectors at the micron level, high surface accuracy detection, and sub-millimeter wave antenna electrical performance testing. The results indicate that measured main beam efficiency of the 664 GHz antenna is better than 95.5%. In addition, the system sensitivity is greater than 1.5 K, and the calibration accuracy is better than 1.8 K, according to the results of an analysis of the multi-channel radiometer’s essential parameters and calibration errors.
1 Introduction
Objects with temperatures higher than absolute zero (0K) emit non-coherent electromagnetic radiation, which is also known as thermal radiation [1, 2]. Microwave radiometers are mainly used to measure the thermal radiation of objects [3]. They do not emit signals themselves, nor do they rely on signals from other sources, and they have the characteristics of all-weather, all-time operation. They can provide information that cannot be obtained by infrared, visible light, or other means, and have a wide range of applications in fields such as atmospheric and oceanic remote sensing, disaster monitoring, and deep space exploration [4]. Currently, all microwave radiometers in orbit are limited to being mounted on low Earth orbit satellites that operate in a Sun-synchronous orbit. The repetition period of observations of the same area on Earth is long, and the temporal resolution of observations is far from sufficient for rapid and real-time monitoring. In contrast, the observation time and frequency of a geostationary microwave radiometer are entirely determined by the satellite platform and the observation instrument itself. It can greatly improve the temporal resolution of observations of the same area, observe the dynamic processes of the entire meteorological and oceanic environment changes, and continuously observe specific areas, meteorological and oceanic conditions, and natural disasters in real-time according to application needs. It has significant advantages in real-time high-resolution reconnaissance and monitoring, medium-to-short-term meteorological/oceanic forecasting and monitoring, and monitoring of major natural disasters.
The technology of microwave multi-channel radiometer in geostationary orbit is one of the most cutting-edge, urgent, and challenging projects in the field of Earth observation internationally, and the United States, Europe, and China are all committed to developing this technology. The aperture schemes are represented by the Geostationary Microwave Observatory (GEM) in the United States and the Geostationary Observatory for Microwave Atmospheric Sounding (GOMAS) [5–7] in Europe. GEM uses a 2-m Cassegrain antenna with a surface accuracy better than 10 μm and a two-stage scanning system. GEM measures temperature and humidity distribution from the Earth’s surface to the stratosphere using 19 submillimeter-wave and 25 mm-wave narrowband frequencies at the oxygen absorption peaks of 50–57 GHz, 118, and 424 GHz and the water vapor absorption peaks of 183, 340, and 380 GHz [8, 9]. GOMAS uses millimeter-wave and submillimeter-wave for atmospheric detection, returning an atmospheric image every 15 min. Its payload design uses a 3-m aperture Cassegrain antenna and chooses 54, 118, 183, 380, and 425 GHz as pre-selected frequencies for geostationary microwave detection [10]. Another technology system is the interferometric synthetic aperture technique [11–15], represented by the Geostationary Synthetic Thinned Aperture Radiometer (Geo-STAR) in the United States [16, 17] and the Geostationary Atmospheric Sounder (GAS) [18, 19] in Europe. Geo-STAR is designed to detect two frequency bands, 50–56 GHz and 183 GHz, each requiring more than 300 antenna units. In the 50–56 GHz band, it can achieve a spatial resolution better than 50 km and a vertical resolution of 2–4 km in a 30-min scanning cycle for atmospheric temperature profile detection. The GAS project is sponsored by the European Space Agency and completed the development of the ground prototype at the end of 2007. To reduce the number of antenna array units and receivers, the GAS project uses a spinning Y-shaped antenna array for imaging at frequencies of 54–380 GHz, requiring about 100 antenna units for each detection frequency band. The system’s horizontal spatial resolution can reach 30 km.
Since the “Eleventh Five-Year Plan” period, China has been working on the development of the next-generation geostationary meteorological satellite, “Fengyun-4,” and plans to achieve microwave payload application [20]. In 2009, the National Space Science Center of the Chinese Academy of Sciences conducted relevant research on the Earth synchronous orbit millimeter-wave interferometric atmospheric detection instrument, proposing the concept of GIMS (Geostationary Interferometric Microwave Sounder) [21, 22]. The working system of the comprehensive aperture annular antenna array self-selection and key area imaging was first realized internationally, and a ground prototype with a working frequency band of 50–56 GHz was developed, achieving a horizontal resolution of 50 km@54 GHz. With the continuous development of weather and climatology, satellite data has entered the stage of refined quantitative application. The requirements for the spatial and temporal resolution, atmospheric vertical structure resolution, and measurement accuracy of satellite detection products in numerical forecasting are constantly increasing. The horizontal resolution of the geostationary orbit microwave radiometer is required to reach 25 km@54 GHz.
According to application requirements, a system scheme of the geostationary orbit microwave multi-channel radiometer is proposed, and key technologies such as multi-frequency sharing large aperture deployable antennas are studied. Several key technologies are validated through the preparation and testing of small aperture high-precision antennas. Finally, the key specifications and calibration errors of the radiometer system are analyzed.
2 Geostationary orbit microwave multi-channel radiometer system design
2.1 Detection frequency bands and subdivision channel selection
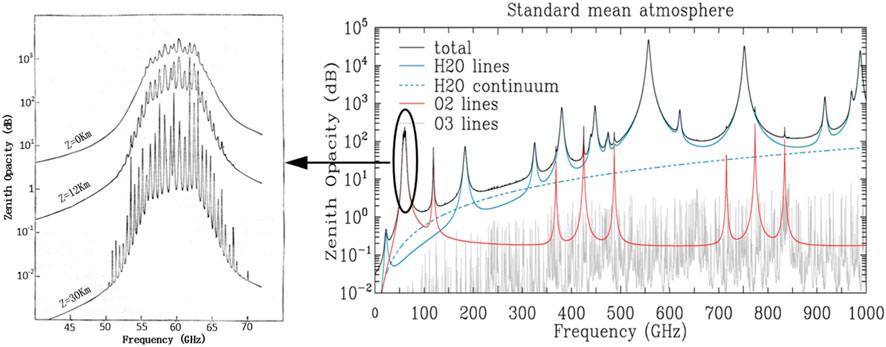
Atmospheric temperature is mainly detected by measuring the microwave radiation of oxygen absorption lines in the atmosphere, while atmospheric humidity is mainly detected by measuring the microwave radiation of water vapor absorption lines in the atmosphere. Figure 1 shows atmospheric absorption lines of different frequency.
The Earth’s atmospheric radiation spectrum has the following characteristic frequencies: 50–60, 118, and 425 GHz. These frequencies are the oxygen absorption bands, which can be used to detect atmospheric temperature profiles. Frequencies such as 23.8, 183, and 380 GHz are the water vapor absorption centers, which can be used to detect water vapor profiles, snowfall, etc. Frequencies such as 31.4, 89, 166, and 340 GHz are the window or quasi-window frequency bands. Frequencies such as 243, 325, 448, 664, and 874 GHz are the atmospheric high-altitude ice cloud detection windows, which can be used to detect ice crystal particles and ice water path parameters of ice clouds [23]. The specific working frequency band selection of the geostationary multi-channel microwave radiometer can be found in Table 1.
With the development of microwave technology and the improvement of component, especially the speed of digital signal processing chips, high-frequency spectral resolution technology in the millimeter wave band (fine spectral segment or multi-channel) has become possible. Traditional microwave radiometers generally have only a few to a dozen channels, and they gradually fail to meet the increasing demand for high atmospheric detection accuracy. However, microwave multi-channel detection payloads use frequency spectrum subdivision technology to divide the observation frequency more finely, expanding the number of channels to hundreds of finely subdivided detection channels. This increases the distribution density of the weight function in the vertical height, in order to obtain more precise narrowband and continuous atmospheric radiation information.
From Figure 1, it can be seen that there are strong oxygen absorption lines in the frequency band between 50 and 70 GHz in the atmosphere. This absorption line is symmetrically centered around 60 GHz, and by using the oxygen absorption spectra in the 50–70 GHz band together, the detection accuracy of the temperature profile of each layer of the atmosphere can be improved. It is challenging to use the 60–70 GHz frequency spectrum since it is not protected and is prone to interference. Therefore, the frequency band for temperature detection is selected as 50–60 GHz, and it is subdivided by frequency spectrum. The spectral resolution within the bandwidth corresponds to the absorption spectra in Figure 1, with more subdivided channels in areas where the spectral lines change rapidly, and fewer channels where the spectral lines change less rapidly. The designed number of channels is greater than 500. Frequency spectrum subdivision detection can approximate the continuous sampling of the radiation signal in the microwave spectral range, thus obtaining nearly continuous radiation information, improving the detection accuracy of the atmospheric temperature profile, improving the vertical resolution of atmospheric parameter detection, and solving the problem of low detection accuracy of optical devices in high water vapor content and cloudy liquid water conditions, thereby improving the accuracy of short-term and medium-term weather forecasts.
2.2 Radiometer system design
Frequency spectrum division detection is required in the 50–60 GHz band, with more than 500 sub-channels. If a synthetic aperture system is used, the number of filtering and correlation processing operations for each frequency band can reach tens of thousands, resulting in high power consumption of the system processor, high resource utilization, and poor performance improvement. In addition, the large number of all-element detection receivers and high uniformity requirements make it difficult to extend to multiple frequency bands, and the system calibration is rather difficult. Therefore, the real aperture technology system is adopted, which requires fewer detection receivers for full-band detection and is easier to extend to multiple frequency bands. The frequency spectrum division project has strong feasibility, and the system occupies fewer resources, which can further improve the detection accuracy and vertical resolution. Therefore, the multi-channel radiometer based on frequency spectrum division has chosen the real aperture technology system.
In order to achieve a horizontal resolution of 25 km at 54 GHz, the antenna aperture needs to be 10 m, and a quasi-optical feeding network [24] is used to achieve nearly 28 frequency octave bands of 23.8–664 GHz. The radiometer system consists of an antenna and scanning subsystem, multi-channel receiver subsystem, calibration subsystem, data acquisition and distribution subsystem, and comprehensive processing subsystem.
The radiometer completes the observation of the scene target, the thermal calibration source, and the cold sky during the rotation and scanning process of the plane mirror, achieving scan imaging and on-orbit two-point calibration. The scene radiation brightness temperature signal first enters the antenna subsystem, and the quasi-optical feed network system separates the signal into frequency bands and polarizations through components such as frequency-selective surfaces [25–27]and polarization grids, and feeds them into each frequency band receiver through reflection and focusing. The receiver obtains the video signal of each detection channel through low noise amplification, mixer, power splitting components, filter, detector, integrator, and low-frequency amplification, and the signal is then sent it to the data acquisition and comprehensive processing subsystem. The calibration subsystem includes a thermal radiation calibration source, a cold sky reflector, and a calibration source controller. The calibration source controller sends the collected stable high and low microwave radiation brightness temperature signals to the data acquisition and distribution device through the internal serial bus. The data acquisition and distribution device supplies power to the system, and the output signals of the detection channels are differentially received, subjected to analog-to-digital conversion, gain compensation control, and then sent to the comprehensive processor through an asynchronous serial port. The comprehensive processor exchanges remote sensing and telemetry information with the data acquisition and distribution device. The device obtains the multi-channel scene brightness temperature by two-point calibration of the remote sensing data, and then obtains the atmospheric microphysical parameters of the observed area through data preprocessing and inversion.
2.3 Scanning and calibration scheme
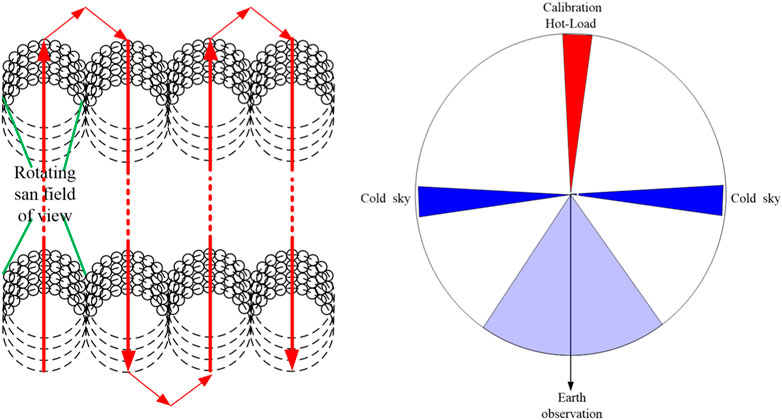
The design of the scanning scheme for the microwave multi-channel detection payload in geostationary orbit is closely related to the observation modes of the payload, which mainly include observations of national territory regions, observations of regions with catastrophic weather events, and observations of the entire disk partition. This requires the payload to have the function of two-dimensional scanning in orbit, especially for observation modes of regions with catastrophic weather events, which require high temporal resolution. The diameter of the antenna after deployment in orbit reaches 10 m. If traditional radiometer scanning is used, it will produce a large interference torque that far exceeds the compensation range of the satellite platform. Considering the compensation ability of the satellite platform and the on-orbit two-point calibration of the radiometer system, the system adopts a scanning scheme that combines the slow two-dimensional scanning of the satellite platform and the rapid rotation of the radiometer scanning mirror. In each sub-scanning process, the forward viewing angle region is used for imaging and the backward viewing angle region is used for calibration. The satellite platform moves slowly back and forth in the north-south direction and steps in the east-west direction, while the radiometer scanning mirror rotates rapidly. The scanning mirror has a small mass and the interference torque of the payload system on the satellite platform is small, which meets the control requirements of the satellite platform and also has the ability of rapid maneuver. The schematic diagram of radiometer beam scanning and calibration are shown in Figure 2.
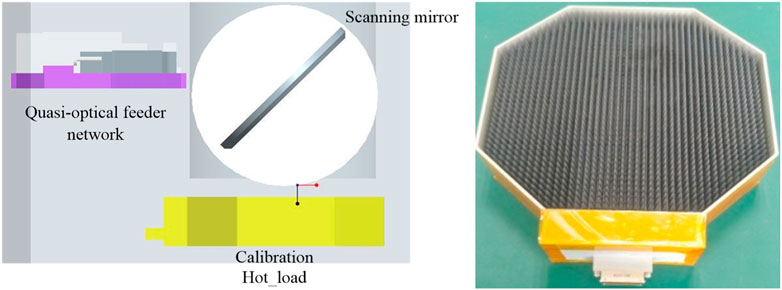
The stationary orbit microwave multi-channel radiometer is a full-power radiometer. The quantitative measurement requires the system to use periodic calibration to eliminate errors caused by long-term drift. Due to the antenna aperture reaching 10 m, it is impossible to perform full aperture calibration of the antenna, so a two-point calibration method at the feed source aperture is used. During the 360-degree rotation of the scanning mirror, the system observes the cold sky of the cosmic microwave background radiation (about 2.7K) twice and the hot calibration source (about 330K) once. When the beam is irradiated on the hot calibration source, the receiver obtains a high-temperature calibration signal. When the beam is irradiated in the cold sky, the cosmic background radiation enters the quasi-optical feed network and the receiver obtains a low-temperature calibration signal. Designing two symmetrical positions for cold space observation can reduce the influence of changes in the position of the Sun and the satellite on low-temperature calibration and improve calibration accuracy. When the beam is irradiated on the antenna, the microwave radiation signals from the Earth and the atmosphere surface are fed into the quasi-optical feed network, and the observed scene brightness temperature information is obtained through high and low temperature calibration. The scanning calibration device and the hot calibration source are shown in Figure 3.
The hot-load calibration source body adopts a periodically serrated array structure coated with absorbing materials. By optimizing the structural shape of the radiation cone and the thickness of the absorbing materials, multiple reflections and absorptions of electromagnetic waves between the cones are achieved, thus achieving high radiation efficiency. The emissivity of the hot-load calibration source body is greater than 0.999 in the range of 50–700 GHz.
2.4 Multi-channel reception scheme
The geostationary orbit microwave multi-channel radiometer requires the use of high-sensitivity receivers to achieve high detection sensitivity. Based on the engineering development experience and technological maturity of different frequency band receivers, different receiving methods are selected: for the non-divided low-frequency channels of 23.8, 31.4, and 89 GHz, direct detection is used; for the three frequency bands of 50–60, 118, and 183 GHz, low noise amplification technology is mature, and low-noise amplification followed by superheterodyne reception is used; for submillimeter wave receivers above 243 GHz, there is a lack of low noise amplifiers in the corresponding frequency bands, and the double-sideband direct mixing reception method is used in the receiving channels. The channel subdivision is all conducted in the intermediate frequency.
Proposal for a 50–60 GHz super multi-channel IF receiver and sub-millimeter wave receiver.
1. 50–60 GHz ultra multi-channel intermediate frequency receiver
The ultra-multi-channel intermediate frequency (IF) receiver determines the number of channels, channel bandwidth, spectrum scanning time, and directly affects key specifications such as the temperature sensitivity and spectral resolution of the system, as well as the accuracy of subsequent atmospheric parameter inversion and vertical resolution. Due to a large number of receiving channels, IF sampling and digital detection technology are planned to be used, in order to obtain the required channel parameter combination through digital signal processing. This technology also makes it possible to flexibly adjust the channel parameters so that it could meet the optimal detection requirements under different weather conditions.
The ultra-multi-channel IF receiver samples the IF signal of the front-end millimeter-wave receiver through a high-speed ADC, and then sends the sampled data into an FPGA through a high-speed digital interface. In the FPGA, the sampled data is subjected to real-time frequency spectrum transformation using FFT technology, and the transformed spectrum data is integrated according to the specific requirements of the radiometer. The integrated data is connected to the host computer through an RS-485 or other type of data interface.
2. Submillimeter-wave receiver
The submillimeter-wave receiver consists of a mixer, a local oscillator source, a low-noise intermediate frequency amplifier, an intermediate frequency filter, and a detector, among which the low-noise mixer and the highly stable local oscillator source determine the key performance of the entire channel. In order to reduce the difficulty of developing the submillimeter-wave low-noise receiving channel, the mixer adopts a second harmonic mixer circuit structure, and the local oscillator frequency FLO of the mixer is half of the detection frequency FRF, greatly reducing the difficulty of implementing the submillimeter-wave local oscillator source. The local oscillator driving of the submillimeter-wave mixer is realized in the form of RF signal step-by-step multiplication, ensuring that the local oscillator power is large enough and high-order harmonic signals are easy to suppress. Both the mixer and the frequency multiplier chain use single-chip integrated technology based on GaAs Schottky barrier diodes. First, the Schottky barrier diodes are accurately modeled, and then the core circuit is simulated and analyzed using the field-circuit coupling method. The development of the mixer and frequency multiplier chain is completed through precision assembly technology, and the entire machine integration is accomplished through RF chain multi-chip packaging technology.
3 Large aperture deployable antenna technology
The biggest technical challenge in applying traditional sun-synchronous (low) orbit microwave radiometers to geostationary orbit is the development of large deployable antenna technology [28], which mainly includes the design of multi-frequency shared reflector antennas, the design and fabrication of high-precision reflector structures, high-precision deployable technology for large aperture antennas, maintaining high surface accuracy of the reflector under complex external thermal conditions, and testing the electrical performance of submillimeter wave antennas.
3.1 Reflector antenna design
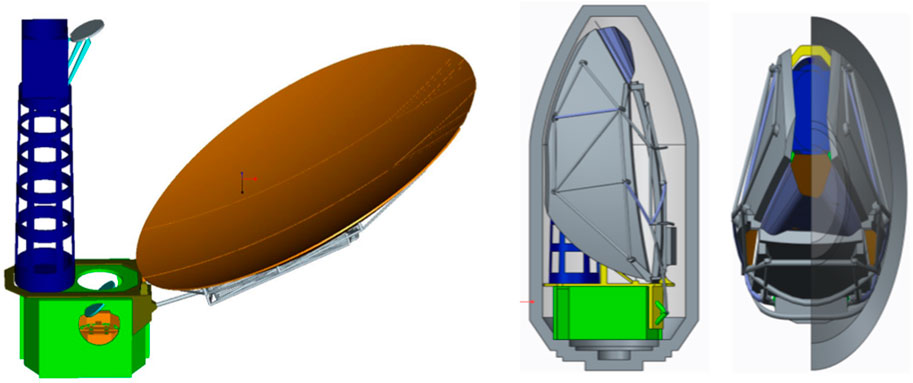
The most important index for the reflector antenna of a radiometer is the antenna main beam efficiency, which evaluates the concentration of received energy in the main lobe of the antenna and affects the calibration accuracy of the radiometer system. To ensure high antenna main beam efficiency, a biased Cassegrain reflector antenna is adopted, which minimizes the influence of the sub-reflector and support structure. A quasi-optical feed network is used to achieve multi-frequency sharing of the reflector antenna. Compared to traditional feed array technology, this approach results in high antenna main beam efficiency, and the phase centers of all feed sources are located in the same position for each frequency band, which facilitates co-observation of the system. The structure and layout of the antenna are shown in Figure 4.
The working frequency range of the radiometer system covers nearly 28 octave bands from 23.8 to 664 GHz. If all frequency bands are fully illuminated, the highest frequency band of 664 GHz will have a resolution of 2 km, resulting in scan gaps during system operation. For meteorological observations, only certain regions of the high-frequency portion of the radiometer need to be illuminated. Therefore, the antenna aperture is divided into separate regions for different frequency bands. The 23.8–54 GHz band is illuminated within a 10-m region (D4), with a surface precision requirement better than 0.15 mm (RMS); the 89–183 GHz band is illuminated within a 5-m region (D3), with a surface precision requirement better than 0.08 mm (RMS); the 243–325 GHz band is illuminated within a 2.5-m region (D2), with a surface precision requirement better than 0.04 mm (RMS); and the 380–664 GHz band is illuminated within a 1.5-m region (D1), with a surface precision requirement better than 0.01 mm (RMS). The required surface precision for each region is shown in Figure 5. This method of dividing the antenna aperture into separate regions can reduce the overall surface precision requirement of the reflector. A surface precision better than 0.01 mm (RMS) is only required in the central 1.5-m region, thereby improving the engineering feasibility of the reflector.
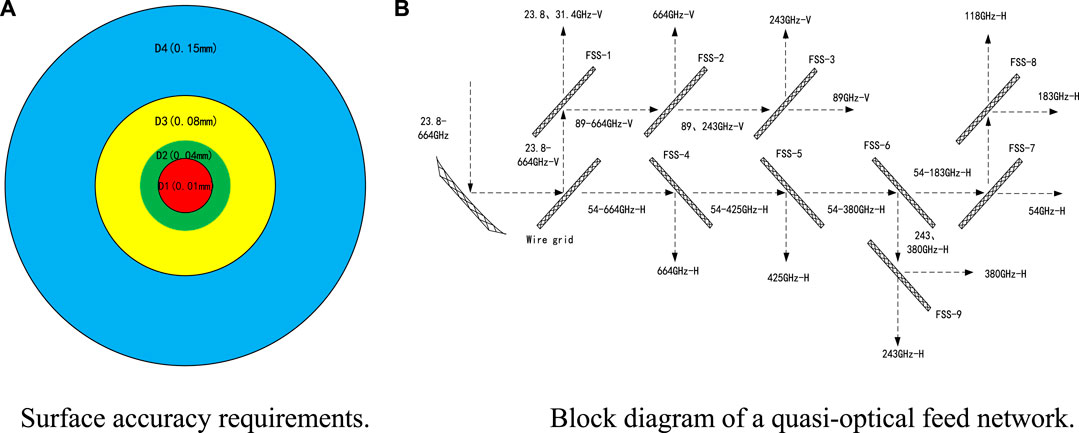
FIGURE 5. Schematic diagram of antenna irradiation at different frequency bands. (A) Surface accuracy requirements. (B) Block diagram of a quasi-optical feed network.
The performance of the feed network operating in the 23.8–664 GHz frequency range has a significant impact on the temperature measurement sensitivity of the radiometer system. Therefore, a compact and reasonable layout is crucial. To address the problem of multi-band reuse, a full-metal layered layout and a quasi-optical frequency separation method have been proposed. This method separates the signals of different frequency bands and has dual-polarization extension capabilities. The quasi-optical feed network block diagram is shown in Figure 5.
First, the received signals from the antenna are polarized and separated using a polarization grid. The V-polarized wave is then separated into 23.8, 31.4, 89, 243, and 664 GHz using the frequency selective surfacesFSS-1 to FSS-3, while the H-polarized wave is separated into 54, 118, 183, 243, 380, 425, and 664 GHz using FSS-4 to FSS-9.
The electromagnetic characteristics of each frequency band of the antenna are simulated and calculated using the GRASP software dedicated to the design of satellite reflector antennas. The simulation results of typical frequency bands are shown in Figure 6.
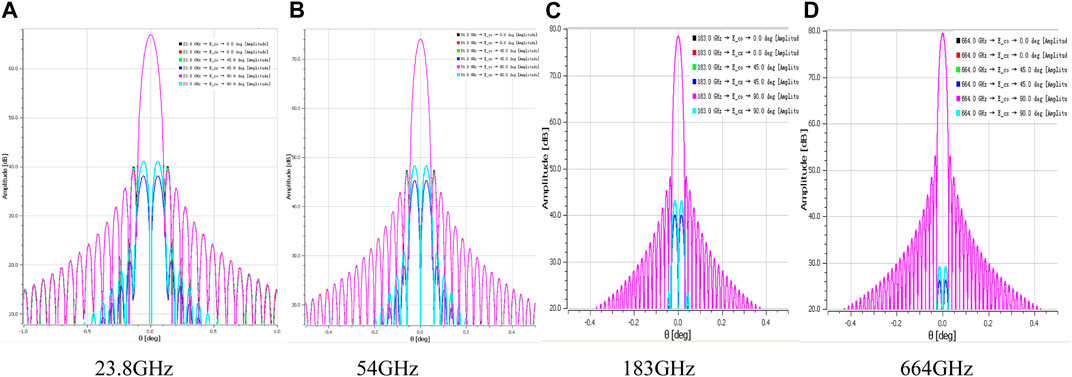
FIGURE 6. Simulation results of antenna electrical performance at different frequency bands. (A) 23.8GHz (B) 54GHz (C) 183GHz (D) 664GHz.
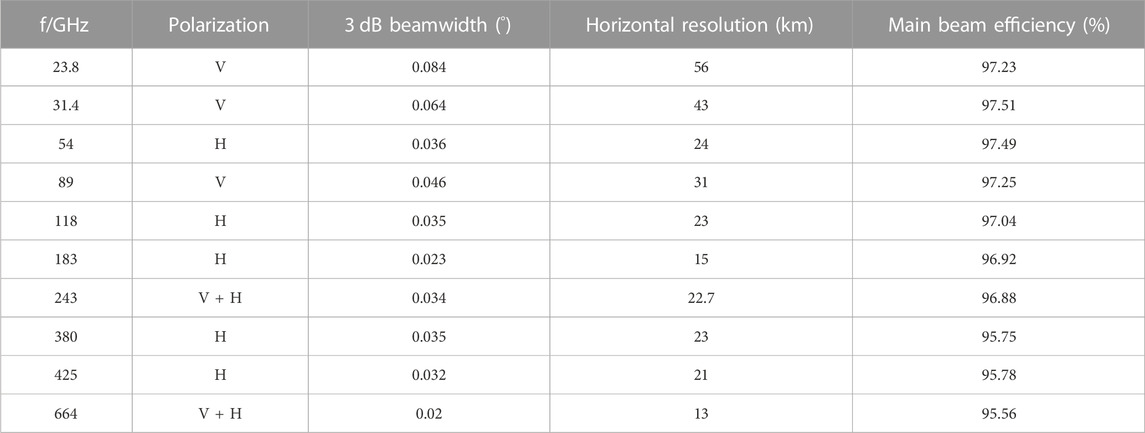
The simulation results of the antenna’s beamwidth, horizontal resolution on the ground, and main beam efficiency are presented in Table 2.
According to the results of the simulation analysis of the reflector antenna’s electrical performance, the radiometer system’s horizontal resolution is 24 km at 54 GHz and 13 km at 664 GHz.
3.2 Antenna structure design
A 10-m-diameter high-precision reflector needs to reach a surface accuracy of micrometer-level, which poses a serious challenge to the antenna’s structural design, deployment method, manufacturing, and on-orbit surface accuracy maintenance. Comprehensive measures need to be taken from materials, dynamics, control, and structural aspects to achieve a surface accuracy of 0.01 mm (RMS) in the middle 1.5 m area and an overall surface accuracy of better than 0.15 mm (RMS) for the 10-m area.
1. Structural design of high-precision reflector
The temperature variation range in a geostationary orbit can reach −150–120°C. The surface accuracy of the main reflector of the antenna is as high as 0.01 mm (RMS), but the processing accuracy of traditional aluminum honeycomb composite materials can only reach 0.1 mm (RMS), which is one order of magnitude lower than the surface accuracy requirement. In addition, controlling the thermal deformation of the reflector in the complex external thermal environment of a geostationary orbit is also a challenge. To improve the surface accuracy of the reflector and reduce the thermal stress during the forming process, the reflector mold is made of nearly zero-expansion Invar steel, and the high-precision Invar steel mold is compensated for surface shape multiple times during the reflector fabrication process. A precise and feasible mold compensation method is established to improve the surface accuracy of the reflector. The main reflector material is made of carbon fiber composite material, and the honeycomb layer is made of carbon fiber lattice structure. The reflector is composed of a front reflector surface, a honeycomb layer, and a back panel. The honeycomb layer uses a triangular carbon fiber lattice structure to solve the thermal deformation problem of traditional aluminum honeycomb structure. The front reflector surface is made by laying and splicing multiple sub-blocks to achieve quasi-isotropic and quasi-zero residual stress of the overall reflector surface, effectively ensuring the on-orbit surface accuracy of the formed reflector.
2. High-precision reflector deployment method
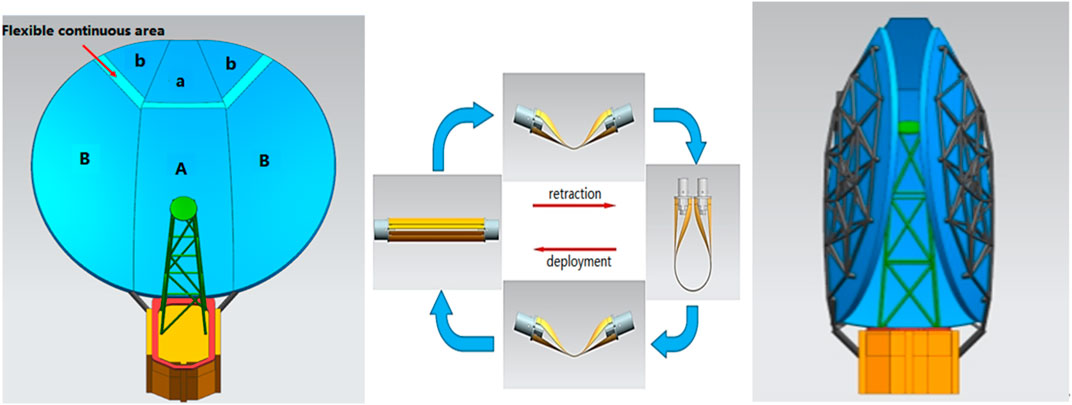
Considering the constraints of the rocket fairing envelope, a high-precision deployable structure scheme is required for a 10-m reflector. The partition is designed using a combination of truss deployment and flexible deployment methods. The top region of the reflector is connected by a flexible composite material transition region. When folding, the flexible region undergoes elastic deformation and is fixed by mechanical constraints. When deployed, it relies on its own structural rebound to expand, without the need for an expansion drive system. The support structure at the bottom of the reflector is supported by a truss, which is connected by hinges. Based on geometric symmetry, the main reflector is divided into A, B, a, and b regions, where A and a areas form the A-a reflector sub-block, and B and b areas form the B-b reflector sub-block. Both A-a and B-b reflector sub-blocks are fabricated using high-precision carbon fiber composite grid reflector technology and are supported at the bottom by lightweight, high-stiffness, and high-thermal-stability carbon fiber composite material trusses. The support trusses between the A-a and B-b reflector sub-blocks are connected by thermal sensitive intelligent material hinges with high rebound precision, high structural rigidity, zero clearance, and low deployment impact, to achieve the folding and expansion of the reflector sub-blocks. Within each reflector sub-block, the A and a areas and the B and b areas are connected by continuous flexible transition regions of composite material, which balance the high-precision folding and expansion functions while satisfying the requirements of continuous structure and electrical performance. The deployed accuracy of the 10-m diameter high-precision reflector is better than 0.01 mm. Deployable diagram of high-precision reflector structure is shown in Figure 7.
3.3 Antenna thermal deformation analysis
To verify the in-orbit surface accuracy retention capability of a high-precision large aperture reflector under complex external heat flow conditions in geostationary orbit, simulation analysis was conducted on the in-orbit thermal deformation of the reflector using professional software.
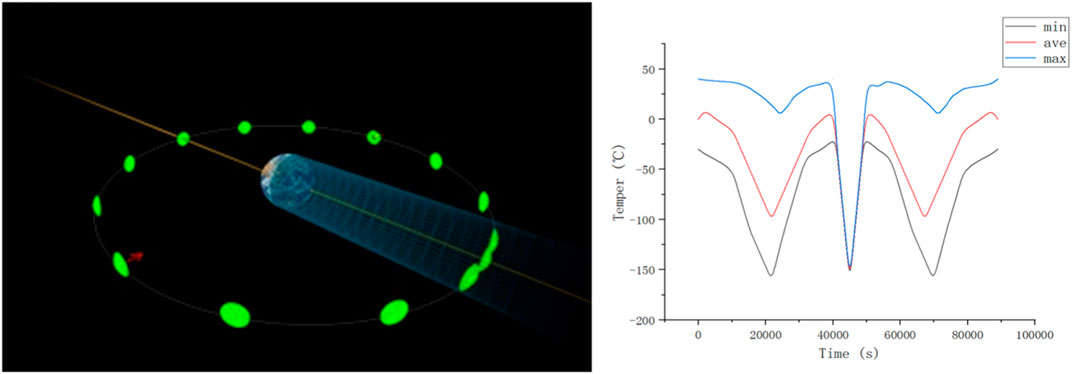
The TMG solver built into FEMAP was used to calculate the in-orbit temperature field of the reflector. The orbit type used was a geostationary orbit, with the calculation period starting from the vernal equinox and lasting 24 h. The calculation started at noon on the dot. The reflector’s orbit attitude was such that the reflector always pointed toward the center of the Earth, with the Z-axis always pointing toward the center of the Earth. The results of the reflector’s temperature field calculations were output every 10 minutes, and the reflector’s in-orbit attitude chart and temperature change curve for one cycle are shown in Figure 8.
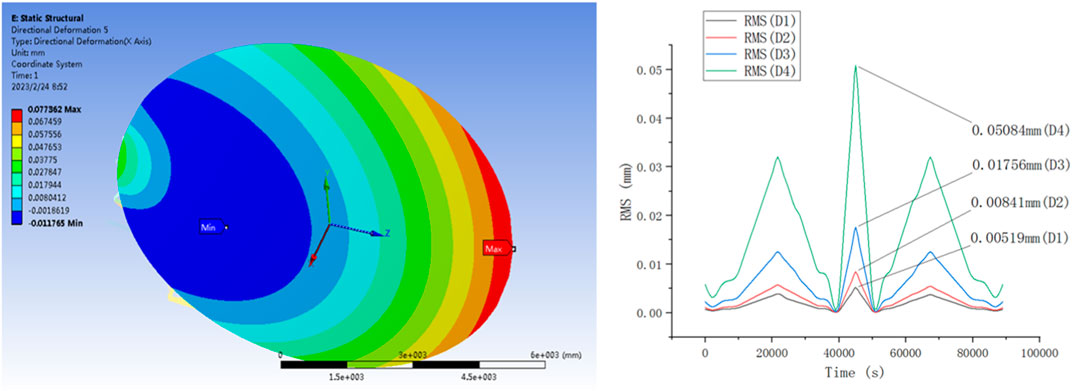
Using the calculated temperature field results, the thermal deformation values of a 10-m diameter reflector under complex external heat flux conditions in a stationary orbit were computed and are shown in Figure 9.
Based on the thermal deformation analysis of the reflector, the thermal deformation value of the new high-precision reflector in the central 1.5-m area (D1) is better than 0.005 mm (RMS), the thermal deformation value in the 2.5-m area (D2) is better than 0.008 mm (RMS), the thermal deformation value in the 5-m area (D3) is better than 0.018 mm (RMS), and the thermal deformation value in the entire 10-m area (D4) is better than 0.05 mm (RMS). This can ensure the high-performance and stable operation of the 10-m antenna in orbit and verify the rationality of the structural design of the new high-precision reflector.
3.4 Development and testing of antenna prototypes
With the development of a 0.54-m offset Cassegrain reflector antenna, major advancements in high-precision antenna preparation, testing, and performance testing were made. This antenna also quantitatively validated the multi-frequency shared high-main lobe efficiency reflector technology.
1. Development of antenna prototype
The antenna prototype mainly includes quasi-optical feeding network in the 183–664 GHz frequency band, a 0.54-m high-precision grating reflector and sub-reflector, and a support structure, etc.
The quasi-optical feeding network mainly includes components such as frequency selection surface, polarization grating, corrugated horn, ellipsoidal mirror, and flat mirror. After high-precision position calibration, the quasi-optical components are integrated on the same installation base. The frequency selection surface is assembled into a full-metal resonant periodic structure, which achieves low-loss separation of signals of different frequency bands under large incident angle illumination. The measured standing wave ratio of the 183–664 GHz quasi-optical feeding network is less than 1.4, and the insertion loss of the polarization grid is better than 0.2 dB, while the insertion loss of the 664 GHz frequency selection surface is better than 1.5 dB.
In the development of the high-precision grating reflector, the method of surface compensation for low thermal expansion Invar steel mold was explored. The surface accuracy of the 0.54-m Invar steel mold is better than 0.005 mm (RMS). The spray-coating of a metallic silver layer on the mold surface is the most important step in the metallization of the reflector surface. The high-precision reflector uses a sub-block splicing and layering scheme instead of the traditional whole-layering scheme. The new layering design is based on the principle of discrete splicing. On the one hand, it can improve the accuracy of the layering angle; on the other hand, it can effectively balance the residual thermal stress inside the reflector to ensure the overall uniformity and shape accuracy of the reflector surface. The reflector surface is divided into several sub-blocks according to a specific design, and each sub-block is layered with quasi-isotropic layers. In order to ensure the accuracy of the layering, the surface of each sub-block needs to be unfolded and the planar shape is used as the basis for pre-impregnated material cutting. The high-precision reflector was tested for shape accuracy using a laser tracker, and the measured shape accuracy value of the 0.54-m reflector was found to be less than 0.01 mm (RMS) after optimal fitting.
Through the preparation of a 0.54-m high-precision grating reflector, multiple key technologies related to the material selection of high-precision structures, precision control of molds, and preparation processes have been validated, which lays the technical foundation for the development of a 10-m high-precision antenna. An integrated antenna prototype will be developed by assembling a quasi-optical feeding network in the frequency range of 183–664 GHz, a 0.54-m high-precision grating reflector and sub-reflector, and support structures. Each component of the prototype will need to undergo precise position calibration to ensure that the antenna’s electrical performance meets the application requirements of the radiometer system.
2. Antenna electrical performance test
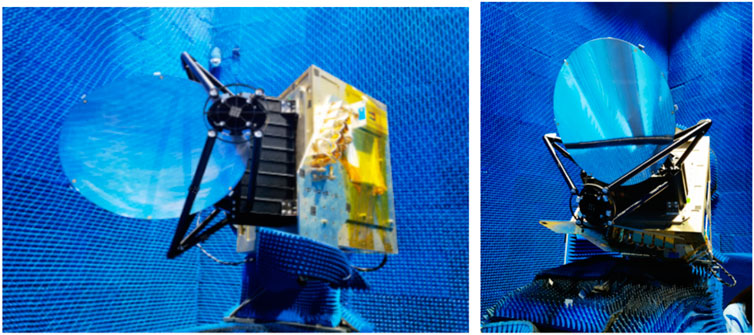
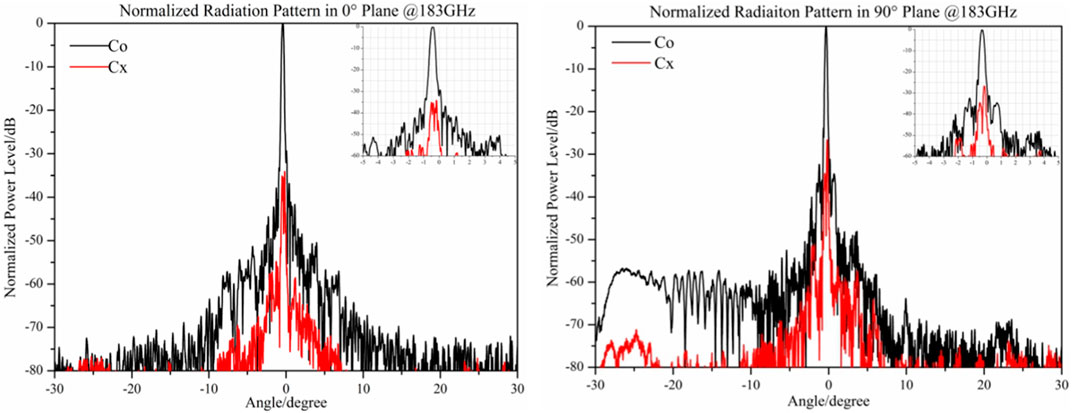
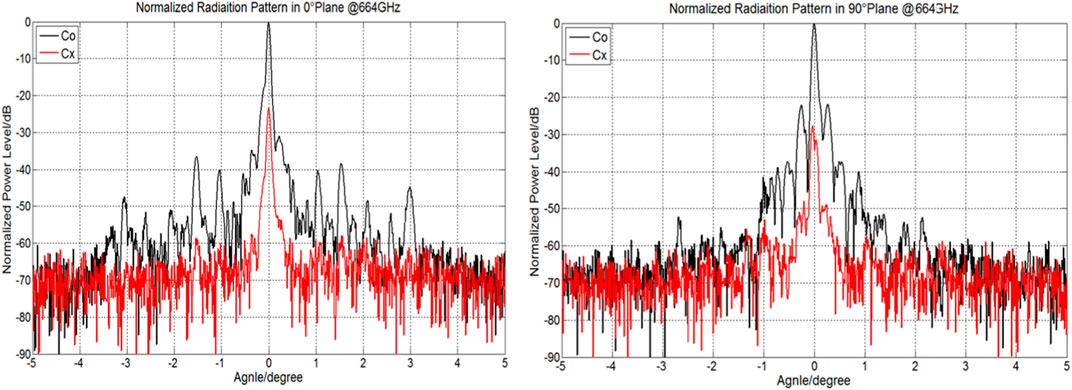
The China Academy of Space Technology (Xi’an) has successfully conducted antenna radiation performance testing for multiple frequency bands ranging from 183 GHz to 664 GHz for the first time in the terahertz compensated compact test field at the institute. The status of antenna electrical performance testing is shown in Figure 10. The test results for the antenna far-field radiation patterns at 183 and 664 GHz are shown in Figures 11, 12.
The measured values of the main lobe efficiency for the antenna at 183 GHz and 664 GHz are better than 96.5% and 95.5%, respectively, which verifies the rationality of the design of the high main lobe efficiency multi-frequency shared reflector antenna scheme. This also confirms the key technologies for testing the electrical performance of millimeter-wave and sub-millimeter-wave antennas.
4 Performance analysis of microwave multi-channel radiometer system in geostationary orbit
Based on the simulation analysis and test results of the large deployable antenna on geostationary orbit and the multi-frequency receiving channel, the main performance parameters of the radiometer system are simulated and calculated. At the same time, the calibration error of the radiometer system is analyzed.
4.1 Performance analysis of radiometer system
The main performance parameters of the geostationary orbit microwave multi-channel radiometer system include working frequency, bandwidth, temperature measurement sensitivity, calibration accuracy, antenna main lobe efficiency, and spatial resolution. The main lobe efficiency and spatial resolution of the antenna are calculated based on antenna electrical performance simulation analysis, and the main lobe efficiency index is quantitatively validated through a 0.54-m antenna prototype. The following section focuses on the analysis results of temperature measurement sensitivity and calibration accuracy.
Temperature measurement sensitivity is an important technical indicator of the geostationary orbit microwave multi-channel detection payload system, and it is defined as the minimum detectable temperature variation of the input antenna by the radiometer receiver. The temperature measurement sensitivity of a microwave radiometer mainly depends on the noise figure of the high-frequency receiver, the gain stability of the receiving channel, the loss of the quasi-optical feed network, the antenna radiation efficiency, the receiver bandwidth, and the integration time.
The temperature measurement sensitivity (
The noise figure of the receiver includes the noise figures of the front-end and back-end. As there is no low-noise amplifier above 243 GHz, the noise temperature of the receiver is relatively high. Based on the measured noise temperature of the receiver prototype in the previous stage, the noise temperature of the entire receiver is estimated. The transmission loss of the quasi-optical feed network is estimated based on the test results of the quasi-optical feed network prototype, and the radiation efficiency of the antenna is higher than 95%. The calculation of the system noise temperature includes the noise temperature of the receiver and the transmission loss of the quasi-optical feed network. The intermediate frequency bandwidth is set according to the application requirements, and the integration time τ at each observation point is 16 ms. The
The system calibration accuracy includes errors from antenna side lobes and calibration, as shown in the following equation:
In the equation,
The antenna side lobe error can be calculated by the uncertainty of the antenna’s main beam efficiency and the effective apparent temperature of the antenna side lobe. Specifically, if the main beam efficiency of the antenna is
If a simple estimate is to be made, the system’s calibration error mainly comes from the following two aspects:
1) The uncertainty of the calibration source; 2) Calibration errors caused by receiver characteristics: system nonlinearity, system random noise, system gain fluctuations, changes in frequency response function, and matching between the feeder system and the source.
If only the main influencing factors are considered, they can be represented simply by the following Eq. 3:
In the equation,
The temperature measurement sensitivity of the channel is taken from the design result, the non-linear error is considered to be of the same order of magnitude as the temperature measurement sensitivity, and the main beam efficiency of the antenna is taken to be 95%. By using Eqs 2, 3, the system calibration accuracy is calculated.
The main performance specifications of the geostationary orbit microwave multi-channel radiometer are shown in Table 3, which includes the analysis results of the main performance parameters such as noise temperature, temperature measurement sensitivity, calibration accuracy, and so on.
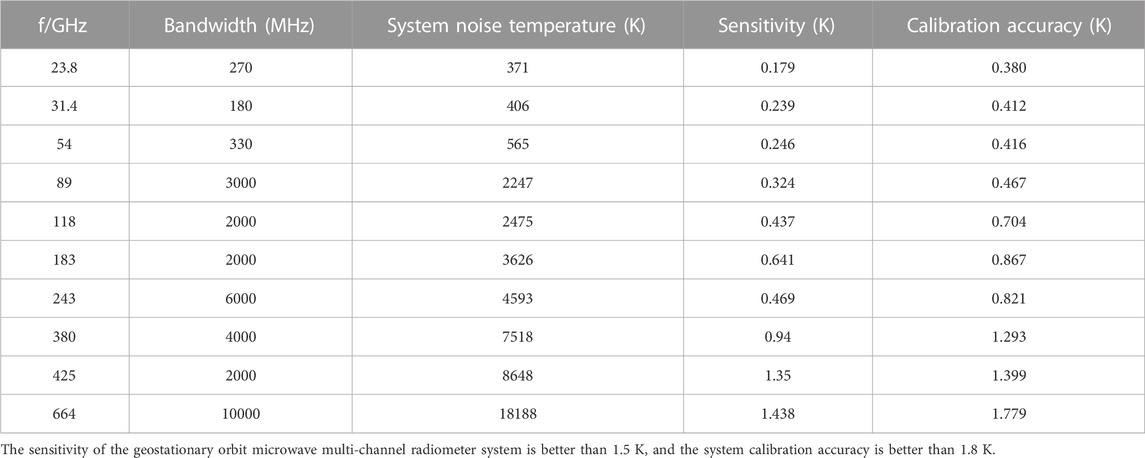
TABLE 3. Performance analysis results of microwave multichannel radiometer system in geostationary orbit.
4.2 Calibration error analysis of radiometer system
The temperature measurement accuracy of the geostationary orbit microwave multi-channel radiometer during in-orbit operation is mainly affected by three factors: errors caused by the antenna, errors introduced by the characteristics of the receiving channels, and measurement errors of the radiometer system.
1. The error caused by the antenna
Antenna-induced errors are mainly caused by side lobes and reflection losses of the antenna. The antenna temperature
Where
It is necessary to accurately measure the radiation pattern, main beam efficiency, and radiation efficiency of the 10-m diameter antenna. The error caused by the antenna can be reduced by accurately evaluating the radiation temperature received by the antenna sidelobes through the measurement of the sidelobe levels in the antenna pattern.
2. The influence of receiving channel characteristics on temperature measurement accuracy
The errors introduced by the receiving channels mainly include three aspects: nonlinearity of the system, system noise, and system gain variation. 1) The calibration equation is based on the linear relationship between the output voltage of the radiometer and the antenna’s apparent temperature. Therefore, the radiometer must be linear within the measurement range. The nonlinearity of device performance leads to certain nonlinear characteristics in the relationship between the output voltage of each detection channel of the radiometer and the antenna’s apparent temperature, which will bring errors to the measurement and affect the temperature measurement accuracy. The T-V curves measured by different detection channels of the radiometer in a vacuum environment are used to modify and improve the basic calibration equation and reduce temperature measurement errors. 2) The system noise temperature of the receiving channel causes random fluctuations in the output voltage of each detection channel of the radiometer, resulting in measurement uncertainty. 3) The system gain variation introduces an offset to the output voltage of each channel of the radiometer, and long-period changes can be eliminated through calibration, while short-term changes will cause measurement uncertainty. The measurement uncertainty introduced by the short-term changes in system noise and system gain can be expressed by the temperature measurement sensitivity. In the development process of the receiving channel, it is necessary to reduce the system noise temperature and control the changes in system gain as much as possible to improve the temperature measurement sensitivity and calibration accuracy.
3. Uncertainty analysis of system calibration
When a radiometer operates in orbit, the main sources of calibration measurement errors in the system are: 1) uncertainties in the observation of the thermal calibration source. The thermal calibration source observation errors are mainly caused by radiation efficiency, measurement accuracy of physical temperature, and matching between the receiving antenna and the reverse radiation. The radiation efficiency of the thermal calibration source is the main factor affecting the radiation brightness temperature accuracy of the thermal radiation calibration source. When the radiation efficiency is not 1, it not only causes calculation errors in radiation temperature, but also introduces reverse radiation. When the radiation efficiency is close to 1, the effects of the latter two items are relatively small and relatively stable, and the impact can be minimized through ground calibration tests. Therefore, it is necessary to perform accurate testing of the radiation efficiency of the thermal radiation source. The measurement accuracy of physical temperature is affected by the temperature stability, uniformity, and gradient distribution of the radiation surface. By improving the temperature measurement accuracy and using multi-point temperature measurement, the impact of this item can be reduced by obtaining the distribution of radiation over the surface. 2) Uncertainties in cold sky observation. The temperature measurement errors in cold sky calibration are mainly caused by the influence of antenna sidelobes, which have a greater impact on the additional radiation from the satellite body, the Earth, and the cosmic background. The radiation from cosmic cold sky varies with different cold sky scenarios and celestial bodies. The value of this additional radiation received by the sidelobes during cold sky calibration can be estimated in advance based on the antenna pattern, but this estimate can only be rough and difficult to know precisely, which can lead to errors due to its uncertainty. Three approaches are used to more accurately evaluate the radiation temperature received by the antenna sidelobes: accurately understanding the radiation situation of the antenna sidelobe scenario to reduce errors, improving the main beam efficiency to reduce sidelobe errors, and accurately measuring the antenna pattern to correct the received radiation temperature of the antenna sidelobe and reduce the uncertainty of error terms.
Similarly, two factors cause measurement uncertainties: one is the fluctuations caused by changes in the orbit of the system, and the other is the radiation fluctuations caused by the aging of payload equipment and satellite bodies. By analyzing and calculating the errors generated by the antenna, errors introduced by the receiving channel characteristics, and measurement errors of system calibration, the calibration accuracy of the radiometer can be improved through guidance of system temperature control and non-linear correction.
5 Conclusion
Based on the demand for all-weather, seamless meteorological forecasting services and timely and accurate monitoring and warning of meteorological disasters, a proposal is made for the first time for a microwave multi-channel radiometer scheme in geostationary orbit with high spatial and temporal resolution, and full-atmosphere element detection capabilities. The radiometer’s operating frequency band and channel selection are provided, and the key technologies of the radiometer are studied, including the design of multi-frequency receiving channels, two-dimensional scanning and calibration schemes. Finally, the main technical specifications of the radiometer system are analyzed.
A high-precision deployable antenna with a 10-m diameter is proposed for the first time, and the system’s spatial resolution is better than 24 km @ 54 GHz. A high-precision reflector preparation method and high-precision deployment scheme are proposed. Through thermal deformation analysis, the high-precision reflector’s ability to maintain its shape accuracy in orbit is verified. Through the development and testing of a 0.54-m diameter antenna prototype, key technologies such as the preparation of micrometer-level high-precision grating reflectors, high-precision surface accuracy testing, sub-millimeter wave antenna electrical performance testing, and quasi-optical feeding network multi-frequency sharing are validated, and the measured main beam efficiency of the antenna is better than 95.5%. Based on the simulation analysis of the antenna and receiving channel and the results of the actual measurement, the sensitivity analysis result of the radiometer system is better than 1.5 K. The calibration error of the entire system is analyzed, and the system’s calibration accuracy is improved by guiding the system’s temperature control and nonlinear correction.
The geostationary orbit microwave multi-channel radiometer system is complex, and further in-depth research is needed on key technologies such as high-precision deployable antennas with a 10-m diameter, high-precision preparation of large-diameter reflectors, integration and testing, and high-precision calibration testing of the radiometer system. In addition, further research will be conducted on technologies such as high-precision microwave radiation transmission and detection inversion in geostationary orbit, laying a solid technical foundation for the satellite application of geostationary orbit microwave multi-channel radiometers.
Data availability statement
The raw data supporting the conclusion of this article will be made available by the authors, without undue reservation.
Author contributions
Conceptualization, WZ, HD, and HL; methodology, WZ, RL, YL, SS, and WG; software, ZH, RL, and HR; validation, WZ, HL, YL, and RL; investigation,RL, HD, and LZ; resources, WG, HR, and LJ; writing—Original draft preparation, WZ and RL; writing—Review and editing, WZ and HL; visualization, WZ and RL; supervision, SS and WG. All authors contributed to the article and approved the submitted version.
Conflict of interest
The authors declare that the research was conducted in the absence of any commercial or financial relationships that could be construed as a potential conflict of interest.
Publisher’s note
All claims expressed in this article are solely those of the authors and do not necessarily represent those of their affiliated organizations, or those of the publisher, the editors and the reviewers. Any product that may be evaluated in this article, or claim that may be made by its manufacturer, is not guaranteed or endorsed by the publisher.
References
1. Ulaby FT, Moore RK, Fung AK Microwave remote sensing: Active and passive. Volume 1 - microwave remote sensing fundamentals and radiometry. Remote Sensing A (1981).
2. Lu HL, Wang ZQ, Gao C. Research on the detection algorithm for sea surface targets based on passive interferometric microwave images (PIMI). J Electron Inf Technol (2020) 42(3):563–72.
3. Pearson K, Good S, Merchant CJ, Prigent C, Embury O, Donlon C. Sea surface temperature in global analyses: Gains from the copernicus imaging microwave radiometer. Remote Sensing (2019) 11(20):2362. doi:10.3390/rs11202362
4. Zhao X, Chen Y, Kern S, Qu M, Ji Q, Fan P, et al. Sea ice concentration derived from FY-3D MWRI and its accuracy assessment. IEEE Trans Geosci Remote Sensing (2021) 60:1–18. doi:10.1109/tgrs.2021.3063272
5. Staelin D, Kerekes J, Solman FJ. Final report of the geosynchronous microwave sounder working group. Lexington MA: prepared for NOAA/NESDIS GOES Program Office by MIT Lincoln Laboratory (1997).
6. Solman FJ, Staelin DH, Kerekes JP, Shields MW A microwave instrument for temperature and humidity sounding from geosynchronous orbit. Proc IGARSS (1998) 1704–7. doi:10.1109/IGARSS.1998.692442
7. Bizzarro B, Mugnai A. Requirements and perspectives for MW/sub-mm sounding from geostationary satellite. EUMETSAT Meteorol Satellite Conf (2002) 97–105.
8. Staelin DH, Gasiewski AJ, Kerekes JP. Concept proposal for a geostationary microwave (GEM) observatory, prepared for the NASA/NOAA advanced geostationary sensor. (AGS) Program (1998).
9. Gasiewski AJ, Staelin David H, Bizzarro B. Geosynchronous microwave (GEM) sounder/imager. College Park, MD: In: GPM Workshop (2001).
10. Bizzarri B. Geostationary observatory for microwave atmospheric sounding (GOMAS), a demonstration mission of the feasibility of frequent precipitation observation and nearly-all-weather temperature-humidity sounding from IGeoLab. Submitted to ESA in response to the call for ideas for explorer mission (2005) 4:6.
11. Swift Calvin T, Levine David M, Ruf Christopher S. Aperture synthesis concepts in microwave remote sensing of the Earth. IEEE Trans Microwave Theor Tech (1991) 39(12):1931–5. doi:10.1109/22.106530
12. Ruf Christopher S, Swift Calvin T, Tanner Alan B, Le Vine D. Interferometric synthetic aperture microwave radiometry for the remote sensing of the Earth. IEEE Trans Geosci Remote Sensing (1988) 26(5):597–611. doi:10.1109/36.7685
13. Dou H, Gui L, Li Q, Chen L, Bi X, Wu Y, et al. Initial results of microwave radiometric imaging with mirrored aperture synthesis. IEEE Trans Geosci Remote Sens (2019) 57:8105–17. doi:10.1109/tgrs.2019.2918308
14. Dou H, Chen K, Li Q, Jin R, Wu Y, Lei Z Analysis and correction of the rank-deficient error for 2-D mirrored aperture synthesis. IEEE Trans Geosci Remote Sens (2021) 59(3):2222–30. doi:10.1109/tgrs.2020.3005142
15. Dou H, Xiao C, Li H, Li Y, Dang P, Lv R, et al. Deep learning imaging for 1-D aperture synthesis radiometers. IEEE Trans Geosci Remote Sensing (2023) 61:1–16. Art no. 5300716. doi:10.1109/TGRS.2023.3249239
16. Tanner Alan B, Wilson William J, Lambrigsten Bjorn H, Dinardo S, Brown S, Kangaslahti P, et al. Initial results of the geostationary synthetic thinned array radiometer (Geo-STAR) demonstrator instrument. IEEE Trans Geosci Remote Sensing (2007) 45(7):1947–57. doi:10.1109/tgrs.2007.894060
17. Torres F, Tanner AB, Brown ST, Lambrigsten B. Analysis of array distortion in a microwave interferometric radiometer: Application to the geo-STAR project. IEEE Trans Geosci Remote Sensing (2007) 45(7):1958–66. doi:10.1109/tgrs.2007.898093
18. Christensen J, Carlstrom A, Ekstrom H, Emrich A, Embretsen J, de Maagt P, et al. Gas: The geostationary atmospheric sounder. Proc IGARSS (2007) 223–6. doi:10.1109/IGARSS.2007.4422770
19. Jacob C, Anders C, Anders E The geostationary atmospheric sounder – GAS. Proc SPIE (2012) 636109–1. doi:10.1109/IGARSS.2007.4422770
20. Lu N, Gu S The status and prospects of atmospheric microwave sounding by geostationary meteorological satellite. Adv Meteorol Sci Technol (2016)(01) 120–3.
21. Liu H, Wu J, Zhang S, Yan J, Niu L, Zhang C, et al. The geostationary interferometric microwave sounder (GIMS): Instrument overview and recent progress. Proc IGARSS (2011) 3629–32. doi:10.1109/IGARSS.2011.6050010
22. Zhang C, Liu H, Wu J, Zhang S, Yan J, Niu L, et al. Imaging analysis and first results of the geostationary interferometric microwave sounder demonstrator. IEEE Trans Geosci Remote Sensing (2015) 53(1):207–18. doi:10.1109/tgrs.2014.2320983
23. Li S, Liu L, Gao T, Huang W, Hu S, et al. Sensitivity analysis of terahertz wave passive remote sensing of cirrus microphysical parameters. Acta Phys Sinica (2016) 65(13):100–10.
24. Martin RJ, Martin DH Quasi-optical antennas for radiometric remote-sensing. Electron Commun Eng J (1996) 8:37–48. doi:10.1049/ecej:19960106
25. Wu R, Dong J, Wang M. Wearable polarization conversion metasurface MIMO antenna for biomedical applications in 5 GHz WBAN. Biosensors (2023) 13(1):73. doi:10.3390/bios13010073
26. Pan Y, Dong J. Design and optimization of an ultrathin and broadband polarization-insensitive fractal FSS using the improved bacteria foraging optimization algorithm and curve fitting. Nanomaterials (2023) 13(1):191. doi:10.3390/nano13010191
27. Pan Y, Dong J, Wang M. Equivalent circuit-assisted multi-objective particle swarm optimization for accelerated reverse design of multi-layer frequency selective surface. Nanomaterials (2022) 12(21):3846. doi:10.3390/nano12213846
Keywords: geostationary orbit, multi-channel, radiometer, main beam efficiency, sensitivity
Citation: Zhou W, Lv R, Li H, Li Y, Dou H, He Z, Shen S, Gao W, Ren H, Zhang L and Jin L (2023) A geostationary orbit microwave multi-channel radiometer. Front. Phys. 11:1201549. doi: 10.3389/fphy.2023.1201549
Received: 06 April 2023; Accepted: 16 May 2023;
Published: 02 June 2023.
Edited by:
Jian Dong, Central South University, ChinaReviewed by:
Guoping Hu, Sun Yat-Sen University, ChinaRong Jin, Huazhong University of Science and Technology, China
Copyright © 2023 Zhou, Lv, Li, Li, Dou, He, Shen, Gao, Ren, Zhang and Jin. This is an open-access article distributed under the terms of the Creative Commons Attribution License (CC BY). The use, distribution or reproduction in other forums is permitted, provided the original author(s) and the copyright owner(s) are credited and that the original publication in this journal is cited, in accordance with accepted academic practice. No use, distribution or reproduction is permitted which does not comply with these terms.
*Correspondence: Rongchuan Lv, Mjg0NDAzMzNAcXEuY29t
 Weilai Zhou
 Rongchuan Lv*