- 1National Supercomputing Center in Shenzhen, Shenzhen, China
- 2State Key Laboratory of Lithospheric Evolution, Institute of Geology and Geophysics, Chinese Academy of Sciences, Beijing, China
- 3Key Lab of Submarine Geosciences and Prospecting Techniques MOE, Frontiers Science Center for Deep Ocean Multispheres and Earth System, College of Marine Geosciences, Ocean University of China, Qingdao, China
- 4School of Earth and Space Sciences, Peking University, Beijing, China
Microseismic monitoring data may be seriously contaminated by complex and nonstationary interference noises produced by mechanical vibration, which significantly impact the data quality and subsequent data-processing procedure. One challenge in microseismic data processing is separating weak seismic signals from varying noisy data. To address this issue, we proposed an ambient-noise-assisted multivariate empirical mode decomposition (ANA-MEMD) method for adaptively suppressing noise in low signal-to-noise (S/N) microseismic data. In the proposed method, a new multi-channel record is produced by combining the noisy microseismic signal with preceding ambient noises. The multi-channel record is then decomposed using multivariate empirical mode decomposition (MEMD) into multivariate intrinsic mode functions (MIMFs). Then, the MIMFs corresponding to the main ambient noises can be identified by calculating and sorting energy percentage in descending order. Finally, the IMFs associated with strong interference noise, high-frequency and low-frequency noise are filtered out and suppressed by the energy percentage and frequency range. We investigate the feasibility and reliability of the proposed method using both synthetic data and field data. The results demonstrate that the proposed method can mitigate the mode mixing problem and clarify the main noise contributors by adding additional ambient-noise-assisted channels, hence separating the microseismic signal and ambient noise effectively and enhancing the S/Ns of microseismic signals.
1 Introduction
Microseismic monitoring technology is a useful tool for characterizing the structures, physical properties, and dynamic processes in the subsurface within a target region. This technique has been widely used in the monitoring of hydraulic fracturing in hydro-carbon reservoirs [1–3], coal mining [4, 5], geothermal exploration [6, 7], and CO2 capture and storage (CCS) [8]. Single-component (1-C) or three-component (3-C) receivers installed at the surface and/or in the borehole are anticipated to record not only the seismic event signals but also high-energy interference noises and random noises generated by motions such as mechanical vibrations [9–11]. Various excitations and strong noises could significantly reduce the detectability of weak but useful seismic signals in the monitoring data, thereby compromising the reliability of data processing and interpretation [12–14]. Therefore, it is essential to develop an effective method to suppressing interference noise in microseismic monitoring data.
Low signal-to-noise (S/N) microseismic recordings are usually abandoned without applying adequate denoising methods due to the small magnitudes of microseismic events obscured by noisy recording environments. Frequency-domain band-pass filtering is the most commonly used method in seismic monitoring processing for attenuating background noises and extracting microseismic signals, but the effect of this method may not be very satisfying if the background noises and microseismic signals are in the same frequency range. Researchers have made a great effort to develop novel methods for noise suppression and microseismic signal enhancement, such as polarization filtering [15], median filtering [16], mathematical morphology filtering [17], the singular value decomposition-based method [18, 19], and the time-frequency transform-based method [20–24]. In addition to high-frequency noise, the background interference noises are also of concern [13, 17, 21, 22]. Because the characteristics of microseismic signals in the noisy monitoring data are usually unclear, conventional denoising methods struggle to suppress the strong-energy, long-duration interference noises and retain the energy of microseismic signals. Thus, the improvement in the S/N of microseismic data is often limited.
Mode decomposition algorithms can adaptively decompose the nonlinear and nonstationary signals to analyze the local characteristic time scale and have been widely applied in seismic/microseismic signal processing, mechanical fault detection, structural health monitoring, and biomedical signal analysis [19, 25–31]. To overcome the problems of mode mixing, end effect, and lack of adaptability, mode-decomposition algorithms have progressed from empirical mode decomposition (EMD) [25] to ensemble empirical mode decomposition (EEMD) [27], complementary ensemble empirical mode decomposition (CEEMD) [28, 29], and variational mode decomposition (VMD) [30, 31]. By iteratively extracting the high-frequency components and their associated envelopes, the complex signal is decomposed into a set of intrinsic mode functions (IMFs) in the empirical mode decomposition based algorithms. Similarly, the VMD methods employ an optimization framework to separate the complex signal into multiple modes. To deal with multivariate data, the multivariate extension of EMD (i.e., multivariate EMD, or MEMD for short) and VMD (i.e., multivariate VMD, or MVMD for short) are proposed for processing multivariate data to obtain the IMFs with aligned frequency ranges [32–35]. Noise-assisted MEMD (NA-MEMD) [33], partial noise-assisted MEMD (PNA-MEMD) [36], and sinusoidal signal-assisted MEMD (SA-MEMD) [37] and harmonic-assisted MEMD (HA-MEMD) [38] are subsequently proposed to improve the performance of the MEMD method by adding additional channels with independent white noise, high-frequency band-limited noise, and a sinusoidal assisted signal, respectively.
These mode-decomposition algorithms have been widely employed in seismic/microseismic data denoising and arrival picking [19, 39–44]. The separation or reconstruction of signals is often accomplished in the mode decomposition based methods and their improvement approaches by the selection of IMF components. When reconstructing the signal, metrics like as correlation coefficient, kurtosis, mutual information entropy, and other parameters that characterize the signals of each IMF are calculated to provide various weight coefficients that emphasize the target signal. However, the study of low signal-to-noise ratio microseismic signals are hampered by noise because real-world signals are typically nonlinear and accompanied by strong ambient noise, and the features extracted directly from these signals usually contain a large amount of useless as well as noisy information that cannot effectively distinguish seismic signals from noise. Compared to the interference noises with long durations and high energies, the microseismic signals show very short duration (<1s) and unpredictable energies in the field data. The Low-S/N microseismic event may be identified from continuous recordings using rigorous detection thresholds, thus, the adaptive and effective separation of background noise and weak microseismic signal is critical for subsequent data processing. In this paper, we develop an adaptive noise suppressing method for microseismic data processing based on ambient-noise-assisted multivariate empirical mode decomposition (ANA-MEMD). In the proposed method, a new multichannel record that combines the noisy microseismic recording with preceding ambient noises is decomposed by the MEMD method into multivariate intrinsic mode functions (MIMFs). Then, the ambient records are utilized to assist in decomposing microseismic data and identifying main noise contributors. In this study, we first introduce the theory of EMD and MEMD, then elaborate on the ANA-MEMD method for noise suppression in microseismic data. Finally, we evaluate the performance of the proposed method by using synthetic and field data.
2 Methods
2.1 Empirical mode decomposition
As a data-driven approach, empirical mode decomposition (EMD) decomposes a signal adaptively into a finite set of oscillatory components known as intrinsic mode functions (IMFs) [25]. The original signal can be recovered by reconstructing all IMFs, which represent different vibrations whose instantaneous frequency reflects the local characteristics of the input signal. Two conditions are essential for calculating an IMF: 1) the number of extrema and the number of zero crossings should be different only by one; 2) the mean value of the upper and lower envelopes should be roughly zero [25]. In the EMD method, the decomposition is accomplished by removing the slowly oscillatory modes and separating the rapidly oscillating modes from the data. For a real-valued signal
where
Although a complex signal can be decomposed into several IMFs by EMD, the application of real data may be restricted by the mode-mixing problem due to the intermittency of a signal component or closely spaced spectral tones. To address the limitation of mode mixings, ensemble empirical mode decomposition (EEMD) [27, 40] and complementary ensemble empirical mode decomposition (CEEMD) [28, 29] are proposed successively by taking the noises into consideration. The purpose of incorporating white noise is to perturb the signal in its true solution neighborhood and ensure the extreme value points are distributed uniformly during the sifting process, therefore restraining mode-mixing.
2.2 Multivariate empirical mode decomposition
Signal acquisition using multicomponent receivers or multiple receivers is prevalent in engineering applications. The characteristic analysis of the system may be impacted by a scale arrangement uncertainty problem when each signal is decomposed independently using the EMD approach. Multivariate empirical mode decomposition has been introduced to overcome this issue by performing the same mode analysis on multivariate signals in various frequency scales and ensuring that each signal’s IMF number after decomposition is identical [32]. In the MEMD approach, a uniform sampling scheme based on the Hammersley sequence is used to calculate direction vectors. The n-dimensional signal envelops are obtained by taking a sequence of projection vectors along different directions in the n-dimensional space. After interpolating their extrema, the envelopes are averaged to generate the local mean of signals. One multivariate intrinsic mode function (MIMF) is produced by calculating the difference of the mean of all envelopes with respect to the original signals. This process is repeated until a sufficient number of MIMFs has been obtained or the stopping criterion is met. The MEMD decomposes a multivariate signal
where
(1) Create a uniform sampling point set on an (n-1)-dimensional sphere using the Hammersly sequence, and establish an n-dimensional spatial direction vector.
(2) Obtain the project sets
(3) Find the time instants
(4) Calculate the mean value using
(5) Extract the detail
As a multivariate extension of EMD, the MEMD is a significant improvement in multichannel signal processing, allowing for adequate alignment between the same index IMFs and facilitating inherent multiscale analysis. Similar to the standard EMD method, the mode mixing problem still exists in the MEMD method. To solve this issue, additional channels containing auxiliary signals are used to help the decomposition of the original multivariate signal, such as noise-assisted MEMD (NA-MEMD) [33], partial noise-assisted multivariate EMD (PNA-MEMD) [36], a sinusoidal signal-assisted MEMD (SA-MEMD) [37], and high-frequency harmonic-assisted MEMD (HA-MEMD) [38]. For the original n-dimensional multivariate signal, l-dimensional extra channels are added and then processed using the MEMD method as an (n + l)-dimensional signal. These methods can be summarized as follows.
(1) Generate l-dimensional assisted channels that are of the same length as the original multivariate signal;
(2) Combine the n-dimensional input multivariate signal with the assisted channels created in Step 1) to construct an (n + l)-dimensional signal;
(3) Decompose the new multivariate signal using the MEMD algorithm to extract the multivariate IMFs;
(4) Remove the l-dimensional IMFs related to the assisted signals from the multivariate IMFs in Step 3) and retain the n-dimensional IMFs related to the original signal.
It is worth noting that, except from differences in additional channels, these improved methods maintain the same processing flow as standard MEMD method.
2.3 Adaptive noise suppression based on ambient-noise-assisted MEMD (ANA-MEMD)
Microseismic monitoring data can be expressed as
where
In this study, we present ambient-noise-assisted multivariate empirical mode decomposition (ANA-MEMD) for decomposing noisy microseismic data and remove non-effective components for S/N enhancement of microseismic data. The auxiliary channels containing ambient noise are introduced in the decomposition process, which differs from the standard MEMD technique. To determine whether one MIMF (or IMF for single-component microseismic data) contains ambient noise, we calculate the energy percentage of the assisted ambient noise in each decomposed MIMF (or IMF for single-component microseismic data). In our method, strong interference noise is considered to persist and constitute the predominant portion of the ambient record. Finally, the MIMFs (or IMFs) components associated with ambient noise and outside the desired signal band are eliminated during the reconstruction process. Our method is organized as follows.
(1) For a low-S/N microseismic signal recording with a time window length of Nwin, we select ambient recordings with the same time window length preceding the microseismic data as additional assisted channels. In general, two window for single-component microseismic data, and one window for 3-C microseismic data. Strong random signals (including coherent seismic signals) must not be present in the additional assisted channels.
(2) After constructing a new multivariate signal by adding the noisy microseismic data with the above-assisted channels, we obtain the multivariate IMFs
(3) We calculate and sort the energy percentage of each MIMF
(4) Pre-set the band range
The above procedure is applicable to both single-component data and three-component microseismic data. The flowchart of the proposed method is shown in Figure 1.
3 Numerical examples
In this section, we demonstrate the performance of the proposed method using both single-component and three-component synthetic microseismic data. The synthetic signal is composed of two time-varying oscillation signals (regarded as persistent interference noises) with dominant frequencies of 20 Hz and 60 Hz, and an attenuated sine wave (regarded as seismic signal), which has the peak frequency of 100 Hz. Its composed components are expressed as the following equations.
Where
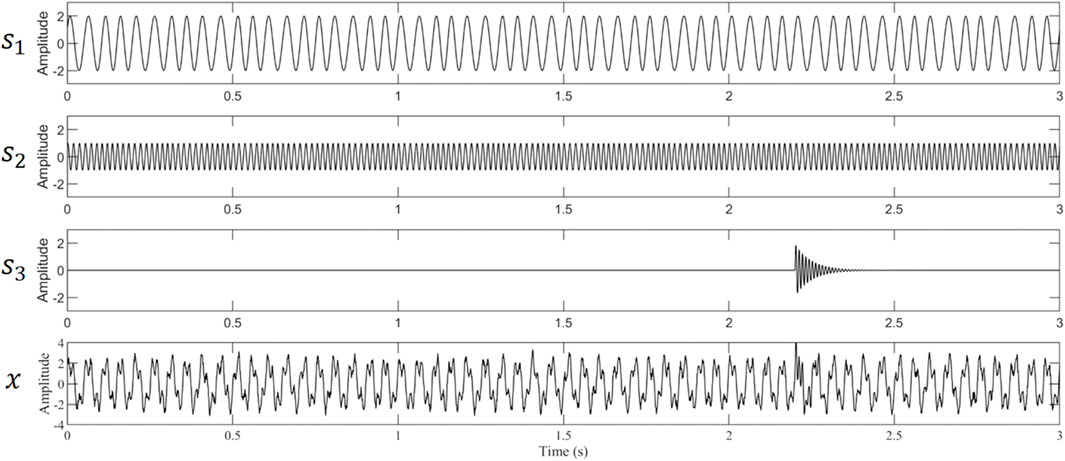
First, the above three source signals with the maximum amplitude ratio of 2:1:2 and Gaussian noise with the amplitude variance of 0.1 were applied to generate one single-component synthetic microseismic recording. The arrival time of seismic signal is 2.2 s and the sampling frequency is 1000 Hz. Figure 2 shows the waveforms of the synthetic microseismic data, it can be seen that the seismic signal becomes blurred due to the strong interference noise.
We compared the decomposition results of the synthetic microseismic record using the EMD method and the proposed ANA-MEMD method. Two 1-s long background noise recordings (0∼1 s and 1∼2 s) before the seismic signals were employed as extra assisted channels. Figures 3A, B illustrate the six IMFs that decomposed by above two methods, respectively. Channel 1, 2, and 3 in Figure 3B represent the IMFs corresponding to two background noise recordings and noisy microseismic signal, respectively. There is no doubt that the phenomenon of mode mixing has been alleviated by the addition of auxiliary noise channels. We demonstrated the viability of the proposed method in noise suppression using the aforementioned decomposition results. We calculated the energy percentage of each IMF in the ambient noise assisted channels (channel 1–2 in Figure 3B) and the peak frequency of each IMF in the noisy microseismic signal channel (channel 3 in Figure 3B), as shown in Figure 3C. By determining IMF related to the top two energy percentage (IMF 4 and 5, cumulative percentage greater than 80%), the high frequency noise (IMF1, the peak frequency >200 Hz), and the low frequency noise (IMF 6, the peak frequency <10 Hz), the IMF that contains the ambient noise can be identified. The denoised microseismic records by the proposed method and EMD method can be obtained by reconstructing the remaining IMFs, as shown in Figures 3D, E. Compared to the result of EMD method (black line in Figure 3E), the arrival of the seismic signal is clearly visible in the denoised waveform (black line in Figure 3D), while preserving as much the microseismic signal as possible.
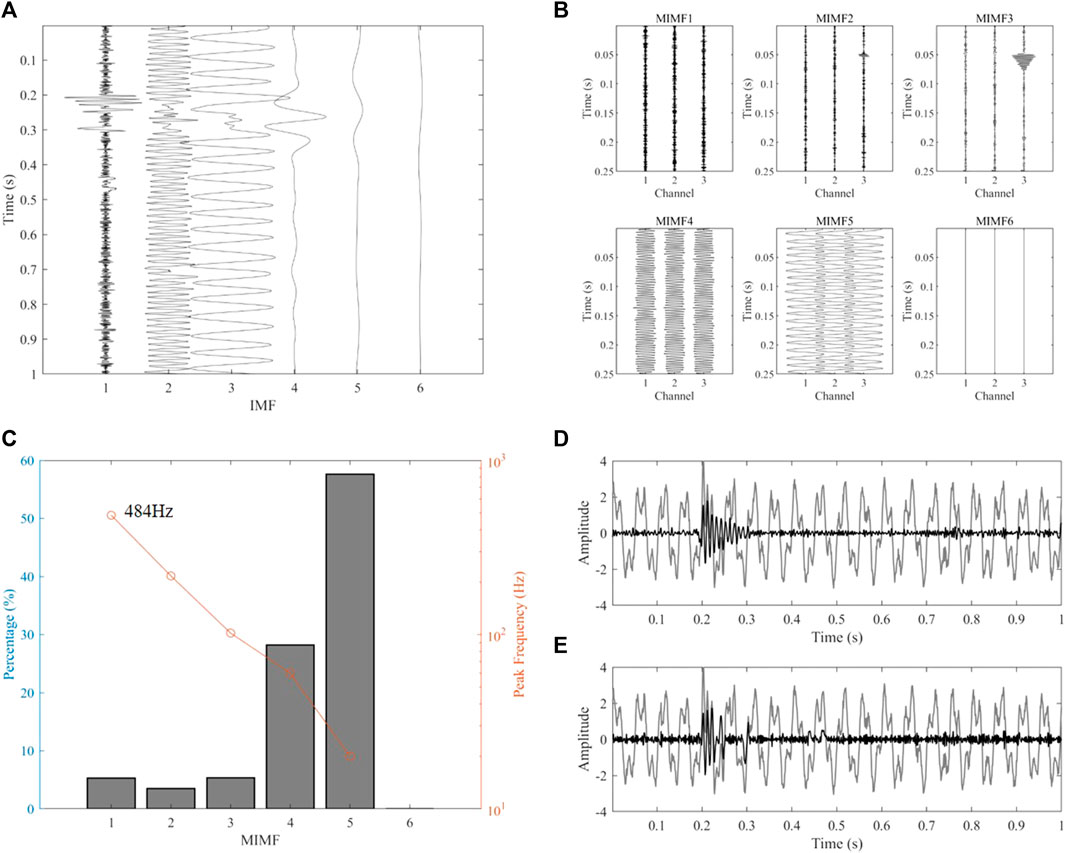
FIGURE 3. (A) Decomposition results of noisy microseismic waveform by the EMD method. (B) Decomposition results of the noisy microseismic waveform by the ANA-MEMD method. (C) The energy percentages of the IMFs in assisted channel and the peak frequencies of the IMFs in noisy microseismic record channel. (D) Comparison of the waveforms before (grey line) and after (black line) noise suppression by the proposed method. (E) Comparison of the waveforms before (grey line) and after (black line) noise suppression by the EMD method.
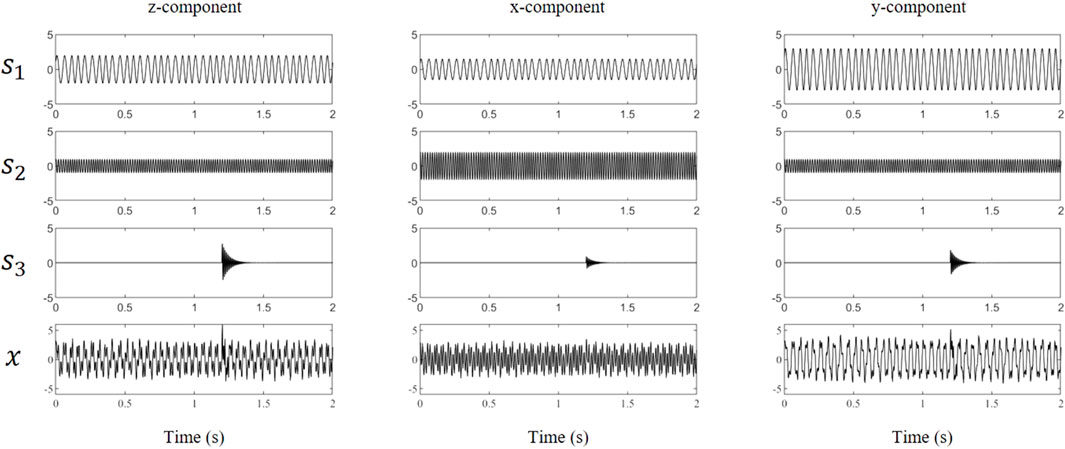
Three-component synthetic microseismic recording was constructed by the above three source signals and a mixing matrix and Gaussian noise with the amplitude variance of 0.2. The mixing matrix is given as
The arrival time of seismic signal is 1.2s and the sampling frequency is 1000 Hz. Figure 4 shows the waveforms of the synthetic microseismic data.
In the process of three-component microseismic data, one 1-s long background noise recordings (0∼1 s) before the seismic signals (1∼2 s) were employed as extra assisted channels. Figure 5A illustrates the six MIMFs that decomposed by the ANA-MEMD method. Channels (az, ax, and ay) and (z, x, and y) in Figure 5B represent the MIMFs corresponding to the background noise recordings and noisy microseismic signals, respectively. Similar to the processing flow for the above single-component data. We calculated the energy percentage of each MIMF in the ambient noise assisted channels and the peak frequency of each MIMF in the noisy microseismic signal channels, as shown in Figure 5B. By determining MIMF related to the top two energy percentage (MIMF 4 and 5, cumulative percentage greater than 80%), the high frequency noise (MIMF1, the peak frequency >200 Hz), and the low frequency noise (MIMF 6, the peak frequency <10 Hz), the MIMFs that contains the ambient noise can be identified. The denoised microseismic record can be obtained by reconstructing the remaining MIMFs, as shown in Figure 5C. The arrivals of the seismic signals are obvious in the denoised waveform (black line in Figure 5C), and the linearity of the three-component seismic signal is significantly enhanced (as shown in red lines in Figure 5D).
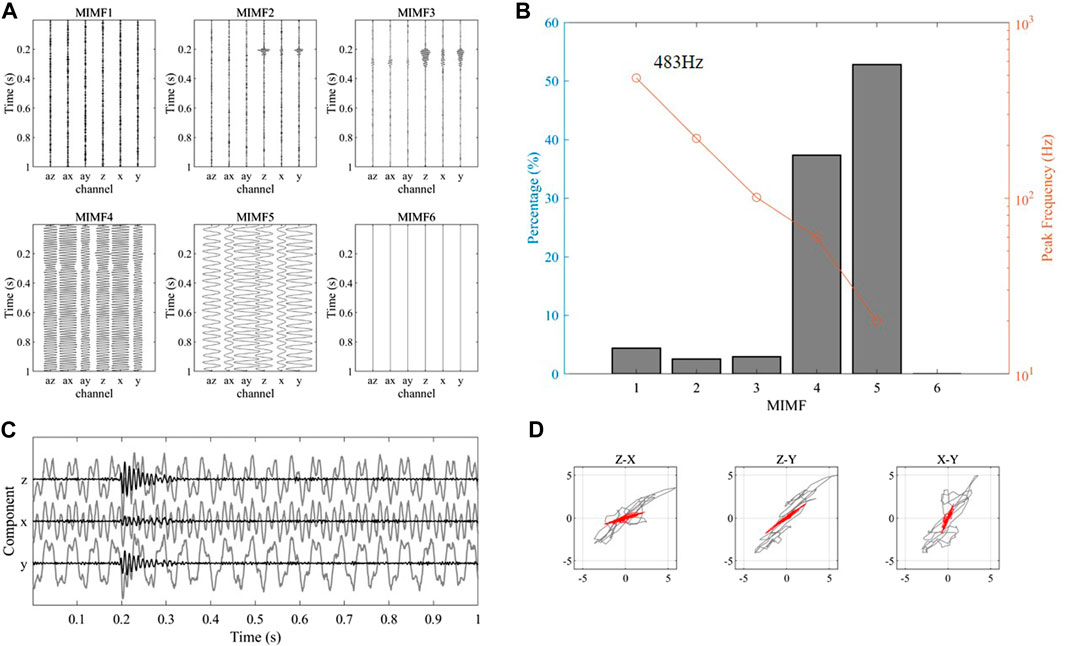
FIGURE 5. (A) Decomposition results of the 3-C noisy microseismic waveform by the ANA-MEMD method. (B) The energy percentages of the MIMFs in assisted channels and the peak frequencies of the MIMFs in noisy microseismic record channels. (C) Comparison of the waveforms before (grey lines) and after (black lines) noise suppression by the proposed method. (D) Comparison of the three-component seismic signal before (grey lines) and after (red lines) noise suppression by the proposed method.
Without loss of generality, the above test is repeated 50 times using synthetic three-component data with different S/Ns (1.9–5.5 dB) to verify the stability of the proposed method. To simulate varying S/Ns, we kept the amplitude of the background noise recordings and changed the amplitudes of the noise-free seismic signal. In addition, we also calculated the S/Ns and the linearities of the seismic signal before and after processing to quantitatively assess the method’s performance. The S/N is calculated using the following equation [12]:
where Anoise and Asignal are the root-mean-square amplitudes of the signals before and after seismic arrivals, respectively. The linearity
Where
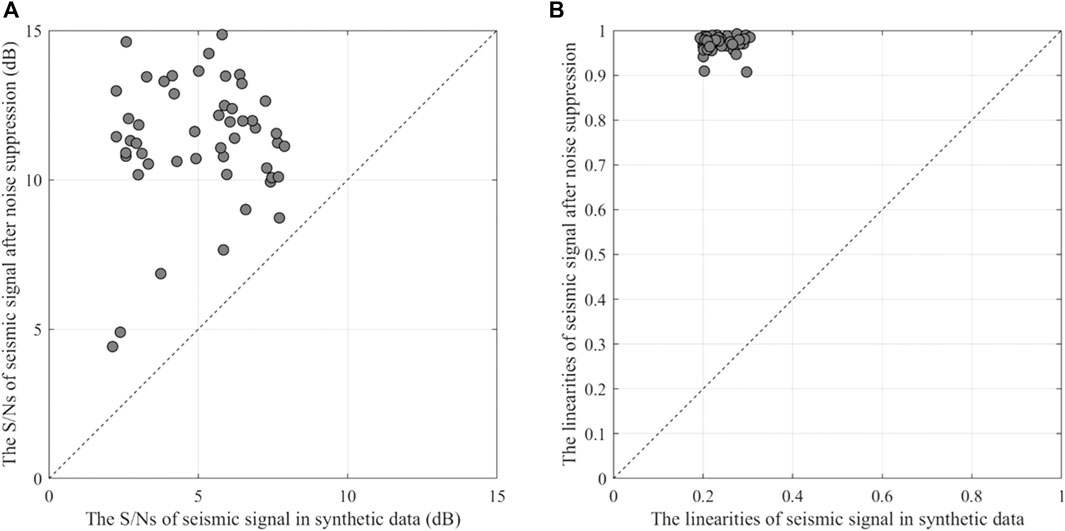
FIGURE 6. Comparison of S/Ns (A) and the linearities (B) of the three-component seismic signals before and after noise suppression by the proposed method in different tests.
4 Field data application
In this section, we evaluated the performance of the proposed method using field microseismic data. The field data in this study come from a hydraulic fracturing surveillance job in a shale play in the Fulin gas field of China. A temporary array comprising 12 levels of triaxle 15 Hz geophones was placed in the inclined section (the inclination is about 40°) of a horizontal well adjacent to the treatment well and used for monitoring the stimulation. A total of 63 microseismic events were detected during a hydraulic fracturing stage. Figure 7 shows the 3-C waveforms of one Low-S/N microseismic event, in which the red and blue line represent the arrival times of P- and S-waves, respectively. It is evident that significant background noises obscure the microseismic signal, and the arrivals of direct P- and S-waves are masked by strong interference noise. Observed interferences are most likely due to pumping operations or pumping-fluid-wellbore interactions.
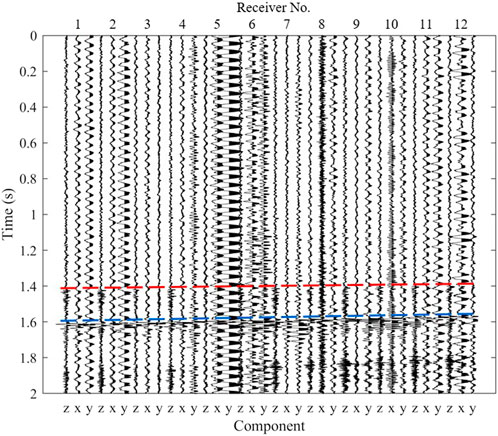
FIGURE 7. The waveforms of one low-S/N microseismic event. Red and blue dashed line represent the arrival times of P-wave and S-waves, respectively.
In this field data processing, we intercepted ambient noise recording with 1-s long time window (0∼1s in Figure 7) before the microseismic signal (1∼2s in Figure 7). The recordings in the shallowest receiver (Receiver No.1) were analyzed as an example. The multi-channel recordings are decomposed into 14 MIMFs, and their first ten MIMFs are shown in Figure 8A, with their frequencies decreasing sequentially. The seismic signal is divided into multiple MIMFs due to its wide frequency range. We calculated the energy proportion of each MIMF in the ambient noise assisted channels and the peak frequency of each MIMF in the noisy microseismic signal channels, as shown in Figure 8B. The energy percentages of each MIMF shows that the energy of background noise accounts for about 60% of the total energy, demonstrating the necessity of removing these strong noises. By determining MIMF related to the top energy proportion (MIMF 7), the high frequency noise (MIMF1 and MIMF2, the peak frequencies >300 Hz), and the low frequency noise (MIMF 9–14, the peak frequencies <10 Hz), the MIMFs that contains the ambient noise can be identified. The denoised microseismic record can be obtained by reconstructing the remaining MIMFs, as shown in Figure 8C. The P-wave (denoted by the red box) and S-wave (denoted by the blue box) arrivals of the seismic signals are clearly visible in the denoised waveforms (black line in Figure 8C), and the linearities of the three-component microseismic signal are greatly improved, particularly in P-wave.
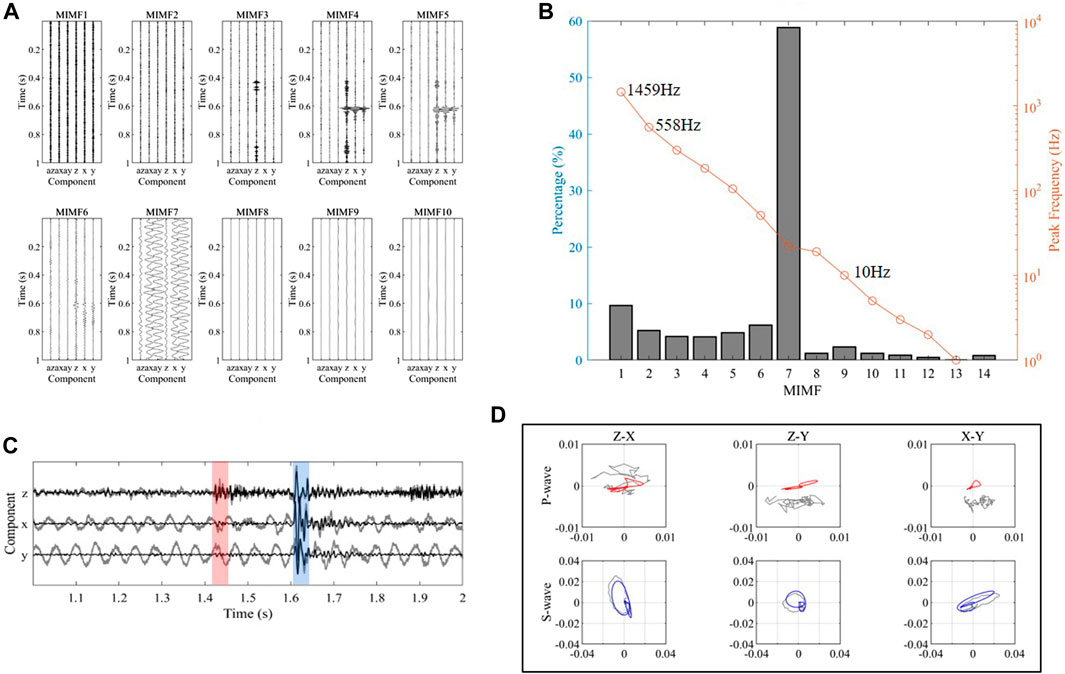
FIGURE 8. (A) Decomposition results of the recordings in Receiver No.1 by the ANA-MEMD method. (B) The energy percentages of the MIMFs in assisted channels and the peak frequencies of the MIMFs in noisy microseismic record channels. (C). Comparison of the waveforms before (grey lines) and after (black lines) noise suppression by the proposed method. The P-wave and S-wave arrivals are denoted by the red box and blue box, respectively. (D) Comparison of P-wave and S-wave before and after noise suppression by the proposed method. Grey lines represent the raw waveforms. Red and blue lines represent P-wave and S-wave after noise suppression, respectively.
We have processed the microseismic recordings of all 12 receivers in Figure 7. Band-pass filter (10,300 Hz), traditional MEMD based method, and multivariate wavelet denoising (MWD) method were also used to process the field data for comparison. In the traditional MEMD method, we calculated the kurtosis value of each MIMFs, and the microseismic signal is regarded as existing if the threshold of the kurtosis value is surpassed (the threshold is set to 3). Figure 9 shows the results using these methods. The S/Ns and the linearities of the microseismic signals before and after processing are shown in Figure 10. Band-pass filter only removes high-frequency and partial low-frequency noise. There remain strong interferences in the denoised microseismic data. Part of the arrivals of P- wave and S- wave after MEMD method with kurtosis criteria are highlighted, there remain strong interferences in the several receiver recordings. It demonstrates that uniform kurtosis criteria are incapable of dealing with complicated and variable noise. The noise reduction effect on S-wave of MWD method is not obvious, which is also reflected in the S/Ns after denoising. Although the traditional MEMD method and MWD method can increase the S/Ns, they decrease the linearities of P-wave and S-wave, showing that the denoising result cannot effectively preserve the amplitude of the seismic signals. It can be seen that the proposed method performs better with the consideration of increasing the S/N and maintaining the microseismic signal adaptively.
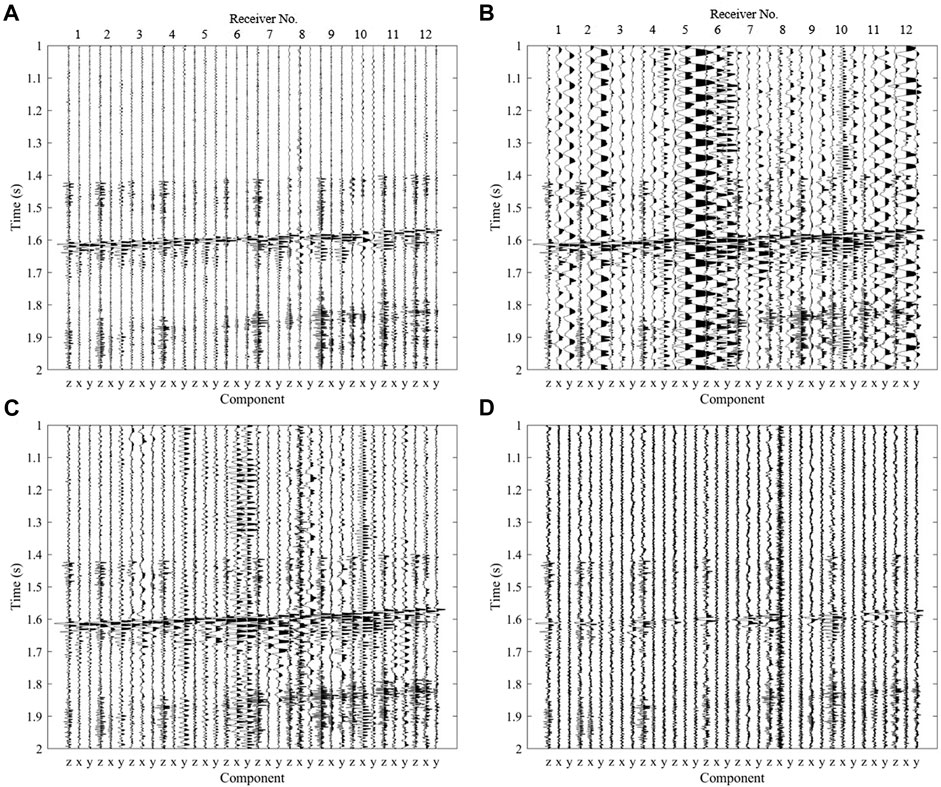
FIGURE 9. The microseismic signals after noise suppression using different methods. (A) The proposed method. (B) Band-pass filter method. (C) MEMD method with kurtosis criteria. (D) Multivariate wavelet denoising (MWD) method. The amplitude ranges of four microseismic waveforms subgraphs are the same.
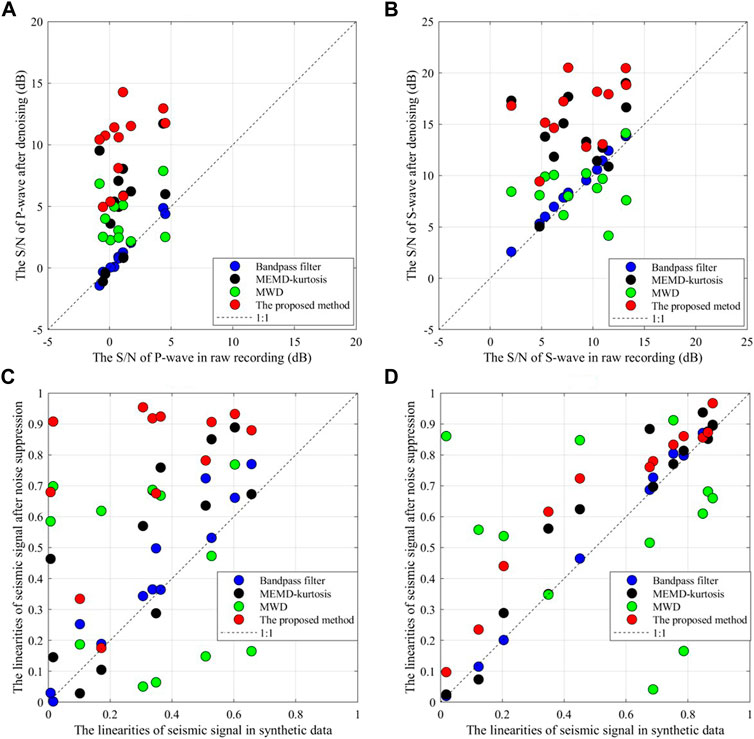
FIGURE 10. Comparison of S/Ns and the linearities of microseismic signals before and after noise suppression by the different methods. (A) the S/Ns of P-wave. (B) the S/Ns of S-wave. (C) the linearities of P-wave. (D) the linearities of S-wave.
We processed all 63 microseismic events using our method and compared the results with above three methods. For each event, we calculated the S/Ns and the linearities of P-wave and S-wave in different receivers and obtained the corresponding average values. Figure 11 displays the average values of the S/Ns and the linearities of P wave and S wave for all detected microseismic events before and after noise suppression by different methods. We can see that the proposed method can generally increase the S/Ns and the linearites of the microseismic signals more robustly than the other methods, especially for the P-wave of low S/N microseismic events. It is worth noting that the results of the proposed method are not necessarily better than those of the other methods. This is because the proposed method may also retain part of the ambient noise while preserving as much the microseismic signal as possible. Nevertheless, the fact that the S/Ns of the majority of microseismic signals increase when using the proposed method demonstrate the effectiveness of this method for microseismic signal denoising.
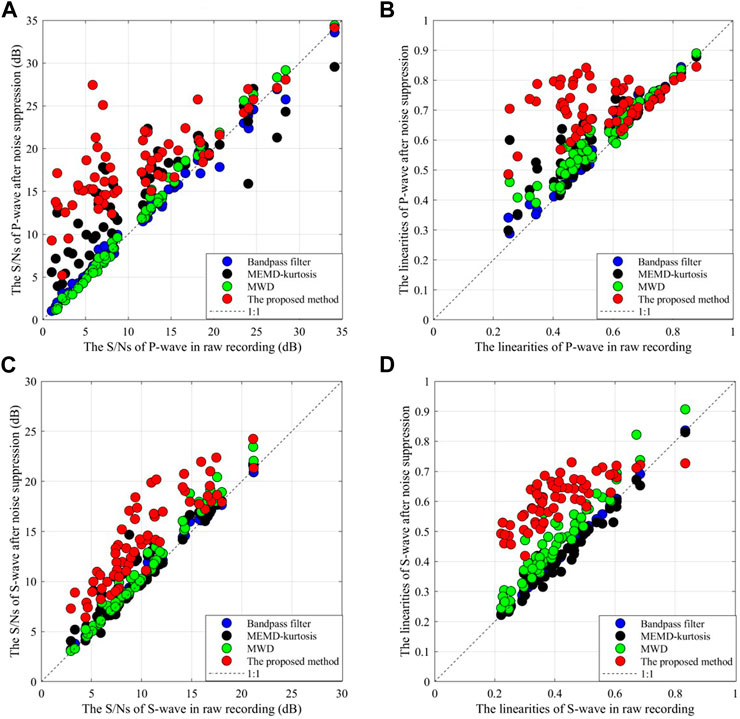
FIGURE 11. Comparison of the S/Ns and the linearities ofmicroseismic events before and after noise suppression by the different methods. (A) the S/Ns of P-wave for all events. (B) the linearities of P-wave for all events. (C) the S/Ns of S-wave for all events. (D) the linearities of S-wave for all events.
5 Conclusion
In this study, we have developed an adaptive noise suppressing method based on ambient-noise-assisted multivariate empirical mode decomposition (ANA-MEMD) for microseismic data. Multivariate empirical mode decomposition (MEMD) is employed to decompose multichannel seismic recording into multivariate intrinsic mode functions (MIMFs). To address the problem of mode mixing, ambient noise is used as assisted channels. Additionally, the dominant noise can be removed by calculating energy percentage with the ambient noise in the assisted channels. We have applied the proposed method to synthetic data and field data. The decomposing results show that the proposed method can successfully separate and remove the strong background interference noises. In the comparison to the results of conventional filtering methods, the proposed method is demonstrated to be able to improve the S/Ns of the microseismic signals. Thus, it is favorable for microseismic signal denoising. We must emphasize that while this study tested the feasibility of the proposed method using microseismic data, this method can be applied straight forward to the active seismic data (i.e., artificial exploration seismic data) or any other multicomponent geophysical dataset that can be represented as time series.
Data availability statement
The raw data supporting the conclusions of this article will be made available by the authors, without undue reservation.
Author contributions
ZY developed the method and wrote the original draft. YT and CH revised the manuscript. All authors participated in designing this research work. All authors contributed to the article and approved the submitted version.
Funding
This work is supported by the Key-Area Research and Development Program of Guangdong Province (Grant No. 2021B0101310002), and Science and Technology Program of Shenzhen Science and Technology Innovation Commission (Grant No. JSGG20201102160200001), and the National Key R&D Program of China (No.2020YFB0204802), and the China Petroleum & Chemical Corporation Project (Grant No. 322083).
Acknowledgments
We would like to thank SINOPEC Geophysical Company, Shengli Branch for providing us the field data.
Conflict of interest
The authors declare that the research was conducted in the absence of any commercial or financial relationships that could be construed as a potential conflict of interest.
Publisher’s note
All claims expressed in this article are solely those of the authors and do not necessarily represent those of their affiliated organizations, or those of the publisher, the editors and the reviewers. Any product that may be evaluated in this article, or claim that may be made by its manufacturer, is not guaranteed or endorsed by the publisher.
References
1. Maxwell S. Microseismic imaging of hydraulic fracturing: Improved engineering of unconventional shale reservoirs. Tulsa, OK: Society of Exploration Geophysicists (2014).
2. Eaton DW. Passive seismic monitoring of induced seismicity: Fundamental principles and application to energy technologies. Cambridge: Cambridge University Press (2018).
3. Li L, Tan J, Wood DA, Zhao Z, Becker D, Lyu Q, et al. A review of the current status of induced seismicity monitoring for hydraulic fracturing in unconventional tight oil and gas reservoirs. Fuel (2019) 242:195–210. doi:10.1016/j.fuel.2019.01.026
4. Westman E, Luxbacher K, Schafrik S. Passive seismic tomography for three-dimensional time-lapse imaging of mining-induced rock mass changes. The Leading Edge (2012) 31(3):338–45. doi:10.1190/1.3694902
5. Delplancke C, Fontbona J, Prado J. A scalable online algorithm for passive seismic tomography in underground mines. Geophysics (2020) 85(4):WA201–11. doi:10.1190/geo2019-0440.1
6. Foulger G. Geothermal exploration and reservoir monitoring using earthquakes and the passive seismic method. Geothermics (1982) 11(4):259–68. doi:10.1016/0375-6505(82)90032-3
7. Amoroso O, Festa G, Bruno PP, D'Auria L, De Landro G, Di Fiore V, et al. Integrated tomographic methods for seismic imaging and monitoring of volcanic caldera structures and geothermal areas. J Appl Geophys (2018) 156:16–30. doi:10.1016/j.jappgeo.2017.11.012
8. Verdon JP, Kendall JM, White DJ, Angus DA, Fisher QJ, Urbancic T. Passive seismic monitoring of carbon dioxide storage at Weyburn. The Leading Edge (2010) 29(2):200–6. doi:10.1190/1.3304825
9. Tary JB, Van der Baan M, Eaton DW. Interpretation of resonance frequencies recorded during hydraulic fracturing treatments. J Geophys Res Solid Earth (2014) 119(2):1295–315. doi:10.1002/2013JB010904
10. Vaezi Y, Van der Baan M. Interferometric assessment of clamping quality of borehole geophones. Geophysics (2015) 80(6):WC89–WC98. doi:10.1190/geo2015-0193.1
11. Harris D, Albaric J, Goertz-Allmann B, Kuehn D, Sikora S, Oye V. Interference suppression by adaptive cancellation in a high Arctic seismic experiment. Geophysics (2017) 82(4):V201–9. doi:10.1190/geo2016-0452.1
12. Tan Y, He C. Improved methods for detection and arrival picking of microseismic events with low signal-to-noise ratios. Geophysics (2016) 81(2):KS93–KS111. doi:10.1190/geo2015-0213.1
13. Huang W, Wang R, Li H, Chen Y. Unveiling the signals from extremely noisy microseismic data for high-resolution hydraulic fracturing monitoring. Sci Rep (2017) 7:11996. doi:10.1038/s41598-017-09711-2
14. Yu Z, Huang D, Tan Y, He C. Receiver orientation and event back-azimuth estimation for downhole microseismic monitoring using a probabilistic method based on P-wave polarization. Front Earth Sci (2023) 10:1027216. doi:10.3389/feart.2022.1027216
15. Akram J. An application of waveform denoising for microseismic data using polarization-linearity and time-frequency thresholding. Geophys Prospecting (2018) 66(5):872–93. doi:10.1111/1365-2478.12597
16. Zheng J, Lu JR, Jiang TQ, Liang Z. Microseismic event denoising via adaptive directional vector median filters. Acta Geophysica (2017) 65(1):47–54. doi:10.1007/s11600-017-0005-1
17. Li H, Wang R, Cao S, Chen Y, Huang W. A method for low-frequency noise suppression based on mathematical morphology in microseismic monitoring. Geophysics (2016) 81(3):V159–67. doi:10.1190/geo2015-0222.1
18. Lv H. Noise suppression of microseismic data based on a fast singular value decomposition algorithm. J Appl Geophys (2019) 170:103831. doi:10.1016/j.jappgeo.2019.103831
19. Zhang C, Shi Y, Liu J, Jiang S, Wang H, Wang Y. A denoising method of mine microseismic signal based on NAEEMD and frequency-constrained SVD. The J Supercomputing (2022) 78:17095–113. doi:10.1007/s11227-022-04554-9
20. Mousavi SM, Langston CA, Horton SP. Automatic microseismic denoising and onset detection using the synchrosqueezed continuous wavelet transform. Geophysics (2016) 81(4):V341–55. doi:10.1190/geo2015-0598.1
21. Mousavi SM, Langston CA. Automatic noise-removal/signal-removal based on general cross-validation thresholding in synchrosqueezed domain and its application on earthquake data. Geophysics (2017) 82(4):V211–27. doi:10.1190/geo2016-0433.1
22. Iqbal N, Liu E, McClellan JH, Al-Shuhail A, Kaka SI, Zerguine A. Detection and denoising of microseismic events using time-frequency representation and tensor decomposition. IEEE access (2018) 6:22993–3006. doi:10.1109/ACCESS.2018.2830975
23. Shao J, Wang Y, Yao Y, Wu S, Xue Q, Chang X. Simultaneous denoising of multicomponent microseismic data by joint sparse representation with dictionary learning. Geophysics (2019) 84(5):KS155–72. doi:10.1190/geo2018-0512.1
24. Li J, Li Y, Li Y, Qian Z. Downhole microseismic signal denoising via empirical wavelet transform and adaptive thresholding. J Geophys Eng (2018) 15(6):2469–80. doi:10.1088/1742-2140/aacf63
25. Huang NE, Shen Z, Long SR, Wu MC, Shih HH, Zheng Q, et al. The empirical mode decomposition and the Hilbert spectrum for nonlinear and non-stationary time series analysis. Proc R Soc A Math Phys (1998) 454:903–95. doi:10.1098/rspa.1998.0193
26. Barbosh M, Singh P, Sadhu A. Empirical mode decomposition and its variants: A review with applications in structural health monitoring. Smart Mater Structures (2020) 29(9):093001. doi:10.1088/1361-665X/aba539
27. Wu Z, Huang NE. Ensemble empirical mode decomposition: A noise-assisted data analysis method. Adv adaptive Data Anal (2009) 1(1):1–41. doi:10.1142/S1793536909000047
28. Yeh JR, Shieh JS, Huang NE. Complementary ensemble empirical mode decomposition: A novel noise enhanced data analysis method. Adv adaptive Data Anal (2010) 2(02):135–56. doi:10.1142/S1793536910000422
29. Torres ME, Colominas MA, Schlotthauer G, Flandrin P. A complete ensemble empirical mode decomposition with adaptive noise. In: 2011 IEEE international conference on acoustics, speech and signal processing (ICASSP); May 2011; Prague, Czech Republic. IEEE (2011). p. 4144–7.
30. Dragomiretskiy K, Zosso D. Variational mode decomposition. IEEE Transactions Signal Processing (2013) 62(3):531–44. doi:10.1109/TSP.2013.2288675
31. Li Y, Tang B, Jiao S. SO-Slope entropy coupled with svmd: A novel adaptive feature extraction method for ship-radiated noise. Ocean Eng (2023) 280:114677. doi:10.1016/j.oceaneng.2023.114677
32. Rehman N, Mandic DP. Multivariate empirical mode decomposition. Proc R Soc A: Math Phys Eng Sci (2010) 466(2117):1291–302. doi:10.1098/rspa.2009.0502
33. Rehman N, Park C, Huang NE, Mandic DP. EMD via MEMD: Multivariate noise-aided computation of standard EMD. Adv adaptive Data Anal (2013) 5(02):1350007. doi:10.1142/S1793536913500076
34. Rehman N, Aftab H. Multivariate variational mode decomposition. IEEE Trans Signal Process (2019) 67(23):6039–52. doi:10.1109/TSP.2019.2951223
35. Cao P, Wang H, Zhou K. Multichannel signal denoising using multivariate variational mode decomposition with subspace projection. IEEE Access (2020) 8:74039–47. doi:10.1109/ACCESS.2020.2988552
36. Huang W, Zeng J, Wang Z, Liang J. Partial noise assisted multivariate EMD: An improved noise assisted method for multivariate signals decomposition. Biomed Signal Process Control (2017) 36:205–20. doi:10.1016/j.bspc.2017.04.003
37. Ge S, Shi YH, Wang RM, Wang RM, Lin P, Gao JF, et al. Sinusoidal signal assisted multivariate empirical mode decomposition for brain–computer interfaces. IEEE J Biomed Health Inform (2017) 22(5):1373–84. doi:10.1109/JBHI.2017.2775657
38. Wu Z, Zhang Q, Wang L, Cheng L, Zhou J. Early Fault detection method for rotating machinery based on harmonic-assisted multivariate empirical mode decomposition and transfer entropy. Entropy (2018) 20:873. doi:10.3390/e20110873
39. Kirbas I, Peker M. Signal detection based on empirical mode decomposition and Teager–Kaiser energy operator and its application to P and S wave arrival time detection in seismic signal analysis. Neural Comput Appl (2017) 28(10):3035–45. doi:10.1007/s00521-016-2333-5
40. Han J, van der Baan M. Microseismic and seismic denoising via ensemble empirical mode decomposition and adaptive thresholding. Geophysics (2015) 80(6):KS69–KS80. doi:10.1190/geo2014-0423.1
41. Li X, Dong L, Li B, Lei Y, Xu N. Microseismic signal denoising via empirical mode decomposition, compressed sensing, and soft-thresholding. Appl Sci (2020) 10:2191. doi:10.3390/app10062191
42. Chen Z, Wang P, Gui Z, Mao Q. Three-component microseismic data denoising based on Re-constrain variational mode decomposition. Appl Sci (2021) 11:10943. doi:10.3390/app112210943
43. Candra AD, Suryani PE. Application of multivariate empirical mode decomposition to noise reduction in seismic signal. J Phys Conf Ser (2019) 1204(1):012004. doi:10.1088/1742-6596/1204/1/012004
Keywords: microseismic monitoring, seismic signal, interference noise, noise suppression, multivariate empirical mode decomposition
Citation: Yu Z, Huang Y, Fang Z, Tan Y and He C (2023) Adaptive noise suppression for low-S/N microseismic data based on ambient-noise-assisted multivariate empirical mode decomposition. Front. Phys. 11:1205935. doi: 10.3389/fphy.2023.1205935
Received: 14 April 2023; Accepted: 22 May 2023;
Published: 05 June 2023.
Edited by:
Yuxing Li, Xi’an University of Technology, ChinaReviewed by:
Zhenan Yao, East China University of Technology, ChinaXiao Chen, Shaanxi University of Science and Technology, China
Copyright © 2023 Yu, Huang, Fang, Tan and He. This is an open-access article distributed under the terms of the Creative Commons Attribution License (CC BY). The use, distribution or reproduction in other forums is permitted, provided the original author(s) and the copyright owner(s) are credited and that the original publication in this journal is cited, in accordance with accepted academic practice. No use, distribution or reproduction is permitted which does not comply with these terms.
*Correspondence: Chuan He, Y2h1YW5oZXVzQDE2My5jb20=
 Zhichao Yu
 Yingkun Huang1
 Yuyang Tan
 Chuan He
