 Jie Hu
 Hua Chen1*
- 1School of Mechatronic Engineering, Xi’an Technological University, Xi’an, China
- 2Norinco Group Testing and Research Institute, Huayin, China
- 3School of Optoelectronic Engineering, Xi’an Technological University, Xi’an, China
The identification and positioning of flying projectiles is a critical issue that affects the testing accuracy of equipment in ballistic testing technology. Traditional image processing methods are difficult to accurately extract targets due to the characteristics of small target size, fast speed, and strong fragmentation interference of projectiles ejected from the muzzle. This paper proposes a projectile recognition algorithm based on an improved YOLOX detection model for the detection and recognition of flying projectiles. The fast and accurate YOLOX model is used, and the network structure is improved by adding attention mechanisms in the feature fusion module to enhance the detection ability of small targets; the loss function is also improved to enhance the model’s iterative optimization ability. Test results show that the improved YOLOX model has significantly improved accuracy in projectile recognition compared to the original network, reaching 84.82%, demonstrating the feasibility of the proposed approach. The improved algorithm can be effectively used for small target scenarios in range testing and significantly improves the accuracy of recognition.
1 Introduction
Ballistic testing technology is a critical method for evaluating ballistic weapon systems. This typically involves conducting actual attack tests on ballistic weapons in a simulated environment to assess their performance and effectiveness [1]. The performance parameters of the flying projectiles in ballistic testing are important data supports for testing weapon performance, evaluating strike effects, and improving weapon effectiveness. Accurate identification of flying projectiles is a critical aspect of ballistic testing, as all parameters of flying projectiles rely entirely on their accurate identification. However, moving targets such as bullets fired from a gun barrel have the characteristics of small size, high speed, and numerous fragments, which make them difficult to capture using conventional measurement methods [2]. Consequently, this has become a major focus of research in current ballistic testing technology.
Currently, common detection devices for flying targets include radar, light screens, and CCD array cameras. Radar was the earliest detection method developed, which utilizes echo signals to calculate spatial position of targets. R.Yang [3] utilized Kalman filtering to process measurement data and predict ballistic trajectories and parameter identification of flying targets. However, radar often suffers from low accuracy and inability to track small targets. Light screens are widely used for target field measurements due to their simple setup, easy mobility, low cost, and effective target detection performance. To address the issue of measuring bullet velocity in target field environments, Z.Wu [4] and his team at Xi’an Technological University designed a velocity measurement system based on light screens, which has been reliably validated in actual target field environments. However, as testing environments become increasingly complex, light screens are prone to misidentifying, losing, and failing to obtain multi-dimensional information of bullet targets and fragments, and require strict detection conditions [5]. In recent years, with the rapid development of camera manufacturing and image processing technologies, high-speed cameras have made remarkable achievements in detecting moving targets [6]. High-speed cameras have advantages such as non-contact measurement, interchangeable lenses, and fast and convenient setup, making them unique in ballistic testing [7–9]. However, the issue of target identification under strong firelight and motion blur interference in target field environments has been a persistent challenge for the development of high-speed camera target field detection technology, and image-based bullet identification algorithms have thus become a focus of research.
The target bullet detection and recognition technology based on image data is a technique that uses image processing technology to analyze and process the target images obtained by high-speed cameras, frame by frame, in order to extract the target bullets from the background. Traditional processing methods such as image filtering, image enhancement, image segmentation, image transformation, feature extraction, feature selection, and image matching often use manual methods for feature design, such as SIFT, HOG, SURF [10–12], which limits the applicability of the algorithms. In addition, traditional algorithms are sensitive to environmental factors and can only be applied to specific scenes. As shown in Figure 1, in the target testing environment with large illumination changes and interference, there may be missed or false detections [13]. In addition, during the process of capturing flying projectiles, high-speed cameras are usually placed at a distance from the trajectory to ensure the accuracy of tracking mirrors and the completeness of the field of view [14]. As shown in Figure 2, in this case, the size of the small target projectile fired from the gun barrel typically does not exceed 8 pixels. During image filtering operations, target features are easily lost, resulting in a reduced degree of differentiation from surrounding fragments. Currently, there is no universally applicable image algorithm for target detection in the target field environment, which greatly limits the application of image-based target detection technology in target field experiments.

FIGURE 1. Main interference in the bullet image. (A) Shrapnel interference and (B) Flame interference.
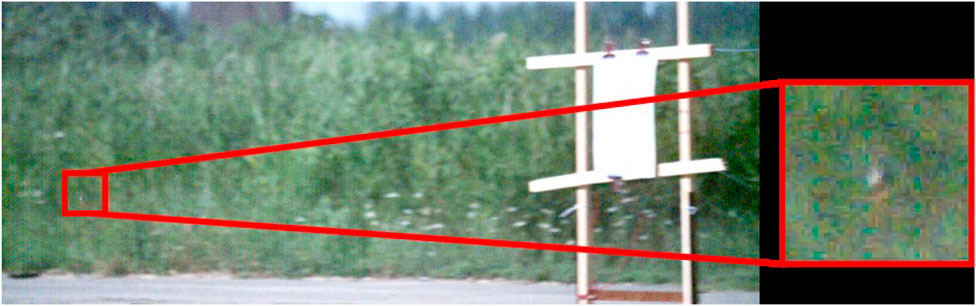
FIGURE 2. Bullet target in test image.
Deep learning is an algorithm capable of independently learning and extracting appropriate features from objects, with a trend of gradually replacing traditional image processing and machine learning algorithms [15–17]. Currently, target detection and recognition algorithms based on deep learning can roughly be divided into region proposal-based algorithms such as Fast-R-CNN [18] and regression-based algorithms such as YOLO [19,20] and SSD [21], as well as search-based algorithms such as reinforcement learning [22] and AttentionNet [23]. With the emergence of more powerful GPUs and the improvement in computer processing speed for large data, target detection and recognition technology based on deep learning will inevitably become faster, more accurate, and gradually applied to various industries.
Based on the advantages of deep learning, the target bullet detection and recognition algorithm designed in this paper is based on the YOLOX algorithm designed by S.Liu and Z.Ge’s team [24], and further improves the network to improve the accuracy of small target bullet detection. Deep convolutional neural networks are employed in the algorithm to achieve precise, reliable, and flexible recognition of target bullets [25].
2 Detection algorithm
2.1 Flight projectile detection and recognition process
The improved YOLOX deep learning network-based bullet recognition algorithm utilizes high-speed camera-captured images of flying bullets. Initially, a significant number of flying bullet images are collected from different scenarios in the target field environment, and then labeled accordingly. The bullet images are further processed through data augmentation and matched with the corresponding labels. Next, the YOLOX deep learning network is employed for training, and optimal network weight parameters are selected through iterative procedures. Finally, the trained network is tested on sample images to evaluate its performance. The objective is to attain precise identification of airborne projectiles within the input images.
2.2 Yolox detection algorithm
The YOLOX algorithm was proposed by S.Liu and Z.Ge’s team in 2021. Compared to the previous YOLO network, YOLOX achieves the best performance for the same task while maintaining highly competitive inference speed. The YOLOX object detection network is composed of four parts: the input end of the model, the Darket53 backbone network, the feature enhancement network Neck, and the model prediction end Prediction.
2.2.1 Input end
The input end of the YOLOX network uses two data augmentation methods, Mosaic and Mixup, and establishes a Focus structure. Mosaic data augmentation is a strategy introduced in the YOLOv4 network [26], which enhances the background of an image by randomly scaling, cropping, and arranging images. MixUp is an additional augmentation strategy added on top of Mosaic, which effectively enhances images by fusing two images together with a certain fusion coefficient, almost without increasing computation [27]. The Focus structure selects every other pixel in an image to obtain four independent feature layers, which are then stacked to concentrate width and height information into channel information. The concatenated feature layers increase from three channels to twelve channels, expanding the channel count fourfold.
2.2.2 Backbone
Backbone is the main structure of YOLOX. The main feature extraction network used in YOLOX is CSPDarknet53. CSPDarknet53 consists of 72 convolutional layers, each with a size of 3 × 3 and a stride of 2, which can perform feature extraction and progressive downsampling. The CSP module can enhance the model’s learning ability while making the model lightweight and reducing its memory consumption. The module uses the SiLU activation function, which has no upper bound and a lower bound, is smooth, and is non-monotonic. It performs better than traditional ReLU activation functions on deep models.
2.2.3 Neck
The Neck feature fusion structure in YOLOX is based on three key components: Feature Pyramid Networks (FPN), Spatial Pyramid Pooling (SPP), and Path Aggregation Networks (PAN). FPN combines low-level features with high-level features to take advantage of the high resolution of low-level features and the rich semantic information of high-level features, resulting in more accurate multi-scale feature prediction [28]. This approach also enhances small object detection by predicting multi-scale features independently. SPP addresses the issue of arbitrary input sizes by pooling each feature map and connecting them to fully connected layers, thereby increasing the network’s receptive field [29]. Meanwhile, PANet applies downsampling after upsampling and combines features from different levels to create a bottom-up feature pyramid structure that complements FPN, resulting in the retention of more shallow location features and further improvement of the model’s overall feature extraction capability [30].
2.2.4 Prediction
Prediction mainly consists of Decoupled-Head, Anchor-Free, Label Assignment, and Loss Calculation, which implement the classification and regression functions of the model. Decoupled Head, also known as Decoupled Head Network, is used to compensate for the insufficient expressive power of the original detection head. Decoupled Head separates regression and decoupled classification into two parts. Firstly, the class output is used to judge the predicted scores of the learning targets’ categories. Then, the obj_output and reg_output are used to predict and judge the position and coordinate information of the target boxes. Finally, the three outputs are fused to obtain feature information. The Anchor-Free structure connects the predicted boxes with the annotated boxes and introduces the size information of the downsampled feature maps to generate anchor boxes containing both the predicted box and target box information. Compared to the previously commonly used Anchor-based structure, this method greatly reduces the required number of parameters. Label Assignment is used to select positive samples from anchor boxes for network iteration. The core of the filtering method adopted by YOLOX is SimOTA. First, the anchor boxes are screened to extract the position IoU matrix [31], and then the LOSS function is calculated for the selected candidate detection boxes and ground truth. The cost function is calculated by weighted summation of the obtained loss functions, as shown in Eq. 1.
In the equation, Cij represents the total loss for a specific bounding box (i, j).
After label assignment, the correspondence between the ground truth boxes and the predicted positive sample boxes can be obtained. YOLOX calculates the loss value between the ground truth boxes and the positive sample boxes using the traditional IoU method.
2.3 YOLOX algorithm improvement principle
The traditional YOLO network exhibits some limitations in detecting small objects. These limitations primarily arise from the grid-based approach, which imposes spatial resolution constraints and hinders accurate detection of small objects due to insufficient spatial precision within grid cells. Additionally, small objects often require contextual information from their surrounding environment for precise detection. However, traditional YOLO networks focus only on local features within each grid cell, disregarding the background information that can aid in detecting small objects in complex scenes. Small objects are also more susceptible to occlusion and background interference, and YOLO’s single-stage detection method may struggle to effectively handle these challenges, resulting in decreased accuracy for partially occluded or low-contrast small objects against the background.
This paper proposes using the CBAM attention mechanism and CIoU loss function to enhance the performance of YOLO networks in detecting small objects. The channel attention module in CBAM emphasizes important feature channels to capture key features of small objects, improving detection accuracy. The spatial attention module reduces background interference by focusing on regions where small objects are located. Multi-scale fusion in CBAM combines features from different scales, aiding precise localization and classification of small objects. CIoU extends the IOU metric by considering geometric properties, providing a more accurate representation of bounding box similarity. The unmatched object penalty in YOLO reduces false positives by encouraging smaller bounding boxes when no object is present, improving detection performance for small targets. The improved network structure is shown in Figure 3.
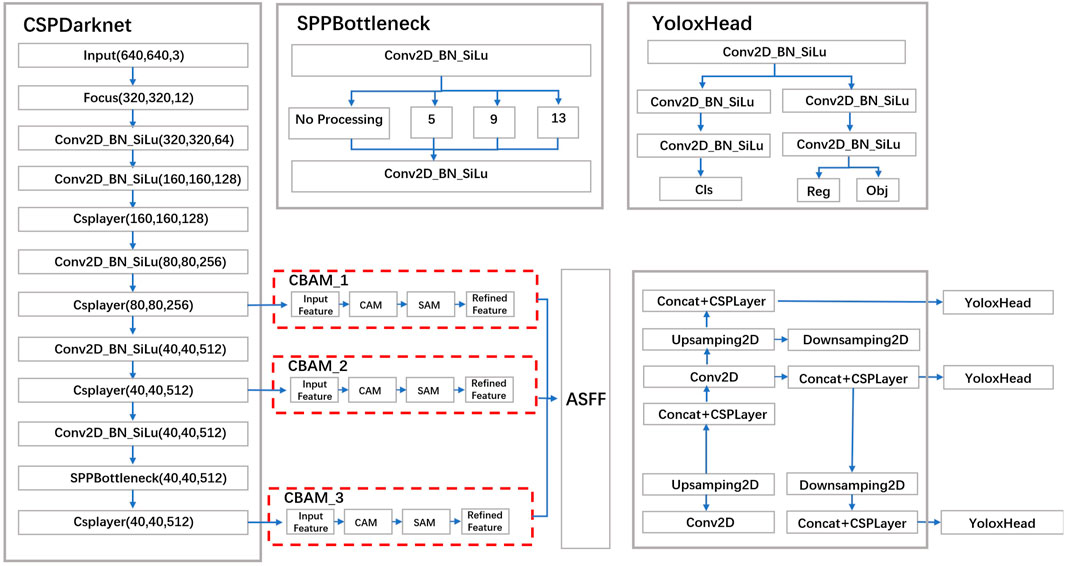
FIGURE 3. Improved yolox network.
2.3.1 CBAM attention mechanism
In this paper, we use the CBAM [32] attention mechanism to improve the traditional YOLOX network. CBAM stands for Convolutional Block Attention Module, which is a type of attention mechanism designed for use in convolutional neural networks. Its purpose is to automatically identify key features in the feature map and enhance the importance of these features while reducing the impact of non-key features.
Compared with the original network, this network pays more attention to the relevant features of small objects, which can avoid missing detection. Due to the characteristics of low resolution and less visual information, it is more difficult to identify small objects compared with large objects. Therefore, the CBAM module is added to the Dark3 module of the shallow network, and attention weights are inferred from both spatial and channel dimensions, and finally multiplied by the 80 × 80 ratio feature map, which further enhances the feature response of small objects. The structure of the CBAM module is shown in Figure 4.
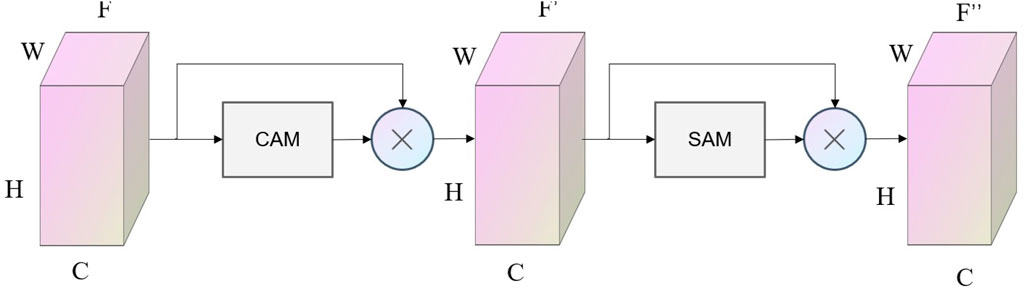
FIGURE 4. Structure of the CBAM module.
The CBAM achieves this goal by using two independent attention modules: the channel attention module (CAM) to evaluate the correlation between channels, and the spatial attention module (SAM) to evaluate the correlation between positions.
The CAM evaluates the importance of each channel in the feature map using a fully connected layer and sigmoid activation function, generating a weight coefficient that represents the relative importance of each channel. The SAM evaluates the importance of each position in the feature map using a convolutional layer and softmax function, generating a position weight coefficient. Finally, the outputs of the CAM and SAM are combined and used as weight coefficients to weight the feature map. The resulting adjusted feature map has enhanced weight coefficients for key features and reduced influence for non-key features. The structure of the CAM module is shown in Figure 5.
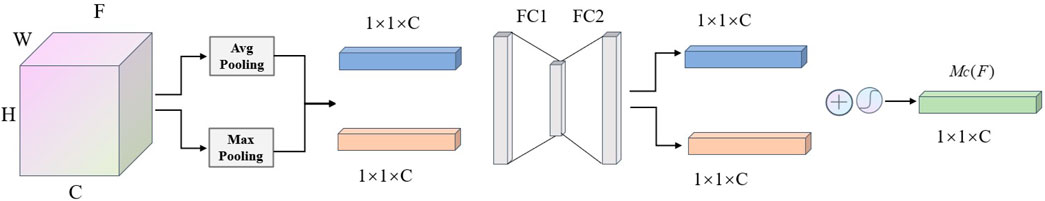
FIGURE 5. Structure of the CAM module.
As shown in Figure 5, the CAM module first performs maximum pooling and average pooling in the spatial domain of the input feature map F of size H× W× C, obtaining two 1 × 1× C channel information vectors, which are then input to a Multi-Layer Perceptron (MLP) and summed separately. Finally, the sigmoid activation function is applied to obtain a weight coefficient Mc, which is multiplied by the original feature map to obtain the channel attention feature mapF0, as shown in Eqs 2, 3.
In the equation, F is the input feature map, AvgPool represents the average pooling operation, MaxPool represents the maximum pooling operation, MLP represents the multilayer perceptron, σ is the sigmoid activation function, Mc(F) is the channel attention weight coefficient, is the channel attention feature map.
In the CBAM module, the feature map F is processed by the CAM module to obtain the channel attention feature map F′, which is then input into the SAM module.
The SAM module is mainly used to calculate the spatial importance of the feature map, thereby improving the network’s perception ability in the spatial dimension. The SAM module includes two sub-modules: channel mixed pooling and channel fully connected, as shown in the specific structural diagram below: From Figure 6, it can be seen that the feature maps first undergo max-pooling and average-pooling operations in the channel domain in the SAM module, resulting in two H× W× 1 spatial information maps and the preliminary channel attention maps. The channel fully connected sub-module is a separate fully connected layer, and its output is a weight vector of the same size as the number of channels. This vector is activated by the sigmoid function to ensure that the weight of each channel is a value between 0 and 1, representing the importance of that channel in the spatial dimension. These weights form the spatial attention map. After a 7 × 7 convolutional layer and sigmoid activation function, the weight coefficients MS are obtained. Multiplying the weight coefficients MS with the input feature maps produces the final mixed-domain attention feature maps, as shown in Eqs 4, 5.
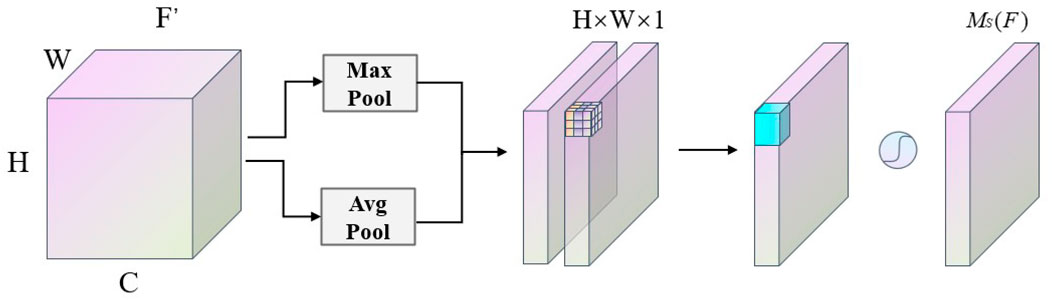
FIGURE 6. Structure of the SAM module.
In the above equation, F′ is the channel attention feature map, AvgPool is the average pooling operation, MaxPool is the max pooling operation, f7×7 is the 7 × 7 convolutional operation, MS(F′) represents the spatial attention weight coefficients, and F″ is the final mixed-domain attention feature map.
In summary, the SAM module enhances the network’s spatial perception ability by performing spatial attention calculations on the feature maps. This improves the network’s ability to perceive spatial information, and therefore improves its performance on various visual tasks.
CBAM attention mechanism can be easily inserted into existing convolutional neural networks to improve their performance. It can be applied to various computer vision tasks such as image classification, object detection, and semantic segmentation.
The advantages of the CBAM attention mechanism are that it can automatically learn key features and effectively reduce unnecessary features, making the network more concise [33]. Additionally, the CBAM attention mechanism can be inserted before or after convolutional layers to perform more fine-grained adjustments on the network. It is an effective method to improve the performance of convolutional neural networks, as it can automatically learn important features in the feature map and strengthen their importance while reducing the influence of non-key features. In this paper, the CBAM attention module is introduced into the feature extraction network to enhance its ability to recognize and extract key details.
2.3.2 Loss function optimization
In neural networks, the loss function serves the purpose of evaluating the degree of dissimilarity between the model’s predicted values and the true values [34]. Generally, the smaller the computed loss value, the better the model’s performance [35]. During the training stage of the model in this paper, the loss function is primarily employed. Following each batch of training data fed into the model, the predicted values are obtained through forward propagation, and subsequently, the loss function calculates the deviation between the predicted values and the true values, resulting in a loss value. After obtaining the loss value, the model updates its various parameters via backpropagation to minimize the loss between the true values and the predicted values, consequently narrowing the gap between the predicted values generated by the model and the true values, ultimately achieving the learning objective.
YOLOX uses the IoU (Intersection over Union) loss function, which is the most commonly used metric in the field of object detection. The calculation method of IoU is as follows:
IoU reflects the detection effect of the bounding box and the ground truth bounding box, and is insensitive to scale, making it widely used in neural network training. However, when the bounding box and the ground truth bounding box do not intersect, IoU cannot perform effective gradient backpropagation, which interferes with learning training. In addition, the value reflected by IoU is essentially the intersection-over-union ratio of the two, only considering the overlapping area between the predicted box and the ground truth box, without considering the position information of the predicted box, which cannot accurately reflect the degree of overlap between the two [36].
In response to the flaws of IoU, the idea of GLoU was proposed in paper [37]. Since IoU is a ratio concept, it is insensitive to the scale of the target object. However, the regression loss (MSE loss, L1-smooth loss, etc.) optimization for BBox in detection tasks is not equivalent to IoU optimization, and the Ln norm is also sensitive to the object’s scale, and IoU cannot directly optimize the non-overlapping parts [38]. GIoU directly sets IoU as the regression loss, first calculating the minimum closed area of the two boxes, then calculating the IoU, then calculating the proportion of the area not belonging to the two boxes in the closed area, and finally subtracting this proportion from IoU to obtain GIoU.
The range of IoU is (0, 1), but GIoU has a symmetrical interval, with a range of (−1, 1). When the two overlap, the maximum value is 1, and when there is no intersection and they are infinitely far apart, the minimum value is −1. Therefore, GIoU has a significant improvement in distance measurement. Unlike IoU, which only focuses on the overlapping region, GIoU not only focuses on the overlapping region but also on the non-overlapping region, which better reflects the degree of overlap between the two.
On the basis of GLoU, Z.Zheng [39] further proposed the DIoU (Distance-IoU) function, which takes into account the distance, overlap rate, and scale between the target and the anchor. The calculation method of DIoU is expressed as follows:
In the equation, b and bgt represent the center points of the predicted box and the ground truth box, respectively, and rho represents the Euclidean distance between the two center points. c represents the diagonal distance of the minimum enclosing region that can simultaneously contain the predicted box and the ground truth box. The DIoU loss can directly minimize the distance between the two target boxes, making it much faster to converge than the GIoU loss. For the case where the two boxes are horizontally and vertically aligned, the DIoU loss can enable very fast regression, while the GIoU loss almost degenerates to the IoU loss. DIoU can also replace the traditional IoU evaluation strategy and be applied in non-maximum suppression (NMS) to obtain more reasonable and effective results [40]. Furthermore, considering the aspect ratio of the bounding box based on DIoU, CIoU [37] is proposed with the following penalty term:
In the equation, a is the weight function, v is used to measure the similarity of aspect ratio, which is defined as:
The CIoU loss function simultaneously considers the coverage area, center point distance, and aspect ratio, which effectively improves the convergence speed and accuracy of the model [41]. Therefore, in this paper, the CIoU loss function is used to replace and optimize the loss function part of the YOLOX network.
3 Experimental preparation and implementation
3.1 Construction of the target field environment projectile dataset
The target field environment projectile dataset is obtained from high-speed CCD imaging during actual ballistic tests. The camera was set at a predetermined distance of 15 m from the shooting range. The dataset consists of ten sets of tracking images, totaling 1,200 images. Each set of images corresponds to a separate shooting test, covering different target field backgrounds and environmental lighting levels. Each set of captured images captures the entire process from bullet muzzle to target impact. The camera model used is the Phantom v1612, capable of reaching a maximum frame rate of 16,600 at a resolution of 1280 × 800. It performs well in high-speed capture scenarios and is suitable for tracking and capturing flying bullets. The captured images have a resolution of 1280 × 512 and were annotated using the LabelImg software. The bullet heads during the shooting process were annotated as target objects, including their category and specific pixel positions. The dataset was divided into training, testing, and validation sets following an 8:1:1 ratio.
3.2 Experimental environment
The experimental environment of this study was Ubuntu 18.04, with an Intel Core i9-9900X CPU (3.50 GHz) and an NVIDA GeForce GTX 2080Ti (11 G RAM). The deep neural network was trained and tested using the Pytorch1.9 framework, with Python version 3.7 and Pycharm version 3.2.0.
3.3 Experimental steps
The main experimental process of this study is divided into the following steps:
(1) Randomly divide the dataset into training set, validation set, and test set, and the neural network obtains the Ground-Truth of all annotated categories.
(2) Train the network with the weights of the VOC dataset as the initial input and set the epoch to 100 to obtain the pre-training weights for the YOLOX deep learning network.
(3) Train the network and divide the training process into two stages: the frozen stage and the unfrozen stage. The initial learning rate is set to 0.001, which changes with the epoch. In addition, the initial learning rate can be determined based on the quality of the training results. The optimization process uses the SGD optimizer to update the parameters.
(4) Use the trained deep learning network to validate and test the dataset, and obtain the average precision AP (Average Precision) based on the validation results to evaluate the learning performance and detection accuracy of the projectile detection of the neural network.
4 Results
Four sets of actual high-speed mirror recordings from the target field were selected as test objects for the experiments (denoted as groups A-D). Each group of videos was decomposed into frames and a random set of test images was extracted. The visible conditions of the projectiles included common interferences such as flame, fragment, and motion blur to simulate realistic experimental environments. The YOLOX network with different levels of improvement was applied to process the A-D groups, with “×” indicating the corresponding improvement method was not used in the algorithm model and “√” indicating that the corresponding improvement method was used in the algorithm model. The actual improvement effect of the network was tested by comparing the recognition results with manually labeled results and calculating the average precision (AP). The results of the experiments are shown in Table 1.
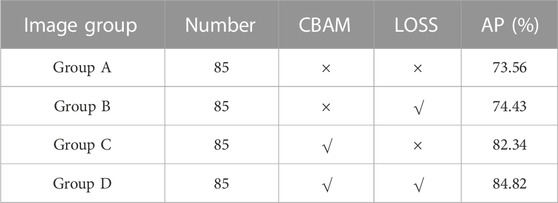
TABLE 1. AP for each test set.
The experimental results show that adding attention mechanism and improving the loss function in the network structure can effectively improve the recognition accuracy. The improvement is more significant with the addition of attention mechanism, and the network structure using both attention mechanism and loss function improvement has the highest recognition rate.
We compared the recognition performance of the original YOLOX network and the improved YOLOX network proposed in this paper, as well as the YOLOv5 detection algorithm as a control group, for identifying flying projectiles in different scenarios, as shown in Figure 7. To demonstrate the improvement of the algorithm more intuitively, we selected five images of flying projectiles under different lighting conditions, target backgrounds, and projectile shapes, and compared their recognition results.
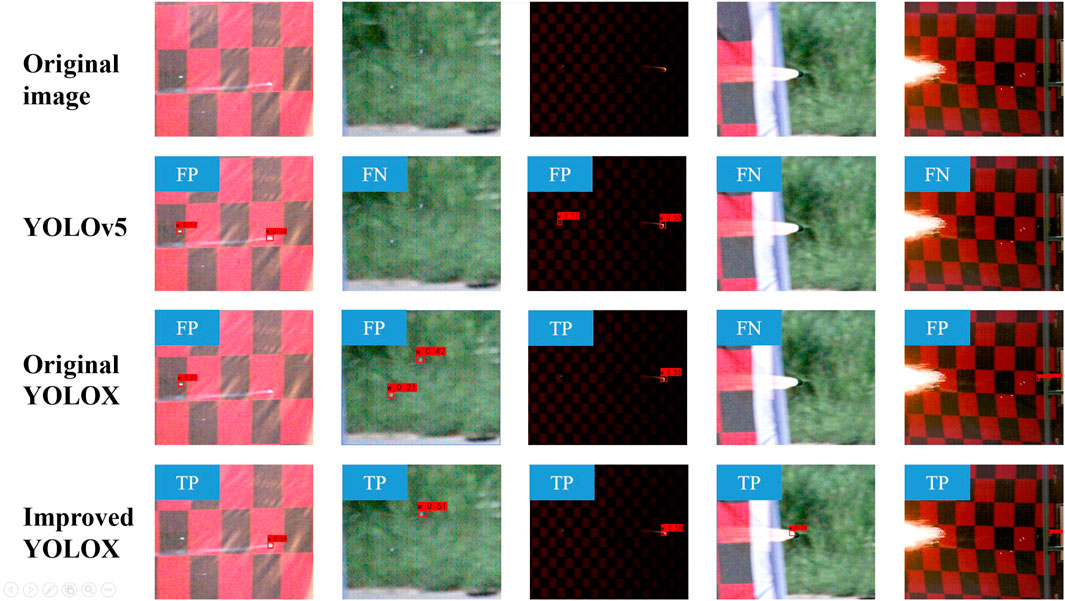
FIGURE 7. Comparison of detection performance before different network.
The recognition results were marked using FP (false positive), TP (true positive), FN (false negative), and TN (true negative). It can be observed that YOLOv5 has poor recognition performance, with mostly false negatives, meaning it fails to correctly identify the projectile targets. Although the original YOLOX network improved the detection performance, its low discriminability of small target features led to misclassifying surrounding debris as target projectiles, resulting in multiple incorrect target identifications in a single image. The improved YOLOX network effectively improves the detection performance while avoiding the occurrence of false positives. A comparison of various indicators between the original network and the final improved network is presented in Figure 8.
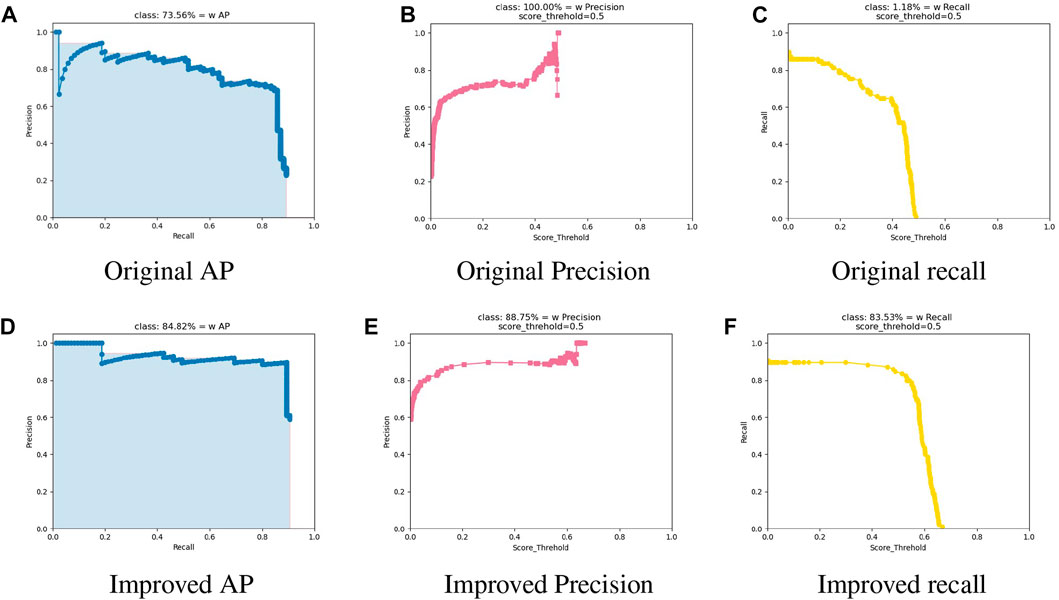
FIGURE 8. Comparison of metrics before and after network improvement. (A) Original AP, (B) Original Precision, (C) Original recall, (D) Improved AP, (E) Improved Precision and (F) Improved recall.
5 Conclusion
In order to address the challenge of recognizing flying projectiles in shooting range environments using traditional methods, this paper proposes a novel approach utilizing an improved YOLOX object detection model. Specifically, CBAM attention mechanisms are added to the three effective feature layers that feed into the feature pyramid network. Additionally, the loss function is replaced and improved to enhance the model’s ability to extract small targets and improve its convergence speed.
Experimental results demonstrate that the proposed method achieves high recognition accuracy and shows promising potential for application in the shooting range testing environment. In future work, the recognition results can be combined with camera calibration data to achieve further functions such as measuring the flight trajectory, velocity, and orientation of the projectiles. Furthermore, expanding the dataset and continuing to refine the network architecture are expected to further improve the recognition accuracy.
In summary, this paper presents an effective and efficient method for identifying flying projectiles in shooting range environments. The proposed method not only outperforms traditional methods, but also opens up new possibilities for more comprehensive analysis of projectile behavior in real-world scenarios.
Data availability statement
The raw data supporting the conclusion of this article will be made available by the authors, without undue reservation.
Author contributions
Each authors contributed to the research work. JH and HC proposed the approach and designed the experiments; JH and YX performed the experiments; JH, YX, and YF analyzed the data and wrote the manuscript. All authors contributed to the article and approved the submitted version.
Acknowledgments
We would like to thank the reviewers for the valuable and constructive comments that helped us improve the presentation.
Conflict of interest
The authors declare that the research was conducted in the absence of any commercial or financial relationships that could be construed as a potential conflict of interest.
Publisher’s note
All claims expressed in this article are solely those of the authors and do not necessarily represent those of their affiliated organizations, or those of the publisher, the editors and the reviewers. Any product that may be evaluated in this article, or claim that may be made by its manufacturer, is not guaranteed or endorsed by the publisher.
References
1. Chao F, Du J, Mu G, Yong Q, Guo Z. Present Situation and Development Trend of Intelligent Ammunition Test Measuring in Range. Firepower & Command Control (2014) 39:181–4.
2. Dong T, Gao F, Guo Q, Chen D, Tan L, Gong L. Optimization method for detection a flying bullet. Open Phys (2022) 20:657–67. doi:10.1515/phys-2022-0063
3. Yang R, Wang L, Xiu G, Li K. Trajectory reconstruction using radar measured data. J Ballistics (2011) 23:43–6.
4. Wu Z, Ma J, Zhang X, Ni J. Research on accurate calibration method of screen plane equation of sky screen vertical target. Optik (2018) 174:86–90. doi:10.1016/j.ijleo.2018.08.051
5. Zhang Y. Research on multi band photoelectric composite detection target fusion recognition. Master thesis. Xi’an: Xi’an Technological University (2022).
6. Yazdi M, Bouwmans T. New trends on moving object detection in video images captured by a moving camera: A survey. Comp Sci Rev (2018) 28:157–77. doi:10.1016/j.cosrev.2018.03.001
7. Dai Z. Research on testing technology of terminal ballistic parameters based on high-speed camera. Master thesis. Xi’an: Xi’an Technological University (2022).
8. Sueishi T, Oku H, Ishikawa M. Robust high-speed tracking against illumination changes for dynamic projection mapping. In: Proceedings of the 2015 IEEE Virtual Reality (VR); March 2015; Arles, France. IEEE (2015). p. 97–104.
9. Prades-Valls A, Corominas J, Lantada N, Matas G, Núñez-Andrés MA. Capturing rockfall kinematic and fragmentation parameters using high-speed camera system. Eng Geology (2022) 302:106629. doi:10.1016/j.enggeo.2022.106629
10. Lowe DG. Distinctive image features from scale-invariant keypoints. Int J Comp Vis (2004) 60:91–110. doi:10.1023/b:visi.0000029664.99615.94
11. Dalal N, Triggs B. Histograms of oriented gradients for human detection. In: Proceeding of the IEEE Conference on Computer Vision and Pattern Recognition (IEEE Computer Society); June 2005; San Diego, CA, USA. IEEE (2005). p. 886–93.
12. Bay H, Tuytelaars T. Surf: Speeded up robust features. In: European conference on computer vision. Springer (2006). p. 404–17.
13. Liu Z, Xu Y, Du B, Wang Y. Research on calibration method of high-speed camera based on airborne identified target. In: Progress in laser and optoelectronics (2023). p. 1–14. [2023-04-03].
14. Yan M, Zhao Y, Liu M, Kong L, Dong L. High-speed moving target tracking of multi-camera system with overlapped field of view. Signal Image Video Process. (2021) 15:1369–77. doi:10.1007/s11760-021-01867-9
15. Wang G, Zheng H, Zhang X. A robust checkerboard corner detection method for camera calibration based on improved yolox. Front Phys (2022) 10:828. doi:10.3389/fphy.2021.819019
16. Feng J, Wang D, Yang F, Huang J, Wang M, Tao M, et al. Podd: A dual-task detection for greenhouse extraction based on deep learning. Remote Sensing (2022) 14:5064. doi:10.3390/rs14195064
17. Srivastava S, Divekar AV, Anilkumar C, Naik I, Kulkarni V, Pattabiraman V. Comparative analysis of deep learning image detection algorithms. J Big Data (2021) 8:66–27. doi:10.1186/s40537-021-00434-w
18. Girshick R. Fast r-cnn. In: Proceedings of the IEEE international conference on computer vision; December 2015; Santiago, Chile. IEEE (2015). p. 1440–8.
19. Jiang P, Ergu D, Liu F, Cai Y, Ma B. A review of yolo algorithm developments. Proced Comp Sci (2022) 199:1066–73. doi:10.1016/j.procs.2022.01.135
20. Redmon J, Divvala S, Girshick R, Farhadi A. You only look once: Unified, real-time object detection. In: Proceedings of the IEEE conference on computer vision and pattern recognition. IEEE (2016). p. 779–88.
21. Liu W, Anguelov D, Erhan D, Szegedy C, Reed S, Fu C, et al. Ssd: Single shot multibox detector. In: Computer vision–ECCV 2016: 14th European conference. Springer International Publishing (2016). p. 21–37.
23. Yoo D, Park S, Lee J, Paek A, Kweon IS. Attentionnet: Aggregating weak directions for accurate object detection. In: Proceedings of the IEEE international conference on computer vision. IEEE (2015). p. 2659–67.
24. Ge Z, Liu S, Wang F, Li Z, Sun J. Yolox: Exceeding yolo series in 2021 (2021). arXiv preprint arXiv:2107.08430.
25. Dong S, Wang P, Abbas K. A survey on deep learning and its applications. Comp Sci Rev (2021) 40:100379. doi:10.1016/j.cosrev.2021.100379
26. Bochkovskiy A, Wang C-Y, Liao HYM. Yolov4: Optimal speed and accuracy of object detection (2020). arXiv preprint arXiv:2004.10934.
27. Zhang H, Cisse M, Dauphin YN, Lopez-Paz D. Mixup: Beyond empirical risk minimization (2017). arXiv preprint arXiv:1710.09412.
28. Lin T-Y, Dollár P, Girshick R, He K, Hariharan B, Belongie S. Feature pyramid networks for object detection. In: Proceedings of the IEEE conference on computer vision and pattern recognition; July 2017; Honolulu, HI, USA. IEEE (2017). p. 2117–25.
29. He K, Zhang X, Ren S, Sun J. Spatial pyramid pooling in deep convolutional networks for visual recognition. IEEE Trans Pattern Anal Machine Intelligence (2015) 37:1904–16. doi:10.1109/tpami.2015.2389824
30. Liu S, Qi L, Qin H, Shi J, Jia J. Path aggregation network for instance segmentation. In: Proceedings of the IEEE conference on computer vision and pattern recognition. IEEE (2018). p. 8759–68.
31. Zheng Z, Wang P, Liu W, Lu T, Ye R, Ren D. Distance-iou loss: Faster and better learning for bounding box regression. Proc AAAI Conf Artif intelligence (2020) 34:12993–3000. doi:10.1609/aaai.v34i07.6999
32. Woo S, Park J, Lee J-Y, Kweon IS. Cbam: Convolutional block attention module. In: Proceedings of the European conference on computer vision (ECCV). IEEE (2018). p. 3–19.
33. Canayaz M. C+ effxnet: A novel hybrid approach for Covid-19 diagnosis on ct images based on cbam and efficientnet. Chaos, Solitons & Fractals (2021) 151:111310. doi:10.1016/j.chaos.2021.111310
34. Zhao H, Gallo O, Frosio I, Kautz J. Loss functions for neural networks for image processing (2015). arXiv preprint arXiv:1511.08861.
35. Janocha K, Czarnecki WM. On loss functions for deep neural networks in classification (2017). arXiv preprint arXiv:1702.05659.
36. Zhou D, Fang J, Song X, Cheng Y, Liu J. Iou loss for 2d/3d object detection. In: Proceedings of the 2019 International Conference on 3D Vision (3DV); September 2019; Quebec City, QC, Canada. IEEE (2019). p. 85–94.
37. Rezatofighi H, Tsoi N, Gwak J, Sadeghian A, Reid I, Savarese S. Generalized intersection over union: A metric and a loss for bounding box regression. In: Proceedings of the IEEE/CVF conference on computer vision and pattern recognition; June 2019; Long Beach, CA, USA. IEEE (2019). p. 658–66.
38. Xu J, Ma Y, He S, Yang Q, Wang W. 3d-giou: 3d generalized intersection over union for object detection in point cloud. Sensors (2019) 19:4093. doi:10.3390/s19194093
39. Zheng Z, Wang P, Liu W, Ye R, Yang D, Huang TS. Distance-iou loss: Faster and better learning for bounding box regression. Proc AAAI Conf Artif Intelligence (2020) 34:12993–3000. doi:10.1609/aaai.v34i07.6999
40. Zheng Z, Ye R, Wang P, Liu W, Huang TS. Localization distillation for dense object detection. In: Proceedings of the IEEE/CVF Conference on Computer Vision and Pattern Recognition. IEEE (2022). p. 9407–16.
Keywords: target detection, deep learning, YOLOX, attention mechanism, loss function
Citation: Hu J, Chen H, Xu Y and Fu Y (2023) A bullet recognition algorithm based on improved YOLOX. Front. Phys. 11:1213489. doi: 10.3389/fphy.2023.1213489
Received: 28 April 2023; Accepted: 23 June 2023;
Published: 04 July 2023.
Edited by:
Wen Lei, University of Western Australia, AustraliaReviewed by:
Hao Zheng, Shandong University (Qingdao), ChinaBiao Wang, Hefei University of Technology, China
Copyright © 2023 Hu, Chen, Xu and Fu. This is an open-access article distributed under the terms of the Creative Commons Attribution License (CC BY). The use, distribution or reproduction in other forums is permitted, provided the original author(s) and the copyright owner(s) are credited and that the original publication in this journal is cited, in accordance with accepted academic practice. No use, distribution or reproduction is permitted which does not comply with these terms.
*Correspondence: Hua Chen, MTU5MjkyNzA5NTZAMTM5LmNvbQ==