 Chia Mohammadjani
 Ioannis Zisis
- Department of Civil and Environmental Engineering, Florida International University, Miami, FL, United States
The complex dynamics of vertically separated flows pose a significant challenge when it comes to assessing the wind loads on multi-level structures, demanding a nuanced understanding of the intricate interplay between atmospheric conditions and architectural designs. Previous studies and wind loading standards provide insufficient guidance for designing wind pressures on multi-level buildings. The behavior of wind around perpendicularly attached surfaces is not quite similar to that of individual flat roofs or walls. When a body is composed of several surfaces with right or oblique angles, the separated flow from surfaces and their interactions will cause complex flow patterns around each surface. A wind tunnel experimental study was carried out on bluff bodies with attached flat plates and other adjacent bluff bodies with different heights to examine the wind-induced pressures on such complex shapes. Mean and peak pressure coefficients were measured to determine the flow interaction patterns and location of localized peak pressures. The results were compared to the Tokyo Polytechnic University Aerodynamic Database of isolated low-rise buildings without eaves. The research findings indicated that there was a noteworthy disparity between the minimum and maximum values and locations of peak pressures on both the wall and roof surfaces of the models used in this study, as compared to the results obtained by the Tokyo Polytechnic University. Moreover, the study conceivably pointed to the difference between the peak negative and positive pressure coefficient locations with the ASCE 7-22 wind loading zones. The peak suction zones were affected by the combined flows at perpendicular faces, and as a result, different wind load zones were obtained dissimilar to those introduced by ASCE 7-22. Wind loading standards may need to be modified to account for the wind pressures on complex building structures with an emphasis on the location of the peak negative pressure zones.
1 Introduction and background
Several factors are associated with predicting wind loads on building structures. In addition to the stochastic pattern of the wind flow, building geometry [1], and surrounding buildings, structures will add to the complexity of calculating wind demands on all types of low-rise to high-rise buildings. If a building were compared to a bluff body, the aerodynamic loads on the bluff body surfaces will be affected by their geometry. The fundamental importance of the bluff body shape would be its influence on separating flows from sharp leading edges and reattaching flows on smooth and elongated surfaces. The geometry of most buildings is composed of several prisms and is not limited to a simple bluff body shape. Buildings with attached canopies and balconies, buildings with stepped roofs, and tall buildings with podium levels are a few examples of bluff bodies with variable shapes. Separation bubbles originated by different surfaces can interact with each other or downwind obstructions, causing potential flow instabilities, such as a vortex street in the wake [2]. The effects of the shape/geometry of leading edges on the turbulent flow behaviors have been proven [3] to be much more than the influence of the Reynolds number and the inflow profiles. The mixture of separated flows in all wind directions will trigger global flow mechanisms that could lead to the formation of unexpected peak zones and higher values on structural members. Another example at a larger scale is the Venturi effect, a phenomenon used to explain strong winds around buildings at densely populated areas of a city. The mixture of shear layers separated from the edges of buildings and their components is called the separated shear layer effect [4], which is a reason for strong pedestrian-level winds. The mean flow turbulence resulted from the mixture of flows tends to be unstable around a building array. Sharp transitions of the turbulent kinetic energy and magnitude of turbulent shear stress have been a specification of such unstable flows [5].
1.1 Bluff buildings with attached plates
Flat plates in buildings could appear as horizontal plates such as balconies, canopies, or vertical plates like partitioning walls in short buildings or lift shafts in mid- to high-rise buildings. Balconies are especially important in the aerodynamic performance of tall buildings [6]. The flow mechanism influencing peak pressure locations on the bluff body vertical surfaces and roof will be affected by parameters such as plate length, tilt, installation height, and location. Canopies attached to mid-rise buildings [7] had a significant impact on the building-generated turbulence and, consequently, the peak wind-induced loads. With the canopy’s presence at the leading edge of the building, the turbulence was mostly generated by the flow separation from the building edges; however, moving the canopies toward the building trailing edge resulted in loading that is dominated by flow separation from the canopy leading edge. Experimental studies on canopies attached to buildings [8] have indicated that when the canopy height-to-roof eave height ratio lies within the 0 ≤ hc/h ≤ 0.9 range, as the ratio goes higher, the peak local min Cp,net will increase significantly. Increasing the canopy location-to-canopy length ratio by contrast was seen to decrease the local min Cp,net magnitudes. In a similar manner, horizontal plates will affect the design of the façade structure as well by modifying the near-façade wind flow pattern and surface pressures. Computational fluid dynamics (CFD) analysis of multi-story buildings [9] shows that the horizontal balconies were capable of increasing wind loads both on windward and leeward sides of the façade surfaces. In [10], a new method for estimating wind loads on glass handrails of mid-rise buildings was developed investigating the effects of balconies and handrails on a 15-story building. The findings of the wind tunnel experiment, including the pressure coefficient measurements, were carried out on the glass handrails of various shapes. The authors also compared their results with existing standards. The presence of balconies led to a reduction in peak negative pressure coefficients, and therefore, it was suggested that balconies act as a shield against wind. Other studies [11,12] also concluded that the aerodynamic response of buildings, the façade system, and joint design processes depends on the presence of the plates.
1.2 Bluff buildings with multi-level setbacks and podiums
It is common practice in the construction industry to utilize multi-level flat roofs in building structures such as public storage structures, large-scale residential complexes, and industrial warehouses. Most studies conducted on multi-level roofs [13–15] focused on the snow drift and loads and their impact on the flat roof performance. There have been limited studies conducted to evaluate the wind pressures on such stepped-roof configurations. Stathopoulos [16] carried out an experimental study on wind pressures on the roof and wall of buildings with step-shaped roofs. The study provided important knowledge that improved the wind standards and wind load provisions for stepped-roof buildings. A comparison between the experimental data and the standards showed that peak positive pressure coefficients could not be accurately calculated using standard provisions back then. In another study, significant differences in peak minimum pressure coefficients were observed between a multi-level flat roof and a simple flat roof [17]. The minimum and maximum Cp values were predominantly dependent on the step parameters. The locations of local peak pressure coefficients were at the higher building wall–lower building roof interaction zone for the 0° wind direction. One of the main sources of turbulence in tall buildings is the setbacks in tall building cross section, which produces stepped roofs. In a CFD simulation of different multi-story buildings with setbacks [18], it was found that maximum positive pressure coefficient values for the 0° wind direction happens at the top levels of the building away from the setback. The peak negative pressure coefficient values for the 90° wind direction were on the stepped flat roof which was in compliance with an earlier study [19] carried out by the same researchers. The podium is the extended section of a high-rise building at a lower level. High torsional moments and shear forces at the podium level will be expected under the lateral loads [20] due to the cross-sectional offset that, most of the time, pushes design engineers in the application of viscous dampers to reduce torsional response [21]. According to [22], setbacks in tall buildings will affect the vortex shedding frequencies and, consequently, can lead to reduction in strong vortex shedding forces. Adding setbacks at different heights will push the vortices to try to shed at different frequencies which will help in “confusing” the vortex shedding [23]. The non-linear dynamic response of tall buildings has been investigated [24] by modeling a scaled 1:400 model of an existing 47-story building with a podium structure at the base. It was found that the gravity supporting structure and structure at the podium will improve the wind performance of the tall building.
1.3 Interaction of vertically separated flows
Flow separation is a well-understood area of fluid mechanics, and it is considered when designing all modern buildings; however, there is no research conducted on the interaction between separated bubbles with vertically oriented planes of development. Existing research on the aerodynamic performance of buildings is aimed at identifying the location and values of local peak pressure coefficients. It is also well understood that when flow separation occurs in an ABL environment, the strongest suction occurs on the leading edges of the bluff bodies [25]. However, there is no previous research that considers flow separation that occurs simultaneously at two perpendicularly attached bluff bodies and looking into the loading scheme due to the complex flow interactions. Although absolute peak pressures might not be affected significantly due to this interaction, the location at which these peak pressures occur might be very different compared to more conventional cases (e.g., roof or wall surface). This effect might have a direct implication on how we design more complex structures mostly due to the existing zoning convention that is adopted in building codes and wind standards [26]. The concept of synchronous flow separation from bluff bodies with attached plates (e.g., canopy or balcony) or bluff bodies with setbacks (e.g., stepped flat roof buildings or tall buildings with podium) is the focus of the current study. This very specific flow phenomenon occurs when wind separates simultaneously due to the interaction with both the main bluff body and the attached plate or a secondary bluff body. Right after the flows are separated, a complex interaction is initiated that results in non-conventional wind-induced loading patterns on the surfaces of both the bluff body and the plate. A preliminary experimental campaign is carried out to look into this unconventional loading scenario that might have a great influence on the aerodynamic performance of the building itself and the building components that are attached to it.
2 Methodology
2.1 Test specimens and instrumentation
In this study, the test models were constructed as single-cubic bluff bodies with a plate extension or combined bluff bodies with variable dimensions (Figure 1). In models 1 and 2, the vertical and horizontal plate thickness is 30 mm and bluff bodies’ dimensions are 240 mm × 240 mm × 240 mm. Models 1 and 2 represent a building with a vertical and horizontal flat plate attachment (e.g., partition, balcony, and canopy). Model 3 is made of two bluff bodies with dimensions of 240 mm × 240 mm × 240 mm and 240 mm × 120 mm × 120 mm representing buildings with multi-level setbacks or stepped flat roof buildings, respectively. Models 1, 2, and 3 share the same main bluff body with the difference in the attached second body. The purpose of adding a plate to the body is to evaluate the flow mechanism at the plate–body interaction zone while allowing the oncoming flow to separate on the other side of the bluff body or underneath the plate for models 1 and 2, respectively. Flat plates are continuous along the bluff bodies to provide enough length for the flow to separate from the plate edge, mix with the flow separated from the bluff body leading edge, and provide room for a probable reattachment of mixed vortices at the downstream of the models in a 90° wind direction, which is the dominant direction for the scope of this study. The plate in model 3, on the other hand, has been replaced with a second bluff body to create a stronger separated flow due to the smaller bluff body (i.e., the flow can no longer escape from the bottom/side of the plate). Model 4 is an extension of model 3, for which the shorter bluff body has increased dimensions to resemble a podium-like structure. Flow will first separate from the podium edge and later will experience the second separation from the wall of the taller body. The extended width of the podium beyond the building will allow for any probable reattachment of the separated flows. Pressure taps were fitted on one side of the bluff body and the flat plate for models with a vertical or horizontal plate. In total, 144 pressure taps were fitted in models 1, 2, and 3 and 210 pressure taps in model 4 (Figure 1). The sides of the models that did not contain any pressure taps were made out of wood, while those that had pressure taps were made out of plexiglass. A sensitive pressure scanner system was used to obtain the pressure time histories at each pressure tap using a sampling frequency of 530 Hz and sampling time of 60 s for all wind directions.
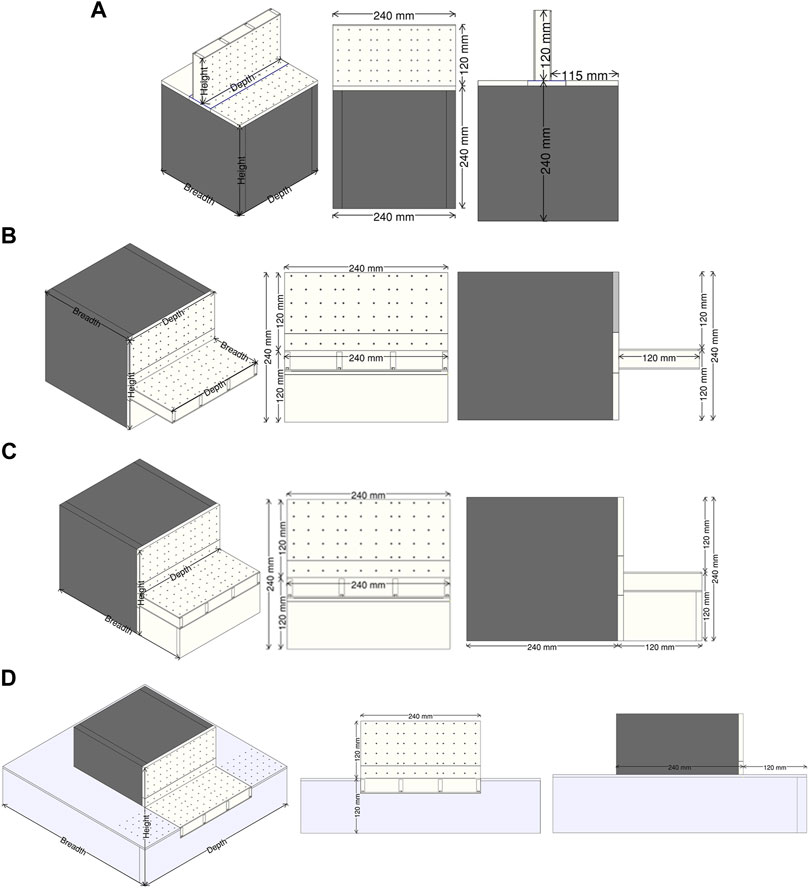
FIGURE 1. 3D view, front view, and side view of all 1:100 scaled models used in experimental wind tunnel tests. (A) Model 1. (B) Model 2. (C) Model 3. (D) Model 4.
2.2 Testing facility and ABL simulation
The experimental tests were carried out in the Atmospheric Boundary Layer Wind Tunnel (ABLWT) in the Laboratory for Wind Engineering Research (LWER), located at Florida International University (FIU). The wind tunnel has a test section which is 2.5 m wide and 1.85 m high with 18 m overall length. The turntable, placed downwind of the wind tunnel, allows for housing the models and testing them in different wind directions. The spires and roughness elements can be manually adjusted to achieve the desired exposure (open, suburban, or urban). The configuration chosen for the spires and roughness elements was adjusted to reproduce an open terrain profile, and a geometric scale of 1:100 was selected for this study. The two principal angles of attacks for this study were 0° and 90°. The selection was based on the fact that the 90° wind direction will generate the desired structure for the separated flows, while the 0° wind direction will serve as a reference case where a more traditional (i.e., single) separated flow occurs. Figure 2A shows a schematic illustration of the model 3 orientation on the turntable for both directions, while Figure 2B shows the physical model in the 90° wind direction.
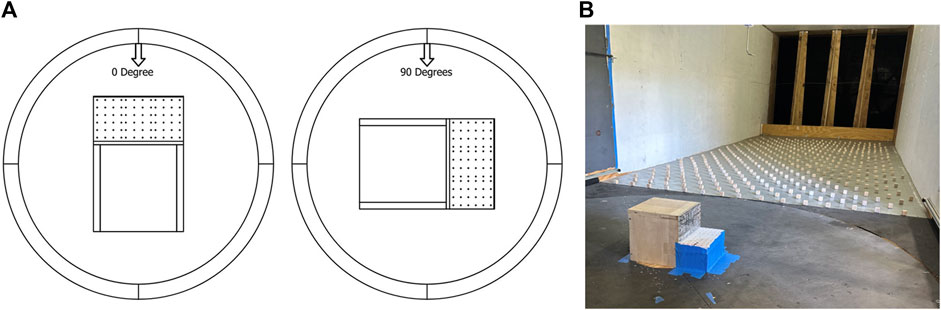
FIGURE 2. (A) Schematic view of Model 3 in 0-degree and 90-degrees orientations. (B) the physical model in 90-degree orientation on the wind tunnel’s turntable.
To calculate the wind speed, turbulence intensity profiles, and the power spectra, multi-hole (cobra) probes were installed at different heights. The sampling frequency was 2,500 Hz, and wind velocities were measured for a 60 s time duration. Figure 3A shows a sample time history of the wind speed at the model mean roof height. The mean wind speed at the mean roof height of all models (h = 240 mm) was 8.95 m/s. The mean wind speed and turbulence intensity profiles are shown in Figure 3B. The wind speeds were normalized against the wind speed at the reference height Zg and compared with the power law equation (α = 1/9.8) and the ESDU (category C open terrain and a surface roughness length of z0 = 0.02 m) profiles showing good agreement. The turbulence intensity was estimated to be equal to Iu = 16% at the mean roof height, and the turbulence intensity profile at the wind tunnel had good agreement with the ESDU turbulence.
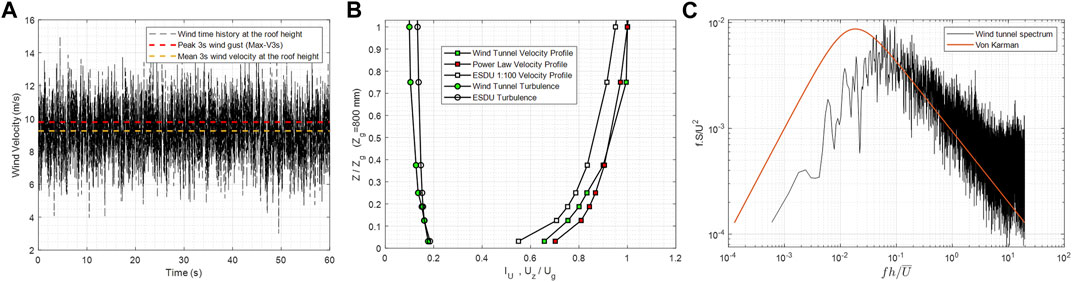
FIGURE 3. (A) Wind speed time history at the model mean roof height; (B) mean wind speed and turbulence intensity profiles compared to the power law and ESDU (open terrain); and (C) von Karman and wind tunnel spectra at mean roof height.
The power spectral density (PSD) of the wind tunnel is shown in Figure 3C. The spectral density achieved in the wind tunnel was compared to the von Karman spectrum in the atmospheric boundary layer (ABL) that was derived using [27], the wind tunnel PSD demonstrates a strong agreement at the high-frequency section of the oscillations (fh/U > 0.1), and the low-frequency cut-off signifies that the modeled turbulence is adequate for disturbances up to 5–10 times the building size. It should be noted that the increased height of the model is the reason for the discrepancy observed in the low-frequency range and that the spectrum match is even more improved at the height of the canopy in models 2, 3, and 4 (fh/U > 0.01).
2.3 Wind pressure coefficient estimation
Wind pressures are often expressed using dimensionless pressure coefficients (Cps), as in Eq. 1, where Δp is the pressure difference at the pressure tap location, ρ is the air density, and
3 Wind pressure analysis
In this section, the results of mean pressure coefficients
3.1 Building with the vertical flat plate
In the 0° wind, both the vertical plate and the roof of bluff body will experience predominately positive pressure. The roof leading edge will lead to a separated flow and negative pressure areas; however, the vertical plate will stagnate the flow, resulting in a returned flow to the roof of the model which will increase the roof area that experiences positive pressures. Mean pressure coefficient contour plots for the 0° wind (Figure 4A) show higher positive mean pressure coefficient (
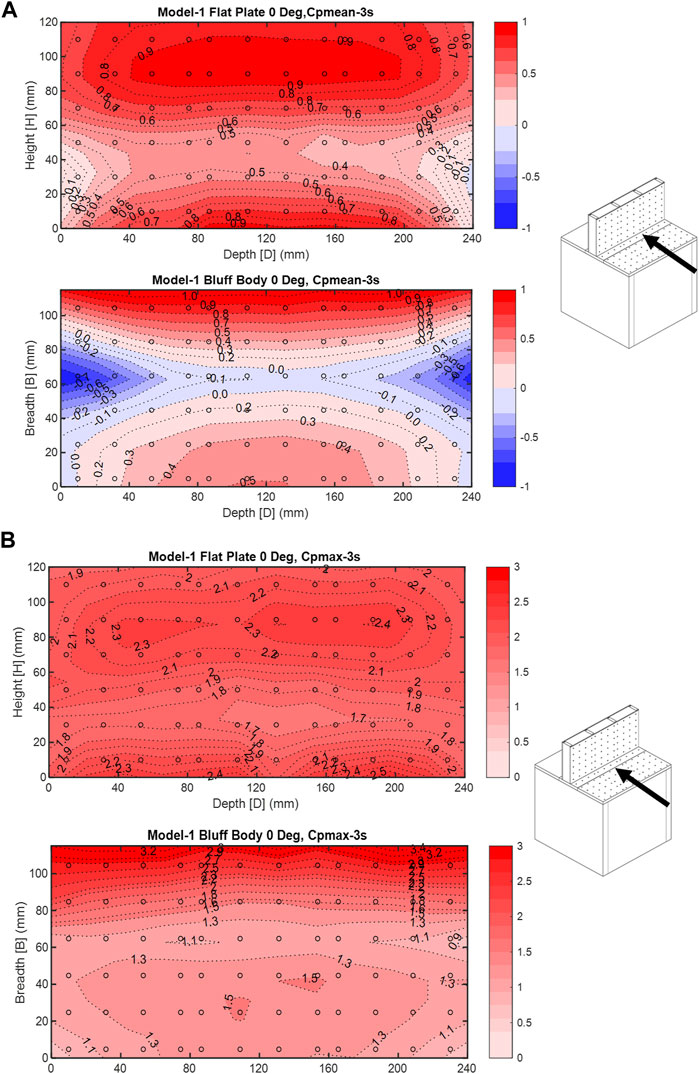
FIGURE 4. (A) Model 1—0° wind direction, mean
Mean pressure coefficient results for the 90° wind direction are shown in Figure 5A. As expected, the separated flows at both the roof and plate leading edges result in higher negative pressure coefficients on the left half of the surfaces. The gradient on the roof is more uniform as it moves downwind, starting from −0.6 and ending at almost 0 on the leeward end. However, the plate pressure gradient clearly shows the more complex wind–structure interaction with higher pressure values moving at a diagonal direction from the bottom windward to the top leeward corner of the plate. The leading-edge mean pressure coefficient is also slightly increased, taking a value of −0.9. A similar distribution is shown in Figure 5B for the negative peak pressure coefficients
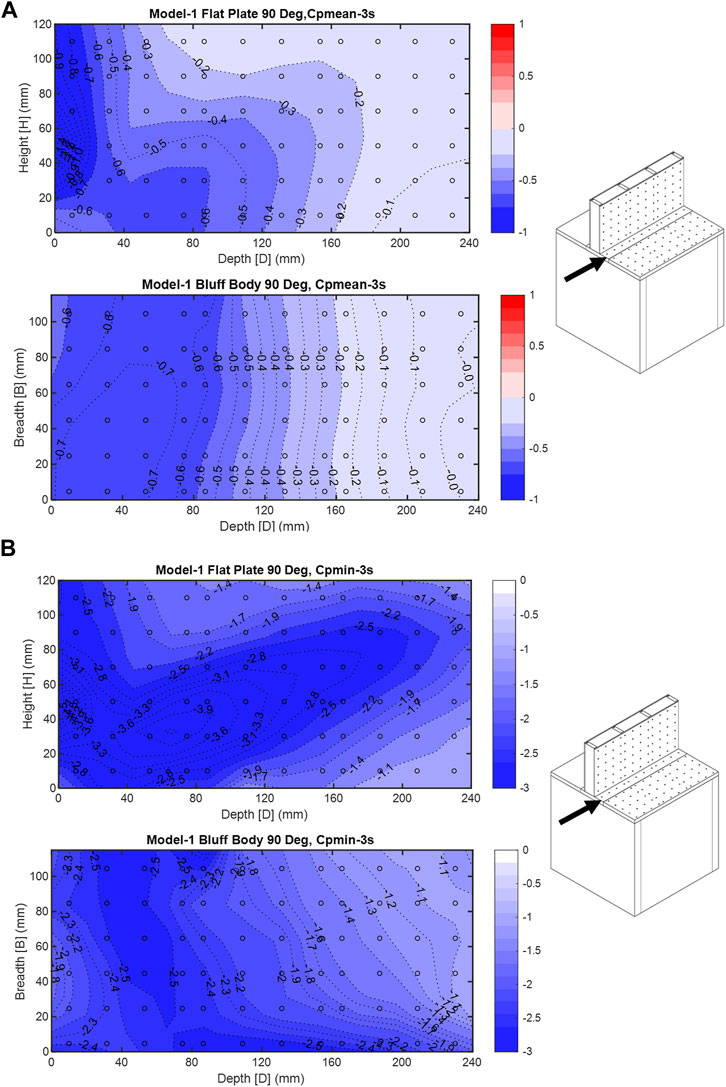
FIGURE 5. (A) Model 1—90° wind direction, mean
3.2 Buildings with a horizontal flat plate and multi-level setbacks
This section summarizes the findings from model 2 and 3 testing. Although each model refers to a different building structure application, because of the same dimensions for the bigger bluff body and the same cross-sectional area for the smaller bluff body, the pressure coefficient results had similarities. It was expected that the enclosed space under the plate in model 3, which practically turns its geometry into a bluff body, will drastically affect the flow in comparison to the flat plate in model 2. In terms of the central research hypothesis, model 3 was anticipated to result in a stronger separated flow on the top of the plate, therefore interacting in a different manner with the separated flow from the main bluff body.
Similar to model 1 in the 0° wind direction, both the horizontal plate and the roof of bluff bodies experience predominantly positive pressure. Mean pressure coefficient contour plots for the 0° wind in models 2 and 3 (Figures 6A, 7A) show strong positive mean
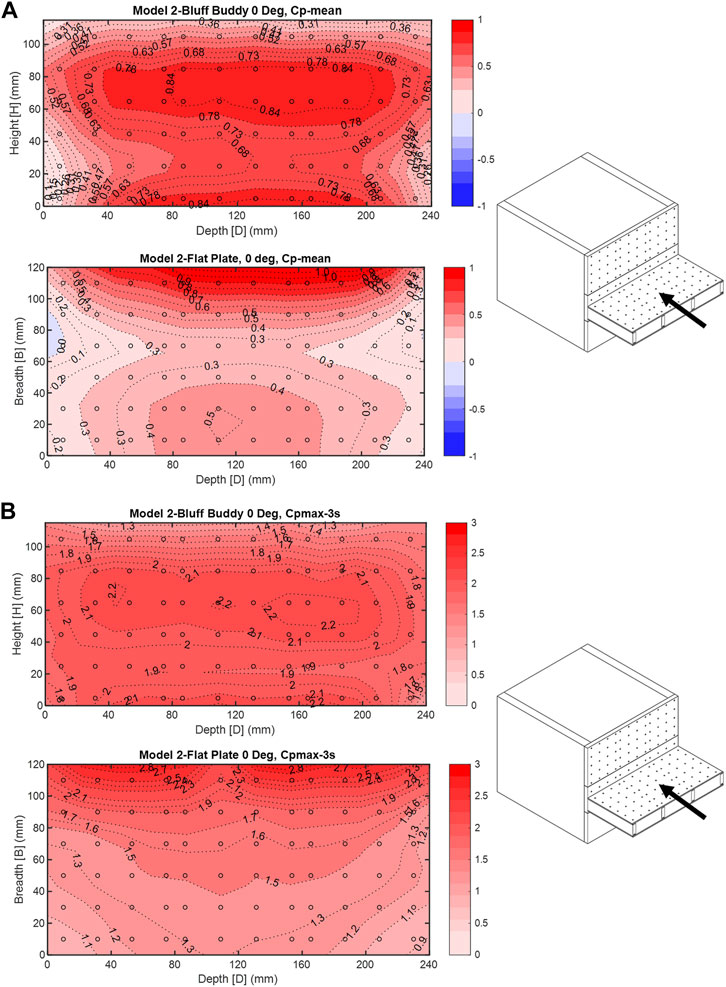
FIGURE 6. (A) Model 2—0° wind direction, mean
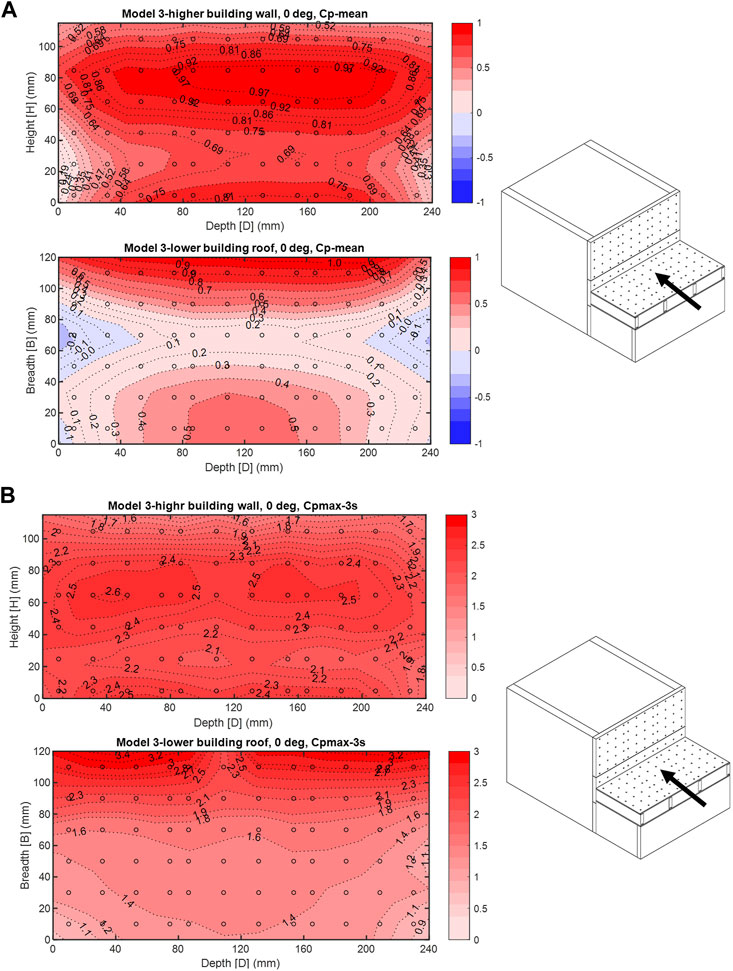
FIGURE 7. (A) Model 3—0° wind direction, mean
In the 90° wind, mean pressure coefficients shown in Figures 8A, 9A indicate that both models are experiencing suction at the windward zones where flow separates. Clearly, the
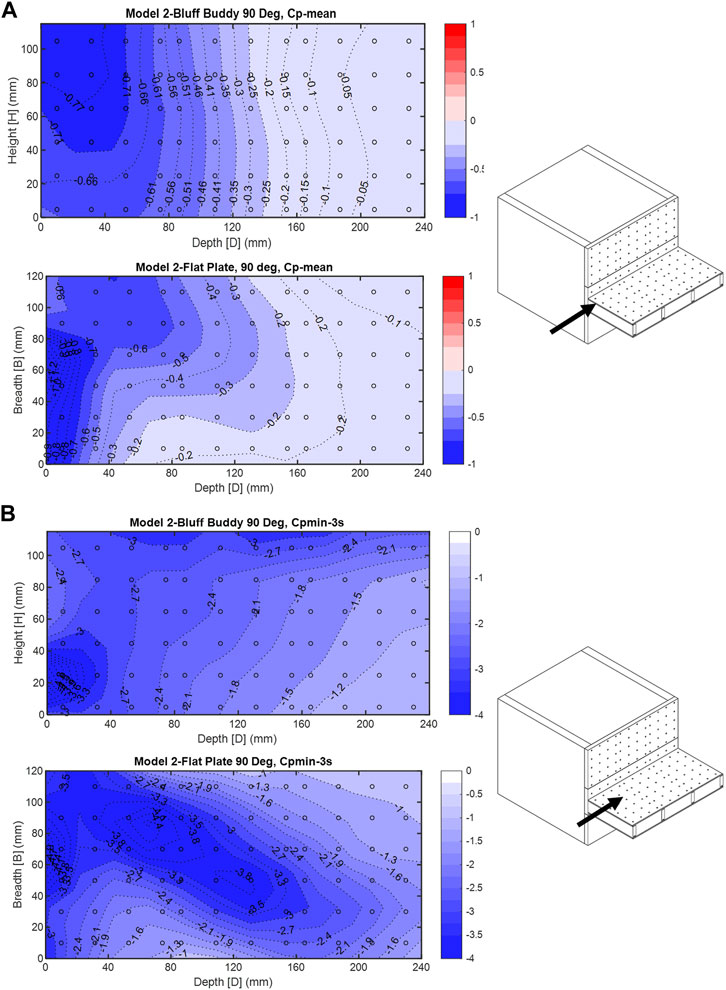
FIGURE 8. (A) Model 2—90° wind direction, mean
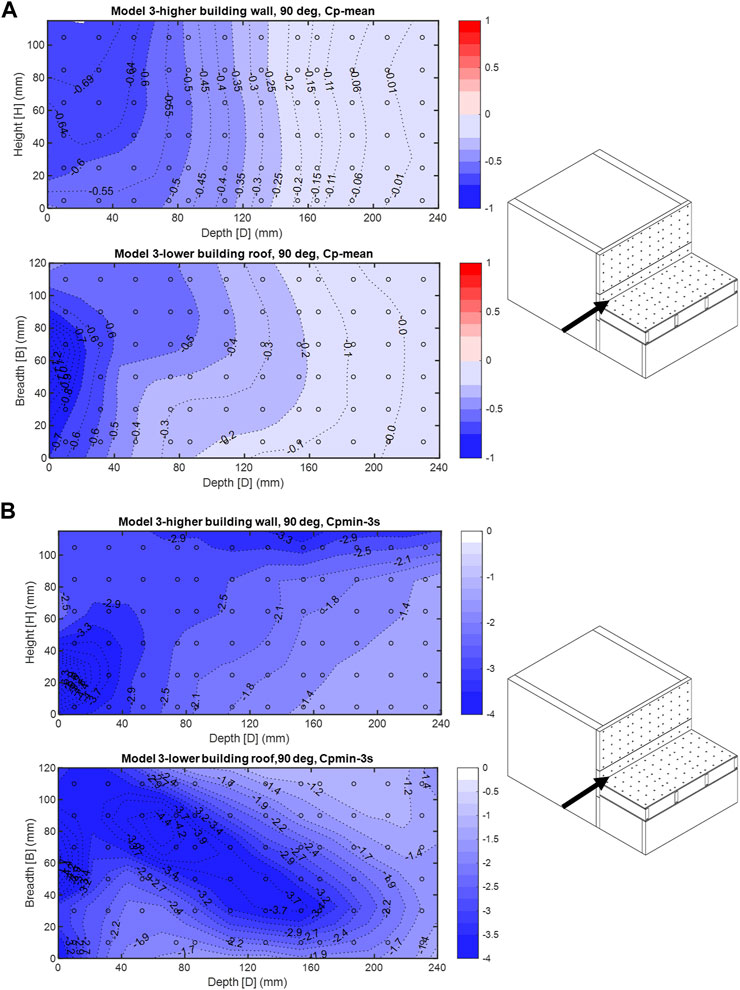
FIGURE 9. (A) Model 3—90° wind direction, mean
3.3 Building with podium extension at the base
Model 4, which is a building with a podium extension, was built based on model 3 in an effort to resemble a lower building surrounding a taller structure. In this case, both mean and peak pressure coefficient contour plots showed different flow–structure interaction patterns and local peak pressure zones when compared to model 3. In the 0° wind, mean pressure coefficient contour plots (Figure 10A) point to a large high-pressure zone at around the middle of the main building wall surface. The peak pressure zone dominates rows 2 and 3 of pressure taps from the top of the main building where the positive peaks
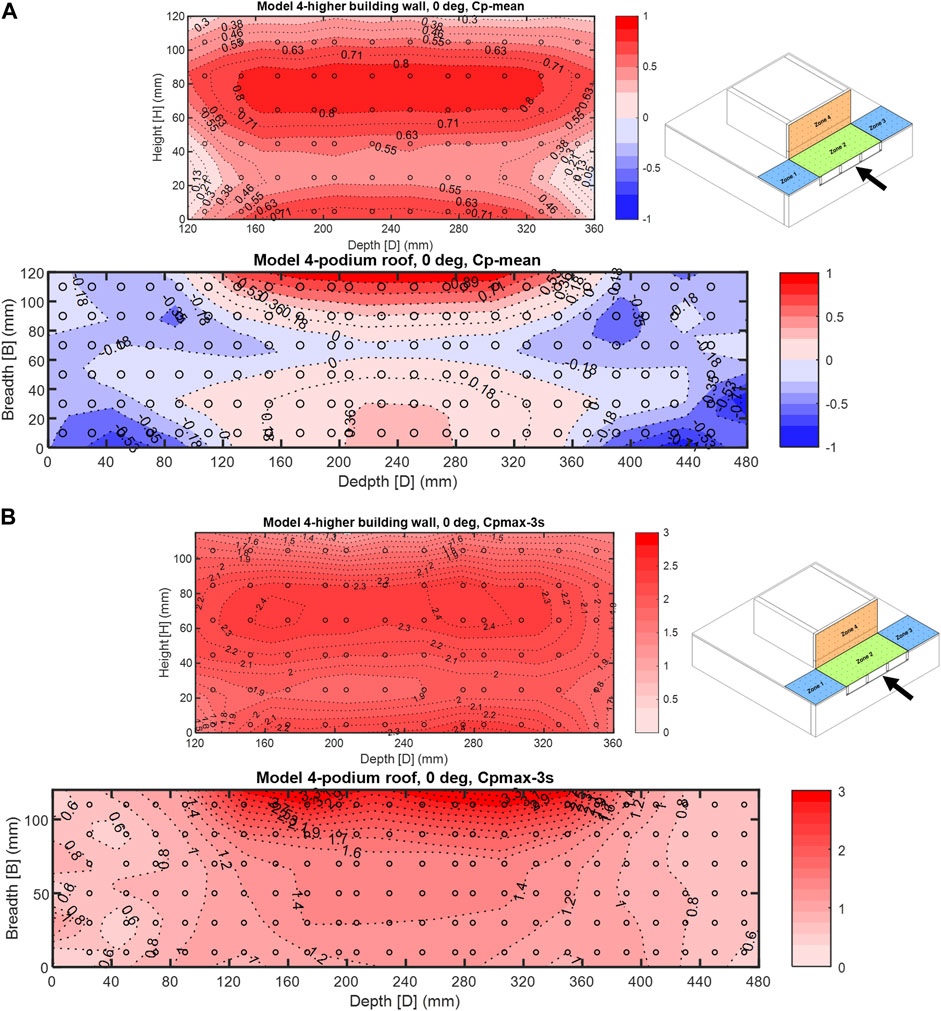
FIGURE 10. (A) Model 4—0° wind direction, mean
In the 90° wind direction, mean pressure coefficients were negative at the leading edges of both surfaces (Figure 11A), but the locations of the peak negatives were varying depending on how far the region is from the wall–roof interaction zone. A localized negative pressure zone was formed on the left corner of the wall compatible with the wind loading zones in chapter 30 of [26](Figure 11B). However, the suction zone on the wall surface has extended toward the middle and top of the wall to the extent that some parts of the wall close to the top edge, where the last pressure tap row extends, had very high
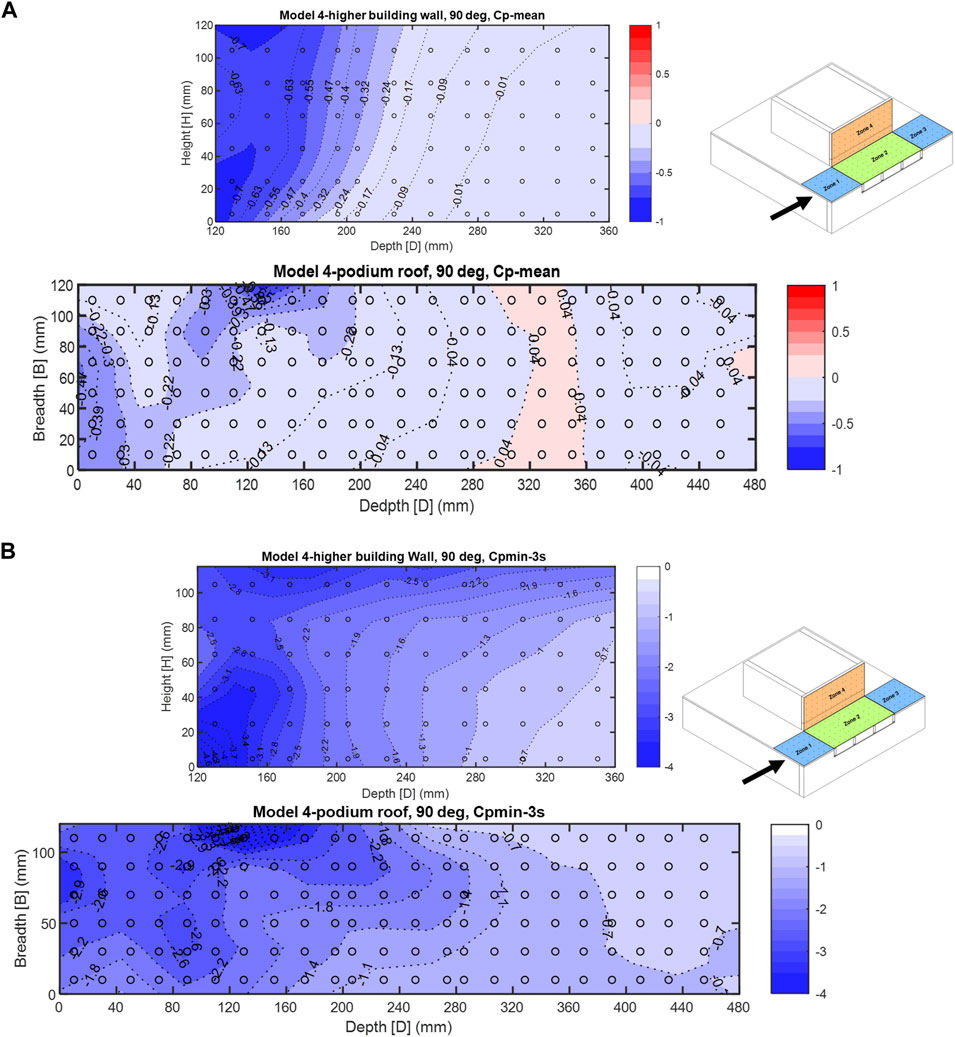
FIGURE 11. (A): Model 4—90° wind direction, mean
4 Discussion and code implications
While analyzing wind load on structures, the interaction of the bluff body with the oncoming flow is essential to determine the peak zones on the external surfaces. First, the overall distribution of peak pressure coefficients in models 3 and 4 of this research will be compared to an isolated flat roof model from the Tokyo Polytechnic University (TPU) [30] database. To the extent possible, building geometric similarities were taken into consideration in order to be able to compare the peak pressure zones on the roof and wall surface of a single bluff body and bluff bodies with attached plates or two adjacent bluff bodies. These similarities included the building’s depth D, breadth B, and eave height H (Table 1). The comparisons were carried out for the pressure coefficient results of the pressure taps on the models in this research study in Figures 4–11 with the pressure coefficient results of the pressure taps on an equivalent single bluff body in the TPU wind tunnel database in terms of peak pressure coefficients in Figures 12–14. For the wall and roof of higher buildings (a bigger bluff body) in all models with dimensions of 240 mm × 240 mm × 240 mm, a single bluff body which has the best matching dimensions of 160 mm × 160 mm × 160 mm in the TPU research was selected (Figure 12). To compare the smaller bluff body results in model 3, a case in the TPU study with dimensions of B = 160 mm, D = 400 mm, and H = 160 mm (Figure 13) was selected. Finally, a bluff body with dimensions of B = 160 mm, D = 160 mm, and H = 40 mm (Figure 14) in the TPU database was selected to compare with the results of the podium of model 4 of this research study. A comparison of these research models’ dimensions with the corresponding models in the TPU aerodynamic database is presented in Table 1. In the second part of this section, Cp coefficient results and the corresponding peak wind load zones from the current research study are compared to the proposed component and cladding (C&C) zones included in Chapter 30 of [26].
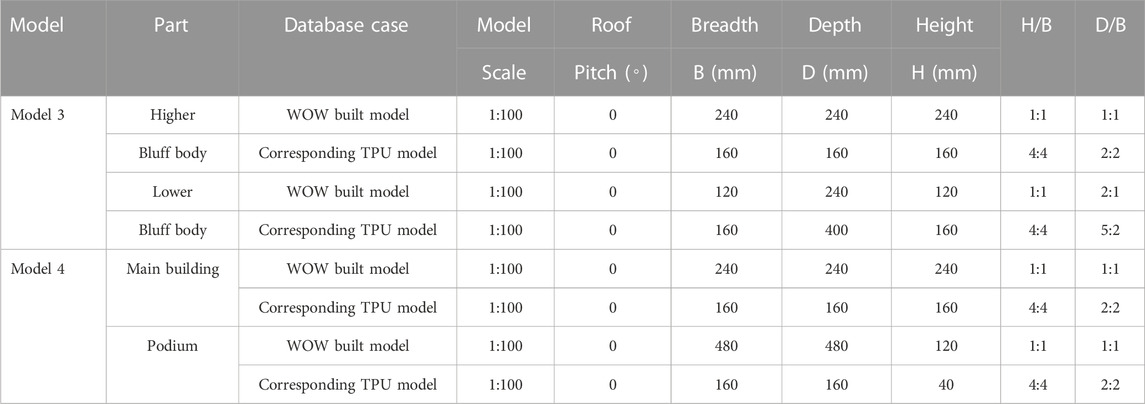
TABLE 1. Dimensions and geometric ratios of models 3 and 4 from the current study compared to corresponding models in TPU wind tunnel tests.
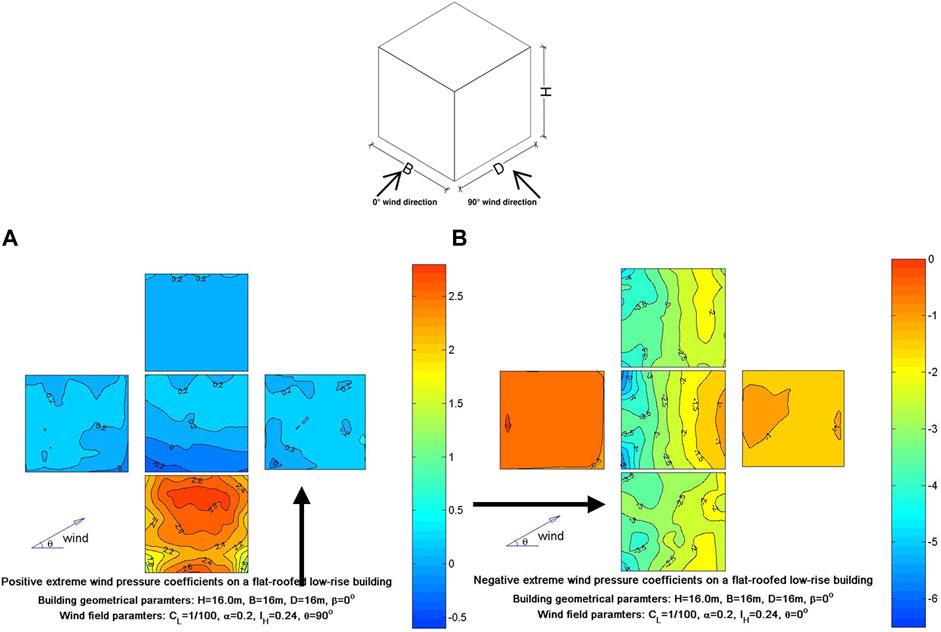
FIGURE 12. [30] Pressure coefficient contour plots for a low-rise flat roof building with equal cross section and height dimensions B = D = H = 16 m. (A) Contour plot of peak positive
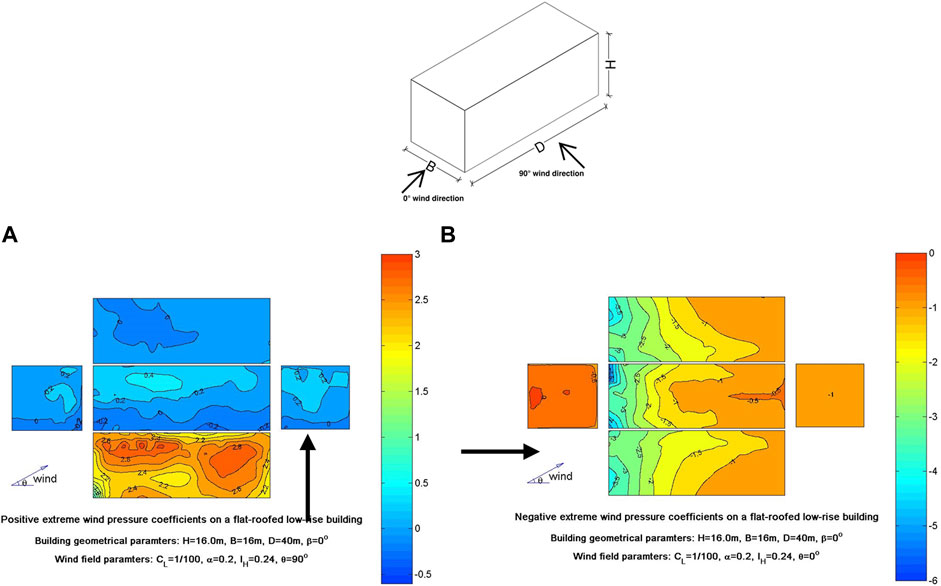
FIGURE 13. [30] Pressure coefficient contour plots for a low-rise flat roof building with extended cross section B = 16 m, D = 40 m, and H = 16 m. (A) Contour plot of peak positive
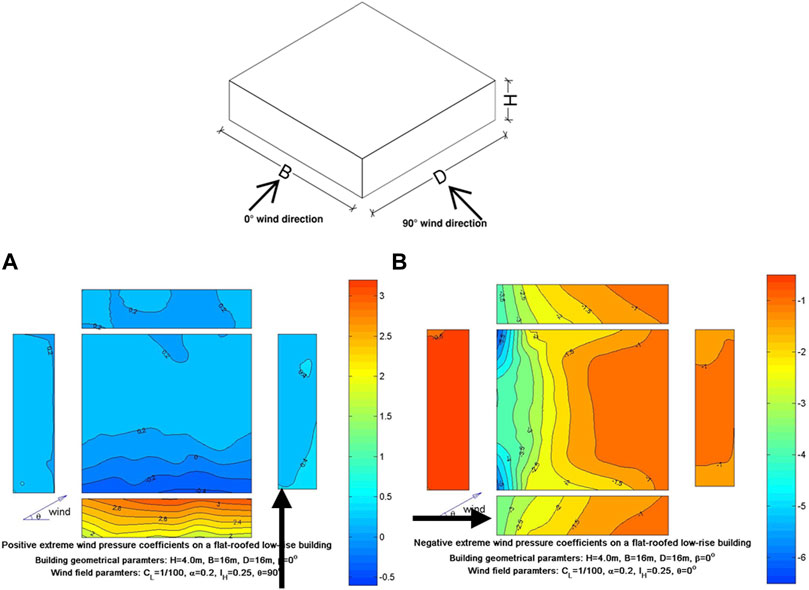
FIGURE 14. [30] Pressure coefficient contour plots for a low-rise flat roof building with square cross section and height equal to a quarter of its width B = 16 m, D = 16 m, and H = 4 m. (A) Contour plot of peak positive
4.1 Comparison of
The TPU aerodynamic database includes wind pressure coefficients that were experimentally derived for high-rise and low-rise buildings with and without eaves, which could be an isolated building or a non-isolated building [30]. The selected cases had similar dimensions to models 3 and 4 in this research study and were selected from the database of isolated low-rise buildings without eaves. The wind tunnel and TPU models have evenly distributed pressure taps at 20 mm. The TPU database procedure to calculate the Cp coefficients is described in detail in [31]. The current study’s and TPU’s reference wind directions differ 90°; therefore, the 0° wind direction cases in the current study correspond to the 90° wind direction in the TPU experiments, and the 90° wind direction in the current study should be compared to 0° in the TPU database results.
4.1.1 Model 3 in the 0° wind direction
In model 3, the wall of the higher bluff body has experienced peak positive pressures at the top and lower part of the wall (Figure 7B), which is in good agreement with the similar TPU case for wind perpendicular to the wall in Figure 12A both for the peak positive zones and their
4.1.2 Model 3 in the 90° wind direction
In the 90° wind direction, the peak negative pressure coefficient contour plots of the higher bluff body wall in model 3 (Figure 9B) were compared to the isolated building with close dimensions in the TPU aerodynamic database (Table 1) in the 0° wind direction (Figure 12B), and the roof of the lower bluff body in model 3 was compared to the rectangular prism test results in the TPU database for the 0° wind direction (Figure 13B). The wind orientation in these cases will mainly cause high peak suction zones on the roof and sidewall surfaces of both the current study and TPU models. The high peak negative
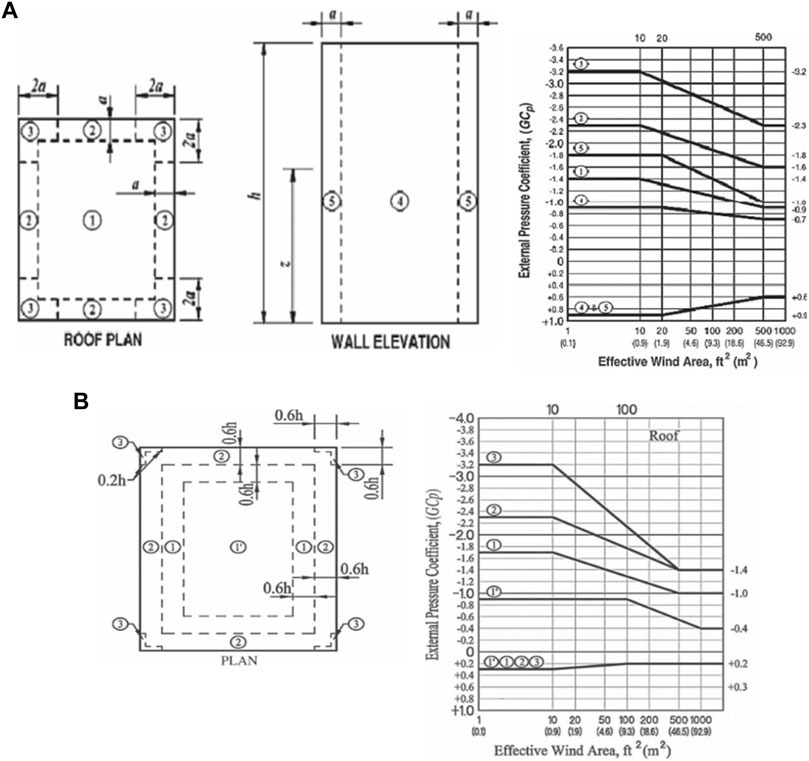
FIGURE 15. (A) GCp zones and values for roof and wall faces of buildings with mean roof height h ≥ 18.3 m taken from Figure 30.4-1 of [26] and (B) GCp zones and values for building roofs with mean roof height h ≤ 18.3 m taken from Figures 30.3-2A of [26].
4.1.3 Model 4 in the 0° wind direction
Model 4 is made of two parts, the higher building and the podium. The higher building which is a cubic prism with 240 mm dimensions will be compared to a prism with equal dimensions of 160 mm as shown inTable 1. The podium building’s cross-sectional dimensions in model 4 are twice the dimensions of the higher building, but its height is half. To be able to compare Cp contour plots of the podium to similar cases in the TPU database, a model was selected that had the same geometric parameters H/B and D/B (Table 1). Pressure taps on the roof surface of the podium in model 4 were distributed equally at every 20 mm which was the same in the TPU corresponding model at its roof. In the 0° wind direction, the wall of the higher building of model 4 has experienced the same peak positive pressure coefficient values that model 3 had developed on its wall surface with the same peak zones. The
4.1.4 Model 4 in the 90° wind direction
The walls of the higher buildings in models 3 and 4 had similar peak negative pressure zones for the 90° wind direction; however, the top peak zone in model 3 has shifted toward the leading edge of the wall in model 4. Flow interaction patterns in model 4 will be different from those in model 3 due to the extended dimensions of the shorter building (the podium).
The present research study demonstrates notable distinctions in pressure distribution patterns between single surfaces and surfaces composed of perpendicular faces, as evidenced by a thorough comparison with the TPU database. Nevertheless, the geometric characteristics of the models employed in this investigation bear a closer resemblance to a prior study that focused on the codification of canopies attached to mid-rise buildings [7]. In this study, the models consisted of a bluff body representing a mid-rise building, complemented by flat plates positioned at various locations to simulate building canopies. Figure 14C of the research [7] showcases a contour plot illustrating the distribution of wind pressure coefficients at a 90° angle over the horizontal surface of the canopy plate, specifically in the case where the canopy is attached to the building’s edge. This specific scenario can be compared to model 2 within the context of the current research study. Notably, in both instances, when the wind flowed parallel to the flat plate (at a 90° angle), the minimum peak negative pressure coefficients were observed at regions distanced from the leading edges and predominantly concentrated toward the center of the horizontal flat plate.
4.2 Comparisons to the design guidelines for components and cladding, ASCE 7-2022
Chapter 30 of [26] provides pressure coefficient zones and their values applicable to the design of components and cladding based on the envelope and directional procedures. For pressure coefficients on the roof and wall of buildings with mean roof height ≥18.3 m (Figure 15A), the envelope procedure has been based on the [35] method of not enveloping the influence of exposure, so exposure categories B, C, or D may be used with the values of (GCp) in Figure 30.4-1 of ASCE7-22. For buildings with a mean roof height of h ≤ 18.3 m, a number of figures are introduced, among which Figures 30.3-2A introduce GCp coefficients for pitched roofs with
The main bluff body in models 1–4 of this research study could be compared to a full-scale building with a mean roof height of 24 m, and therefore, Figure 30.4-1 of ASCE 7-22 (Figure 15A) could be used to determine wind loads on the wall surface of the full-scale building. In this figure, the wall elevation has been divided into three zones at both edges and at the center of the wall. The full-scale effective area of the higher buildings in models 1–4 will be 12×
ASCE 7-2022 provides a figure for the peak pressure coefficient of the roof of stepped-roof buildings (Figures 30.3-3); however, the mean roof height of the top roof is limited to 18.3 m. Because, in this research, the mean roof height of top roofs of all models exceeds the ASCE 7 defined height limitation, for the peak coefficients on the surface of the lower roof in models 3 and 4 with a mean roof height of 12 m, Figures 30.3-2A of ASCE7-22 were selected, and the peak zones are shown in Figure 15B. The highest localized peak negative zones on the roof based on this figure will be formed at the four corners of the roof (zone 3) followed by zone 2, a narrow area extended along the edges of the roof. In Figures 8B, 9B, the separation bubble has shifted away from the leading edge of the plate and the lower roof, causing peak negative pressure coefficient zones to happen on an extended diagonal form at the center of the roof. The highest peak negative pressure coefficients, unlike the ASCE 7-22 defined zones, were not at the corners but away from the leading edge toward the center of the roof. In model 4, the peak negative pressure coefficients similarly were not limited to the leading edge as it is in ASCE7-22 (Figure 15B). Both the peak negative and positive zones on the roof of the podium building were formed at the roof–wall interaction zone where the main shear stress will be resulted from vortex interactions. In ASCE 7-22, for a building of roof height less than 18.3 m (Figure 15B), all four zones on a roof surface will receive the same peak positive pressure coefficient which did not happen in this research study on the roof of all four models. The contour plots of positive pressure coefficients show a sudden spike for the positive pressures at the location of two perpendicular surfaces.
The results of experiments on combined bluff bodies in this research show that wind loading on buildings will not always comply with the provisions defined by ASCE 7 which are generally for isolated buildings with simpler geometries. The envelope procedure in ASCE 7-2022 that have been used to determine wind loads on the main wind force resisting systems and, on the components, and cladding is by involving an effective area of a particular surface without considering the pressure fluctuations resulted from more complex geometries such as two perpendicular surfaces. Based on the present research study, the localized peak pressure coefficients in buildings with attached plates and buildings with variable roofs could have different zones and values than what has been defined in ASCE 7-2022. The implication of designing external elements such as roof tile connections and main force resisting systems such as roof beams and shear walls for wrong wind forces could be detrimental and costly, especially in extreme wind events.
5 Conclusion
Experimental research and analysis were carried out on the wind load on structures with a focus on bluff body–oncoming flow interactions. The pressure coefficients and peak pressure zones on the roof and wall surfaces of buildings with attached plates and buildings with multi-level setbacks were compared. The comparisons were carried out for pressure coefficient results from this research study and an equivalent single bluff body in the TPU wind tunnel database. Finally, the
For multi-level buildings with setbacks and multi-level buildings with a podium at lower levels, the wall of a higher building experienced peak positive pressures at the top and lower part of the wall, similar to a single building case in the TPU database. However, the roof of the lower building had different peak positive zones and values compared to the TPU case and the roof surface of the podium where the lower roof acts as a podium in a multi-leveled structure. The results of building with multi-level setbacks indicate that wind orientation parallel to the perpendicular surfaces will cause suction zones on roof and sidewall surfaces of the models away from the leading edges. The building showed a higher suction zone only on the bottom corner of the higher building wall. The results for buildings with multi-level roofs showed a big peak pressure zone diagonally extending from the roof’s leading edge, indicating that for elevated roofs, flat roof peak pressures may not apply, and higher peaks should be expected at central locations. The podium roof in the multi-level building with a podium for a wind direction parallel to the perpendicular surfaces did not experience a diagonal separation bubble which happened on the roof of shorter building in a multi-level building without a podium, but there were several localized peak suction zones.
The bluff bodies in all models represented a mid-rise building or a section of a taller structure geometry. The peak negative and positive coefficient locations of this research differed from the introduced ASCE 7-22 wind loading zones. Peak negative pressure coefficient zones occur at the wall–roof interaction zones in a building with a horizontal flat plate and in all multi-level buildings rather than at the leading edges, as per ASCE 7-22 wind loading diagrams. The peak negative pressure zones of both perpendicular surfaces in all models were observed away from the leading edges of the building which was not in compliance with the peak pressure zones defined by ASCE 722. In summary, this study quantified and documented a rather complex fluid–structure interaction problem that, in addition to its fundamental to fluid dynamics relevance, might have direct implications on the wind loading patterns and design recommendations currently in the wind standards and building codes.
Data availability statement
The raw data supporting the conclusions of this article will be made available by the authors, without undue reservation.
Author contributions
CM (PhD student in CEE, FIU) carried out most of the experiment’s modeling and wind tunnel tests and data analyses and wrote sections of this manuscript in collaboration with all the co-authors. IZ (Associate Professor in CEE, FIU) supervised the experiments and data analyses and revised the manuscript. All authors contributed to the article and approved the submitted version.
Funding
The authors express their gratitude for the financial assistance provided by the State of Florida Division of Emergency Management, USA (DEM). Additionally, they acknowledge the financial backing received by the Wall of Wind facility for the conducted tests, which came from the National Science Foundation (NSF).
Conflict of interest
The authors declare that the research was conducted in the absence of any commercial or financial relationships that could be construed as a potential conflict of interest.
Publisher’s note
All claims expressed in this article are solely those of the authors and do not necessarily represent those of their affiliated organizations, or those of the publisher, the editors, and the reviewers. Any product that may be evaluated in this article, or claim that may be made by its manufacturer, is not guaranteed or endorsed by the publisher.
References
1. Stathopoulos T, Zhou Y. Computation of wind pressures on L-shaped buildings. J Eng Mech (1993) 119:1526–41. doi:10.1061/(asce)0733-9399(1993)119:8(1526)
2. Akon AF, Kopp GA. Mean pressure distributions and reattachment lengths for roof-separation bubbles on low-rise buildings. J Wind Eng Ind Aerodynamics (2016) 155:115–25. doi:10.1016/j.jweia.2016.05.008
3. Kilpatrick RJ, Hangan H, Siddiqui K, Lange J, Mann J. Turbulent flow characterization near the edge of a steep escarpment. J Wind Eng Ind Aerodynamics (2021) 212:104605. doi:10.1016/j.jweia.2021.104605
4. Tamura Y, Xu X, Yang Q. Characteristics of pedestrian-level Mean wind speed around square buildings: Effects of height, width, size and approaching flow profile. J Wind Eng Ind Aerodynamics (2019) 192:74–87. doi:10.1016/j.jweia.2019.06.017
5. Duan G, Ngan K. Sensitivity of turbulent flow around a 3-D building array to urban boundary-layer stability. J Wind Eng Ind Aerodynamics (2019) 193:103958. doi:10.1016/j.jweia.2019.103958
6. Morton T, Mara T. Effects of balconies on the wind loading of a tall building. In: Proccedings of the AEI 2017; April 2017; Oklahoma (2017).
7. Naeiji A, Moravej M, Matus M, Zisis I. Codification study of wind-induced loads on canopies attached to mid-rise buildings. J Wind Eng Ind Aerodynamics (2022) 227:105050. doi:10.1016/j.jweia.2022.105050
8. Candelario JD, Stathopoulos T, Zisis I. Wind loading on attached canopies: Codification study. J Struct Eng (2014) 140:04014007. doi:10.1061/(asce)st.1943-541x.0001007
9. Zheng X, Montazeri H, Blocken B. CFD analysis of the impact of geometrical characteristics of building balconies on near-façade wind flow and surface pressure. Building Environ (2021) 200:107904. doi:10.1016/j.buildenv.2021.107904
10. Ludena L, Mooneghi MA, Moravej M, Chowdhury AG, Irwin P. Estimation of wind loads on the balcony glass handrails of mid-rise buildings. Structures Congress (2017) 2017:232–43.
11. Hou F, Sarkar PP, Alipour A. A novel mechanism-smart morphing façade system-to mitigate wind-induced vibration of tall buildings. Eng Structures (2023) 275:115152. doi:10.1016/j.engstruct.2022.115152
12. Chowdhury AG, Canino I, Mirmiran A, Suksawang N, Baheru T. Wind-loading effects on roof-to-wall connections of timber residential buildings. J Eng Mech (2013) 139:386–95. doi:10.1061/(asce)em.1943-7889.0000512
13. Zhu F, Yu Z, Liu Z, Chen X, Cao R, Qin H. Experimental study on the air flow around an isolated stepped flat roof building: Influence of snow cover on flow fields. J Wind Eng Ind Aerodynamics (2020) 203:104244. doi:10.1016/j.jweia.2020.104244
14. O’Rourke M, De Angelis C. Snow drifts at windward roof steps. J Struct Eng (2002) 128:1330–6. doi:10.1061/(asce)0733-9445(2002)128:10(1330)
15. Zhou X, Hu J, Gu M. Wind tunnel test of snow loads on a stepped flat roof using different granular materials. Nat hazards (2014) 74:1629–48. doi:10.1007/s11069-014-1296-z
16. Stathopoulos T, Luchian H. Wind pressures on buildings with stepped roofs. Can J Civil Eng (1990) 17:569–77. doi:10.1139/l90-065
17. Cao J, Tamura Y, Yoshida A. Wind pressures on multi-level flat roofs of medium-rise buildings. J wind Eng Ind aerodynamics (2012) 103:1–15. doi:10.1016/j.jweia.2012.01.005
18. Bairagi AK, Dalui SK. Estimation of wind load on stepped tall building using CFD simulation. Iranian J Sci Technol Trans Civil Eng (2021) 45:707–27. doi:10.1007/s40996-020-00535-1
19. Bairagi AK, Dalui SK. Comparison of aerodynamic coefficients of setback tall buildings due to wind load. Asian J Civil Eng (2018) 19:205–21. doi:10.1007/s42107-018-0018-3
20. Yacoubian M, Lam N, Lumantarna E, Wilson JL. Effects of podium interference on shear force distributions in tower walls supporting tall buildings. Eng Structures (2017) 148:639–59. doi:10.1016/j.engstruct.2017.06.075
21. Lu X, Gong Z, Weng D, Ren X. The application of a new structural control concept for tall building with large podium structure. Eng Structures (2007) 29:1833–44. doi:10.1016/j.engstruct.2006.10.008
22. Irwin P, Kilpatrick J, Robinson J, Frisque A. Wind and tall buildings: Negatives and positives. The Struct Des tall Spec buildings (2008) 17:915–28. doi:10.1002/tal.482
23. Irwin PA. Wind engineering challenges of the new generation of super-tall buildings. J Wind Eng Ind Aerodynamics (2009) 97:328–34. doi:10.1016/j.jweia.2009.05.001
24. Mohammadi A, Azizinamini A, Griffis L, Irwin P. Performance assessment of an existing 47-story high-rise building under extreme wind loads. J Struct Eng (2019) 145:04018232. doi:10.1061/(asce)st.1943-541x.0002239
26.ASCE7. Minimum design loads and associated criteria for buildings and other structures. Reston, Virginia, USA: American Society of Civil Engineers (2022).
27.ESDU. Characteristics of the atmospheric boundary layer, Part II: Single point data for strong winds (neutral atmosphere). London: Engineering Sciences Data Unit (2001).
29. Wen L, Hatakeyama T, Sato K, Uematsu Y. Wind force coefficients for the design of supporting systems of large canopies attached to low- and middle-rise buildings with flat roofs. J Wind Eng Ind Aerodynamics (2020) 207:104429. doi:10.1016/j.jweia.2020.104429
30.TPU. Tpu 2012 (2012). Available at: http://wind.arch.t-kougei.ac.jp/system/eng/contents/code/tpu.(Accessed April 15, 2023)
31. Tamura Y. Aerodynamic database for low-rise buildings. Tokyo Polytech: Global Coe programming (2012). Avaialble at: http://wind.arch.t-kougei.ac.jp/system/eng/contents/code/tpu last (accessed April 9, 2016).
32. Nozawa K, Tamura T. Large eddy simulation of the flow around a low-rise building immersed in a rough-wall turbulent boundary layer. J Wind Eng Ind Aerodynamics (2002) 90:1151–62. doi:10.1016/s0167-6105(02)00228-3
33. Chen B, Shang L, Qin M, Chen X, Yang Q. Wind interference effects of high-rise building on low-rise building with flat roof. J Wind Eng Ind Aerodynamics (2018) 183:88–113. doi:10.1016/j.jweia.2018.10.019
34. Chen B, Cheng W, Ma H, Yang Q. Wind interference effects from one high-rise building and similar low-rise flat-roof buildings. J Struct Eng (2021) 147:04021138. doi:10.1061/(asce)st.1943-541x.0003121
Keywords: flow separation, peak pressure coefficients, wind tunnel, structure–flow interaction, multi-level building
Citation: Mohammadjani C and Zisis I (2023) Exploring the impact of vertically separated flows on wind loads of multi-level structures. Front. Phys. 11:1225817. doi: 10.3389/fphy.2023.1225817
Received: 19 May 2023; Accepted: 17 July 2023;
Published: 02 August 2023.
Edited by:
Yanlin Guo, Colorado State University, United StatesReviewed by:
Fei Ding, University of California, Berkeley, United StatesLiang Hu, University of Notre Dame, United States
Copyright © 2023 Mohammadjani and Zisis. This is an open-access article distributed under the terms of the Creative Commons Attribution License (CC BY). The use, distribution or reproduction in other forums is permitted, provided the original author(s) and the copyright owner(s) are credited and that the original publication in this journal is cited, in accordance with accepted academic practice. No use, distribution or reproduction is permitted which does not comply with these terms.
*Correspondence: Chia Mohammadjani, Q21vaGEwMTZAZml1LmVkdQ==