 Chengbiao Shen1
 Su Zhang
 Qiang Fu
 Jin Duan
- 1Space Opto-Electronics Technology Institute, Changchun University of Science and Technology, Changchun, Jilin, China
- 2Electronics and Information Engineering Institute, Changchun University of Science and Technology, Changchun, Jilin, China
For the variation of the polarized Mueller matrix of oil smoke particles under different relative humidity levels, the polarized single scattering characteristics of oil smoke particles are studied by using the Mie scattering theory, and the multiple scattering simulation is implemented with the Monte Carlo method. Variation in relative humidity is achieved by changing in mixing of the oil smoke and the water fog particles during the same dry particle filling time. Using the 36 sets of polarized Mueller matrices method, the Mueller matrix patterns of oil smoke were calculated for four conditions of 0%, 10%, 40%, and 95% relative humidity, respectively. We can verify the simulation’s correctness from the simulation and the experimental results. Specifically, as the relative humidity increases, the size of the Mueller matrix pattern increases, and the patterns of m22, m33, and m44 related to the depolarization characteristic change significantly. Furthermore, the scattering depolarization coefficients of the Mueller matrix polar decomposition increase with the increasing relative humidity, with the ability of depolarization being continuously enhanced. This method determines differences in relative humidity using intuitive measurements of stabilized scattering patterns, which can present a theoretical basis for the impact of environmental variation on polarization detection.
1 Introduction
When polarized light is irradiated on a strong scattering medium, multiple scattering will occur within this medium, and the polarization information of the transmission light will change, so polarization is widely used in the detection of the properties of the medium [1–3]. However, as the current detection methods are primarily focused on the study of the polarization states obtained from the detection terminal, more research on the properties of the transmission medium is needed. To get more properties of the medium, the polarization information of the scattering medium is expressed in the form of a matrix. The information during the transmission can be carried and displayed using the matrix property [4–6]. It can complement polarization detection and has a vital research value in the field of polarization detection.
For the optical system, a parametric model was constructed to describe the Mueller matrix of optical elements. Liu et al. proposed a method for the comprehensive characterization of an arbitrary composite waveplate based on spectroscopic Mueller matrix polarimetry and described its polarization properties by using four polarization parameters, namely, retardance, fast axis azimuth, rotation angle, and diattenuation angle [7]. For the complex media samples, to avoid the direct study of the samples and make verification easy and accurate, the Mueller matrix patterns are applied to analyze the polarization properties of samples in forward transmission by a third-party mapping method. Currently, many researchers have applied Mueller matrices to various fields. Wang et al. compared the polarization parameters extracted from the 3 × 3 and 4 × 4 Mueller matrix decomposition methods at directions of transmission and reflection, and the parameters derived from the two types of matrices display similar qualitative relations to changes in the microstructure of the biological tissues [8]. Khaliq et al. compared linear depolarization and linear retardance for both Mueller matrix polar decomposition and Mueller matrix transformation methods, and the study indicated that the optical variables of Mueller matrix polar decomposition and Mueller matrix transformation methods are sensitively correlated to the microstructure of the tissue samples [9]. Zhang et al. presented both experimental measurements and Monte Carlo-based simulations of transmission polarization to analyze the effects of concentration variation on the water fog particles. They demonstrated better persistence of circular polarization than linear polarization in more serious fog [10]. Liu et al. derived the depolarization index to characterize scattering media by estimating the transmittance with Monte Carlo simulation and enhanced the underwater vision under diverse water turbidity [11]. Sanz et al. measured the Mueller matrix of microstructured surfaces by using the polar decomposition method to detect the defects on the scattering flat surface [12]. Liu et al. introduced Mueller matrix polarimetry (MMP) to characterize nanoimprinted grating structures, and noticeable depolarization effects from measured data were observed [13]. For further research, they investigated the non-uniform depolarization properties of SiO2 thin films, two-dimensional Si grating, and three-dimensional Si cylinder grating by Mueller matrix polar decomposition [14]. Han et al. introduced a rapid Mueller matrix imaging system to research the structural characteristics of starch granules by testing different incoming and outgoing polarizations [15].
In this paper, we extend the research to consider the effect of the variation in relative humidity of the oil smoke environment on the polarization Mueller matrix. We present the Mie scattering theory of spherical particles combined with the Monte Carlo algorithm for calculating the polarization multiple scattering. We also analyze the depolarization characteristics under the different relative humidity levels by using the Mueller matrix polar decomposition method. To validate our practice, we compare the simulation method with measurements of oil smoke produced by glycerol atomization. This paper is organized as follows. Section 2 focuses on the experimental procedure for oil smoke particles under variable relative humidity levels, such as experimental setup, particle size measurement of dry particles, and close humidity monitoring in testing. In Section 3, we mainly describe the effect of relative humidity on the size and refractive index of oil smoke particles based on Hanel’s empirical growth equation and present the theoretical analysis of the Mueller matrix by using Monte Carlo simulation and the Mueller matrix polar decomposition method. Section 4 describes the simulation and experimental results and shows the consistency between simulation and measurement results. Finally, in Section 5, we summarize the results and further work.
2 Mueller matrix testing methods
2.1 Experimental setup
Figure 1 shows the Mueller matrix testing setup. A light beam emitted by an 83.06-mW laser at a wavelength of 532 nm passes through an attenuator (ATT) to adjust the illumination power. A rotatable linear polarizer (LP1, LPVISC050-MP2, Thorlabs, US) and a quarter wave-plate (W1, AQWP10M-580, Thorlabs, US) composed of the polarization state generator (PSG) are placed in front of the ATT to control the incident polarization state as one of horizontal (H), vertical (V),
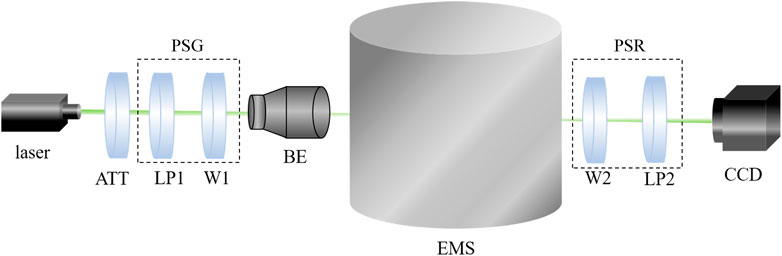
FIGURE 1. Schematic of the Mueller matrix measurement setup. ATT: attenuator; LP1 and LP2: linear polarizer; W1 and W2: quarter wave-plate; BE: beam expander; EMS: environment modulation system; CCD: charge coupled device; PSG: polarization state generator; PSR: polarization state receiver.
2.2 Particle size measurement of dry particles
During testing, to ensure the consistency of the concentration of dry particles at each relative humidity level, we control the amount of dry particles in the EMS by using the particle filling time. In this paper, we choose a dry particle filling time of 5 s, and then the volume distribution of the particle size can be measured directly by Spraytec, which is shown in Figure 2A. To ensure suitability of the testing data for theory simulation analysis, we converted the cumulative volume distribution to the number distribution in our previous study [16]. Figure 2B shows the cumulative number distribution of oil smoke, and the oil smoke particle has a mean radius value of 0.77
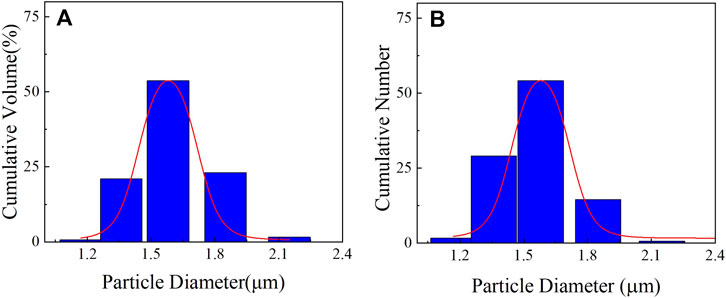
FIGURE 2. Size distribution of oil smoke particles at the smoke filling time of 5 s. (A) Cumulative volume distribution; (B) cumulative number distribution.
2.3 Relative humidity monitoring in the EMS
For monitoring of the relative humidity in the EMS, this paper uses ultrasonic atomization of water (ZS-10Z, Hangzhou Zhengdao Electrical Equipment Co., Ltd, China) for humidity adjustment and the relative humidity calibrator (RHCL-2, OMEGA Engineering Inc, China) for real-time measurement in the EMS. The water fog filling will stop once the relative humidity meets the testing requirement. During the experiments, the relative humidity levels of 0%, 10%, 40%, and 95% were chosen as the low, medium, and high typical relative humidity. We characterize the medium concentration by the optical thickness according to Beer’s law to learn the concentration variation at different levels of relative humidity. The optical thickness measurement schematic diagram is shown in Figure 3, in which the light power meter (LPM, PM100D, made by Thorlabs, US) is applied for outgoing light intensity testing. The optical thickness
where
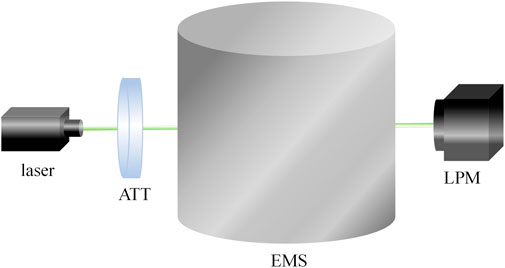
FIGURE 3. Schematic diagram of optical thickness measurement.
Figure 4 shows the stability of the emergent light intensity as a function of sampling time for one of the groups at 40% relative humidity. The result shows that the smoke environment is stable 3–10 min after the smoke filling, so we can conduct testing during this time. When the relative humidity levels are 0%, 10%, 40%, and 95%, the corresponding optical thicknesses are 2.02, 2.08, 2.45, and 3.26, respectively. Increase in the optical thickness is due to the larger relative humidity resulting in the increase of the extinction cross-section
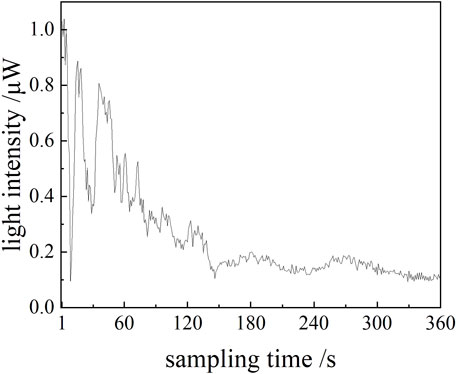
FIGURE 4. Intensity of the emergent light under the relative humidity of 40%.
3 Monte Carlo calculations under different levels of relative humidity
3.1 Effect of relative humidity on oil smoke particles
Due to the hygroscopicity of the oil smoke particles, the radius and refractive index of the oil smoke particles after water absorption can be obtained from the Hanel’s empirical growth equation [18]. When the relative humidity
where
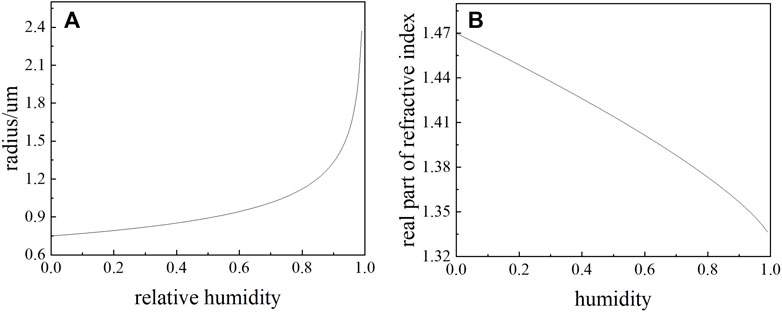
FIGURE 5. Effect of relative humidity on oil smoke particle parameters. (A) Particle radius; (B) real part of the refractive index.
3.2 Monte Carlo simulation
A Monte Carlo method based on Ramella-Roman et al. [3] is used to perform the calculations for the multiple scattering of oil smoke particles. It involves the change of the transmission energy and the direction of the photons, which is finally characterized by polarization.
The Stokes vector uses four parameters
where
When the polarized light passes through the medium, the Mueller matrix
where
For the spherical, isotropic, and homogeneous particles, the Mueller matrix is
and the rotation matrix can be written as
so
Photon energy loss can occur in the process of the transmission; once the photon energy weight decreases below a certain threshold or the photon flies off the boundary, the photon transmission is terminated. After the photon has been scattered
where
in which
3.3 Mueller matrix analysis
The Mueller matrix can be acquired in various ways; in this paper, we use a combination of 36 groups to adjust the polarization state generator (PSG) and the polarization state receiver (PSR) parts to
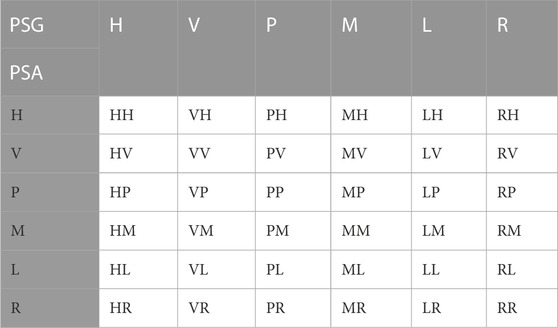
TABLE 1. Combination of 36 groups of the Mueller matrix.
According to the aforementioned combinations, the Mueller matrix can be derived as [23]
where
3.4 Mueller matrix polar decomposition
With the polar decomposition method, the Mueller matrix
in which
where
We set
The total depolarizer coefficient can be written as
where
4 Simulation and experimental result and analysis
4.1 Simulation results
Our goal in this work is to investigate the effect of relative humidity on the polarization Mueller matrix. Since the empty EMS without particles has little impact on the Mueller matrix of the oil smoke environment, we chose dry particles and low, medium, and high typical humidity for the study. The Mueller matrix patterns of oil smoke particles at different relative humidity are simulated by the Monte Carlo simulation method in Section 3.2 with the initial parameters of the wavelength of 532
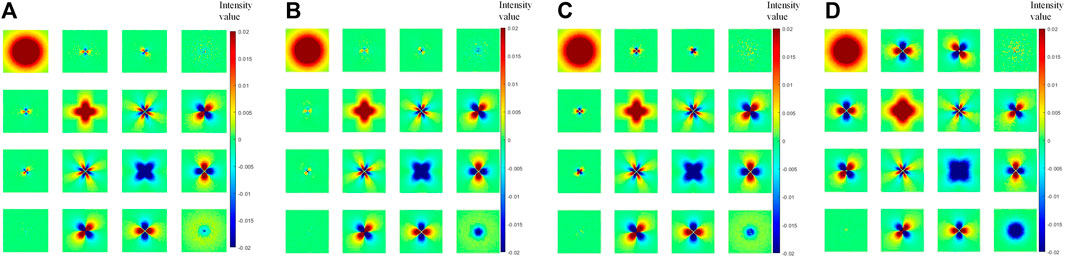
FIGURE 6. Mueller matrix simulation pattern under different relative humidity. (A) 0%; (B) 10%; (C) 40%; (D) 95%.
To further quantify the effect of different relative humidity on each element of the Mueller matrix, we first normalize the pixel intensity values of each element at different relative humidity by m11 to eliminate the effects of light intensity and keep the intensity value of each pixel in the range of [−1 1] [27], and then according to the appearance frequency of the intensity values, the interval segmentation statistics of intensity values are performed for each normalized matrix element m11–m44 to get the number of intensity values in a small interval of different central values. Finally, the normalized intensity frequency distribution of each element is established, shown in Figure 7. In Figure 7, the horizontal coordinate is the central value of the intervals and the vertical coordinate is the number of intensity values occurring in this division interval. As can be seen from the figures, the three diagonal elements m22, m33, and m44 change more significantly as the relative humidity increases. The depolarization phenomenon is more significant as observed from the Mueller matrix polarization decomposition in Section 3.4. This phenomenon is also consistent with the conclusion that the scattering depolarization of spherical, isotropic, and homogeneous particles is more significant than the retardance and diattenuation [28].
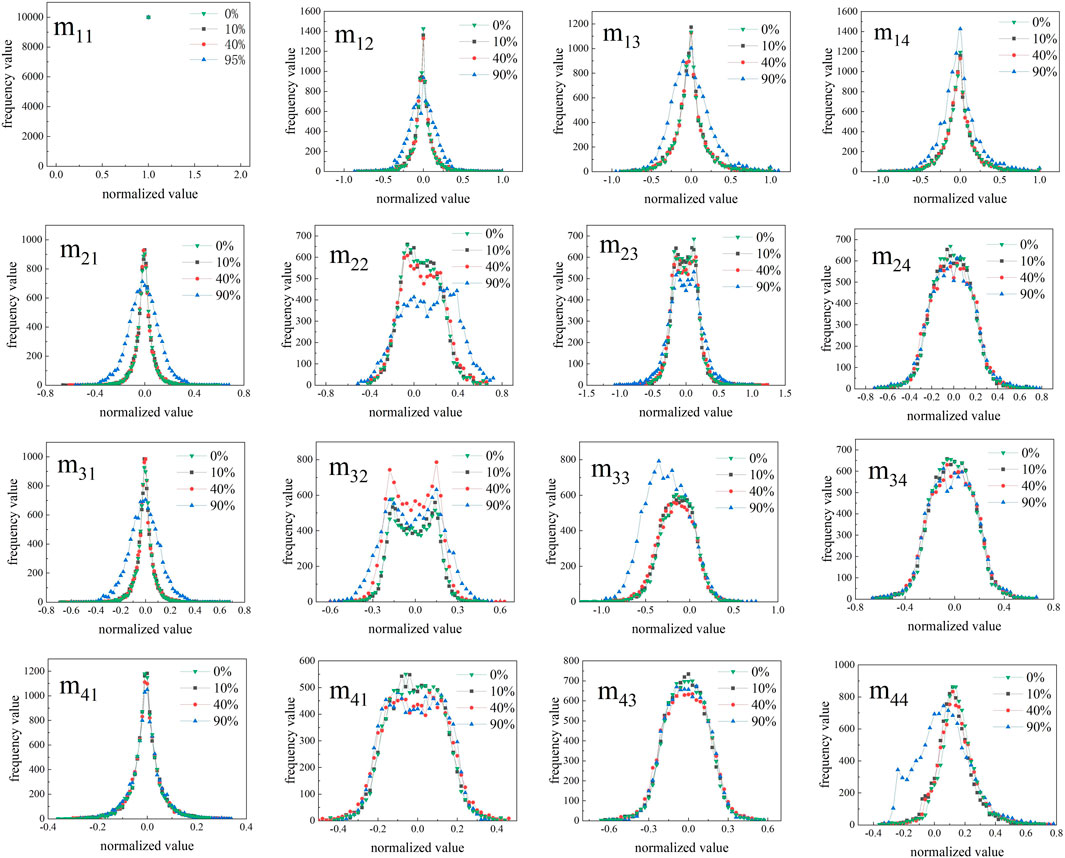
FIGURE 7. Normalized intensity frequency distribution curves of Mueller matrix elements under different relative humidity.
The depolarization coefficient pattern of Figure 6 under different relative humidity is solved by Eq. 15. Figure 8 shows the Mueller matrix depolarization coefficient patterns' three-dimensional simulation results for 0%, 10%, 40%, and 95% relative humidity. The figures show that the minimum value of the oil smoke depolarization coefficient pattern increases gradually with increasing relative humidity, which are 0.426, 0.511, 0.565, and 0.816, respectively. This indicates that the depolarization phenomenon becomes apparent as the relative humidity of the oil smoke increases.
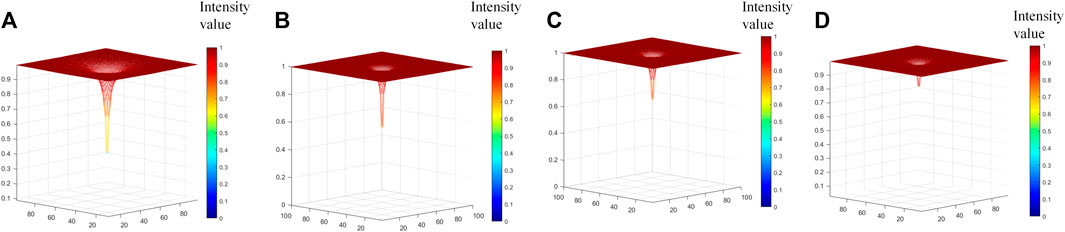
FIGURE 8. Three-dimensional diagram of Mueller matrix simulation depolarization under different relative humidity. (A) 0%; (B) 10%; (C) 40%; (D) 95%.
4.2 Experimental results
The PSG and PSA parts are adjusted in the measurement according to the data in Table 1, and 16 sets of Mueller matrix element patterns can be obtained by calculating Eq. 14. To correspond to the image size of the Mueller matrix elements in the simulations, the raw patterns captured by the CCD with the size of 2448
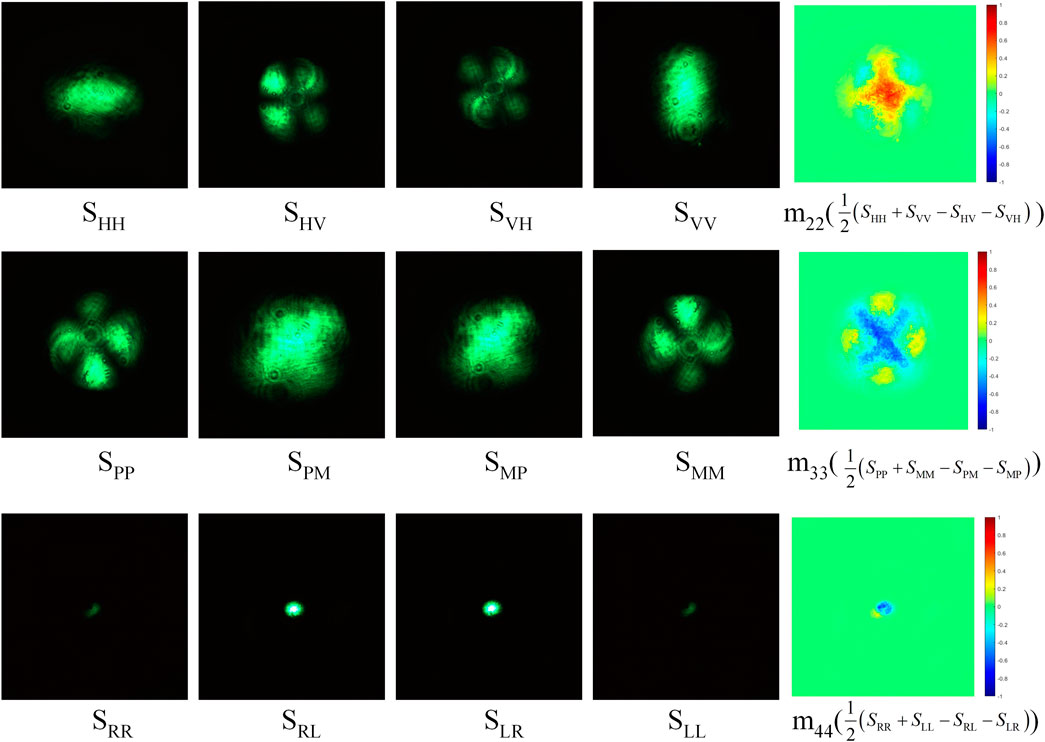
FIGURE 9. Experimental diagram of testing results under the relative humidity of 0%.
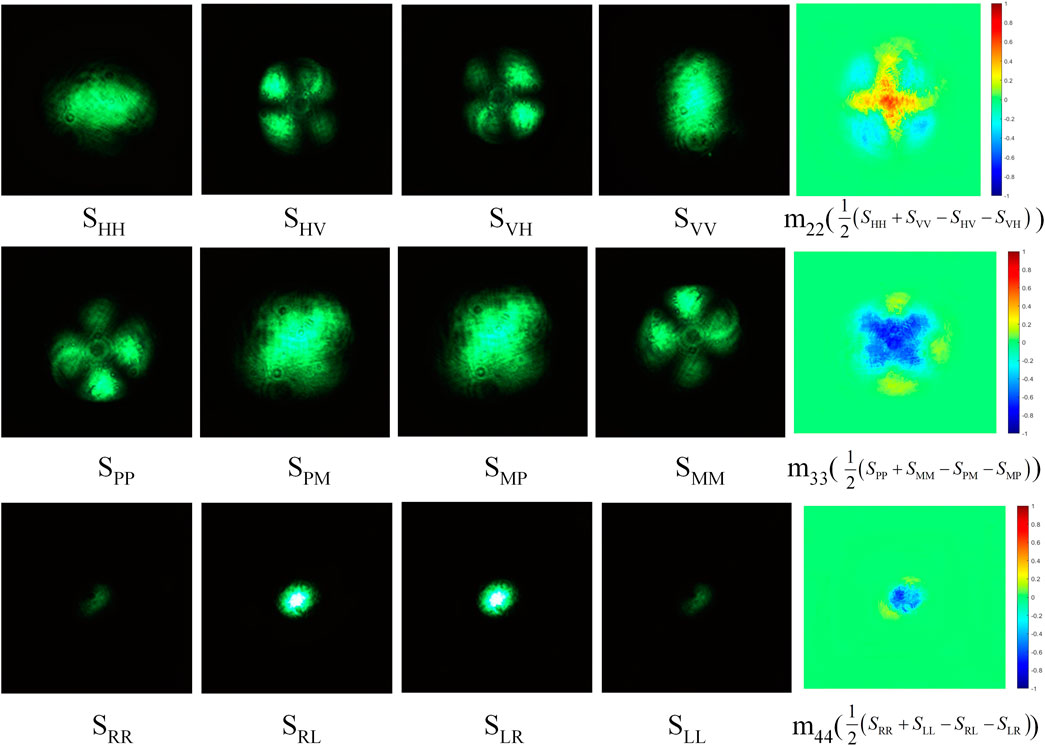
FIGURE 10. Experimental diagram of testing results under the relative humidity of 10%.
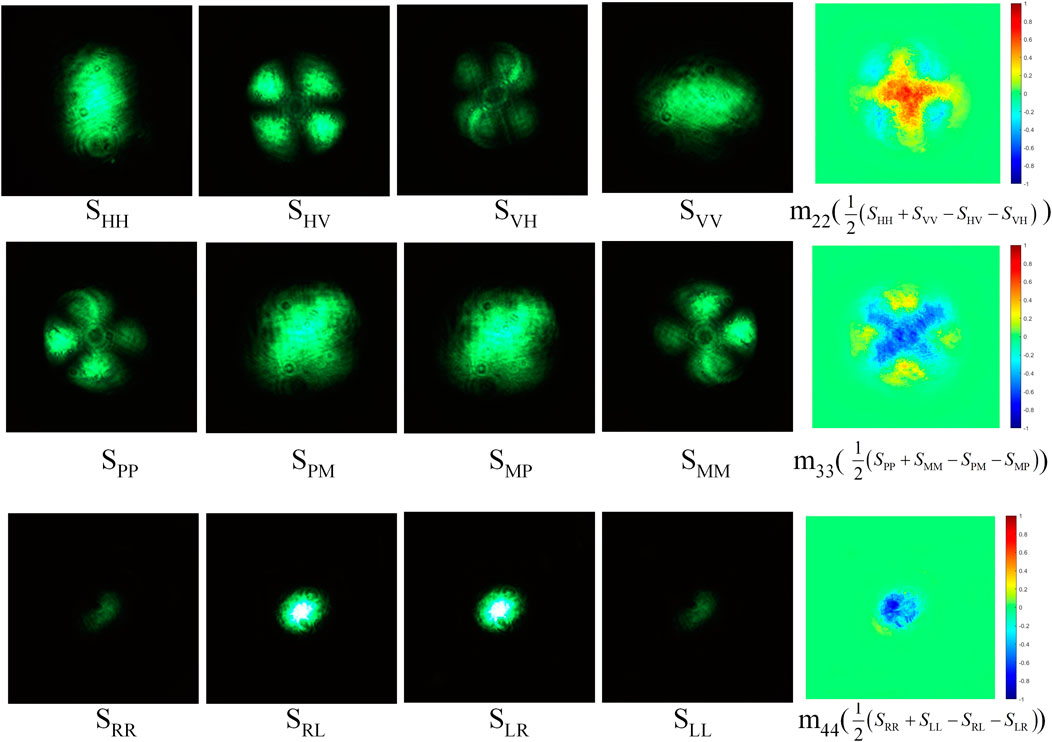
FIGURE 11. Experimental diagram of testing results under the relative humidity of 40%.

FIGURE 12. Experimental diagram of testing results under the relative humidity of 95%.
FIGURE 13. Schematic diagram of the quantitative analysis process.
4.3 Agreement between simulation and experiment
To verify the accuracy of the simulations, we compared the simulation result of Mueller matrix elements with the experimental images, and the mean square error (MSE) was calculated [29]. Each Mueller matrix element’s simulated and measured patterns under the same relative humidity are subjected to a point-taking operation. During the calculation, the center pixel is used as the center of the circle, and the points are taken at 45° intervals in the 360° direction of the circle. To make the values consistent, the edge points of the pattern are taken in these eight directions to complete the values compatible with the simulation and experiment. Finally, the normalized intensity values of the taken points are calculated for the MSE, which can be expressed as
where
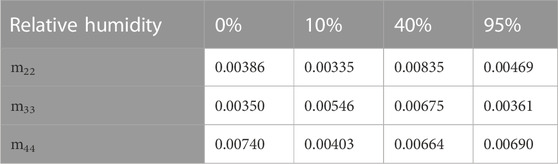
TABLE 2. MSE between simulation and experiment.
It is apparent that the average value of the MSE with different relative humidity levels is 0.00538. This is due to the fact that the relative humidity controlled in the experiment cannot reach the ideal state, resulting in the simulation and experimental patterns not being fully consistent. However, the simulation and the observed images have the exact change trend, which can indicate the correctness of the simulation.
5 Conclusion
In this paper, we present Mie scattering and the Monte Carlo method as the scattering model to study the effect of relative humidity variations on Mueller matrix patterns and depolarization of smoke particles. On this basis, an experimental setup is established to test Mueller matrix with controllable environmental parameters. The experimental and simulation results show that (1) the Mueller matrix pattern increases with the increasing relative humidity. (2) The frequency distribution curves of m22, m33, and m44 patterns change most obviously with the increasing relative humidity, which can reflect the more significant depolarization characteristics of the oil smoke particles. (3) The depolarization of the oil smoke particles gradually increases as relative humidity increases, which is useful to analyze the decrease of degree of polarization (DOP) for polarized incident light in a higher-relative humidity environment. (4) Comparing the simulations with the experiments, the average value of the MSE reaches 0.00538. Therefore, the study of the Mueller matrix can reflect the characteristics of the oil smoke environment under different relative humidity and extend the application range of the polarization Mueller matrix.
Data availability statement
The original contributions presented in the study are included in the article/Supplementary Materials; further inquiries can be directed to the corresponding author.
Author contributions
CS: writing–original draft and writing–review and editing. SZ: writing–original draft and writing–review and editing. QF: writing–review and editing. JZ: writing–review and editing. JD: writing–review and editing. YL: writing–review and editing.
Funding
The authors declare financial support was received for the research, authorship, and/or publication of this article. The work was supported by the National Natural Science Foundation of China (62127813; 61890963), Jilin Scientific and Technological Development Program (20210201093GX), and Education Department Program of Jilin Province (JJKH20220737KJ; JJKH20220738KJ).
Conflict of interest
The authors declare that the research was conducted in the absence of any commercial or financial relationships that could be construed as a potential conflict of interest.
Publisher’s note
All claims expressed in this article are solely those of the authors and do not necessarily represent those of their affiliated organizations, or those of the publisher, the editors, and the reviewers. Any product that may be evaluated in this article, or claim that may be made by its manufacturer, is not guaranteed or endorsed by the publisher.
References
1. Han Y, Ding L, Wang YP, Zheng HY, Fang L. Polarized light illuminated scattering characteristics of single airborne particle. J Quant Spectrosc Ra (2021) 266:107568. doi:10.1016/j.jqsrt.2021.107568
2. Bruce NC, López-Téllez JM, Rodríguez-Núñez O, Rodríguez-Herrera OG. Permitted experimental errors for optimized variable-retarder Mueller-matrix polarimeters. Opt Express (2018) 26:13693–704. doi:10.1364/oe.26.013693
3. Wang K, Fu Q, Wang B, Shi HD, Liu J, Wang Q, et al. Simplified analysis and suppression of polarization aberration in planar symmetric optical systems. Opt Express (2023) 31, 30750–30766. doi:10.1364/OE.498455
4. Alali S, Kim A, Vurgun N, Wood MFG, Vitkin IA, Ahmad M. Quantitative correlation between light depolarization and transport albedo of various porcine tissues. J Biomed Opt (2012) 17, 045004. doi:10.1117/1.JBO.17.4.045004
5. Zhao YZ, Li YH, He WJ, Liu Y, Fu YJ. Polarization scattering imaging experiment based on Mueller matrix. Opt Commun (2021) 490:126892. doi:10.1016/j.optcom.2021.126892
6. Wang HY, Hu HF, Jiang JF, Li JQ, Li XB, Zhang WH, et al. Polarization differential imaging in turbid water via Mueller matrix and illumination modulation. Opt Commun (2021) 499:127274. doi:10.1016/j.optcom.2021.127274
7. Gu HG, Chen XG, Shi YT, Jiang H, Zhang CW, Gong P, et al. Comprehensive characterization of a general composite waveplate by spectroscopic Mueller matrix polarimetry. Opt Express (2018) 26:25408. doi:10.1364/OE.26.025408
8. Wang YF, Guo YH, Zeng N, Cheng DS, He HH, Ma H. Study on the validity of 3×3 Mueller matrix decomposition. J Biomed Opt (2015) 20:065003. doi:10.1117/1.jbo.20.6.065003
9. Khaliq A, Ashraf S, Gul B, Ahmad I. Comparative study of 3 x 3 Mueller matrix transformation and polar decomposition. Opt Commun (2021) 485:126756. doi:10.1016/j.optcom.2021.126756
10. Zhang S, Shen CB, Feng XQ, Lu ST, Zhan JT, Duan J, et al. Light transmission polarization patterns and depolarization from water fog concentration variation. Opt Eng (2023) 62:014104. doi:10.1117/1.OE.62.1.014104
11. Liu T, Sun T, He HH, Liu SX, Dong Y, Wu J, et al. Comparative study of the imaging contrasts of Mueller matrix derived parameters between transmission and backscattering polarimetry. Biomed Opt Express (2018) 9:4413–28. doi:10.1364/BOE.9.004413
12. SanzSaiz JMJM, González F, Moreno F. Polar decomposition of the Mueller matrix: a polarimetric rule of thumb for square-profile surface structure recognition. Appl Opt (2011) 50:3781–8. doi:10.1364/AO.50.003781
13. Chen XG, Zhang CW, Liu SY. Depolarization effects from nanoimprinted grating structures as measured by Mueller matrix polarimetry. APPL PHYS LETT (2013) 103(15):151605. doi:10.1063/1.4824760
14. Dong ZQ, Gu HG, Zhu JL, Shi YT, Nie L, Lyu JY, et al. Nonuniform depolarization properties of typical nanostructures and potential applications. Opt Lett (2020) 45(7):1910–3. doi:10.1364/OL.389732
15. Han CY, Du CY, Chen DF. Evaluation of structural and molecular variation of starch granules during the gelatinization process by using the rapid Mueller matrix imaging polarimetry system. Opt Express (2018) 26:15851. doi:10.1364/OE.26.015851
16. Zhang S, Zhan JT, Fu Q, Duan J, Li YC, Jiang HL. Effects of environment variation of glycerol smoke particles on the persistence of linear and circular polarization. Opt Express (2020) 28:20236–48. doi:10.1364/OE.395428
17. van der Laan JD, Wright JB, Kemme SA, Scrymgeour DA. Superior signal persistence of circularly polarized light in polydisperse, real-world fog environments. Appl Opt (2018) 57:5464. doi:10.1364/AO.57.005464
18. Hnel G. The properties of atmospheric aerosol particles as functions of the relative humidity at thermodynamic equilibrium with the surrounding moist air. Adv Geophys (1976) 19:73–188. doi:10.1016/s0065-2687(08)60142-9
19. Fitzgerald JW. Effect of relative humidity on the aerosol backscattering coefficient at 0694- and 106-μm wavelengths. Appl Opt (1984) 23:411. doi:10.1364/AO.23.000411
20. Bartel S, Hielscher AH. Monte Carlo simulations of the diffuse backscattering mueller matrix for highly scattering media. Appl. Opt. (2000) 39:1580–1588. doi:10.1364/AO.39.001580
21. Nee JB. Multichannel polarization lidar measurements of aerosols and cirrus clouds. Eur Phys J Plus (2020) 237:07020. doi:10.1051/epjconf/202023707020
22. Milun JR, George WK, Mehru˝ beo M, Brent DC, Lihong VW, Sohi R, et al. Light backscattering polarization patterns from turbid media: theory and experiment. Appl Opt (1999) 38:3399. doi:10.1364/AO.38.003399
23. Du E, He HH, Zeng N, Guo YH, Liao R, He YH, et al. Two-dimensional backscattering Mueller matrix of sphere–cylinder birefringence media. J Biomed Opt (2012) 17:126016–1260167. doi:10.1117/1.JBO.17.12.126016
24. Lu SY, Chipman RA. Interpretation of Mueller matrices based on polar decomposition. J OPT SOC AM A (1996) 13:1106–13. doi:10.1364/JOSAA.13.001106
25. He C, Chang J, Salter PS, Shen YX, Dai B, Li PC, et al. Revealing complex optical phenomena through vectorial metrics. Adv Photon (2022) 4. doi:10.1117/1.AP.4.2.026001
26. Chen ZH, Yao Y, Zhu YH, Ma H. Removing the dichroism and retardance artifacts in a collinear backscattering Mueller matrix imaging system. Opt Express (2018) 26:28288–301. doi:10.1364/OE.26.028288
27. Andreas HH, Judith RM, Irving JB. Influence of particle size and concentration on the diffuse backscattering of polarized light from tissue phantoms and biological cell suspensions. Appl Opt (1997) 36:125–35. doi:10.1364/AO.36.000125
28. Sheng W, Li WP, Qi J, Liu T, He HH, Dong Y, et al. Quantitative analysis of 4 × 4 mueller matrix transformation parameters for biomedical imaging. Photonics (2019) 6:34. doi:10.3390/photonics6010034
Keywords: depolarization, Mueller matrix, relative humidity, Monte Carlo simulation, polar decomposition, oil smoke
Citation: Shen C, Zhang S, Fu Q, Zhan J, Duan J and Li Y (2023) The effect of relative humidity on the polarization Mueller matrix under the oil smoke environment. Front. Phys. 11:1266027. doi: 10.3389/fphy.2023.1266027
Received: 24 July 2023; Accepted: 02 October 2023;
Published: 25 October 2023.
Edited by:
Sergejus Orlovas, Center For Physical Sciences And Technology (CPST), LithuaniaReviewed by:
Honggang Gu, Huazhong University of Science and Technology, ChinaArturo Mendoza-Galvan, Unidad Querétaro, Mexico
Copyright © 2023 Shen, Zhang, Fu, Zhan, Duan and Li. This is an open-access article distributed under the terms of the Creative Commons Attribution License (CC BY). The use, distribution or reproduction in other forums is permitted, provided the original author(s) and the copyright owner(s) are credited and that the original publication in this journal is cited, in accordance with accepted academic practice. No use, distribution or reproduction is permitted which does not comply with these terms.
*Correspondence: Su Zhang, c3VzaWV6aGFuZzIxQDEyNi5jb20=