 Linfeng Zhong
 Xiangying Gao1
- 1School of Air Traffic Management, Civil Aviation Flight University of China, Guanghan, China
- 2Chengdu GoldTel Industry Group Co., Ltd., Chengdu, China
- 3Operation Management Center of ATMB, Civil Aviation Administration of China, Beijing, China
Identifying the key nodes in complicated networks is an essential topic. A number of methods have been developed in recent years to solve this issue more effectively. Multi-attribute ranking is a widely used and efficient method to increase the accuracy of identifying the key nodes. Using k-shell iteration information and propagation threshold differences, we thoroughly analyze the node’s position attribute and the propagation attribute to offer a hybrid influence method based on information entropy. The two attributes will be weighted using the information entropy weighting method, and then the nodes’ influence ranking will be calculated. Correlation experiments in nine different networks were carried out based on the Susceptible–Infected–Recovered (SIR) model. Among these, we use the imprecision function, Kendall’s correlation coefficient, and the complementary cumulative distribution function to validate the suggested method. The experimental results demonstrate that our suggested method outperforms previous node ranking methods in terms of monotonicity, relevance, and accuracy and performs well to achieve a more accurate ranking of nodes in the network.
1 Introduction
Real life is made up of many different networks, each with a small number of critical nodes that have significant effects on the overall structure and function of the network. Accurately identifying key nodes in a network has various applications [1–4]. For instance, by precisely identifying influential users in social networks, information diffusion can be accelerated [5,6]. In the transportation network, identifying key nodes can help alleviate transportation strain, increase transportation efficiency, optimize the transportation network layout [7], and so on [8–10].
Researchers have developed an enormous array of key nodes’ identification methods in recent years, each of which analyzes the nodes from a different perspective. Degree centrality (DC) takes into account a node’s neighbor information [11]. Betweenness centrality (BC) [12] and closeness centrality (CC) [13] analyze the nodes’ path information. When ranking the critical nodes, k-shell decomposition (KS) takes the nodes’ positions in the network into account [14]. However, using a single benchmark approach to rank the nodes can result in some of them receiving the same centrality values without further differentiation [15,16].
Recently, based on k-shell decomposition, a large number of researchers have developed several approaches for further differentiation of multiple nodes in the same k-shell [17–19]. To achieve better results, some researchers have enhanced the standard k-shell decomposition method, and others have integrated it with additional methods for identifying the key nodes [20,21]. These improvements have been made by taking into account various node attributes [22,23]. One of the current study hotspots for many academics is the concurrent investigation and analysis of the position attributes, neighbor attributes, or propagation attributes of the nodes in the network. Zeng et al. introduced a mixed-degree decomposition approach that divides the nodes in the network into two states, removed nodes and residual nodes, and refers to them as depletion and residual degrees, respectively [24]. By considering a node’s neighbors, Bae and Kim presented a novel neighborhood correlation centrality metric that determines a node’s network spreading influence by adding up all of the neighborhood k-shell values [25]. According to [26], this is taken into account by calculating the shortest path between each node and the nodes that make up the network’s core. The closer a node is to all of these nodes, the more significant it is also thought to be. By combining the nodes’ position attributes and path information, Ma et al. proposed the gravity centrality (GC) [27]. The ks value of a node is regarded as the mass in the GC method. Wang et al. suggested the k-shell iteration factor method, which analyzes the iteration process in the k-shell decomposition [28]. Zhao et al. combined the information entropy method to consider a node’s position attribute and neighbor attribute [29]. The position attribute is analyzed using the k-shell decomposition, and the number of times the node has been deleted is taken into consideration to achieve a detailed distinction between nodes once more. With the use of the node’s position attribute, it is possible to determine a node’s influence by calculating its distance from the network’s hub. Additionally, by taking the node’s propagation attribute into account, the node’s influence can be examined as well. The percolation theory states that when a node in a network is deleted, the resulting residual network generates a new propagation threshold [30,31]. We believe that the difference in thresholds caused by node deletion can represent the node’s impact on propagation, which has an impact on the structural function of the network, as well as other nodes in the network. [32] proposed a method for comprehensively considering the network’s propagation threshold and node degree.
We propose a hybrid influence method based on information entropy (HIE), which includes both the positional and propagation attributes of nodes. First, using the sigmoid function, we achieve iterative differentiation of nodes within the same shell following k-shell decomposition. The propagation property of the nodes is then analyzed, and the absolute value of the threshold difference after node deletion is computed. Finally, using the information entropy weighting method, the two attributes are weighted and assessed. In nine different networks, we implemented relevant experiments based on the Susceptible–Infected–Recovered (SIR) model [33,34]. The complementary cumulative distribution function, Kendall’s coefficient [35], and the imprecision function were used in the experiments. The experimental results show that our method outperforms other comparison methods for a variety of assessment criteria, which may greatly enhance the identification of key nodes and result in more accurate node differentiation.
The rest of the paper is divided into the following sections. The proposed method is fully explained in Section 2. The experimental results are examined in Section 3. Section 4 includes both discussions and conclusions.
2 Model
Using the notation G = (N, E), it is defined that a network G, which is unweighted and undirected, consists of N nodes and E edges. The adjacency matrix of G is A = {aij}; aij = 1 denotes the direct connection between nodes i and j; otherwise, aij = 0.
The k-shell decomposition offers extremely valuable node positioning information. There are more iterations for nodes that are closer to the center and fewer iterations for nodes that are farther from the center in the same shell layer. Numerous articles have also examined this [29,36]. The nodes in the same k-shell can be ranked by the relevance of the number of times they have been removed, which reflects the characteristics of the node position attribute, in order to further differentiate the removed nodes in that layer. In this research, “positional iteration” means counting the times in which the iterative deletion process deletes every node in one k-shell. Inspired by [29], we utilize the sigmoid function to determine how many times the iterative process will occur using the specified node position metric pmi,
The position indication pmi increases as the number of iterations (Iter(i)) increases. Here, Iter(i) takes a value range of (0, +∞), and the critical value of pmi is 0.75.
A node’s positional attributes are represented by PAi, which is made up of two parts: the node’s ks value and the pmi value,
where ksi denotes the k-shell value of node i and pmi denotes the position indicator calculated when node i is iteratively eliminated by the shell in which it is located. Next, we will utilize a basic network with 18 nodes and 23 edges to further our illustration. In Figure 1, nodes 5 and 6 have identical ks values of 2. Node 5 is more crucial than node 6 because when all nodes are eliminated iteratively with ks = 2, node 5 is deleted for the third time, while node 6 is deleted for the second time. The pmi value for each node in Figure 1 is shown in Table 1. The first column of the table lists the ks values for each node, and the second column lists the nodes that are deleted during each iteration of k-shell decomposition. The iteration order stands for the number of times a node has been deleted within the same k-shell layer or with the same ks value. From the table, we can learn that pm5 = 0.637256 and pm6 = 0.603322, so PA5 = ks5 + pm5 = 2 + 0.637256 = 2.637256 and PA6 = ks6 +pm6 = 2 + 0.603322 = 2.603322.
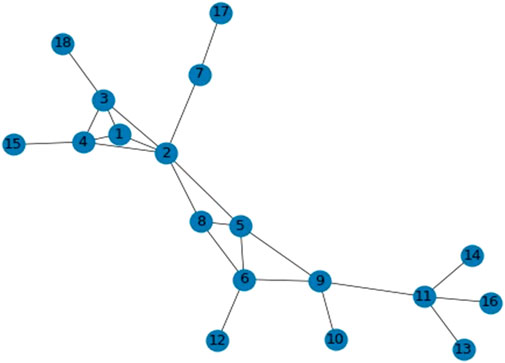
FIGURE 1. Small schematic network.
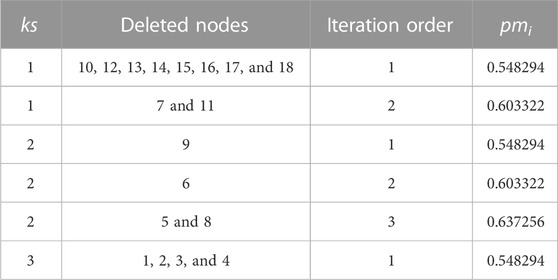
TABLE 1. Values of pmi taken during the detailed iteration of the k-shell decomposition.
We take the network’s propagation threshold δ into consideration when analyzing the nodes’ propagation characteristics. The leading eigenvalue λ(M) of the non-backtracking matrix of an unweighted, undirected network G can be used to determine the network’s propagation threshold,
where λ(M) can be expressed as follows:
where ki denotes the degree value of node i, ki = ∑j∈G aij.
In Eq. 3, removing a node from the network causes the network’s overall structure and the corresponding δ value of the remaining network to alter. At this point, there is a difference from the δ value derived from the original network, which is known as the threshold difference Δδi. In this research, we consider the absolute value of the threshold difference obtained after node deletion.
where δi denotes the propagation threshold calculated for the remaining network. PBi stands for the threshold difference’s absolute value.
When we take into account the node’s position attribute and the propagation attribute in a thorough manner, we will apply the method of information entropy weighting for the two separate attribute features in order to get a more accurate identification of key nodes.
where w1 and w2 stand for the weights of the node’s position attribute and propagation attribute, respectively. PABi stands for the combined influence of the node generated by combining the two attributes.
Finally, we propose a hybrid influence method based on information entropy (HIE) in conjunction with taking a node’s first-order neighbors into account.
Using the information entropy weighting method, the w1 and w2 values, corresponding to the two qualities, are determined independently. To start, the entropy value for each attribute, IEi, is figured out
In this case, two attributes are involved; therefore, i = 1, 2 is set. IEi signifies the entropy value of the ith attribute. The rij denotes the normalized value of the ith attribute of the jth node. The positioning attribute is indicated if i = 1, and the propagation attribute is indicated if i = 2, where the following equation is used to compute rij,
After that, the weights of the two attributes wi are calculated by
We use the HIE method to identify the nodes in Figure 1 and assess their relative significance within the network. As shown in Table 2, there has been a notable improvement in node differentiation when compared to the k-shell decomposition. In Table 2, the first row shows the rankings, and the second row lists the node numbers for the nodes that are located in the various ranked nodes. According to Table 2, the HIE approach can be used to differentiate nodes with the same ks value. For instance, the ks values of nodes 1, 2, 3, and 4 are all 3, but they are distributed around the network in different places. As a result of using the HIE method, node 2 is determined to be the most crucial node in the ranking. Furthermore, it can be seen that nodes 1 and 5 have ks values of 3 and 2, respectively, but they are ranked 3 and 4 in Table 2. Node 5 is more influential than node 1 in the network, and because it has more connecting edges, it tends to play a more important role in the network when it conducts the dissemination of information.

TABLE 2. Ranking distributions of nodes obtained by computing small schematic networks using the HIE method.
3 Results
3.1 Data description
Nine different-sized networks were chosen for this experiment. The accuracy of the suggested method will be verified by analyzing and comparing the various methods using these networks. The three Chinese carriers’ route networks include CA, CZ, and MU: CA is the Air China route network, CZ is the China Southern Airlines route network, and MU is the China Eastern Airlines route network. An airline network of American (USAir) is given in [37]. A network of links for communication (Polblogs) is given in [32]. An email communication network of URV’s (Email) is given in [26]. The Routers is a technological network, where nodes denote individual routers and edges between nodes represent connections between different routers. The Soc-hamsterster and Facebook are both social networks [38]. Some of the topological characteristics of the nine networks are listed in Table 3.
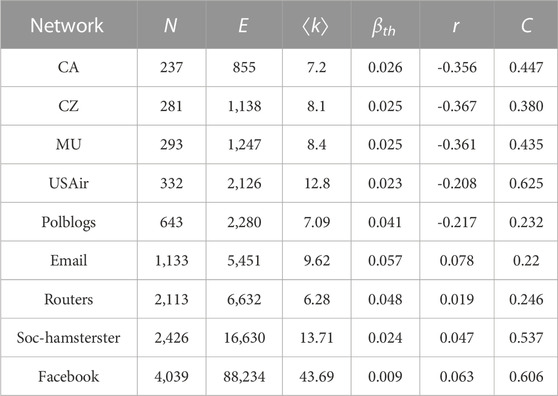
TABLE 3. Basic topology information of nine networks. The network’s total number of nodes, connected edges, and average degree are each represented by N, E, and ⟨k⟩, respectively. βth, r, and C are epidemic threshold, assortative coefficient, and clustering coefficient, respectively.
3.2 Measurement
To describe each node’s influence, we will use the SIR model’s node propagation range [34]. Three variables need to be established before the experiment: the propagation rate β, the recovery rate μ, and the infection step t. In this experiment, we will consider that each network’s node propagation rate ranges between 0.1 and 0.19, its recovery rate is 1, and its time step is 10. According to the SIR model, each node in a network can only be in one of the three states: susceptible, infected, or recovered. The susceptible neighbor of each infected node will randomly get infected with a specified probability at each time step of the SIR model. The infected node can then be recovered. The entire transmission process comes to an end when new infected nodes cease to appear in the network. To get an average result, the experiment is conducted 5,000 times. As it infects more nodes via the SIR propagation process, a node cultivates influence and importance inside the network.
Kendall’s tau coefficient is used to assess the correlation between two sequences [35]. Kendall’s tau τ has a value between −1 and 1. If the estimated value is closer to 1, there is a greater relationship between the two sequences. Kendall’s tau correlation coefficient is defined as follows:
Suppose that the length and element count of two sequences, V and W, are the same. In the two sequences, vi and wi, respectively, represent the ith values. There are three relationships between (vi, wi) and (vj, wj). The first relationship is concordant if (vi
In this paper, Kendall’s tau τ can be utilized to examine the relationship between the SIR model and the ranking lists generated by various node ranking methods. The ranking method is more effective if the acquired value is closer to 1.
By comparing the average influence of the top-ranked nodes acquired from SIR simulations and other methods, it is possible to further evaluate the accuracy of the various ranking methods. The imprecise function ɛ(p) can be used to accomplish the aforementioned target, and it is defined as follows:
where p is the proportion of the chosen top-ranked nodes. In addition, p has a value between 0 and 1. When the fraction of options is p, M(p) and Msir(p) represent, respectively, the average spreading influence size of the top-ranked set of nodes acquired from various node ranking methods and SIR simulations. The accuracy of that node ranking method increases with decreasing ɛ(p) values.
3.3 Simulation results
We evaluate the HIE method with four other node ranking methods in order to verify the efficacy and accuracy of the HIE. The four comparison methods we used are KS (k-shell decomposition) [14], Cnc+ (extended neighborhood coreness centrality measure) [25], KSIF (k-shell iteration factor method) [28], and PN (an improved multi-attribute k-shell method) [29].
To demonstrate the distribution of node rankings produced by each method in different networks, we used the complementary cumulative distribution function (CCDF) to execute the calculations and depict the relevant graphs. When using different node identification methods, it is beneficial if each node can be classified according to a separate ranking, which allows for the difference in node importance. Because of this, a node identification method performs better. The more precisely it ranks nodes, the fewer nodes there are in the same ranking, and the slower its CCDF curve decrements.
In nine networks, the CCDF images generated using various methods are displayed in Figure 2. As shown in Figure 2, the CCDF pictures acquired using the k-shell decomposition exhibit a quicker decrease in each of the nine networks. The HIE method degrades more slowly than several other methods in the CZ, MU, Polblogs, and Routers networks. The other numerous methods, with the exception of the KS method, have a close ranking situation when the value of CCDF is close to 0 in the CA, CZ, MU, USAir, Soc-hamsterster, and Facebook networks. In contrast, the method Cnc + performs less well than the KSIF, PN, and HIE in the Polblogs, Email, and Routers networks.
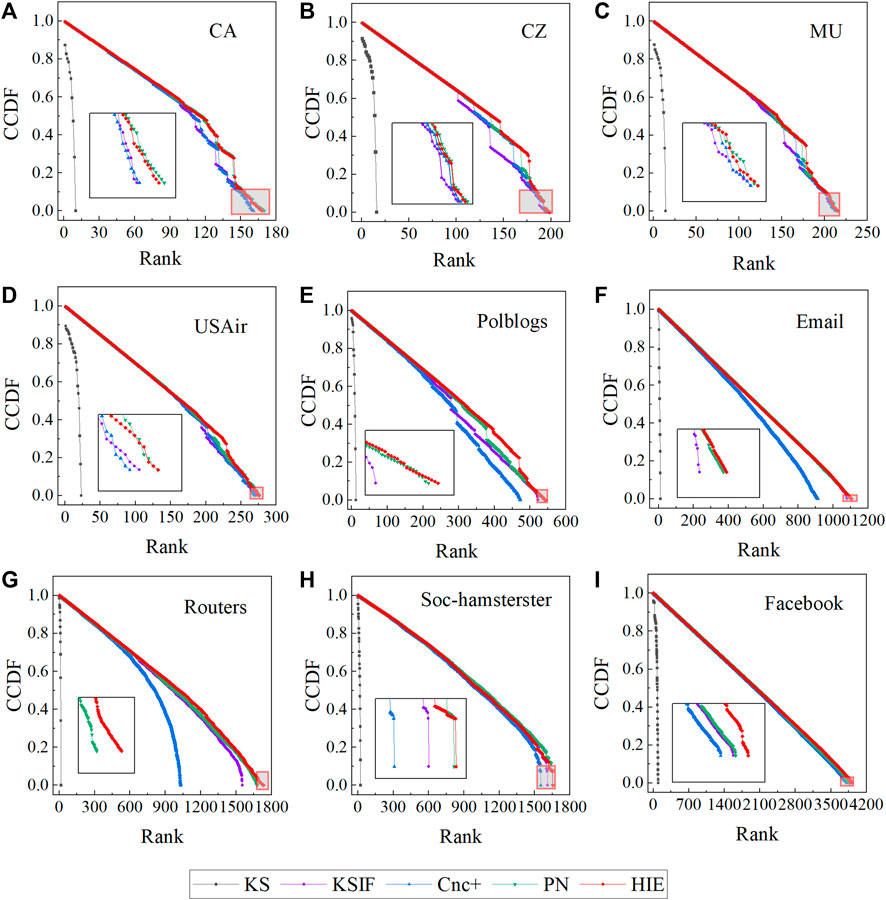
FIGURE 2. CCDF plots of nine actual networks. The horizontal axis displays the rankings produced by the method used to identify network nodes, while the vertical axis displays the CCDF values corresponding to the various rankings.
To evaluate the relevance of the various methods, we use Kendall’s coefficient. We selected the SIR propagation rate β in this experiment to be between 0.1 and 0.19. The results were based on an average of 100 separate experiments. Figure 3 displays the simulation results. The corresponding τ value almost always ranks first in the MU and USAir networks, demonstrating the excellent performance of the HIE method. The propagation rate in the CA and CZ networks begins at 0.11, and Kendall’s tau value determined by HIE is always the best. In the Soc-hamsterster networks, a similar situation is present. In the early phases of the Email and Routers networks, our method does not perform as well as the PN, Cnc+, and KSIF methods, but as the propagation rate increases in both networks, the HIE method gradually outperforms the other methods and achieves good performance. When the propagation rate is between 0.1 and 0.13 in the Polblogs and Facebook networks, Kendall’s tau coefficients produced using the HIE approach are lower than those obtained by the PN method. The HIE method yields a larger value of Kendall’s tau when the propagation rate is greater than 0.14, illustrating the increased validity and accuracy of HIE. The KSIF and PN both take a thorough look at k-shell decomposition, but they fail to include an extensive discussion of the nodes’ propagation attribute aspects. As a result, when calculating Kendall’s coefficients in some networks, the HIE outperforms the other two methods.
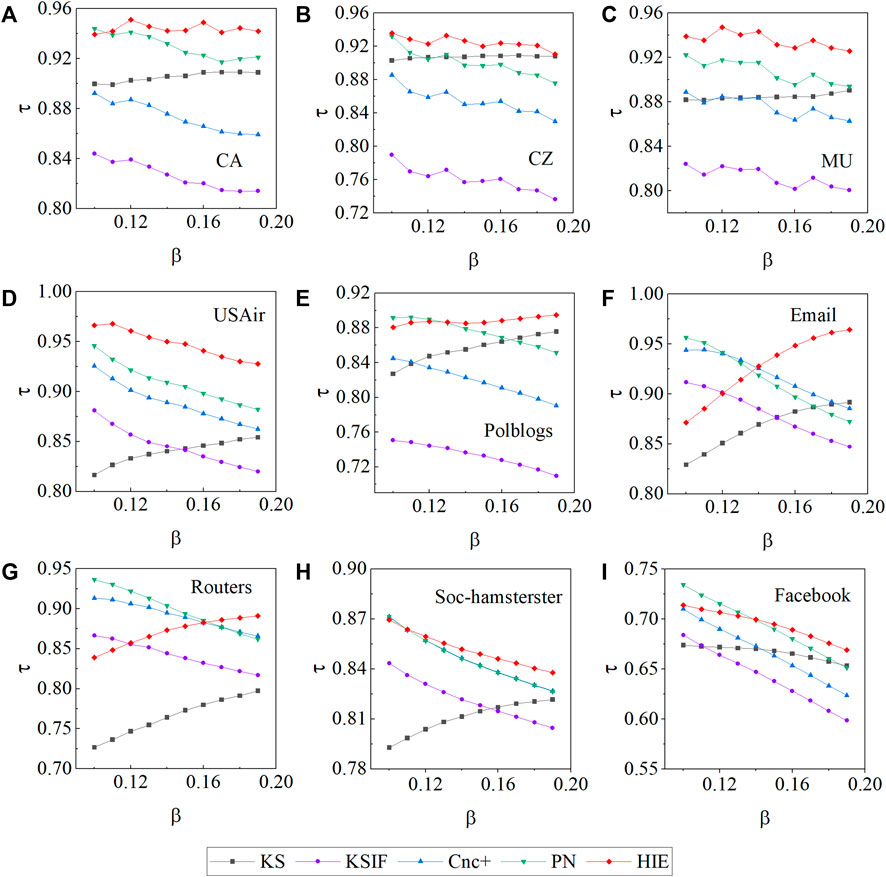
FIGURE 3. The Kendall’s tau τ is calculated in the nine networks using five distinct methods. The propagation rates β vary between 0.1 and 0.19 in all of the different networks.
Using the imprecision function for experimental validation, we will further verify the HIE method’s accuracy. The imprecision function predicts that if a key node identification method determines the node ranking more precisely, the value of the imprecision function provided by the method will be lower and nearer to 0. To get the corresponding value of the imprecision function, we shall rank the four comparison approaches and the HIE method in nine different networks. The range of p-values was set at 0.1 to 0.3 in our research, which compared the nodes in the top 10% to 30% of the various rankings. In addition, we set β = 0.15 and μ = 1 in this experiment. Our experiment results are shown in Figure 4. With the exception of the Facebook network, our method works well on the other eight networks. In the CA, CZ, MU, and Router networks, the KSIF method performs the worst. When the p-value is between 0.1 and 0.2, the KSIF performs better than the KS in the USAir and Polblogs networks. The KS method performs better when the p-value is greater than 0.2. The KS method does not perform well in the Email networks. In conclusion, the HIE method performs better overall than other methods, while the KSIF and KS methods perform rather poorly. As a result, the experimental data analysis discussed previously demonstrates that the HIE method has efficacy and accuracy in terms of node ranking accuracy.
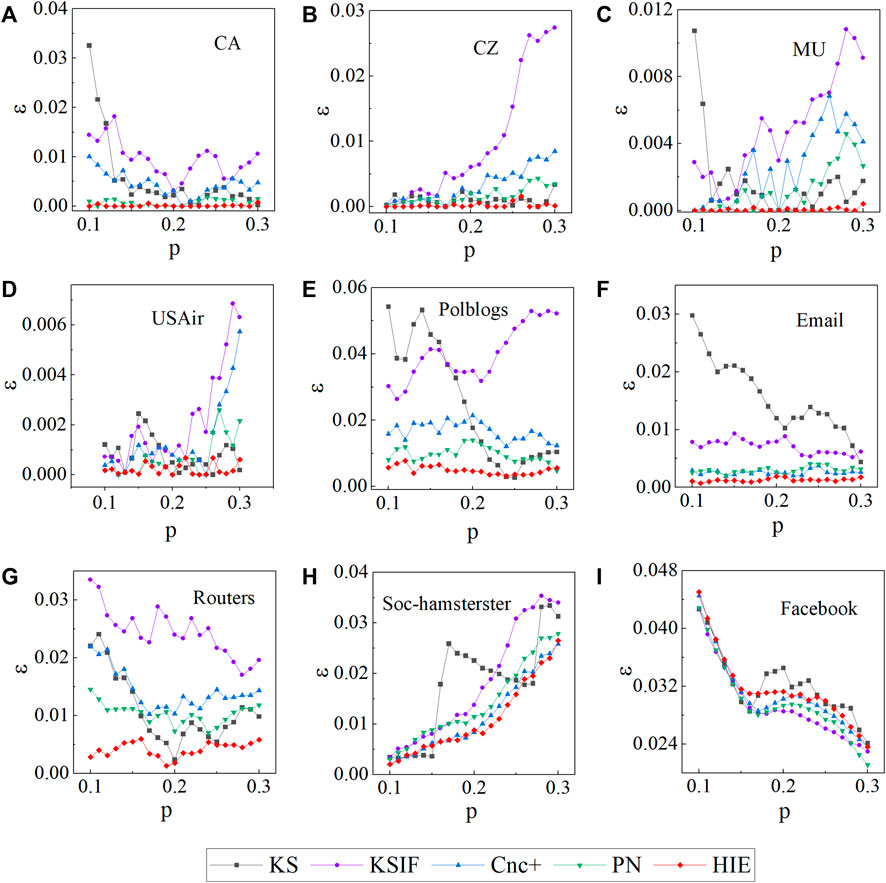
FIGURE 4. The imprecision function ɛ(p) values are generated by different methods when the probability p changes in different networks.
4 Discussions and conclusion
We propose a hybrid influence method based on information entropy, and our method takes into account both node position attributes and propagation attributes. First, the number of iterations is utilized to distinguish nodes with the same ks value. The position metric is obtained using the value of the sigmoid function. The influence of the node on the network structure is then determined by calculating the difference in the propagation threshold between the network before and after node deletion. This yields the node’s propagation attribute. Then, the two properties are combined, and the information entropy weighting method is utilized to quantify the influence of each node in the network under this complete analysis. To determine the nodes’ ultimate influence ranking, the first-order neighbors of the nodes are taken into account and examined.
We conducted a series of related validation experiments to confirm the validity and accuracy of our suggested method. Using the complementary cumulative distribution function, we first assess the efficiency of the suggested method for achieving node differentiation. The experimental findings demonstrate the effectiveness of the HIE method in achieving a more precise node distinction. Then, to confirm the applicability and precision of the suggested method, we employed Kendall’s correlation coefficient and the imprecision function. According to the results of both experiments, the HIE method performs better overall and produces a higher Kendall’s coefficient and lower imprecision function values than a number of other comparable methods. The structure of complex networks is continuously evolving, and in the future, we are going to keep investigating the current method in order to adapt it to multilayer networks or temporal networks by enhancing it.
Data availability statement
The original contributions presented in the study are included in the article/Supplementary Material. Further inquiries can be directed to the corresponding author.
Author contributions
LinZ: conceptualization, formal analysis, funding acquisition, methodology, project administration, supervision, and writing–review and editing. XG: conceptualization, data curation, methodology, visualization, and writing–original draft. LiaZ: formal analysis, investigation, and writing–review and editing. LZ: data curation, visualization, and writing–review and editing. PC: methodology and writing–review and editing. HY: visualization and writing–review and editing. JH: funding acquisition, project administration, and writing–review and editing. WP: funding acquisition, project administration, and writing–review and editing.
Funding
The authors declare financial support was received for the research, authorship, and/or publication of this article. This research was supported by the National Natural Science Foundation of China (No. 72201268), Natural Science Foundation of Sichuan Province (No. 2022NSFSC1902), the Safety Foundation of CAAC (Nos. AQ20200019, AQ20210091, and AQ20210019), and the Foundation of CAFUC (No. J2021-072).
Conflict of interest
LinZ was employed by Chengdu GoldTel Industry Group Co., Ltd.
The remaining authors declare that the research was conducted in the absence of any commercial or financial relationships that could be construed as a potential conflict of interest.
Publisher’s note
All claims expressed in this article are solely those of the authors and do not necessarily represent those of their affiliated organizations, or those of the publisher, the editors, and the reviewers. Any product that may be evaluated in this article, or claim that may be made by its manufacturer, is not guaranteed or endorsed by the publisher.
References
1. Li X, Guo J, Gao C, Zhang L, Zhang Z. A hybrid strategy for network immunization. Chaos, Solitons & Fractals (2018) 106:214–9. doi:10.1016/j.chaos.2017.11.029
2. Wei X, Zhao J, Liu S, Wang Y. Identifying influential spreaders in complex networks for disease spread and control. Scientific Rep (2022) 12:5550. doi:10.1038/s41598-022-09341-3
3. Wang S, Dong Q, Zhang J, Sun J, Gu X, Chen C. Robustness assessment of power network with renewable energy. Electric Power Syst Res (2023) 217:109138. doi:10.1016/j.epsr.2023.109138
4. Wang S, Sun J, Zhang J, Dong Q, Gu X, Chen C. Attack-defense game analysis of critical infrastructure network based on cournot model with fixed operating nodes. Int J Crit Infrastructure Prot (2023) 40:100583. doi:10.1016/j.ijcip.2022.100583
5. Bamakan SMH, Nurgaliev I, Qu Q. Opinion leader detection: A methodological review. Expert Syst Appl (2019) 115:200–22. doi:10.1016/j.eswa.2018.07.069
6. Malliaros FD, Rossi M-EG, Vazirgiannis M. Locating influential nodes in complex networks. Scientific Rep (2016) 6:19307. doi:10.1038/srep19307
7. Jia T, Qin K, Shan J. An exploratory analysis on the evolution of the us airport network. Physica A: Stat Mech its Appl (2014) 413:266–79. doi:10.1016/j.physa.2014.06.067
8. Lin J-H, Primicerio K, Squartini T, Decker C, Tessone CJ. Lightning network: A second path towards centralisation of the bitcoin economy. New J Phys (2020) 22:083022. doi:10.1088/1367-2630/aba062
9. Wang S, Gu X, Chen J, Chen C, Huang X. Robustness improvement strategy of cyber-physical systems with weak interdependency. Reliability Eng Syst Saf (2023) 229:108837. doi:10.1016/j.ress.2022.108837
10. Lin J-H, Marchese E, Tessone CJ, Squartini T. The weighted bitcoin lightning network. Chaos, Solitons & Fractals (2022) 164:112620. doi:10.1016/j.chaos.2022.112620
11. Bonacich P. Factoring and weighting approaches to status scores and clique identification. J Math Sociol (1972) 2:113–20. doi:10.1080/0022250x.1972.9989806
12. Freeman LC. A set of measures of centrality based on betweenness. Sociometry (1977) 40:35–41. doi:10.2307/3033543
13. Sabidussi G. The centrality index of a graph. Psychometrika (1966) 31:581–603. doi:10.1007/bf02289527
14. Kitsak M, Gallos LK, Havlin S, Liljeros F, Muchnik L, Stanley HE, et al. Identification of influential spreaders in complex networks. Nat Phys (2010) 6:888–93. doi:10.1038/nphys1746
15. Barabási A-L, Albert R. Emergence of scaling in random networks. science (1999) 286:509–12. doi:10.1126/science.286.5439.509
16. Zeng A, Hu Y, Di Z. Optimal tree for both synchronizability and converging time. Europhysics Lett (2009) 87:48002. doi:10.1209/0295-5075/87/48002
17. Garas A, Schweitzer F, Havlin S. A k-shell decomposition method for weighted networks. New J Phys (2012) 14:083030. doi:10.1088/1367-2630/14/8/083030
18. Maji G, Mandal S, Sen S. A systematic survey on influential spreaders identification in complex networks with a focus on k-shell based techniques. Expert Syst Appl (2020) 161:113681. doi:10.1016/j.eswa.2020.113681
19. Maji G, Namtirtha A, Dutta A, Malta MC. Influential spreaders identification in complex networks with improved k-shell hybrid method. Expert Syst Appl (2020) 144:113092. doi:10.1016/j.eswa.2019.113092
20. Ahajjam S, Badir H. Identification of influential spreaders in complex networks using hybridrank algorithm. Scientific Rep (2018) 8:11932. doi:10.1038/s41598-018-30310-2
21. Namtirtha A, Dutta A, Dutta B. Identifying influential spreaders in complex networks based on kshell hybrid method. Physica A: Stat Mech its Appl (2018) 499:310–24. doi:10.1016/j.physa.2018.02.016
22. Wang X, Yang Q, Liu M, Ma X. Comprehensive influence of topological location and neighbor information on identifying influential nodes in complex networks. Plos one (2021) 16:e0251208. doi:10.1371/journal.pone.0251208
23. Liu Z, Jiang C, Wang J, Yu H. The node importance in actual complex networks based on a multi-attribute ranking method. Knowledge-Based Syst (2015) 84:56–66. doi:10.1016/j.knosys.2015.03.026
24. Zeng A, Zhang C-J. Ranking spreaders by decomposing complex networks. Phys Lett A (2013) 377:1031–5. doi:10.1016/j.physleta.2013.02.039
25. Bae J, Kim S. Identifying and ranking influential spreaders in complex networks by neighborhood coreness. Physica A: Stat Mech its Appl (2014) 395:549–59. doi:10.1016/j.physa.2013.10.047
26. Liu J-G, Ren Z-M, Guo Q. Ranking the spreading influence in complex networks. Physica A: Stat Mech its Appl (2013) 392:4154–9. doi:10.1016/j.physa.2013.04.037
27. Ma L-l., Ma C, Zhang H-F, Wang B-H. Identifying influential spreaders in complex networks based on gravity formula. Physica A: Stat Mech its Appl (2016) 451:205–12. doi:10.1016/j.physa.2015.12.162
28. Wang Z, Zhao Y, Xi J, Du C. Fast ranking influential nodes in complex networks using a k-shell iteration factor. Physica A: Stat Mech its Appl (2016) 461:171–81. doi:10.1016/j.physa.2016.05.048
29. Zhao N, Bao J, Chen N. Ranking influential nodes in complex networks with information entropy method. Complexity (2020) 2020:1–15. doi:10.1155/2020/5903798
30. Morone F, Makse HA. Influence maximization in complex networks through optimal percolation. Nature (2015) 524:65–8. doi:10.1038/nature14604
31. Radicchi F, Castellano C. Fundamental difference between superblockers and superspreaders in networks. Phys Rev E (2017) 95:012318. doi:10.1103/physreve.95.012318
32. Zhong L-F, Liu Q-H, Wang W, Cai S-M. Comprehensive influence of local and global characteristics on identifying the influential nodes. Physica A: Stat Mech Its Appl (2018) 511:78–84. doi:10.1016/j.physa.2018.07.031
33. Barrat A, Barthelemy M, Vespignani A. Dynamical processes on complex networks. Cambridge: Cambridge University Press (2008).
34. Newman ME. Spread of epidemic disease on networks. Phys Rev E (2002) 66:016128. doi:10.1103/physreve.66.016128
36. Wang Z, Du C, Fan J, Xing Y. Ranking influential nodes in social networks based on node position and neighborhood. Neurocomputing (2017) 260:466–77. doi:10.1016/j.neucom.2017.04.064
Keywords: complex network, key nodes, information entropy, epidemic threshold, SIR
Citation: Zhong L, Gao X, Zhao L, Zhang L, Chen P, Yang H, Huang J and Pan W (2023) A hybrid influence method based on information entropy to identify the key nodes. Front. Phys. 11:1280537. doi: 10.3389/fphy.2023.1280537
Received: 20 August 2023; Accepted: 11 September 2023;
Published: 26 September 2023.
Edited by:
Xiaoke Xu, Dalian Nationalities University, ChinaReviewed by:
Jianhong Lin, University of Zurich, SwitzerlandShuliang Wang, Jiangsu Normal University, China
Copyright © 2023 Zhong, Gao, Zhao, Zhang, Chen, Yang, Huang and Pan. This is an open-access article distributed under the terms of the Creative Commons Attribution License (CC BY). The use, distribution or reproduction in other forums is permitted, provided the original author(s) and the copyright owner(s) are credited and that the original publication in this journal is cited, in accordance with accepted academic practice. No use, distribution or reproduction is permitted which does not comply with these terms.
*Correspondence: Linfeng Zhong, Z29vZ2xlemxmQDE2My5jb20=