 Kai Shi
 Li Nie
- 1School of Economics and Management, Northeast Normal University, Changchun, China
- 2School of Business and Management, Jilin University, Changchun, China
Within a generalized vector autoregressive framework comprising 22 country-level economic policy uncertainty indices, this study used a 12-period-ahead forecast error variance decomposition to compute spillovers. The results showed that although it has been in a downtrend since the third quarter of 2016, the overall spillover among the major economies remains high. Net spillover analyses in either the full or rolling samples illustrated that Singapore was the most decisive transmitter of spillovers, followed by Japan. Meanwhile, Ireland, the Netherlands, Russia, Brazil, Colombia, Italy, and Mexico were clear receivers of net spillover. After reorganizing the net pairwise spillovers into a directed weighted network, the core–periphery structure and backbone were extracted, and the diffusion centrality was calculated to ascertain the key player. Regardless of using the full or rolling samples, Singapore played an influential role in the diffusion network of global economic policy uncertainty.
1 Introduction
Since Klößner and Sekkel [1] confirmed the existence of cross-country spillover among economic policy uncertainties (EPU), scholars have made many efforts to investigate the potential determinants of spillover effects [2,3], spillovers between EPU and global markets [4,5], financial stress [6], and macroeconomic activity [7–9]. An extensive literature has also empirically analyzed spillovers between EPU and different asset categories, especially for stocks [10–16], crude oil [17–19], foreign exchange [20], and Bitcoin [21].
Recently, scholars have explored the links among the EPUs of major economies. Gupta et al. [22] employ the Bayesian Additive Regression Trees (BART) algorithm to analyze international uncertainty spillover and confirm EPU in Canada is linked to EPU in seven other countries. Antonakakis et al. [23] reveal a significant uncertainty transmission from the European Union to the United States, and that EPU changes in the long run tend to be related to external uncertainty. Gabauer and Gupta [24] investigate spillovers between categorical EPUs in the United States and Japan based on a time-varying parameter vector autoregression model (TVP-VAR). The authors find that monetary policy uncertainty is the main driving force, followed by uncertainties related to fiscal, currency market, and trade policies. Bai et al. [25] analyze EPU spillovers among major economies in the time and frequency domains. The authors show that the EPU of the United States dominates others because the United States is both a major risk spillover contributor and receiver among major economies. Gupta and Sun [26] find that for the BRICS bloc, incorporating the EPUs of other countries is conducive to increasing the forecast gains.
As globalization deepens, the economic policy making by national governments is increasingly connected to each other and forms a giant global information diffusion network. In an open world, no nation’s economic policymaking is truly independent of the others. Then, how do country-specific EPUs connect with each other and form a global network? Jiang et al. [3] propose three underlying EPU spillover channels. The first channel is the rational expectation channel. With domestic and foreign EPUs, microeconomic entities would not only postpone their investments and consumption but also adjust their global portfolios. The relative change in these behaviors becomes an important source of economic fluctuation. To alleviate these disturbances, authorities are inclined to take necessary measures which actually cause the cross-border transmission of EPU. The second channel is the transmission of foreign exchange rates and international trade. Foreign exchange rate volatility causes the cross-border flow of capital and a change in the terms of trade. This can adversely affect the balance of payments. The authorities may thus dynamically modify their original external economic policies, which would also cause the cross-border transmission of EPU. The third possible channel is financial markets. Financial market stability has become one of the targets of monetary policy decisions. Extensive empirical evidence supports the existence of spillovers between foreign EPUs and domestic financial markets, thereby enabling the cross-border transmission of EPU.
Among other studies, Kang and Yoon [27] explore the net pairwise directional network across nine EPU indices in four different regimes and show that the Chinese EPU is an important contributor to the connectedness of the uncertainty network. Marfatia et al. [28] build a centrality network using the minimal spanning tree (MST) and a dependency network using partial correlations to identify the interdependence among global EPUs. Overall, although existing evidence implies strong links between EPUs across countries, little effort has been made to investigate the structure of the global EPU network. To the best of our knowledge, no study has attempted to identify the key player according to their importance in the global information diffusion network. Understanding this is important to achieve global economic stability and policy coordination.
We fill this gap by revisiting global EPU spillovers from the perspectives of network topology and information diffusion. We explore the overall spillover dynamics and net spillover distributions, and the net pairwise spillover structures to identify the key player in the global EPU diffusion network.
The most prominent findings are as follows: First, spillovers among the EPUs of major countries were important, with over 90% of the forecast variance in the full-sample analysis coming from spillovers. Although the rolling sample results illustrated that the overall spillover has been declining since the third quarter of 2016, nearly 70% of the forecast variance could still be attributed to spillovers at the end of 2019. In terms of the full-sample net spillovers, Singapore emerged as the influential transmitter. Further, spillovers were mainly transmitted from developed industrial countries to emerging markets.
Second, the full-sample pairwise spillover network showed that the distribution of all countries’ EPUs in the network were relatively even; 15 EPUs, excluding those of Brazil, Chile, India, Korea, Italy, Ireland, and France, are in the core of the net pairwise spillover network. A star-type sub-network centered on the EPU of Singapore comprising many influential economic entities, such as the United States, Germany, and China, and an extended circular sub-structure was identified in the backbone. Notably, Singapore and Russia were the two key information diffusion centers in the full-sample pairwise spillover network.
Third, the rolling sample results showed that Singapore and Japan were two decisive transmitters of net spillovers. Meanwhile, Brazil, Colombia, Ireland, Italy, Mexico, the Netherlands, and Russia were clear receivers of net spillover. Singapore was identified as one of the two key players in 52 out of 84 rolling sample analyses of the global EPU diffusion network. Since 2016, Singapore has been steadily identified as the dominant key player. Together, this evidence demonstrates that Singapore acts as the key player at the core of the global EPU information diffusion network.
Our study contributes to the literature by exploring pairwise spillovers in the global EPU system from the perspectives of network topology structure and graph theory. We obtained the core–periphery structure and backbone of the global EPU network, and calculated diffusion centrality to identify the key player in the information diffusion network. To the best of our knowledge, this is the first attempt to identify the influential player through a more scientific method and not simply via a numerical comparison.
The rest of our work proceeds as follows: Section 2 first introduces the data and then describes methods to measure spillovers, extract the core-periphery structure and backbone, and calculate the diffusion centrality. Section 3 reports the empirical results of both the full and rolling sample analyses. Section 4 discusses the implications. Section 5 provides a brief conclusion.
2 Materials and methods
2.1 Data
To measure EPU, we relied on the EPU indices constructed by Baker et al. [29] based on data mining of newspaper articles pertaining to the economy (E), policy (P), and uncertainty (U). We collected all 23 group monthly data from the beginning of 1985 to the end of 2019 including the Global EPU (GEPU_ppp) index, which is a GDP-weighted average of national EPU indices for 21 countries, from the website, http://www.policyuncertainty.com/index.html.
Figure 1 shows box and violin plots of the logarithms of all EPUs. In terms of averages, Mexico had the lowest average EPU of 4.09, while the United Kingdom had the average of 5.2. China and France also possessed high EPU averages over 5.0. By volatility, Sweden had the smallest standard deviation (0.21) and fluctuation range (1.07). Meanwhile, China and Mexico respectively had the largest standard deviation (0.80) and fluctuation range (3.92), respectively. In terms of skewness, the EPU indices of 11 countries (Canada, Colombia, France, Germany, Greece, Ireland, Italy, Russia, Sweden, the United Kingdom, and the United States) were left-skewed while the other 11 countries (Australia, Brazil, Chile, China, India, Japan, Korea, Mexico, Netherlands, Spain, and Singapore) were right-skewed. Compared to the normal distribution, the EPUs of six countries–Brazil, Greece, Ireland, Italy, Korea, and Mexico–exhibited sharp peaks. In general, the EPU of China had high fluctuations as well as a large average value; thus, it was deemed to be the source of world economic uncertainty.
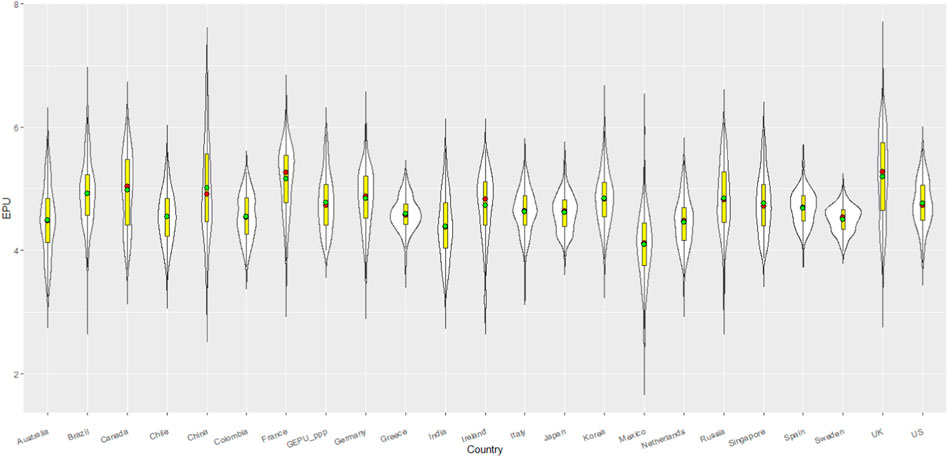
FIGURE 1. Descriptive statistics of all EPU Indices. The red and green dots in box plot represent the median and the mean, respectively.
Figure 2 presents the Pearson correlation coefficients among all EPUs. Remarkably, the overwhelming majority of correlations among EPUs were statistically significant, except Mexico’s EPU which illustrated some independence from others. In magnitude, the strength of correlations between EPUs of individual countries and GEPU_ppp showed prominent differences. Specifically, the pairwise correlations between GEPU_ppp and EPUs of Singapore, China, Canada, the United Kingdom, the United States, and Germany all exceeded 0.8. The correlations between GEPU_ppp and EPUs of France, Korea, Colombia, Japan, Sweden, Australia, Chile, and Spain lied between 0.6 and 0.8. Those for Russia, Ireland, Brazil, and Italy were between 0.4 and 0.6; Greece, India, and Netherlands stayed between 0.2 and 0.4; and Mexico did not exceed 0.2. On average, the correlations between the EPUs of Mexico and other countries were the weakest and merely 0.07 in magnitude. Correlations among GEPU_ppp, Canada, Singapore, the United Kingdom, and the United States all exceeded 0.6. Finally, the EPUs of Brazil, Greece, India, Netherlands, and Russia were only weakly correlated. From the perspective of correlations, the EPU of Mexico was distinct.
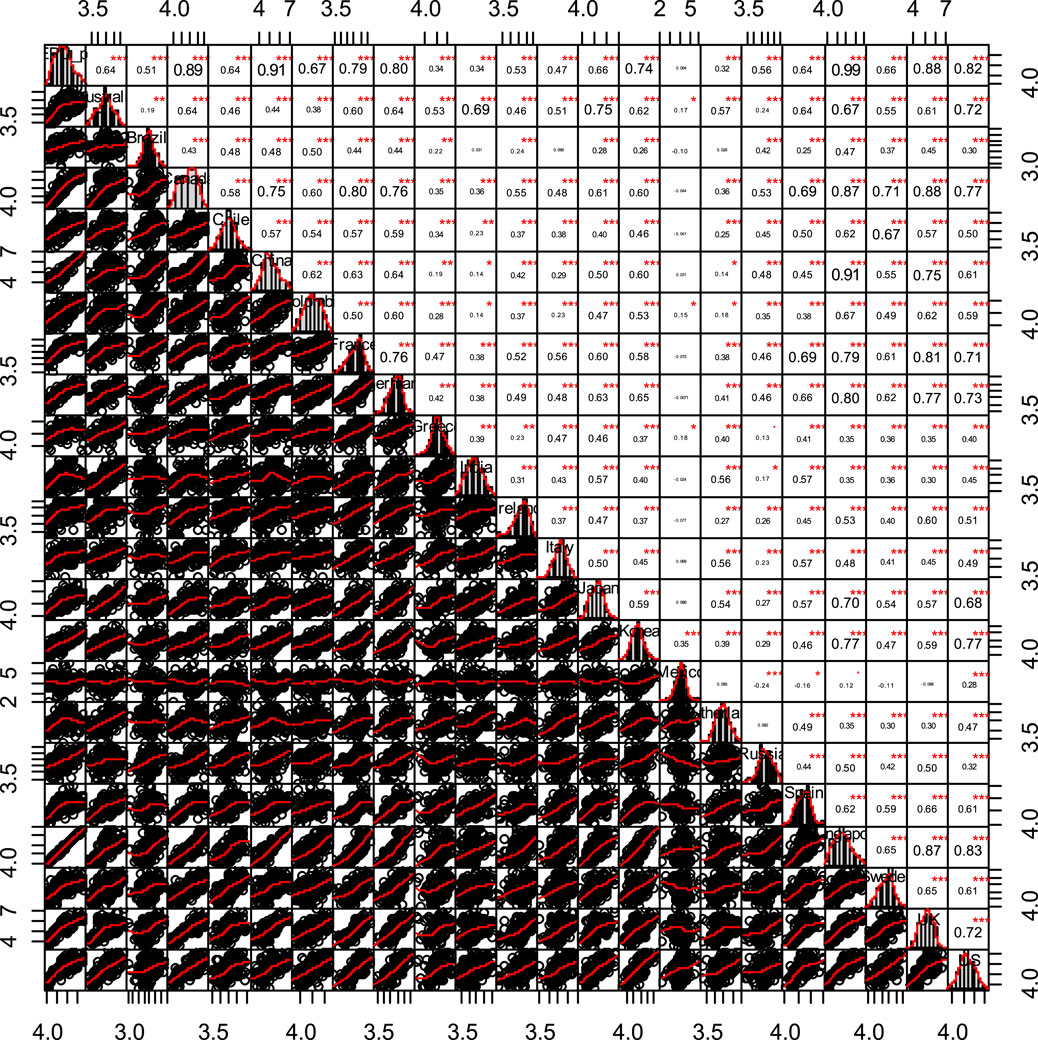
FIGURE 2. Correlogram of all EPU indices.
Visually, the EPUs showed meaningful correlations. However, a higher contemporaneous correlation does not necessarily indicate connectedness in the sense that the literature attempts to measure it.
2.2 Methodology
2.2.1 Measuring spillovers
Consider a multivariable covariance stationary process described by the vector autoregression model with p lags (VAR(p) model) whose roots of the matrix lag-polynomial |B(z)| lie outside the unit circle (Eq. 1):
where Yt denotes the EPU indices for all 22 countries at time t = 1, 2,
where ψ(L) = [B(L)]−1.
Within the generalized VAR framework of Koop et al. [30] and Pesaran and Shin [31], the H-step-ahead forecasting error variance decompositions denoted as θij(H) (Eq. 3) can be represented as:
where Σ is the variance-covariance matrix of error vector ε; σjj is the standard deviation of the error term in the jth equation; and ei is the selection vector, in which the ith element equals 1 and others equals 0.
To calculate the spillover index, following Diebold and Yilmaz’s [32] methodology, each entry in the variance decomposition matrix was normalized by the row sum as follows:
Based on Eq. 4, the total spillover index (Eq. 5) can be constructed as:
For the EPU of country i which receives spillovers from the EPU of country j, the directional spillover (Eq. 6) can be written as:
Analogously, the spillover transmitted from the EPU of country i to that of country j (Eq. 7) is:
Furthermore, the directional spillovers transmitted from the EPUs of other countries to the EPU of country j, and the spillovers transmitted from the EPU of country j to the EPUs of other countries (Eqs 8, 9) are respectively calculated as follows:
Then, the net and net pairwise spillovers (Eqs 10, 11) can be respectively obtained as follows:
2.2.2 Identifying the rich-core in net pairwise spillover network
As one of the key meso-scale structures in complex networks, a core/periphery structure is often observed in many networks. In this structure, the core refers to a group of central and densely connected nodes governing the overall behavior (flows, impact adaptability, flexibility, controllability, etc.) of a network. To discriminate the two-class partition in the EPU spillover network without relying on traditional subjective fine-tuning, we used the rich-core method, which theoretically couples the underlying principle of a rich club with the escape time of a random walker. The persistence probability of cluster Sc related to the escape time (Eq. 12) is:
where πi denotes the probability a random walker in node i, and mij refers to the probability of a random walker moving from node i to node j. The core boundary can be determined by locating the point at which the transition of the different persistence probabilities accelerates.
To determine the core of the net pairwise spillover network, we followed the standard procedure proposed by Ma and Mondragón [33] as follows:
a. Rank nodes in the decreasing order of their weight;
b. Evaluate the number of links k+ between the node with rank r and nodes with rank r'<r; and
c. Find the boundary of the core, defined by node r* where kr*+>kr+ for all r > r*.
2.2.3 Extracting the backbone of pairwise spillover network using multi-scale reduction algorithm
To extract the backbone of the net pairwise spillover network, we introduced a measure of the fluctuations in the weights attached to a node. The weights of edge-linking node i with its neighbor j (Eq. 13) can be normalized as follows:
where si represents the strength of node i and ωij denotes the weight of connections between i and j. By introducing the disparity function defined in Serrano et al. [34], we can distinguish that a few edges carried a disproportionate fraction of the node’s strength while the remaining edges carried only a small fraction. Regarding extracting the backbone, we were typically interested in identifying all edges with weights accounting for a significant fraction of the local strength and the weight magnitude of each given node. In this logic, introducing a null model that defines the relevant part of the signal owing to the specific and relevant organizing principles of the network structure is vital. Serrano et al. [34] propose such a null model and deduce its statistical properties. Then, the connections for every node belonging to the backbone with statistical significance can be extracted.
2.2.4 Calculating the diffusion centrality
Centrality is a fundamental network property that ranks the nodes based on their structural importance. Banerjee et al. [35] propose a new centrality measure, namely, diffusion centrality, to depict how “central” the nodes are in their social network with regard to spreading information. Diffusion centrality (Eq. 14) is defined as the row sum of the following matrix:
where q represents the passing probability in a probability matrix, in which each cell measures the probability that node i reaches node j, and g refers to the adjacency matrix. Each element in S measures the aggregate propensity that i reaches j in T iterations. Each row sum of matrix S reveals the importance of a node in disseminating information.
3 Results
To mitigate the heterogeneity in raw data, we used the logarithms of all 22 national EPU indices to build a generalized VAR model. Table 1 illustrated that for all country-level EPUs the null hypotheses of non-stationarity were rejected at 1% significance level.
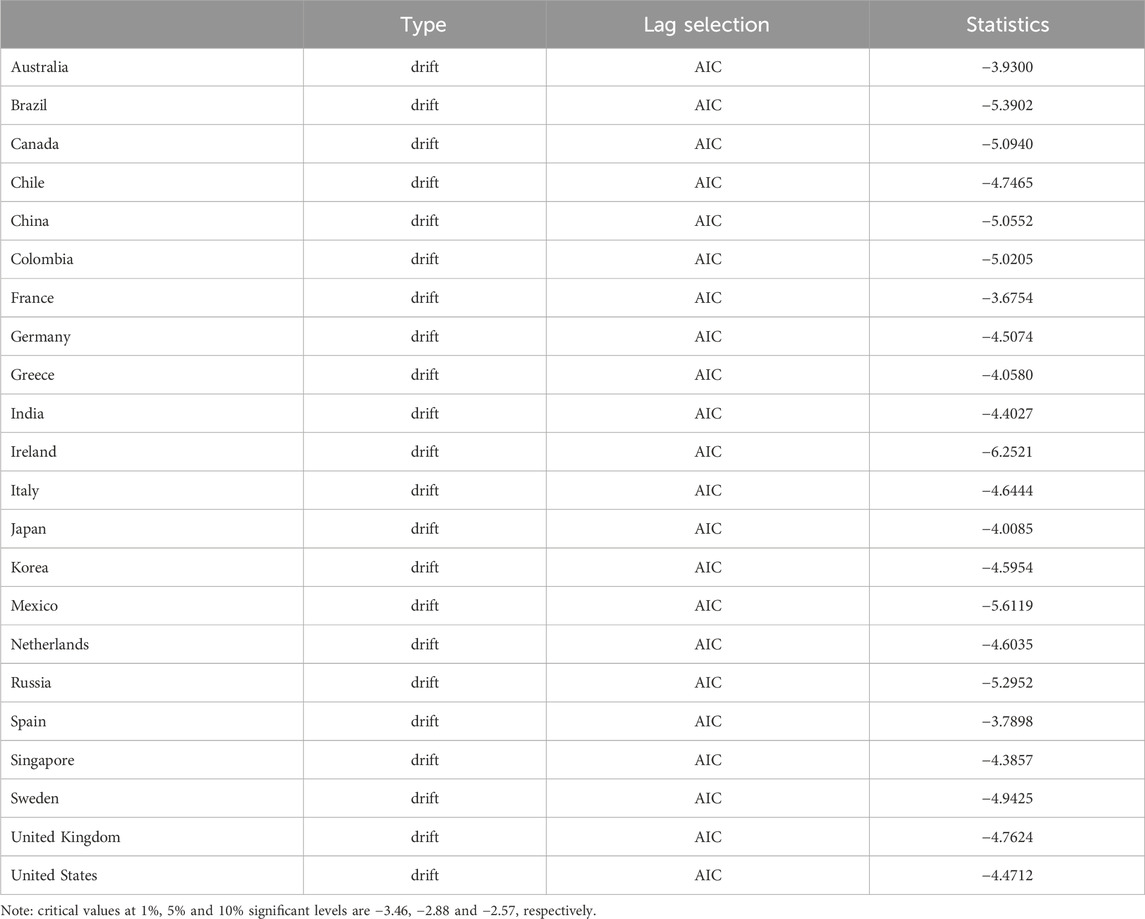
TABLE 1. Unit-root tests for country-level EPUs.
The Schwarz Information Criterion was used to determine the optimal lag within the maximum length of eight. The 12-period-ahead forecast error variance was employed to calculate the spillover indices. As a robustness check, we also tried different forecast horizons and found that spillover indices fluctuated in a very narrow range surrounding the result we reported, which is consistent with the sensitivity analysis in Diebold and Yilmaz [32].
3.1 Full sample analysis
The full sample overall spillover was 93.19%, indicating that more than 90% of the forecast variance comes from spillovers. This result confirms the importance of analyzing information transmission and diffusion in the global network of EPUs.
Figure 3 displays the full-sample net spillovers of all countries’ EPUs. Notably, Singapore had the largest positive net spillover, thus emerging as an important transmitter. The net spillovers of Ireland, the Netherlands, Russia, Brazil, Colombia, Italy, Mexico, India, China, Chile, Spain, Germany, and Korea were negative, indicating that they are receivers of net spillovers. The net spillovers of Greece, Sweden, the United States, France, Australia, the United Kingdom, Canada, and Japan were positive, indicating that they are transmitters of net spillovers. Visually, a linear relationship among the net spillovers of all countries, except Singapore, can be observed. However, the magnitude of the full-sample net spillover effect was not linearly correlated with the economic strength of each country. Comparatively, the result of the full-sample net spillover seems to support the traditional two-class partition of developed versus developing countries: spillovers of policy uncertainties were mainly transmitted from developed industrial countries to emerging markets. Interestingly, the EPU of the United States barely exhibited characteristics as a transmitter, with its net spillover effect being very limited compared to its economic strength.
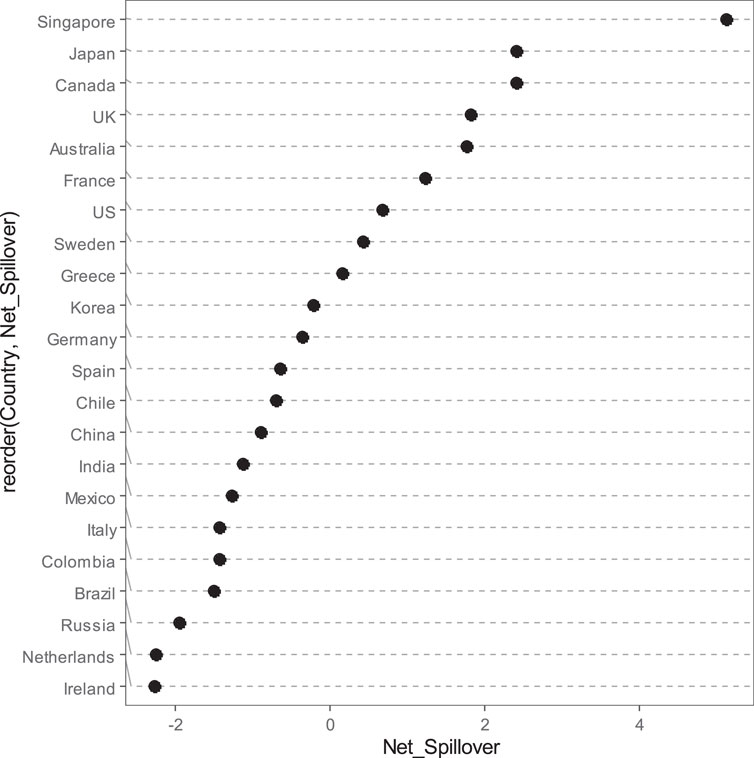
FIGURE 3. Net spillovers of full-sample among all countries EPUs.
Further, 231 net pairwise spillovers were obtained in the full-sample analysis. However, theoretically, it is a very hard task and barely impossible to identify the most influential players in such a tedious system. Fortunately, graph theory and network analysis techniques are suitable for this task. Taking each country as a node and net pairwise spillovers as links between different nodes, a directed and weighted network comprising 22 vertices and 231 edges was built. Each country constituted one vertex. The sign of pairwise spillovers pointed the direction of net spillover between two vertices, while the magnitude of pairwise spillovers reflected the strength of the edge connecting two vertices.
Figure 4 illustrates the network topology graph of the full-sample pairwise spillover. The diameter of full sample pairwise spillover network was 0.11, which shows that it is a typical “small world” and the transmission of EPUs is easy.
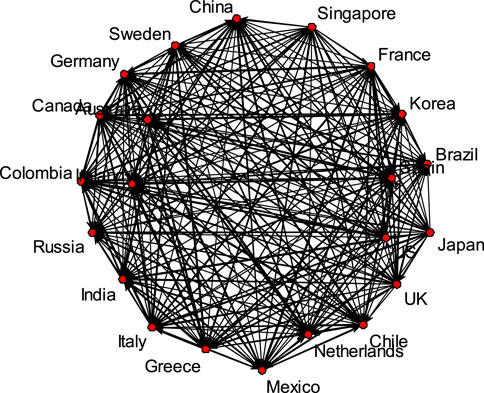
FIGURE 4. Network topology graph of full-sample pairwise spillover.
Before identifying the key player in the global EPU network, we first identified the core-periphery structure of the pairwise spillover network.
Figure 5 and Table 2 respectively showed the identified core-periphery structure and relevant calculations based on the rich-core methodology. In Figure 5, purple vertices and green vertices respectively referred to the core and periphery structures of full sample pairwise spillover. The core of pairwise spillover network was comprised of 15 countries who governed the overall behavior of global EPU network. Seven nodes, including two American countries (Brazil and Chile), two Asian countries (India and Korea) and three European countries (Italy, Ireland, and France) were discriminated as lying in the periphery structure of pairwise spillover network. The relative core size was 15/22 ≈ 0.6818, which is higher than other real networks and implies that the EPUs network is not only more flexible and adaptable to changes but also hard to be controllable [36]. The highest ranked nodes in the core (Greece, Japan, Mexico and Singapore) confirmed the diffusion of economic policy uncertainty not only among different regions and continents but also between developed and emerging markets. In the context of global economic opening and cooperation, it is hard for any country to stand aloof when making her own policies. Logically, influential players should arise from the core of pairwise spillover network.
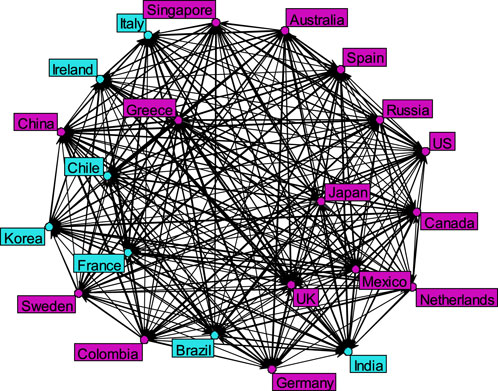
FIGURE 5. Core-periphery structure with strong ties above the average. The purple and green vertices refer to the core and periphery structures of full-sample pairwise spillover, respectively.
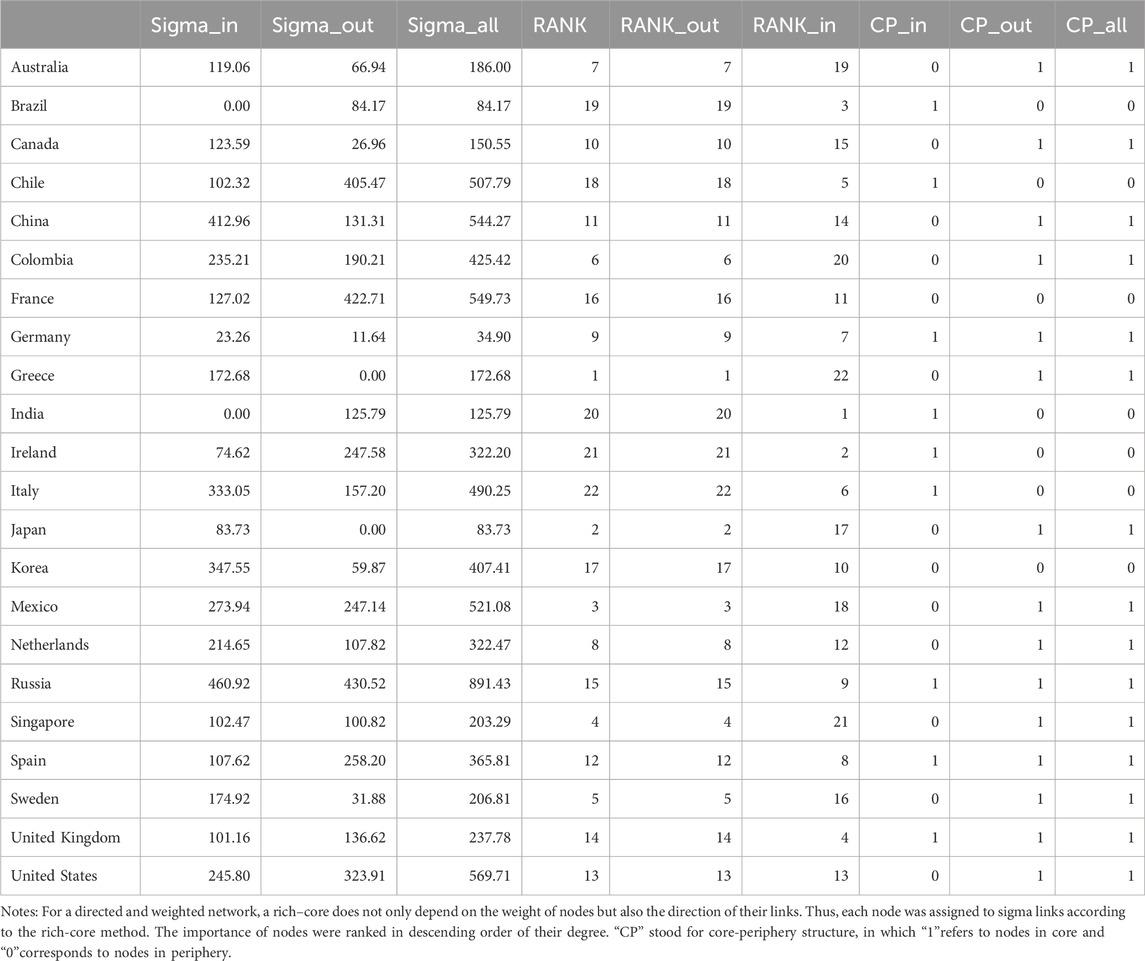
TABLE 2. Identified rich-core in global EPU network.
Next, the filtering method proposed by Serrano et al. [34] was utilized to extract the backbone of the pairwise spillover network. Figure 6 shows the backbone of the full-sample pairwise spillover network at the 5% significance level. We took the left lower part in Figure 6 as a star-type sub-network and the right lower part as an extended circular sub-structure, respectively. The star-type sub-network involved many influential countries with significant economic power throughout Europe (Germany), America (the United States, Colombia, and Mexico), and Asia (China and South Korea). In the star-type sub-network, Singapore was vital for ensuring network functioning and played an important role as the central player which was connected to other nodes. Without Singapore, the fundamental network links would lose, which illustrates that Singapore is important. In addition, Japan, Italy, the Netherlands, and Australia together with India, formed an extended circle. Japan and Australia were two key nodes in maintaining this circle steady and functioning. Based on all evidences, Singapore, Japan, and Australia all have potentials to be key players of global EPU network.
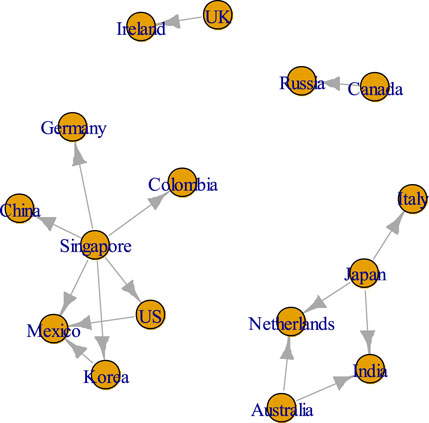
FIGURE 6. The backbone of full-sample pairwise spillover network. This disparity backbone includes entirely the top 5% of the heaviest edges.
Who is the most influential player in the global EPU diffusion network? Which country’s EPU change influences others the most? The answer to these questions is equivalent to how to useful information can be implanted into social networks to benefit the maximum number of people. If we could successfully locate the key player, some targeted intervention mechanisms could be established in the future to reduce the uncertainty of global economic policies. Therefore, we must revisit every single node from the perspective of information diffusion, but not traditional degree centrality or closeness centrality. The information diffusion model provides a new centrality measure of the effectiveness of alternative injection points, and differs from standard centrality measures and even performs better.
To locate the key player, we calculated the diffusion centrality, as defined by Banerjee et al. [35]. Two key players were identified: Russia and Singapore. These two countries are located at the centrality of the full-sample pairwise spillover network from the perspective of information diffusion. Together with the analysis of the core-periphery structure and backbone, the results imply that Singapore is located in the key position of the global EPU diffusion network.
3.2 Rolling sample analyses
Considering the many changes which occurred during our sample interval, full sample results as “average” spillover behavior are likely to miss potential important secular and cyclical movements. Thus, a rolling window size of 120-month was built to calculate varying spillover dynamics. Choosing this window is a trade-off between degree of freedom and forecast horizon. We also tried different rolling window sizes within a meaningful range, and no significant differences were found; thus, the empirical results were robust. In large systems, small sample bias may occur; hence, we used a parametric bootstrap, as suggested by Engsted and Pedersen [37], to obtain unbiased estimates of connectedness measures.
Figure 7 illustrates the overall spillover dynamics of the rolling sample. Three segmented trends appeared: from December 2012 to September 2013, the overall spillover dynamic declined from 78.72% to 75.97%; from October 2013 to July 2016, it rose from 77.44% to 81.33%; and from August 2016 to November 2019, it was again in a downtrend, falling from 80.68% to 69.19%. Our findings are consistent with recent political developments that highlight the fraying consensus on the benefits of cross-border economic integration. The rise of unilateralism, represented by “the United States first,” to some extent weakens the positive spillover of global economic policy coordination. A potential widening of global imbalances together with sharp exchange rate fluctuations, should those occur in response to major policy shifts, could further intensify protectionist pressures. Increasing restrictions on trade and migration would hurt global economic growth, and take an immediate toll on market sentiment.
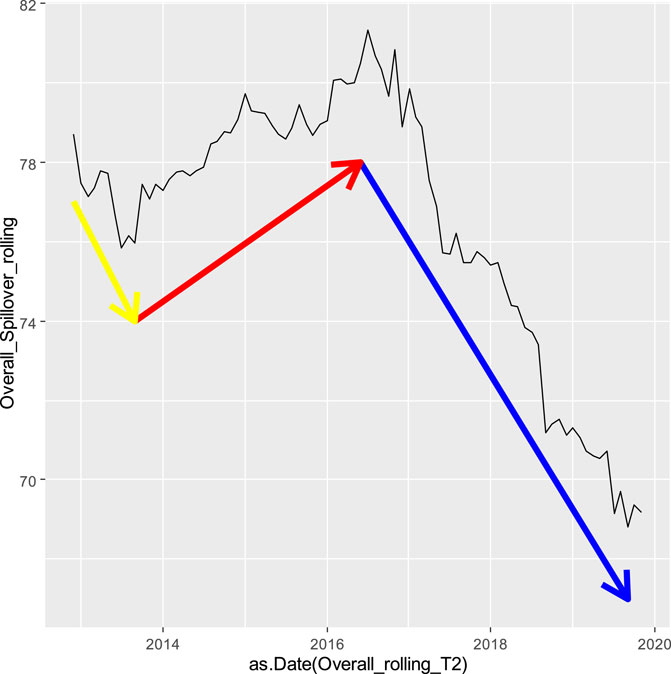
FIGURE 7. Rolling-sample overall spillovers.
Figure 8 shows the distributions of rolling-sample net spillovers. Besides heterogeneity, some of the 22 countries had steady transmitting/receiving characteristics: Singapore and Japan were the two decisive transmitters of net spillover, and Brazil, Colombia, Ireland, Italy, Mexico, the Netherlands, and Russia were clear receivers of net spillover. Notably, emerging markets and developing countries mainly received net external spillovers. Meanwhile, developed countries tended to transmit net external spillovers, except Germany, Italy, and the Netherlands. As an important country of the Eurozone, Germany played the role of a stabilizer. The net spillover of United States’ EPU was narrowly distributed around zero, which may imply that its influence is not as strong as imagined. Besides, China barely transmitted net external spillovers, which strongly refutes the theory that “China is a threat.”
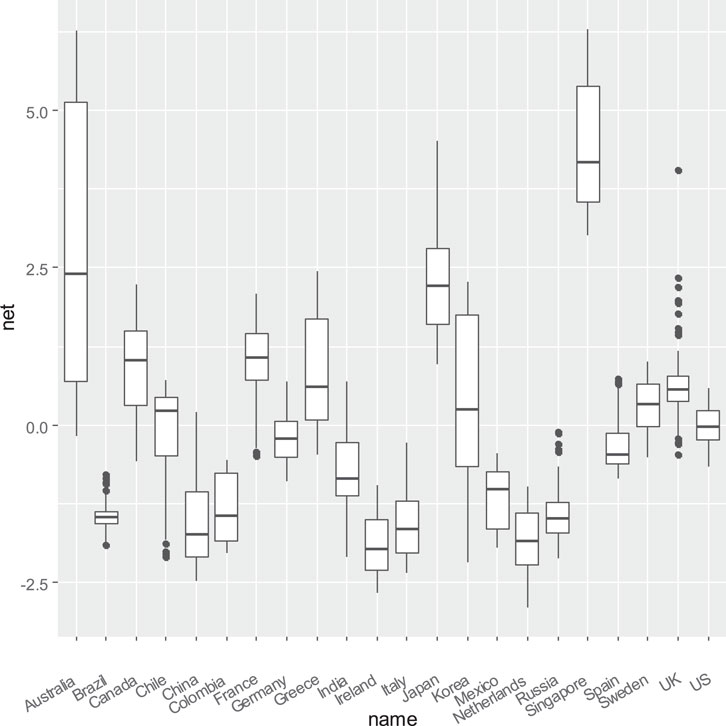
FIGURE 8. Distribution of rolling-sample net spillovers.
Figure 9 shows the frequency of the main countries identified as one of the two key players in the rolling-sample net pairwise spillover networks. Again, Singapore appears to be the most important information hub of the global EPU network and has been identified in 52 out of the 84 rolling-sample analysis on the global EPU diffusion network. Ireland and Australia were also identified most frequently than other countries.
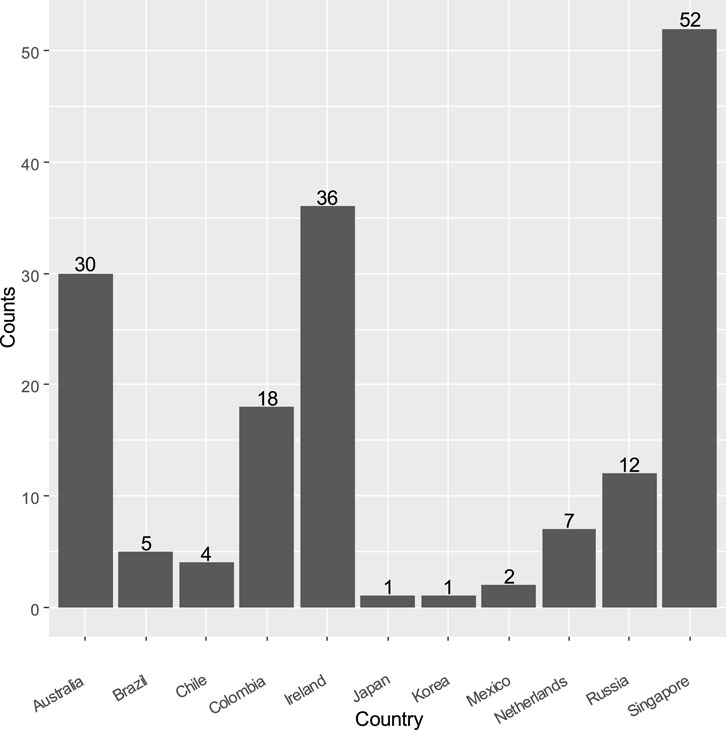
FIGURE 9. The frequency of main countries as key player identified by diffusion centrality.
Figure 10 depicts the evolution of diffusion centrality in the rolling sample pairwise spillover network. Before 2015, countries other than Singapore acted as the key player. In 2015, the information center of the global EPU network gradually moved from other countries to Singapore. Since 2016, Singapore has been steadily identified as the dominant key player.
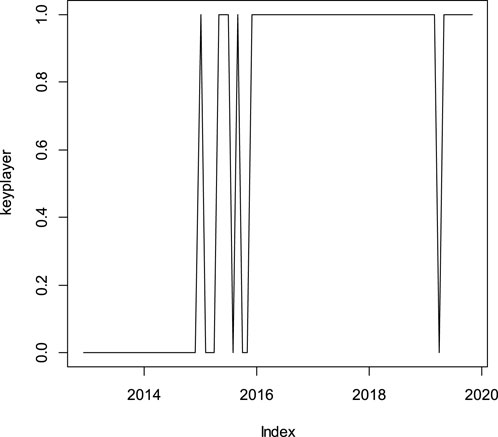
FIGURE 10. The evolution of diffusion centrality in rolling-sample pairwise spillover network. The vertical coordinate is a binary variable in which 1 denotes Singapore being identified as the key player and 0 denotes other countries being identified as the key player.
Considering the full sample results as well as the stability of the rolling sample results, the EPU of Singapore has played a very crucial role as an information diffusion center in the global EPU network since 2016.
4 Discussion
Why is Singapore most frequently identified as the key player? In our opinion, it is both Singapore and not Singapore that lies at the information diffusion center.
Specifically, Singapore lies at the information diffusion center of the global EPU network due to the following considerations: First, economically, Singapore is an export-oriented economic country with unique characteristics, and thus, easily becomes the thermometer of global economic fluctuations. Singapore adheres to economic diplomacy, and aggressively pursues trade and investment liberalization. Its economic activities rely heavily on American, European, Japanese, and other surrounding markets, making Singapore’s economic policy very sensitive to uncertainty. Singapore is also a principal participant in the global industrial chain and international specialization. It is not only the biggest shipbuilding base in Southeast Asia but also the world’s third largest petroleum refining center. As a world-class transshipment port and the fourth important global international finance center, Singapore has all necessary conditions of receiving and transmitting EPU.
Second, geographically, Singapore is a gateway city that lies at the outpost of Western people’s perceptions of Eastern civilization. It is not only a crucial international trade hub but also a key air harbor that connects Asia, Europe, Africa, and Oceania. This advantageous geographical location endows the country with incomparable innate advantages in cross-cultural communication. This may explain why Singapore is capable of being the hub of the EPU diffusion network.
Despite this, that it is not Singapore which lies at the information diffusion center of the global EPU network stems from statistical facts. Singapore’s EPU is highly related to the GDP-weighted average of national EPUs. In the full sample, the contemporaneous correlation between Singapore’s EPU and GEPU_ppp reached 0.99. That is, Singapore’s EPU can be reasonably considered as the weighted average of all countries’ EPUs. Logically, Singapore’s EPU is more likely to be identified as the core of the global EPU network.
The implications of our findings are clear. Regardless of how the tide of anti-globalization reshapes the world economy, policy-relevant uncertainties are interconnected across the world. As the empirical results showed, the EPU of none of the countries is capable of dominating the global EPU diffusion network. Rather than strenuously tracking the change in the EPU of a single country, paying close attention to global EPU is probably more conducive for macroeconomic stability. Likewise, unilaterally accusing others of being troublemakers is helpless for global economic recovery. Cooperation is the only way to solve globalized issues.
5 Conclusion
To identify the most influential player in the global EPU network, we included 22 country-level EPUs to build a large VAR system and used a 12-period-ahead forecast error variance decomposition to calculate the spillovers. We found a high overall spillover value, confirming the importance of spillovers. With conspicuously large positive net spillovers, Singapore emerged as the most powerful transmitter of spillovers. After reorganizing the pairwise spillovers into a directed weighted network, the core-periphery structure and backbone were extracted. Furthermore, the diffusion centrality was calculated to ascertain the key player in the information diffusion network. Singapore was most frequently identified as the key player. Our work reveals a promising new research direction surrounding economic policy risk spillover and contagion. Further work can focus on the process of formation of the global EPU dynamic diffusion network.
Data availability statement
The original contributions presented in the study are included in the article/Supplementary Material, further inquiries can be directed to the corresponding author.
Author contributions
KS: Conceptualization, Formal Analysis, Funding acquisition, Methodology, Software, Supervision, Writing–original draft, Writing–review and editing. LN: Conceptualization, Data curation, Formal Analysis, Investigation, Validation, Visualization, Writing–original draft, Writing–review and editing.
Funding
The author(s) declare financial support was received for the research, authorship, and/or publication of this article. This research was funded by the National Social Sciences Funds of China under grant number (20BTJ015).
Acknowledgments
We thank the editor and anonymous referees for their comments and helps.
Conflict of interest
The authors declare that the research was conducted in the absence of any commercial or financial relationships that could be construed as a potential conflict of interest.
Publisher’s note
All claims expressed in this article are solely those of the authors and do not necessarily represent those of their affiliated organizations, or those of the publisher, the editors and the reviewers. Any product that may be evaluated in this article, or claim that may be made by its manufacturer, is not guaranteed or endorsed by the publisher.
References
1. Klößner S, Sekkel R. International spillovers of policy uncertainty. Econ Lett (2014) 124:508–12. doi:10.1016/j.econlet.2014.07.015
2. Balli F, Uddin GS, Mudassar H, Yoon SM. Cross-country determinants of economic policy uncertainty spillovers. Econ Lett (2017) 156:179–83. doi:10.1016/j.econlet.2017.05.016
3. Jiang YH, Zhu ZX, Tian GY, Nie H. Determinants of within and cross-country economic policy uncertainty spillovers: evidence from US and China. Finance Res Lett (2019) 31:195–206. doi:10.1016/j.frl.2019.08.004
4. Zhang DY, Lei L, Ji Q, Kutan AM. Economic policy uncertainty in the US and China and their impact on the global markets. Econ Model (2019) 79:47–56. doi:10.1016/j.econmod.2018.09.028
5. Thiem C. Cross-category, trans-pacific spillovers of policy uncertainty and financial market volatility. Open Economies Rev (2020) 31:317–42. doi:10.1007/s11079-019-09559-1
6. Sun XL, Yao XY, Wang J. Dynamic interaction between economic policy uncertainty and financial stress: a multi-scale correlation framework. Finance Res Lett (2017) 21:214–21. doi:10.1016/j.frl.2016.12.010
7. Antonakakis N, Andre C, Gupta R. Dynamic spillovers in the United States: stock market, housing, uncertainty, and the macroeconomy. South Econ J (2016) 83:609–24. doi:10.1002/soej.12149
8. Stockhammar P, Osterholm P. Effects of US policy uncertainty on Swedish GDP growth. Empirical Econ (2016) 50:443–62. doi:10.1007/s00181-015-0934-y
9. Fontaine I, Didier L, Razafindravaosolonirina J. Foreign policy uncertainty shocks and US macroeconomic activity: evidence from China. Econ Lett (2017) 155:121–5. doi:10.1016/j.econlet.2017.03.034
10. Tsai IC. The source of global stock market risk: a viewpoint of economic policy uncertainty. Econ Model (2017) 60:122–31. doi:10.1016/j.econmod.2016.09.002
11. Christou C, Cunado J, Gupta R, Hassapis C. Economic policy uncertainty and stock market returns in PacificRim countries: evidence based on a Bayesian panel VAR model. J Multinational Financial Manage (2017) 40:92–102. doi:10.1016/j.mulfin.2017.03.001
12. Liow KH, Liao WC, Huang YT. Dynamics of international spillovers and interaction: evidence from financial market stress and economic policy uncertainty. Econ Model (2018) 68:96–116. doi:10.1016/j.econmod.2017.06.012
13. Hu ZJ, Kutan AM, Sun PW. Is US economic policy uncertainty priced in China's A-shares market? Evidence from market, industry, and individual stocks. Int Rev Financial Anal (2018) 57:207–20. doi:10.1016/j.irfa.2018.03.015
14. Yu HH, Fang LB, Sun WC. Forecasting performance of global economic policy uncertainty for volatility of Chinese stock market. Physica A-Statistical Mech Its Appl (2018) 505:931–40. doi:10.1016/j.physa.2018.03.083
15. Ahmad W, Sharma SK. Testing output gap and economic uncertainty as an explicator of stock market returns. Res Int Business Finance (2018) 45:293–306. doi:10.1016/j.ribaf.2017.07.162
16. Su Z, Fang T, Yin LB. Understanding stock market volatility: what is the role of US uncertainty? North Am J Econ Finance (2019) 48:582–90. doi:10.1016/j.najef.2018.07.014
17. Chen XW, Sun XL, Wang J. Dynamic spillover effect between oil prices and economic policy uncertainty in bric countries: a wavelet-based approach. Emerging Markets Finance and Trade (2019) 55:2703–17. doi:10.1080/1540496X.2018.1564904
18. Wang EZ, Lee CC. Dynamic spillovers and connectedness between oil returns and policy uncertainty. Appl Econ (2020) 52:3788–808. doi:10.1080/00036846.2020.1722794
19. Sun XL, Chen XW, Wang J, Li JP. Multi-scale interactions between economic policy uncertainty and oil prices in time-frequency domains. North Am J Econ Finance (2020) 51:100854. doi:10.1016/j.najef.2018.10.002
20. Kido Y. The transmission of US economic policy uncertainty shocks to Asian and global financial markets. North Am J Econ Finance (2018) 46:222–31. doi:10.1016/j.najef.2018.04.008
21. Wang GJ, Xie C, Wen DY, Zhao LF. When Bitcoin meets economic policy uncertainty (EPU): measuring risk spillover effect from EPU to Bitcoin. Finance Res Lett (2019) 31:489–97. doi:10.1016/j.frl.2018.12.028
22. Gupta R, Pierdzioch C, Risse M. On international uncertainty links: BART-based empirical evidence for Canada. Econ Lett (2016) 143:24–7. doi:10.1016/j.econlet.2016.03.009
23. Antonakakis N, Gabauer D, Gupta R, Plakandaras V. Dynamic connectedness of uncertainty across developed economies: a time-varying approach. Econ Lett (2018) 166:63–75. doi:10.1016/j.econlet.2018.02.011
24. Gabauer D, Gupta R. On the transmission mechanism of country-specific and international economic uncertainty spillovers: evidence from a TVP-VAR connectedness decomposition approach. Econ Lett (2018) 171:63–71. doi:10.1016/j.econlet.2018.07.007
25. Bai L, Zhang XH, Liu YT, Wang Q. Economic risk contagion among major economies: new evidence from EPU spillover analysis in time and frequency domains. Physica A-Statistical Mech Its Appl (2019) 535:UNSP 122431. doi:10.1016/j.physa.2019.122431
26. Gupta R, Sun XJ. Forecasting economic policy uncertainty of BRIC countries using Bayesian VARs. Econ Lett (2020) 186:108677. doi:10.1016/j.econlet.2019.108677
27. Kang SH, Yoon SM. Dynamic connectedness network in economic policy uncertainties. Appl Econ Lett (2019) 26:74–8. doi:10.1080/13504851.2018.1438580
28. Marfatia H, Zhao WL, Ji Q. Uncovering the global network of economic policy uncertainty. Res Int Business Finance (2020) 53:UNSP 101223. doi:10.1016/j.ribaf.2020.101223
29. Baker SR, Bloom N, Davis SJ. Measuring economic policy uncertainty. Q J Econ (2016) 131:1593–636. doi:10.1093/qje/qjw024
30. Koop G, Pesaran MH, Potter SM. Impulse response analysis in nonlinear multivariate models. J Econom (1996) 74:119–47. doi:10.1016/0304-4076(95)01753-4
31. Pesaran HH, Shin YC. Generalized impulse response analysis in linear multivariate models. Econ Lett (1998) 58:17–29. doi:10.1016/S0165-1765(97)00214-0
32. Diebold XF, Yilmaz K. Better to give than to receive: predictive directional measurement of volatility spillovers. Int J Forecast (2012) 28:57–66. doi:10.1016/j.ijforecast.2011.02.006
33. Ma A, Mondragón RJ. Rich-cores in networks. PLoS ONE (2015) 10:e0119678. doi:10.1371/journal.pone.0119678
34. Serrano MA, Boguna M, Vespignani A. Extracting the multi-scale backbone of complex weighted networks. Proc Natl Acad Sci USA (2009) 106:6483–8. doi:10.1073/pnas.0808904106
35. Banerjee A, Chandrasekhar AG, Duflo E, Jackson MO. The diffusion of microfinance. Science (2013) 341:1236498. doi:10.1126/science.1236498
36. Liu YY, Slotine JJ, Barabási AL. Controllability of complex networks. Nature (2011) 473:167–73. doi:10.1038/nature10011
Keywords: economic policy uncertainty, spillover, core-periphery structure, backbone, diffusion centrality
Citation: Shi K and Nie L (2024) Identifying the key player in the diffusion network of global economic policy uncertainty. Front. Phys. 11:1328736. doi: 10.3389/fphy.2023.1328736
Received: 27 October 2023; Accepted: 31 December 2023;
Published: 16 January 2024.
Edited by:
Salvatore Micciche, University of Palermo, ItalyReviewed by:
Wei-Xing Zhou, East China University of Science and Technology, ChinaReza Jafari, Shahid Beheshti University, Iran
Copyright © 2024 Shi and Nie. This is an open-access article distributed under the terms of the Creative Commons Attribution License (CC BY). The use, distribution or reproduction in other forums is permitted, provided the original author(s) and the copyright owner(s) are credited and that the original publication in this journal is cited, in accordance with accepted academic practice. No use, distribution or reproduction is permitted which does not comply with these terms.
*Correspondence: Li Nie, bmllbDczNkBqbHUuZWR1LmNu