 Min Mao
 Chengjiang Zhou
 Bingwei Xu3
 Jingzong Yang
- 1Faculty of Information Engineering, Quzhou College of Technology, Quzhou, China
- 2School of Information Science and Technology, Yunnan Normal University, Kunming, China
- 3Shimge Pump Industry (Zhejiang) Co., Ltd., Hangzhou, China
- 4School of Big Data, Baoshan University, Baoshan, China
To achieve a comprehensive and accurate diagnosis of faults in rolling bearings, a method for diagnosing rolling bearing faults has been proposed. This method is based on Multivariate Variational Mode Decomposition (MVMD) signal reconstruction, Multivariate Multiscale Dispersion Entropy (MMDE)-Generalized Normal Distribution Optimization (GNDO), and Marine predators’ algorithm-based optimization support vector machine (MPA-SVM). Firstly, by using a joint evaluation function (energy*|correlation coefficient|), the multi-channel vibration signals of rolling bearings after MVMD decomposition are denoised and reconstructed. Afterward, MMDE is applied to fuse the information from the reconstructed signal and construct a high-dimensional fault feature set. Following that, GNDO is used to select features and extract a subset of low-dimensional features that are sensitive and easy to classify. Finally, MPA is used to realize the adaptive selection of important parameters in the SVM classifier. Fault diagnosis experiments are carried out using datasets provided by the Case Western Reserve University (CWRU) and Paderborn University (PU). The MVMD signal reconstruction method can effectively filter out the noise components of each channel. MMDE-GNDO can availably mine multi-channel fault features and eliminate redundant (or interference) items. The MPA-SVM classifier can identify faults in different working conditions with an average accuracy of 99.72% and 100%, respectively. The results demonstrate the accuracy, efficiency, and stability of the proposed method.
1 Introduction
Rolling bearings are one of the key components of rotating machinery, and their operating status directly affects the overall performance, work efficiency, and service life of the equipment. Because rolling bearings usually operate in very harsh operating environments, the probability of various failures is relatively high. It is of great significance for the safe operation of rotating machinery to effectively identify different operating states, different damage degrees, and different types of rolling bearing faults [1].
Due to the development of artificial intelligence technology and the accumulation of industrial monitoring data, data-driven fault diagnosis methods have attracted more and more attention [2]. At present, analysis based on vibration signals is the most common method for diagnosing rolling bearing faults. The process of fault diagnosis can generally be divided into three main steps: signal processing, feature extraction and selection (i.e., dimensionality reduction), fault mode recognition, etc. Fault features can be extracted from the time domain (including statistical analysis and correlation analysis), frequency domain [including spectrum analysis and Fast Fourier transform (FFT), coherence analysis, spectrum refinement analysis, etc.], and time-frequency domain (including short-time Fourier transform, Wigner-Ville, wavelet packet analysis, wavelet analysis [3] and fractal-wavelet modeling [4, 5], etc.). Guido R C et al. [6] proposed discrete path transform. This method was designed as a novel manual feature extraction tool to achieve spoken language recognition. However, vibration signals are usually characterized by strong background noise, and non-stationary, nonlinear, and coupled modulation [7, 8]. In recent years, time-frequency analysis methods for vibration signals have been widely studied. For example, Empirical Mode Decomposition (EMD) [9] and Local Mean Decomposition (LMD) [10], but both have common issues (i.e., mode mixing). To suppress the modal aliasing phenomenon, Ensemble Empirical Mode Decomposition (EEMD) [11] and Ensemble Local Mean Decomposition (ELMD) [12] were proposed. Among them, ELMD is a noise-assisted analysis method proposed based on EEMD. Nonetheless, after adding noise in ELMD, there are problems such as residual noise pollution and a large amount of computation when reconstructing the signal. Different from EMD and its extended algorithm, Empirical Wavelet Transform (EWT) [13, 14] determines the modal components in different frequency bands by dividing the frequency spectrum of the signal. However, EWT has poor robustness and is susceptible to noise interference, resulting in too dense spectrum allocation, which in turn leads to over-decomposition of the results. Variational Mode Decomposition (VMD) [15] is more effective than EWT, EMD, and EEMD in extracting transient shocks because it uses a non-recursive method to obtain several modal components with sparse characteristics. However, the superiority of VMD depends on the accurate selection of the number of modes
Currently, most vibration signals are only collected from a single accelerometer. If the fault location is different, the vibration signal strength and spectrum structure are not the same, which may cause misjudgment or missed judgment. For this reason, extending unary data-driven methods to multivariate becomes a research hotspot. Multivariate signal algorithms mainly face the two major challenges of aligning frequency information across multiple channels in each mode (called mode alignment) and feature fusion of multi-channel information [19]. For example, Bivariate Empirical Mode Decomposition (Bivariate EMD) [20], Multivariate Empirical Mode Decomposition (Multivariate EMD) [21], Complex Local Mean Decomposition (Complex LMD), etc. However, they all inherit the limitations of EMD and LMD, especially the problems of pattern aliasing and pattern splitting. MVMD is a generalization of VMD on multivariate or multi-channel datasets. MVMD [22] is used to extract the set of bandwidth modes of inherent multivariate modulated oscillations contained in the multivariate input signal, and the sum of the bandwidths of the signal modes is minimal. This approach addresses the pattern alignment problem [23] whereas there is still litter research on parameter setting and component optimization of MVMD. Gao J et al. [24] applied the MVMD method to DC circuit breaker fault detection. Under weak fault conditions affected by noise, faults of equipment under different working conditions can be detected correctly. But MVMD also inherits the shortcomings of VMD. Song Q et al. [25] utilized MVMD to adaptively decompose multivariate raw signals. However, its evaluation process is simple, which is not conducive to the accurate extraction of the optimal component.
Entropy [26] theory is a feature extraction method that quantifies the degree of irregularity and complexity of time series, such as Sample Entropy (SE), Fuzzy Entropy (FE), Dispersion Entropy (DE), and their Fractional [27], etc. In addition, Rostaghi M et al. [28] proposed fuzzy dispersion entropy (FDE) for signal nonlinear analysis. Common multiscale entropy methods include MSE [29], MFE [30], MDE [31], etc. By utilizing adaptive VMD and multiscale entropy, feature extraction of vibration signals can be achieved. Li Y et al. [32] proved that MDE has the characteristics of fast calculation speed and strong noise resistance through comparative analysis with methods such as MSE and MFE. In addition, Zhou X et al. [33] utilized adaptive VMD and Multipoint Optimal Minimum Entropy Deconvolution Algorithm (MOMEDA) to achieve feature extraction under weak fault impact components and environmental noise interference. Envelope demodulation is also widely used for fault feature extraction. By comparing the fault frequency obtained through envelope demodulation with the theoretical value, fault identification is achieved. Zhang B et al. [34] proposed a fault characteristic frequency -oriented criterion to determine all the informative frequency bands. In this way, all frequency components with fault information are enhanced. In the field of unary signal processing, these methods have been widely applied. But they can only analyze single-channel time series. In addition, the vibration signal collected by a single channel is often not enough to provide sufficient rolling bearing fault information to accurately identify the fault type. For multi-channel time series, the multi-scale entropy method can only be applied when the signals are independent and uncorrelated. Inspired by the theory of multidimensional embedding reconstruction, Kafantaris E et al. [35] proposed MMDE, which extended single-channel time series evaluation to multi-channel. Compared with single-channel time series evaluation, multi-channel time series evaluation can evaluate the dynamic interrelationship of multi-channel time series from the perspectives of complexity, mutual predictability, and long-term correlation [36]. Ma Y et al. [37] utilized multivariate multiscale fuzzy distribution entropy to extract fault features. However, compared to distribution entropy, the performance of feature extraction using distribution entropy is not stable enough. Therefore, using the multi-channel nonlinear coupling characteristic of MMDE, the obtained entropy value can be used as a rolling bearing fault characteristic. It has recently been applied to fault feature extraction of multi-channel signals. Zhou J et al. [38] proposed multivariate local characteristic-scale decomposition and a 1.5-dimensional empirical envelope spectrum, which can effectively suppress the noise of the envelope signal and highlight the fault features of the signal. However, compared with entropy, the extraction of fault frequency is highly susceptible to interference from complex background noise.
On the premise of maintaining or improving the classification accuracy, the feature selection method is used to select some of the most effective features from the fault feature set to reduce the dimension of the feature space and improve the generalization ability. According to whether it is independent of the subsequent learning algorithm, it can be mainly divided into three types: filter, embedded and wrapper. Compared with other methods, the wrapped methods have higher overall accuracy [39]. Many scholars use the search method of swarm intelligence optimization algorithm as the search mechanism of wrapped feature selection to screen features. Thus, the problem of difficult implementation of exhaustive search can be solved. These include Particle Swarm Optimization (PSO) [40], Grey Wolf Optimization (GWO) [41], Whale Optimization Algorithm (WOA) [42] and other classic swarm intelligence optimization algorithms. The wrapping methods use the performance of the learner as the evaluation criteria of the feature subset. Therefore, this approach is also most conducive to selecting the optimal subset of features for the learner. Through feature dimensionality reduction, on the one hand, noise interference can be eliminated and the burden on the classifier can be reduced. On the other hand, the feature set can also be compressed to reduce storage requirements, etc. [43]. At the same time, some new algorithms with excellent performance have emerged, such as Atom Search Optimization (ASO) [44], Manta Ray Foraging Optimization (MRFO) [45], Slime Mold Algorithm (SMA) [46]. Zhang et al. proposed a Generalized Normal Distribution Optimization algorithm (GNDO) and applied it to the key parameters’ extraction of photovoltaic models [39]. The parameter extraction results of this method are verified in terms of quality and stability, and outperform methods such as PSO and GWO. However, there are few studies on the feature selection of rolling bearing faults using GNDO.
After feature selection is performed on the high-dimensional feature set, fault classification and recognition of rolling bearing are required. Currently, machine learning methods are still highly used in fault diagnosis, especially SVM. Compared with methods such as matrix classification networks (including the multi-class fuzzy support matrix machine, the non-parallel bounded support matrix machine, the deep stacked support matrix machine, etc. [47]), deep learning (recently proposed graph attention network [48], convolutional-vector fusion network [49], deep convolutional generative adversarial network [50], etc. But the above deep learning methods all require sufficient sample data.), deep transfer learning (for example, reinforcement ensemble deep transfer learning network [51], etc. The SVM is widely used because it does not require a large amount of sample data. Meanwhile, Classification and regression problems are simplified by not involving laws of large numbers and probability measures, etc. SVM models are generally robust and have good generalization capabilities. However, the performance of SVM mainly depends on the selection of key parameters (i.e., penalty factor
Although the various feature extraction and recognition methods mentioned above have been widely used in intelligent fault diagnosis of rolling bearings, there are still the following problems: 1. The influencing parameters in the decomposition process of MVMD are the same as those of VMD. On the one hand, the two key parameters must be preset, which is not suitable for direct application as an adaptive model in practical engineering applications. On the other hand, the selection of the evaluation function for the signal component is not appropriate or too simple. There is still noise in the modal components, making it impossible to analyse the signal effectively. 2. There are inevitably redundant (or interference) items in the high-dimensional features of MMDE, and the problem of low classification accuracy will follow. In addition, the fitness function selected by the current swarm intelligence optimization algorithm is too single. It is not conducive to selecting as few features as possible to obtain the highest possible fault diagnosis accuracy. At the same time, there are few attempts to use the GNDO method for feature selection of rolling bearing faults. 3. The classification accuracy of traditional SVM varies with changes in key parameters and does not have self-adaptability. The generalization ability of the SVM classifier needs to be further improved. Meanwhile, most adaptive methods are not robust to changes in operating conditions or unseen conditions during model training.
Aiming at the above problems, a fault diagnosis method based on MVMD signal reconstruction, feature selection, and self-adaptive SVM is proposed. The main research work and innovative points of this paper are briefly summarized as follows: 1) A noise reduction and reconstruction method for MVMD signals is proposed. This method not only decomposes multi-channel vibration signals, but also introduces a joint evaluation function (energy*|correlation coefficient|) to analyse each modal component. Signal noise reduction is achieved by selecting effective IMF components, and reconstruction is completed. 2) Propose MMDE-GNDO feature extraction and selection method. On the one hand, MMDE is used to realize multi-channel signal feature extraction; on the other hand, GNDO is used to select sensitive and easy-to-classify low-dimensional feature subsets from the high-dimensional feature set of rolling bearing faults. This can not only avoid the curse of dimensionality, but also improve the efficiency of fault classification and recognition. 3) Construct the MPA-SVM fault classifier. By combining with the optimal feature subset, it has strong adaptability, high optimization precision and fast convergence speed. Moreover, this method can obtain the optimal parameters of SVM in the shortest time. The implementation process is as follows: First, MVMD decomposition, noise reduction, and reconstruction are performed on the multi-channel vibration signals (including different operating conditions of rolling bearings). Second, MMDE-GNDO is used to realize feature extraction and selection as the optimal feature subset. Then, the MPA-SVM is trained with the optimal feature subset to construct the optimal adaptive classifier. Its unique feature lies in directly utilizing the fault classification accuracy of SVM as the fitness function of MPA, fully improving optimization efficiency. Finally, it is verified through continuous testing and applied to the fault diagnosis of rolling bearings. Through comparative analysis with other methods, its characteristics of accuracy, efficiency, and stability are validated.
The overall structure of this paper: Section 2 briefly introduces the MVMD theory and the multi-channel signal reconstruction process based on the joint evaluation function. Section 3 briefly introduces MMDE, GNDO theory, and the feature selection process of multi-channel signals based on MMDE-GNDO. Section 4 presents the process of optimizing SVM parameters using MPA. Section 5 gives a brief overview of the proposed fault diagnosis method. In Section 6, the superiority of this method is confirmed by the CWRU and PU-bearing data sets, and the experimental process, comparative analysis of each method, and preliminary conclusions are discussed in detail. Section 7 is the experimental conclusion of this paper.
2 Signal reconstruction method based on MVMD
2.1 Signal noise reduction and reconstruction
The MVMD method extends the traditional VMD algorithm from one-dimensional to multi-dimensional, which provides great convenience for dealing with multi-variable or multi-channel data. The main goal of MVMD is to extract predefined
Where:
The constrained relative optimization problem becomes Eq. 2:
Where:
To solve the variational problem described above, the Lagrange representation of the augmented structure as Eq. 3, as follows:
Where:
To solve the unconstrained variational problem after this transformation, the Alternate Direction Method of Multipliers (ADMM) method is used to implement alternate updates [61]. For the algorithm process, please refer to [62]. Then, calculate and the centre frequency to get the decomposed signal components.
Like the mode update method of the VMD, the mode updates can be obtained to Eq. 4, as follows:
Get the centre frequency update to Eq. 5 as:
The frequency bands of the signal are adaptively decomposed by updating the relation to obtain
However, the effect of MVMD signal processing is also closely related to the two parameters of the penalty factor
2.2 Multivariate variational mode decomposition
For signal noise reduction and reconstruction, the existing single index evaluation function can characterize the sparsity of the signal. However, it is very easy to decompose to obtain a set of simple harmonic signal components in the actual application process. This type of harmonic signal belongs to false components. Their energy only accounts for a small portion of the original signal. Therefore, under the premise of avoiding false components (or redundant modes), it is necessary to ensure that the IMF components have a high energy proportion while maintaining a strong correlation with the original signal [63]. Then, to determine the appropriate decomposition number
To this end, the energy evaluation index Energy (as shown in Eq. 6) is introduced first:
where:
At the same time, to avoid the occurrence of the above-mentioned negative optimization situation mentioned above, the selected signal components should retain most of their energy. Because of the possible false components or redundant modes, this article introduces the correlation evaluation index
Where:
The above two evaluation indicators have the same order of magnitude, so this paper uses the product operation to construct a joint evaluation function (as shown in Eq. 8):
In the equation:
The detailed process is shown in Figure 1, and the algorithm steps are as follows:
(1) First, the multi-channel, original rolling bearing vibration signals are input into the MVMD.
(2) Use the peak method to determine the main mode number
(3) Initialize the MVMD parameters, the decomposition parameter
(4) Using the MVMD algorithm to decompose the multi-channel original vibration signal.
(5) After the IMF components are sorted by the joint evaluation function
(6) Finally, the noise-reduced signal is reconstructed, and new multi-channel vibration signals are respectively output.
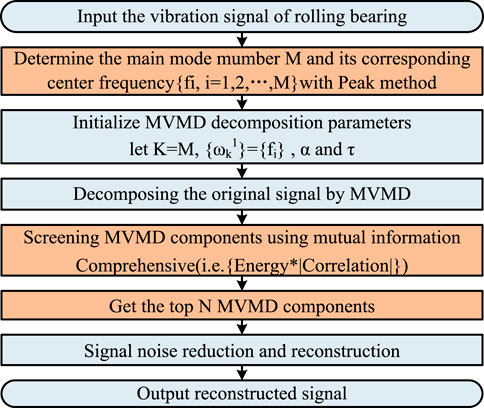
FIGURE 1. Flow chart of MVMD signal denoising and reconstruction.
In summary, this paper first utilizes MVMD to decompose multi-channel vibration signals and obtain
3 Multi fault signal feature extraction
3.1 Multivariate multiscale dispersion entropy
MMDE is obtained by multi-scale expansion based on Multivariate Dispersion Entropy (MDE), which can obtain coarse-grained time series information of multi-channel time series at multiple scales. Therefore, under the premise of noise reduction and reconstruction of multi-channel rolling bearing vibration signals, this paper uses MMDE to extract fault features. MMDE allows multivariate quantification of Dispersion Entropy (DE) from multi-channel time series. Meanwhile, temporal, and spatial dynamics across multiple time scales will be considered. For a set of
1. Production of univariate quantized time-series:
2. Formulation of multivariate embedded vectors.
3. Mapping to multiple dispersion patterns.
4. Calculation of Dispersion Pattern Relative Frequency.
5. Calculation of Multivariate Dispersion Entropy:
Finally, the multi-channel vibration signals are processed by using the MVMD signal reconstruction method in the previous section, and then the fault MMDE of different working conditions is calculated. Thus, the fault feature set (as shown in Eq. 9) is constructed, characterized by high dimensionality:
In the equation:
However, since the rolling bearing fault feature set obtained by using MMDE usually has problems such as high dimensionality, nonlinearity, and redundancy, it will bring certain difficulties to the subsequent data processing and fault diagnosis. For this reason, it is particularly important to introduce feature selection methods.
3.2 Fault signal feature selection
This paper introduces GNDO into the dimensionality reduction process of fault feature set to extract sensitive and low-dimensional fault features. The normal distribution theory is the inspiration of GNDO. For the design inspiration, implementation framework, and pseudocode of GNDO, please refer to [65]. The information-sharing strategies designed in GNDO include local search and global search.
(1) Local search. The optimized generalized normal distribution model can be established using Eq. 10, as follows:
where:
In the equation:
(2) Global search. The global search for GNDO is based on three randomly selected individuals and can be expressed as:
where:
In the equation:
Through the iterative operation of local search and global search, the population and individual positions are updated. Finally, the optimal position that gradually converges to the solution space is obtained, that is, the optimal combination of fault features. Using GNDO to realize rolling bearing fault feature selection is designed based on local and global search strategies. These two strategies are equally important to GNDO and have the same probability of being selected. Furthermore, like other swarm intelligence optimization algorithms, the population in GNDO (as shown in Eq. 18) is initialized as:
where:
To better introduce solutions to the next-generation population, GNDO designs a screening mechanism, which can be specifically expressed as Eq. 19:
3.3 Construction of optimal feature subset based on MMDE-GNDO
In this paper, GNDO is exploited to solve multi-objective optimization (i.e., feature selection) problems. In the GNDO population, each individual represents a set of feature combinations in the rolling bearing fault dataset, the so-called feature subset. The number of raw features in the dataset determines the individual dimension. This paper aims to select as few features as possible to achieve the highest accuracy in fault classification [66]. The fitness function for evaluating the quality of an individual needs to consider two factors at the same time. For this reason, this paper adopts the superposition operation to construct the joint fitness function, and the two assign corresponding index coefficients. As defined in Eq. 20:
In the equation:
GNDO is used to optimize the fault feature set to obtain its sensitive and low-dimensional features. Finally, construct an optimal, subset of fault features (as shown in Eq. 21):
where:
The specific algorithm flow of MMDE-GNDO is shown in Figure 2, and the detailed steps are as follows.
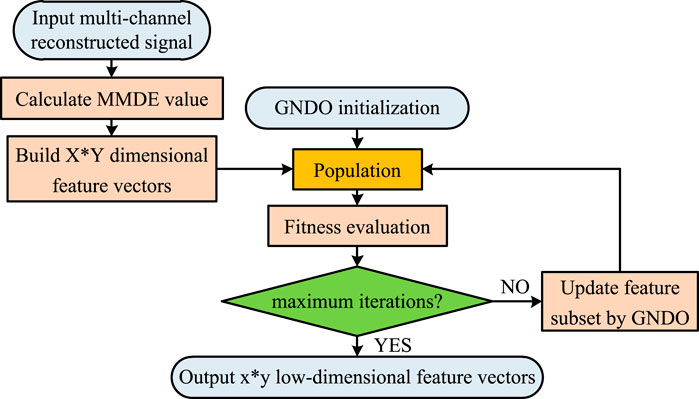
FIGURE 2. Dimension reduction flow chart of MMDE-GNDO bearing fault features.
First, input the reconstructed multi-channel bearing vibration signal. By calculating the MMDE, construct the
(2) GNDO initialization. Initialize the population by constructing an
(3) Through the iterative operation of local search and global search in GNDO, the population and individual positions are updated. On the one hand, local search assigns the fitness value of each individual with a rank-based method (Rank based Method), and obtains the current optimal solution (that is, the current best bearing fault feature combination) and the best position vector (that is, the multidimensional vector space s position). On the other hand, the global search updates the position of the target individual based on the position of the random individual (Random individual), expanding the search space.
(4) Determine the ending conditions for the iterative process (that is, the maximum number of iterations
(5) Finally, output the globally optimal, low-dimensional bearing fault feature vector
4 Adaptive fault diagnosis model construction (MPA-SVM)
SVM is a machine learning method highly used in the field of rolling bearing fault diagnosis, which is a typical small sample problem. To solve the problem of optimal parameter selection, MPA is introduced to optimize it and obtain the optimal self-adaptive model.
First, its inspiration comes from the natural advantage rules in the best foraging strategy. The algorithm principle is as follows:
1) Similar to most meta-heuristic algorithms, MPA is a method based on population. Among them, in the first experiment, the initial solution (as shown in Eq. 22) is uniformly distributed in the search space:
2) The MPA optimization process is divided into three main optimization stages. Consider different speed ratios while simulating the entire activity of predators and prey: The first stage: the speed is relatively large. Second stage: same speed ratio. Third stage: In the case of low speed, the predator moves faster than the prey. Each stage accounts for 1/3 of the entire iterative process.
3) Eddy formation and
In the equation,
4) The best-adapted position is selected as the top predator position. The process is to calculate the corresponding fitness by updating the position of the predator. Then, compare it with the previous fitness value.
5) Repeat steps 2-4 until the termination condition is met. Then, the top predator coordinate position is output.
This paper utilizes MPA to effectively optimize the two key parameters of SVM. That is, after each iteration, the SVM classifier model is evaluated through the fitness function.
In summary, by using MPA to construct an adaptive SVM classifier to accurately identify rolling bearing faults. The detailed steps of this method are as follows:
(1) The normalized data set is input. Then, it is randomly divided into training samples and test samples in a certain proportion.
(2) Initialize parameters for MPA and SVM. The algorithm population and the number of iterations set to 20 and 20, respectively. The dimension of parameter optimization is set to 2, and its value range of (
(3) Obtain the initial position. The fitness function in this optimization process is Eq. 24, and the initial value is set to infinity.
In the equation,
(4) Perform iterative optimization to update the prey location.
(5) Determine the iteration end condition (i.e.,
(6) Use the combination (
(7) The test samples are input into the self-adaptive SVM classifier for rolling bearing fault pattern recognition and output the results.
The MPA-SVM execution process is shown in Figure 3, which includes the adaptive SVM (MPA-SVM classifier) part.
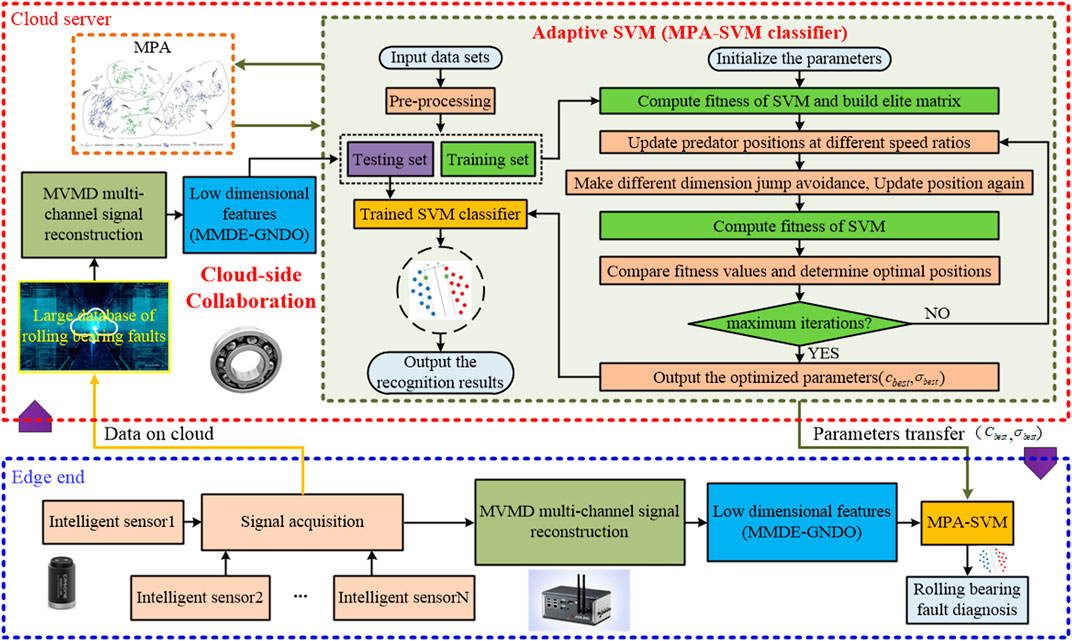
FIGURE 3. Flow chart of the MPA-SVM classifier and rolling bearing fault diagnosis method.
5 Rolling bearing fault diagnosis method
To diagnose rolling bearing faults more comprehensively and accurately, an intelligent fault diagnosis method based on MVMD signal reconstruction and MMDE-GNDO and MPA-SVM is proposed. The specific implementation process can be described as follows:
(1) Using the industrial Internet platform [68], a rolling bearing condition monitoring system is built. Through the cloud/edge collaboration technology, the vibration signal is uploaded from the edge to the cloud, and the rolling bearing fault database is continuously expanded.
(2) To successfully achieve multi-channel fault data fusion of rolling bearings, the model and parameter settings of each acceleration sensor need to be consistent, and vibration acceleration signals in the X-Y-Z coordinate directions should be collected. Under the sampling frequency
At the same time, to accurately extract different types of fault features of rolling bearings, the joint evaluation function is used to denoise the vibration signal and reconstruct it.
(3) To characterize different types of faults of rolling bearings, MMDE is used to calculate the entropy of each vibration signal in different channels and scales. Then, all the entropy is combined to construct the most original fault feature set (i.e., high-dimensional).
(4) To further remove the redundancy or noise in the original feature set, GNDO is used for feature selection. Thus, the feature dimension is reduced to obtain a low-dimensional, sensitive, and independent optimal fault feature subset.
(5) The cloud uses steps (2)–(4) to obtain the optimal and low-dimensional fault feature subset, and inputs it into the MPA-SVM classifier for training to obtain the optimal fault diagnosis model. Finally, the model is used for rolling bearing fault classification testing to achieve accurate identification of different operating conditions and different types of faults.
(6) The penalty factor
In summary, the method proposed in this paper is shown in Figure 3, which is applied to intelligent fault diagnosis of rolling bearings based on cloud/edge collaboration technology.
6 Experiment validations
Two sets of rolling bearing data sets from CWRU [69] and PU [70] are used for experimental analysis to confirm and demonstrate the viability of the suggested method in diagnosing rolling bearing faults. At the same time, as compared to other ways. All experiments were conducted by using the tool software MATLAB R2018b (64bit). The hardware configuration of the device is: Intel (R) Core (TM) i9-10900K CPU @ 3.70 GHz, 3.70 GHz 32 GB RAM.
6.1 Experiment validations for CWRU bearing datasets
The CWRU Experimental Platform is shown in Figure 4. The Rolling Bearing Fault Diagnosis device is mainly composed of a motor, torque sensor/encoder, power meter and electronic control equipment. Rolling bearings operate under different fault conditions, different operating speeds, and different degrees of damage. The signals were mainly obtained from the motor shell drive end, the fan end 12 o’ clock position accelerometer, and the basic accelerometer on the motor support plate. All types of signals were vibration signals.
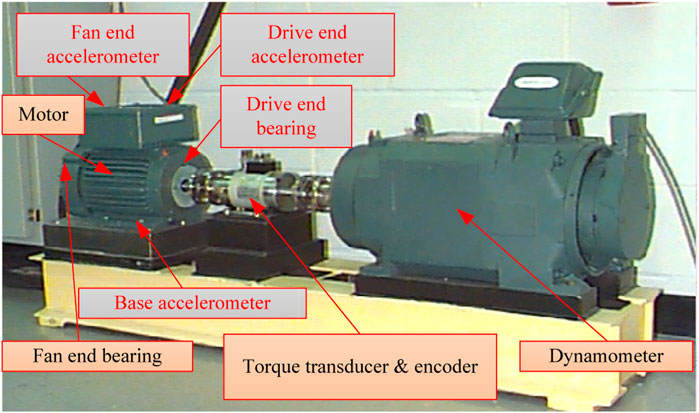
FIGURE 4. Diagram of CWRU rolling bearing fault simulation experimental device.
The experimental data include three fault states, three damage degrees, and four operating speeds, a total of 36 operating conditions. Details are shown in Table 1. By collecting the vibration signal of the drive end, the sampling frequency is 12 kHz and the number of sampling points is 4,096. The number of samples of various types of signals is 60 (among them, 40 training samples and 20 test samples are randomly selected 20 times), and a total of 2,160 sets of signals are collected. The waveforms of some multi-channel signal samples are shown in Figure 5.
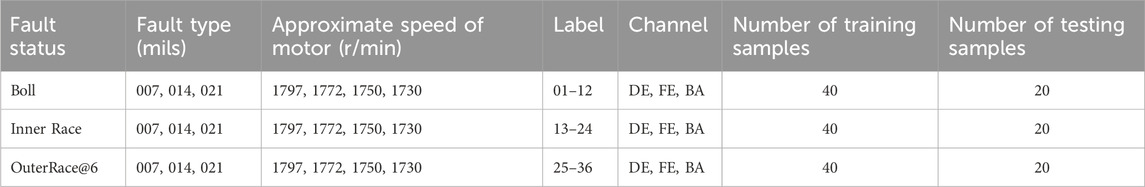
TABLE 1. Description of 36 working states of rolling bearing.
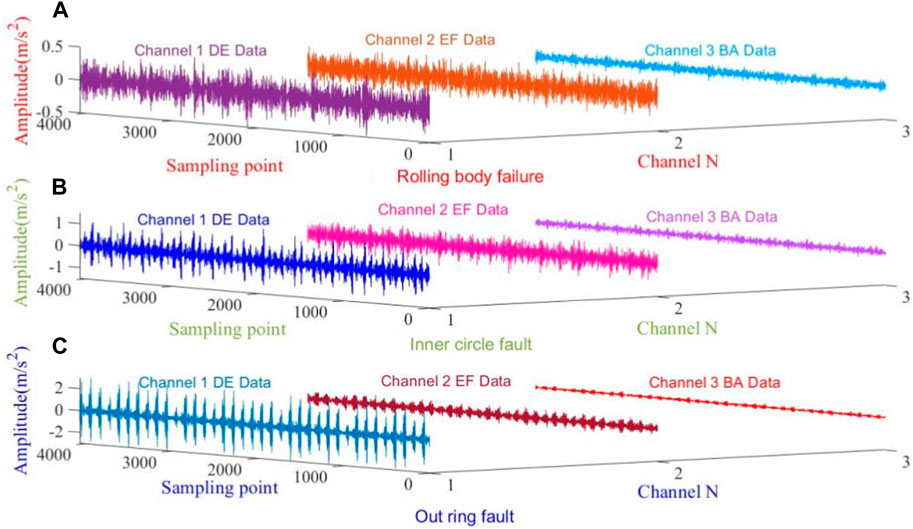
FIGURE 5. Time-domain waveform of multi-channel rolling bearing vibration signals [(A) rolling body failure, (B) inner circle fault, (C) out ring fault].
6.1.1 MVMD and signal reconstruction for three channels
Firstly, this paper uses MVMD to decompose the multi-channel rolling bearing vibration signal. Through experimental analysis, the important parameter settings of MVMD are obtained,
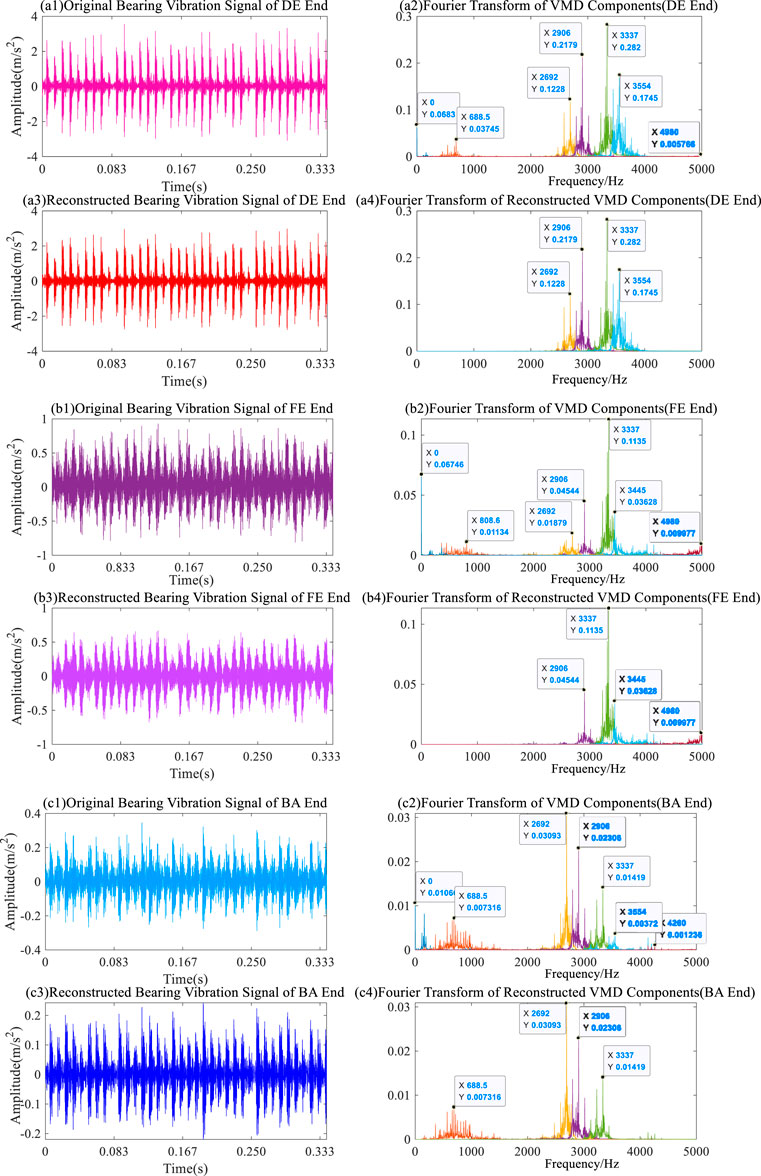
FIGURE 6. The waveform and spectrum of DE, FE and BA end vibration signals before and after reconstruction.
Therefore, the joint evaluation function is introduced to comprehensively evaluate each component of the signal. The evaluation process not only considers the proportion of IMF component energy in the original signal, but also fully retains the IMF component with a strong correlation with the original signal. The proportion of components is set to greater than 90%. The specific evaluation indicators mainly include Comprehensive, Correlation, Energy, Envelope Spectrum, Kurtosis, etc. By sorting, the first 4 order components with a higher proportion are selected to rebuild the signal, which can realize the noise reduction of the original signal.
The time domain waveforms of the reconstructed signals of each channel are shown in Figures 6A3, B3, C3. Finally, the first four-order component Fourier transform after MVMD decomposition is used, as shown in Figures 6A4, B4, C4. In the subsequent comparative experiments, the noise reduction and reconstruction methods of each signal are compared and analysed to verify the advantages of the proposed method. It can also be seen from the figure that the proposed method can effectively select effective signal IMF components in each channel.
Through different MVMD signal denoising and reconstruction methods, new multi-channel rolling bearing vibration signals are obtained respectively. Using the reconstructed signal, the corresponding MMDE is solved. It is necessary to use the optimal feature selection method to select the most suitable subset of features and reduce the fault feature dimension of the rolling bearing. At the same time, it can also reduce the computational pressure of the classifier.
6.1.2 Feature selection based on GNDO (for CWRU)
The MMDE-GNDO method is used to achieve feature dimensionality reduction, where
Under the fault of different working conditions, the entropy mean distribution curves of MMDE at different scales are shown in Figure 7. It can be seen from the figure that the fault feature subset dimension constructed by MMDE-GNDO is 7, and its advantage is that the feature aliasing between different types of bearing faults is relatively small. Therefore, it is used as the optimal and low-dimensional feature subset (7*2,160) and input into the fault classifier of rolling bearing (i.e., MPA-SVM) to analyse and verify different types of rolling bearing faults.
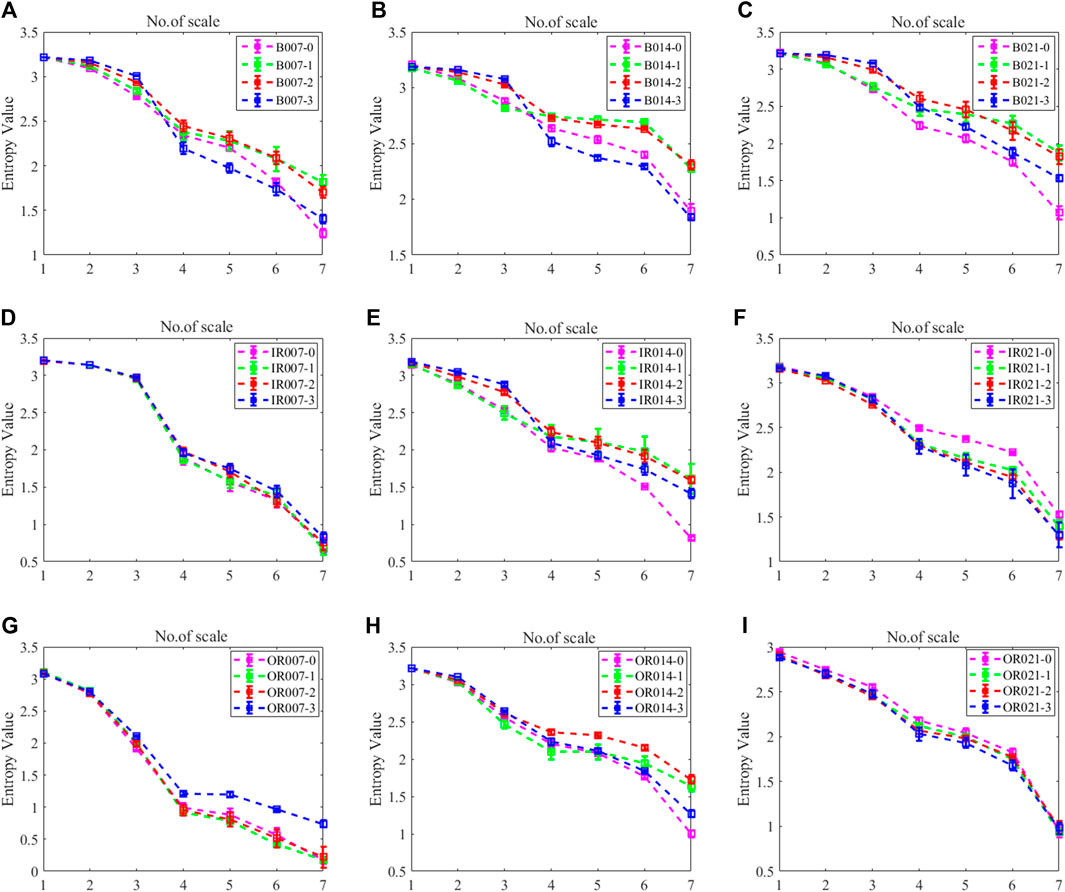
FIGURE 7. The mean distribution of different scale entropy in various states [(A) Four types of faults in B007, (B) Four types of faults in B014, (C) Four types of faults in B021, (D) Four types of faults in IR007, (E) Four types of faults in IR014, (F) Four types of faults in IR021, (G) Four types of faults in OR007, (H) Four types of faults in OR014, (I) Four types of faults in OR021)].
6.1.3 Analysis of intelligent fault diagnosis
By constructing the MPA-SVM classifier, the optimal and low-dimensional rolling bearing fault feature sets are trained and tested, and the final classification results are obtained. To fully validate the practicality and universality of the method proposed in this paper, different types of fault feature sets and different fault diagnosis models are introduced for comparative analysis. The bearing fault feature set is constructed by multi-channel and different single-channel signals, different MVMD signal denoising and reconstruction methods and different feature selection methods. The fault diagnosis model is all kinds of self-adaptive SVM classifiers, and each classifier runs 20 times to verify its reliability and stability. The optimal parameters of SVM, average recognition accuracy, average operation time, classification standard deviation, and other information are recorded for subsequent comprehensive analysis.
6.1.3.1 Comparison 1. Comparison of MVMD signal reconstruction and feature selection methods
To verify that the multi-channel signal can more fully characterize different types of bearing faults, the multi-channel signal is processed by the MVMD signal denoising and reconstruction method, and the respective MMDE is solved. Finally, the MPA-SVM model is used for fault classification. By introducing a total of 8 feature sets (A1-H1 and A2-H2) of multi-channel original signals and single-channel signals (including 3 VMD reconstructed signals and 3 original signals), a large and sufficient comparative analysis was conducted, as shown in Table 2 and Figure 8. The recognition rate of rolling bearing fault feature set A1 is 99.17%, the standard deviation is 2.916e-14, and the operation time is 116.44 s. Compared with B1, C1, D1, E1, F1, G1, H1, the average classification recognition rates were 2.27%, 4.12%, 2.24%, 2.59%, 1.81%, 1.39%, 1.68% higher. This fully proves that the multi-channel reconstructed signal can characterize different types of faults more comprehensively. However, in comparison, the operation time of MPA-SVM is relatively prolonged by 31.44 s, 19.14 s, 16.68 s, 14.34 s, 33.24 s, 34.49 s and 28.98 s, respectively. Therefore, it is necessary to consider the optimization of the rolling bearing fault feature set to reduce the pressure of classification operation.
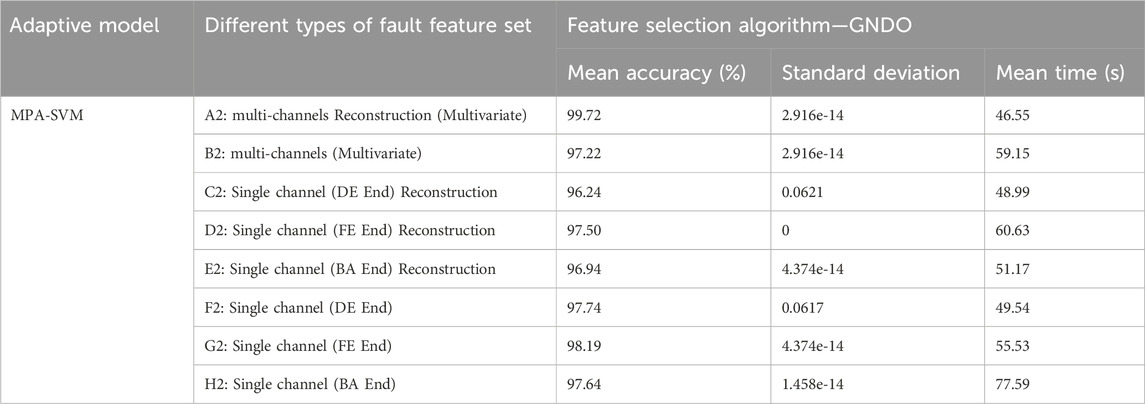
TABLE 2. Comparison of average classification recognition rate and operation time based on different fault feature sets.
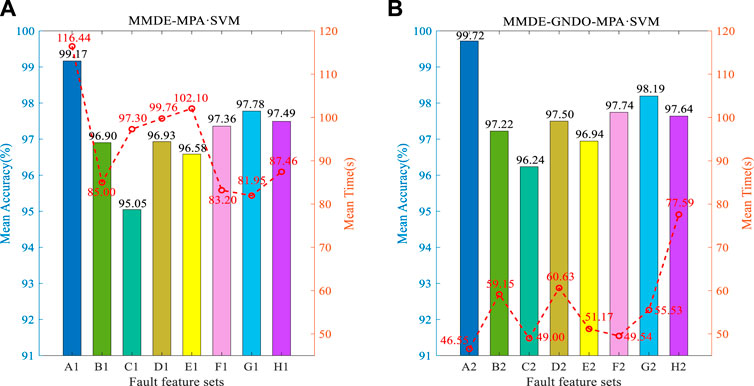
FIGURE 8. Comparison of fault classification results between different high-dimensional fault feature sets and different GNDO preferred feature sets [(A) MMDE-MPA-SVM, (B) MMDE-GNDO-MPA-SVM].
To fully reduce the operating pressure of MPA-SVM, this paper proposes to use GNDO to optimize high-dimensional features before fault classification, as shown in Figure 10. Comparing Figure 8A -A1 with Figure 8B -A2, the recognition rate is further increased by 0.55%–99.72%. This is sufficient to indicate the presence of redundancy or interference in the fault feature set. At the same time, the operation time is significantly reduced by 69.89 s, and the efficiency is significantly improved. In addition, through the comparison between B1 and B2, C1 and C2, D1 and D2, E1 and E2, F1 and F2, G1 and G2, H1 and H2, on the one hand, the average classification recognition rate is relatively higher than 0.32%, 1.19%, 0.57%, 0.36%, 0.38%, 0.41%, 0.15%. On the other hand, the operation time of MPA-SVM is shortened by 25.85 s, 48.30 s, 36.30 s, 45.41 s, 33.66 s, 26.42 s, and 9.87 s respectively. This shows that multi-channel signals not only need to be denoised and reconstructed before feature extraction, but also should be optimized for high-dimensional feature sets (dimensionality reduction).
To verify the comprehensive evaluation method for noise reduction and reconstruction of rolling bearing vibration signals, some traditional (or classical) methods such as Energy, Correlation, Envelope Spectrum, and Kurtosis are compared. The multi-channel signals are denoised and reconstructed by using the above methods, and finally sent to the MPA-SVM classifier for analysis. The average fault classification accuracy of the comprehensive method is 99.17%, which is 1.39%, 2.41%, 4.96% and 7.85% higher than other methods. However, the operation time is 116.44 s, which is significantly higher than other methods. The details of each method are shown in Table 3 (a) Original high-dimensional features. Therefore, this paper uses GNDO to optimize high-dimensional features to improve the efficiency of classification and recognition. After feature optimization by this method, the average recognition accuracy can reach 99.72%, which is 1.66%, 4.59%, 5.98%, and 9.72% higher than other methods, and the classification standard deviation is only 2.916e-14 (i.e., the stability of the classifier is good). At the same time, the operation time is only 46.55 s, which is 4.48 s, 4.57 s, 19.02 s and 15.93 s shorter than other methods, and the recognition efficiency is significantly improved. The details of various methods are shown in Table 3 (b) Feature Selection Algorithm—GNDO. Therefore, the proposed method is superior to the existing single vibration signal-denoising and reconstruction methods. At the same time, feature selection is also needed.
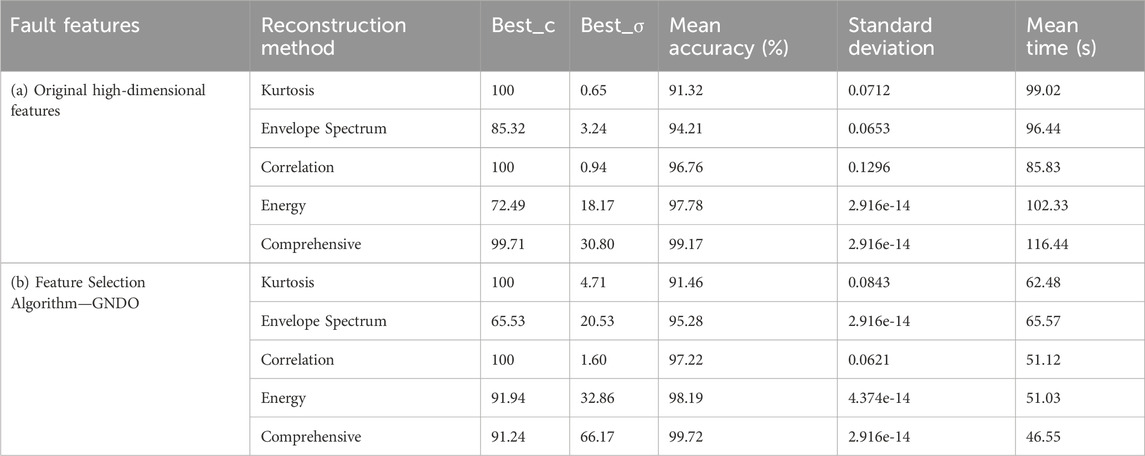
TABLE 3. Comparison of fault diagnosis indexes of different signal denoising and reconstruction methods (MPA-SVM).
Furthermore, by comparing with 9 methods such as EO, MRFO, GWO, ASO, MPA, SMA, PSO, HHO, BOA, etc., the superiority of using the GNDO method to achieve fault feature dimensionality reduction in this paper is verified. The low-dimensional feature set optimized by each method is input into the fault classifier (i.e., MPA-SVM) for fault classification. Firstly, the key parameter optimization of SVM is achieved through MPA. Compared with the average classification accuracy, it is 0.41%, 0.55%, 0.55%, 0.56%, 0.83%, 1.11%, 1.11%, 1.39%, and 1.48% higher respectively. Compared with the operation time consumption, it is reduced by 9.51 s, 27.47 s, 6.21 s, 2.74 s, 11.88 s, 7.32 s, 7.31 s, 20.05 s, and 20.35 s respectively. The experimental results show that the GNDO method can improve the fault diagnosis accuracy of rolling bearings. Through the detailed comparison of Table 4, the necessity of using this method for secondary feature extraction is confirmed. Therefore, this paper ultimately uses GNDO to achieve fault feature selection. Meanwhile, the optimal parameter combination for SVM is obtained by using MPA, namely, (
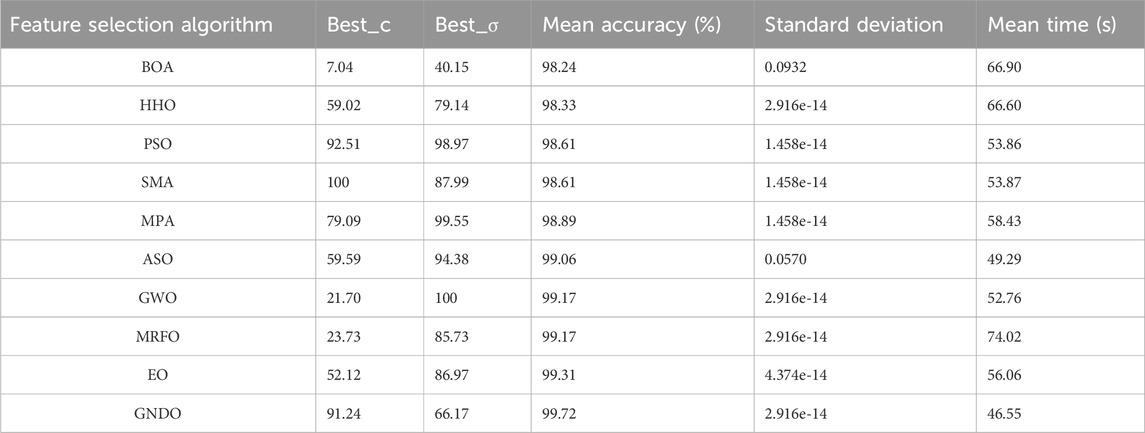
TABLE 4. Fault diagnosis results of different feature selection methods (MPA-SVM).
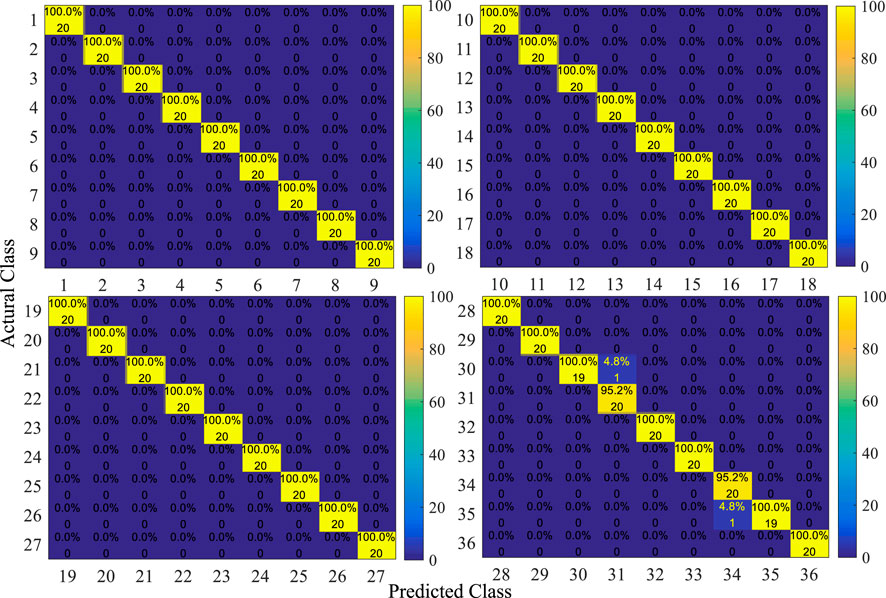
FIGURE 9. Using the GNDO method, MPA-SVM detailed fault classification results are output.
6.1.3.2 Comparison 2. Comparison of self-adaptive SVM classifiers
The superiority of MPA-SVM classifiers is verified by comparing them with five self-adaptive SVM classifiers, including HBA-SVM, SMA-SVM, SSA-SVM, GWO-SVM, AND PSO-SVM. The detailed comparison is shown in Figure 10. The most noteworthy thing is that the average classification recognition accuracy of MPA-SVM, HBA-SVM, and SMA-SVM is 99.72%, which is 0.14%, 0.20%, and 0.41% higher than SSA-SVM, GWO-SVM, and PSO-SVM, respectively. The classification operation time of MPA-SVM is 46.55 s, which saves 29.20 s, 29.05 s, 45.58 s, 42.77 s, and 54.85 s compared with other classifiers. Similarly, comparative analysis is conducted using multi-channel raw signals and single-channel signals. Not only does it demonstrate that the classification recognition efficiency of MPA-SVM is significantly superior to other classifiers, but it further proves that the use of multi-channel signals can obtain richer fault features.
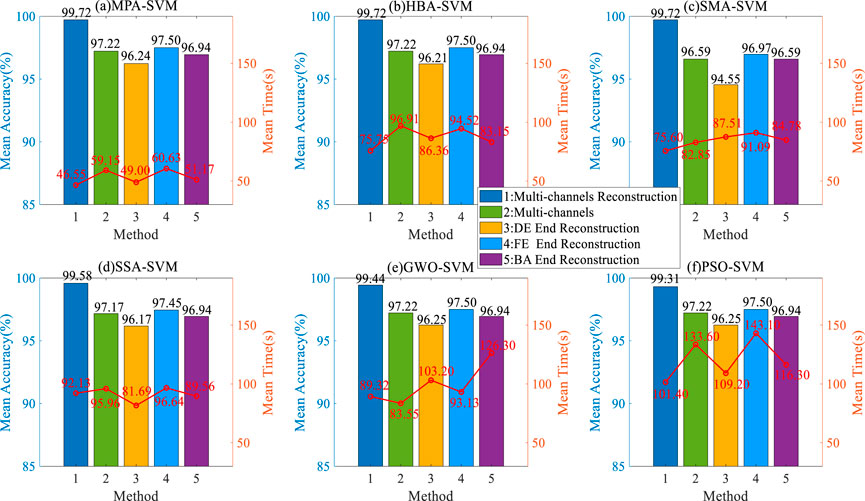
FIGURE 10. Fault classification comparison of different self-adaptive SVMs for different channel signals.
At the same time, five multi-channel signal noise reduction and reconstruction methods (sent to each classifier after GNDO feature selection) are compared and analysed by each classifier, as shown in Figure 11. It can be seen from the figure that the fault classification based on Comprehensive, Energy, Correlation, Envelope Spectrum, and Kurtosis methods is similar, and the classification effect of Comprehensive is the best. At the same time, the operation time of MPA-SVM is 46.55 s, 51.03 s, 51.12 s, 65.57 s, and 62.48 s, respectively, and the classification recognition efficiency is superior to other classifiers. In addition, the practicality and universality of Comprehensive MVMD signal noise reduction and reconstruction have been further demonstrated.
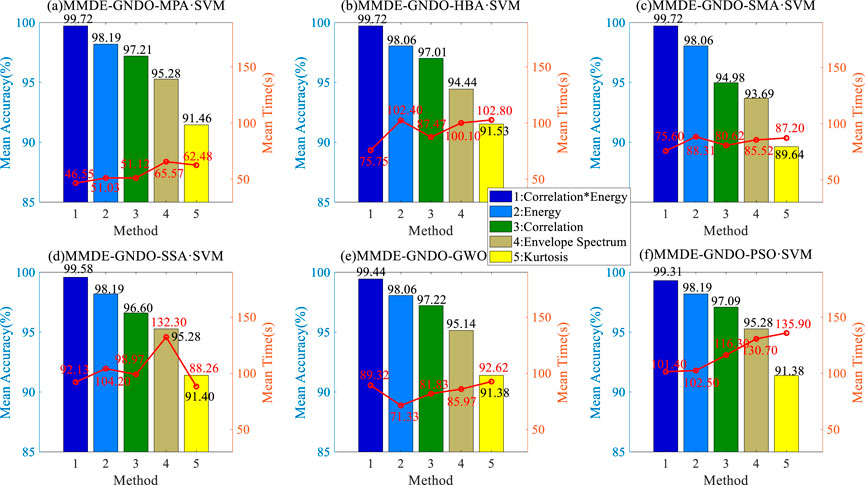
FIGURE 11. Noise reduction and reconstruction methods of different types of signals and fault classification comparison of different self-adaptive SVMs.
Finally, the high-dimensional characteristics of the multi-channel reconstruction signal are used for fault classification, as shown in Table 5 (a) Original high-dimensional features. By comparing with Table 5 (b) Feature Selection Algorithm - GNDO, the classification recognition rates of MPA-SVM, HBA-SVM, SMA-SVM, SSA-SVM, GWO-SVM and PSO-SVM decreased by 0.55%, 0.55%, 0.69%, 0.69%, 0.35% and 0.56%, respectively, but the operation time increased by 69.89 s, 84.89 s, 22.18 s, 83.20 s, 24.30 s, and 36.83 s, respectively. Once again, it indicates that the classification recognition efficiency of MPA-SVM is significantly superior to other classifiers. At the same time, it indirectly proves that the feature selection method based on GNDO has a significant effect on improving the accuracy of fault classification.
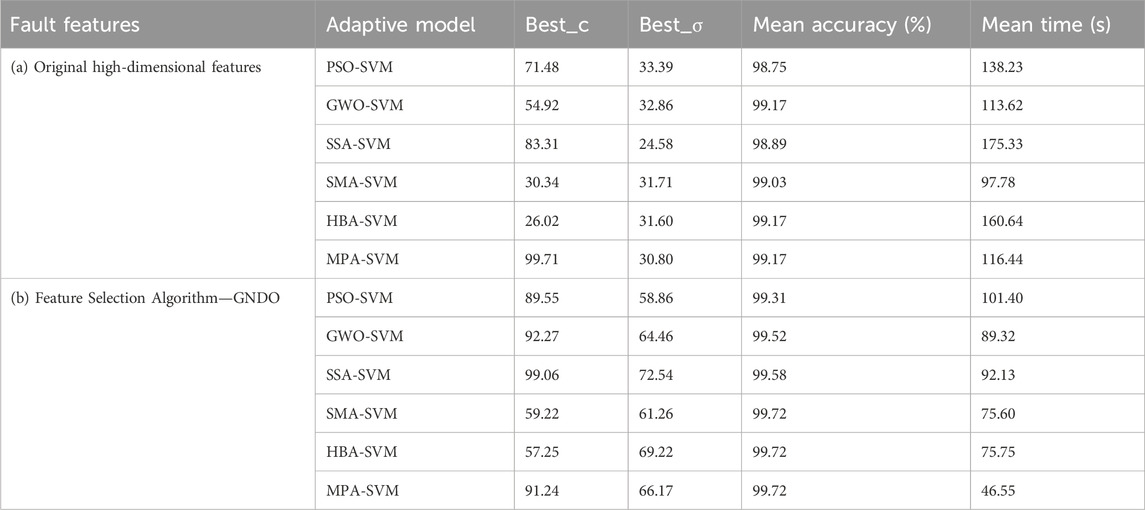
TABLE 5. Multi-channels reconstruction signal fault features and fault classification of different self-adaptive SVM classifiers.
6.2 Analysis of intelligent fault diagnosis for PU bearing datasets
To further validate the superiority of the proposed method, experiments are conducted on the PU datasets (as shown in Figure 12 for the fault diagnosis experimental platform). Experimental data is generated by installing rolling bearings of different damage types in the bearing test module. Bearing failures are divided into man-made damage and real damage. The real damaged bearings obtained from the acceleration life test bench were selected for the experiment. Bearing condition monitoring signals include vibration and current signals, where the vibration signal is sampled at a frequency of 64 KHz. In this analysis, the vibration signals were used to analyse the experimental data under the conditions of Rotational Speed of 1,500 rpm, Load Torque of 0.7 Nm, and Radial force of 1000N (Name of Setting: N15_M07_F10).
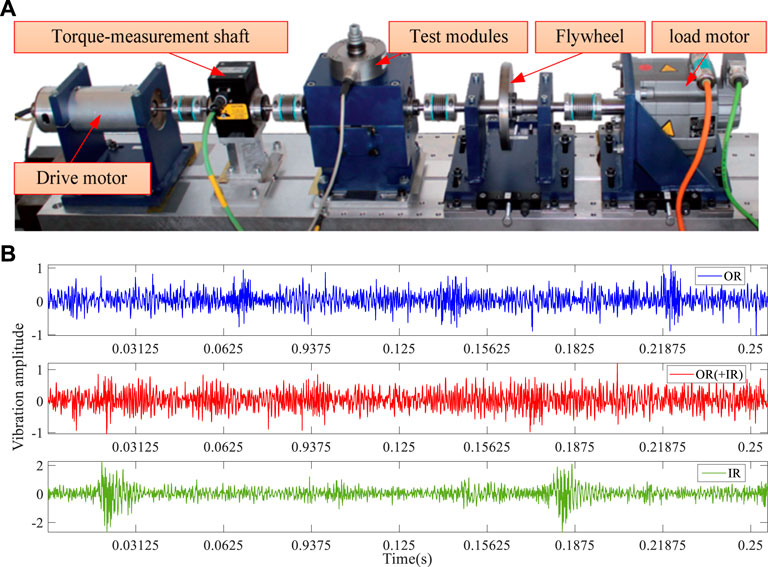
FIGURE 12. (A) Diagram of PU rolling bearing fault simulation experimental device, (B) vibration signal waveform diagram.
The real damage faults of 14 types of bearings were included in the experimental data, including 5 outer ring faults, 3 inner ring and outer ring composite faults, and 6 inner ring faults. The number of samples for various types of fault signals is 60 (including randomly cross-selected training samples 40 and testing samples 20, which were executed 20 times), a total of 840 sets of signals were collected, and the number of sampling points was 4,096. The detailed information is shown in Table 6.
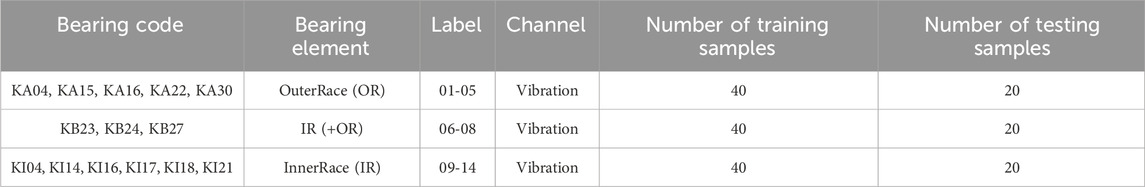
TABLE 6. Description of 14 working states of rolling bearing (Name of Setting: N15_M07_F10).
6.2.1 Comparison 1. Comparison of MVMD signal reconstruction and feature selection methods (for PU)
Similarly, using the same parameter settings of the previous section CWRU, MVMD decomposition and reconstruction of 14 types of fault vibration signals were carried out, and high-dimensional fault features of rolling bearings were extracted by MMDE. The proportion of components is also set to greater than 90%. Figure 13 shows the frequency domain plot for each IMF component of the raw data. It can be seen from the figure that the phenomenon of modal aliasing has been effectively avoided by MVMD. It is worth noting that selecting the first 4-dimensional IMF component with a large amplitude can better characterize the fault, and the rest is the interference component (which needs to be filtered out). The original vibration signal is reconstructed by the Comprehensive method, and then the fault features are extracted. Through sufficient experimental comparison and analysis, it can be concluded that the feature distribution of the reconstructed signal is significantly better than that of the original signal. However, it is still not possible to obtain any useful information related to faults (different operating conditions of rolling bearings). Therefore, the extracted original features are input into MPA-SVM for fault classification identification. To fully demonstrate the superiority of the MVMD signal reconstruction method in this paper, the other four methods are compared, and the detailed information is shown in Table 7 (a) Original high-dimensional features. The fault classification recognition rate of the proposed method is 100%, the operation time is 10.55 s, and the classification standard deviation is 0 (which also demonstrates that the stability of the classifier is good), which is better than other reconstruction methods. The MVMD signal reconstruction method based on Comprehensive can effectively reduce the noise of rolling bearing vibration signals, which is once again proved.
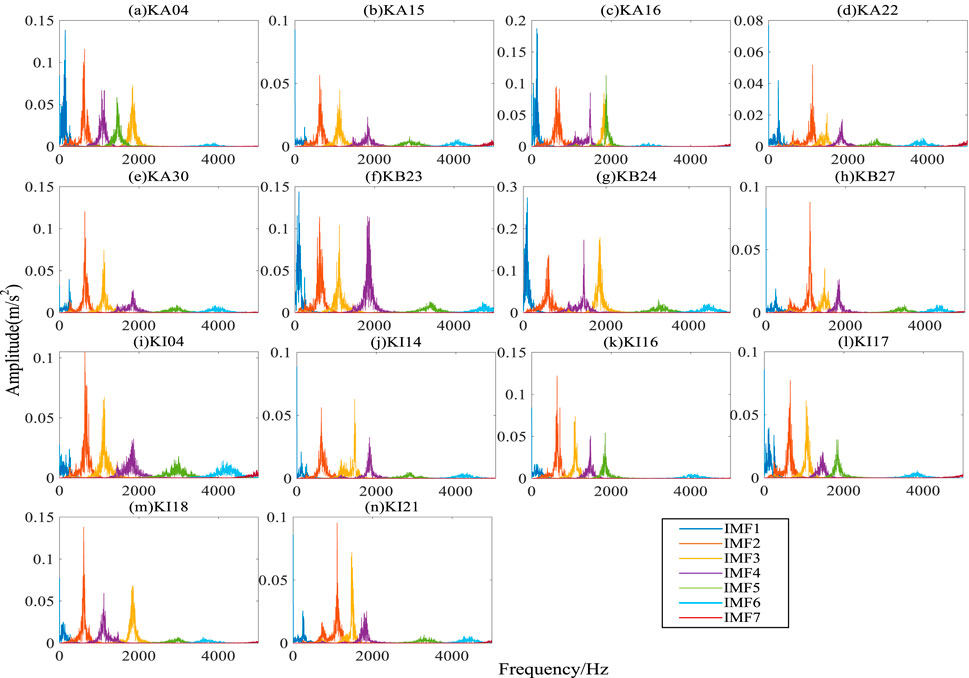
FIGURE 13. MVMD decomposition frequency domain diagram of each fault vibration signal.
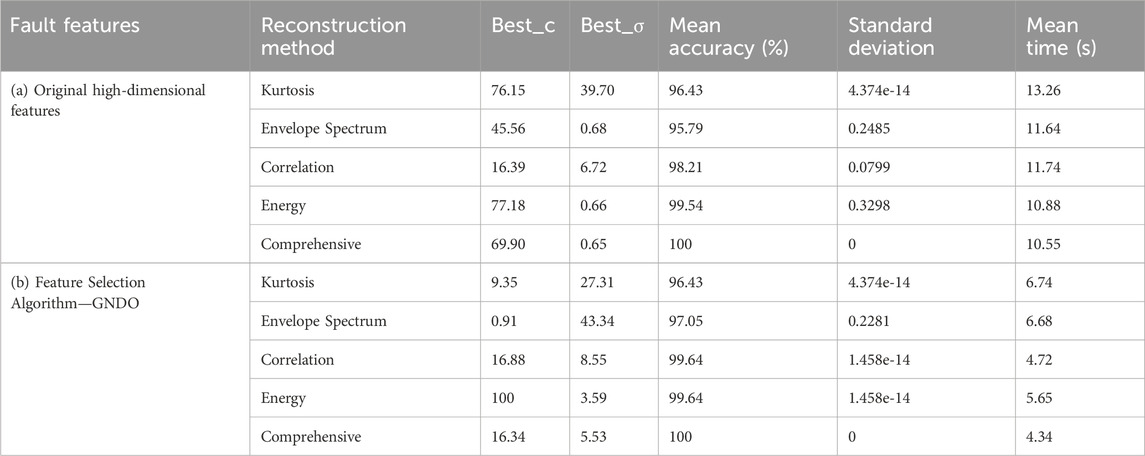
TABLE 7. Comparison of fault diagnosis indexes of different signal denoising and reconstruction methods (MPA-SVM).
However, due to the high feature dimension of rolling bearing faults, the operation efficiency of the MPA-SVM classifier is greatly reduced. Similarly, feature selection is made using GNDO (all parameter settings are consistent with the previous section). Finally, the optimal and low-dimensional fault features are input into MPA-SVM for identification. As shown in Table 7 (b) Feature Selection Algorithm—GNDO, the fault classification operation time is reduced by 6.21 s, 5.23 s, 7.02 s, 4.96 s, and 6.52 s, respectively, and the standard deviation of classification is still 0, and the efficiency is significantly improved. Therefore, the GNDO method can effectively extract sensitive features in the high-dimensional fault features based on MMDE.
By comparing with 9 methods, including EO (E4, E9, E12, E13, E15, E18, E19, E20), MRFO (E2, E5, E8, E9, E11, E12, E15, E16, E17, E20), GWO (E1, E2, E4, E9, E10, E20), ASO (E1, E2, E4, E8, E10, E11, E20), MPA (E1, E3, E4, E10, E20), SMA (E8, E9, E13, E15, E18, E19, E20), PSO (E1, E5, E8, E10, E12, E15, E20), HHO (E4, E5, E6, E8, E10, E14, E15, E20), and BOA (E1, E2, E4, E6, E7, E8), the superiority of the GNDO method is demonstrated. The fault feature subset dimension selected by GNDO is 7, which are as follows: E1, E2, E3, E5, E6, E10, E11. With the same parameter settings as the CWRU datasets, Figure 14 shows the MMDE mean distribution curve for faults under different operating conditions. By comparing Figures 14A, B with Figures 14C, D, it can be intuitively seen that the degree of aliasing of the preferred low-dimensional fault features of GNDO is significantly weaker than that of the original fault features (high-dimensional). Pattern recognition is performed by using the input of the respective low-dimensional feature subsets to the self-adaptive classifier (MPA-SVM). In terms of average classification recognition accuracy, the GNDO method is 3.57%, 1.21%, 1.87%, 2.86%, 0.43%, 5.41%, 3.41%, 4.25% and 0.84% higher, respectively. Compared with the standard deviation of classification, it also fully reflects stability. Once again, GNDO is significantly superior to other methods, as detailed in Table 8 for comparison.
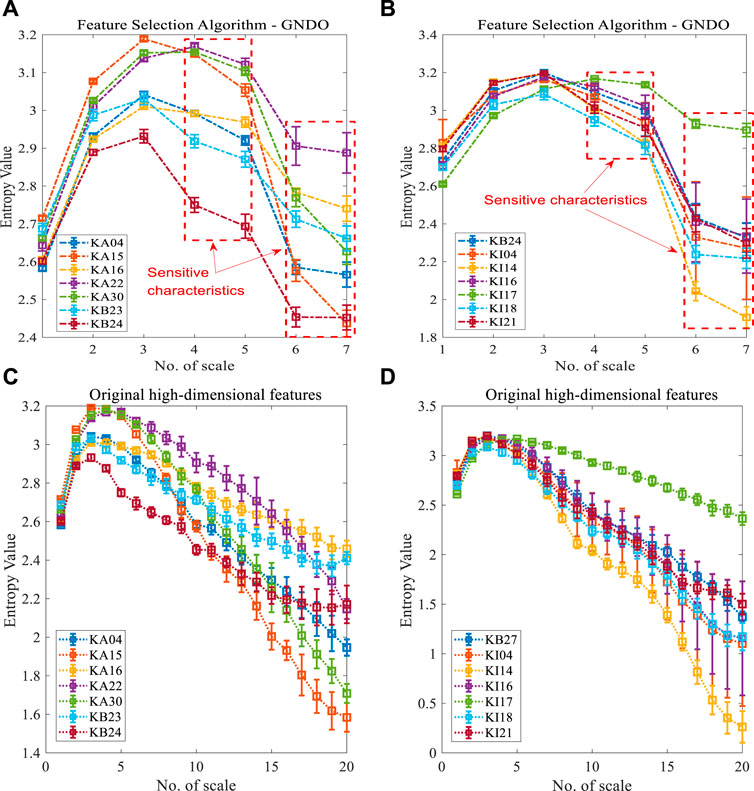
FIGURE 14. The mean distribution of different Scale entropy in various states [(A) The top 7 types of fault features selected using GNDO feature selection, (B) The remaining 7 types of fault features selected using GNDO feature selection, (C) The original high-dimensional features of the first 7 types of faults, (D) The original high-dimensional features of the remaining 7 types of faults)].
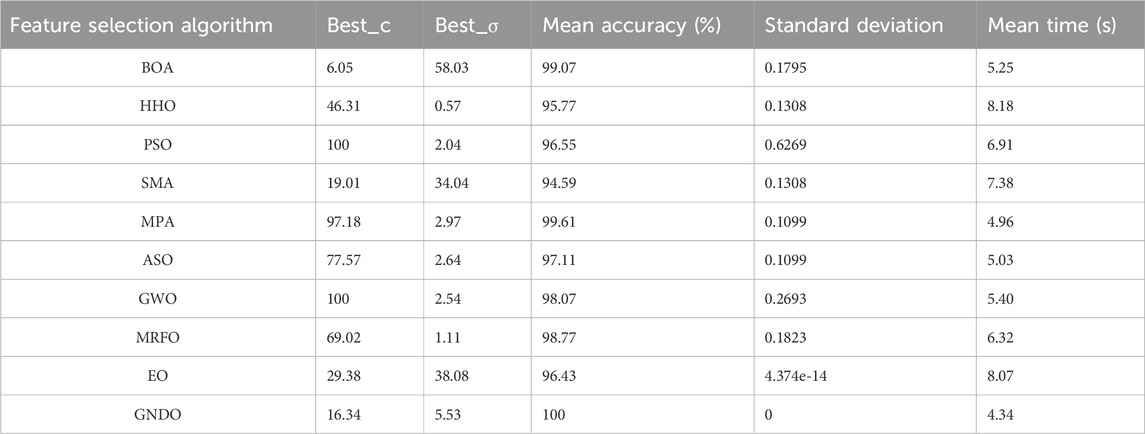
TABLE 8. Fault diagnosis results of different feature selection methods (MPA-SVM).
6.2.2 Comparison 2. Comparison of self-adaptive SVM classifiers (for PU)
After signal reconstruction based on MVMD and fault feature extraction and selection based on MMDE-GNDO, the optimal and low dimensional feature subset (7 * 840) was obtained. Then, the MPA algorithm is used to optimize the SVM, and the key parameters are obtained: (
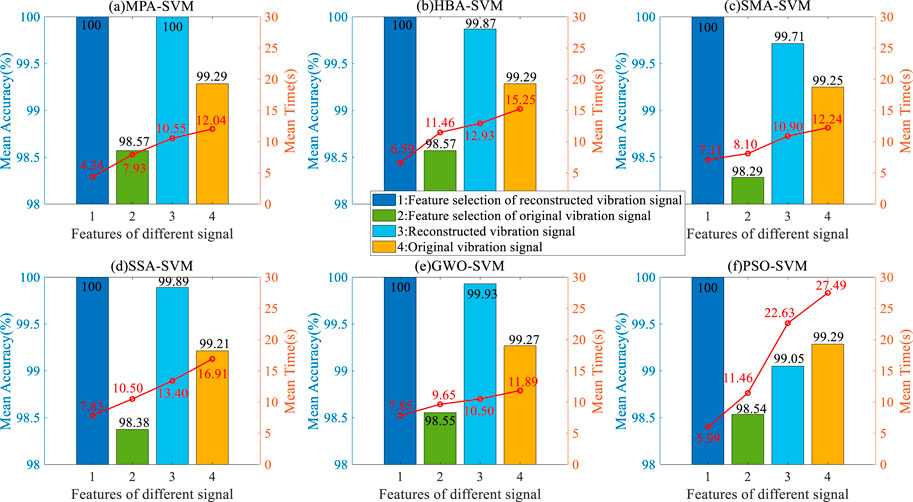
FIGURE 15. Comparison of fault classification for different types of signals and different self-adaptive SVMs.
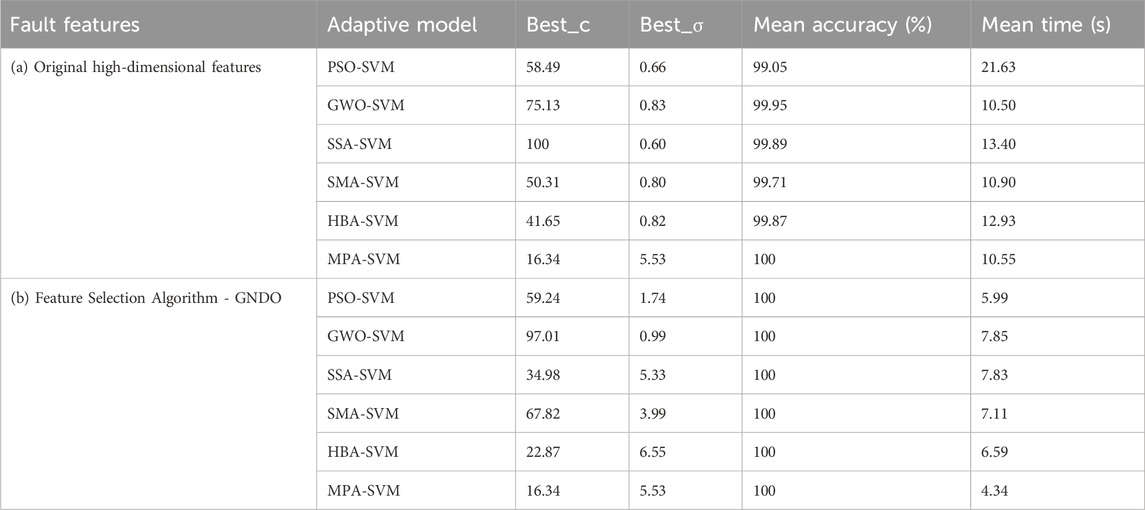
TABLE 9. Multi-channels reconstruction signal fault features and fault classification of different self-adaptive SVM classifiers.
At the same time, five MVMD signal reconstruction methods are compared and analysed by each classifier, as shown in Figure 16. As can be seen from the figure, the experimental results are almost consistent with the previous section. The classification effect based on the Comprehensive method is the best. Similarly, the operation time of MPA-SVM is 4.34 s, 7.11 s, 7.83 s, 7.85 s, and 5.99 s, all of which are superior to other classifiers. In addition, it can also fully demonstrate the practicality and universality of Comprehensive MVMD signal noise reduction and reconstruction methods.
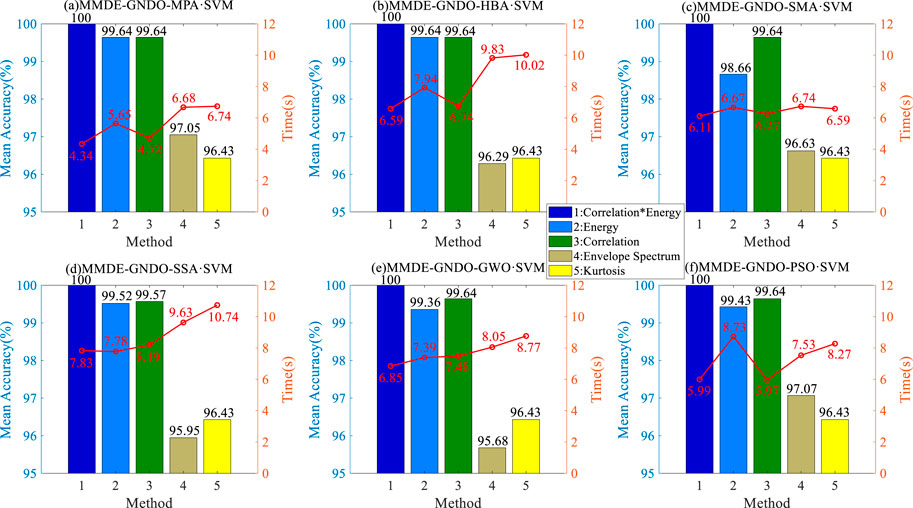
FIGURE 16. Comparison of noise reduction and reconstruction methods for different types of signals and fault classification using different self-adaptive SVMs.
7 Conclusion
In this paper, a method based on MVMD signal reconstruction, MMDE-GNDO, and MPA-SVM is proposed for fault diagnosis of rolling bearings. This method combines the advantages of MVMD in multi-channel vibration signal decomposition, joint evaluation function (Comprehensive) in signal noise reduction and reconstruction, MMDE in multivariate feature extraction, GNDO in feature optimization, and MPA-SVM in pattern recognition. Through extensive experimental analysis, the results have confirmed the effectiveness and superiority of the proposed method compared to existing methods. This method can achieve the highest classification recognition rate with as few samples as possible, which is to some extent superior to deep learning methods. The main conclusions are summarized in the following three aspects:
(1) The proposed multi-signal noise reduction and reconstruction method can realize multi-channel signal decomposition by using MVMD on the one hand. On the other hand, the joint evaluation function can be effectively used to filter out the noise in the vibration signal, to realize multi-channel signal reconstruction. Compared with the existing classical methods (Energy, Correlation, Envelope Spectrum, Kurtosis), it has a better noise reduction effect, and can retain the signal IMF component that is conducive to fault classification as much as possible.
(2) On the one hand, the proposed MMDE-GNDO method can realize feature extraction from multivariate reconstruction signals and obtain a rich set of high-dimensional fault features. On the other hand, redundant (or noisy) information can be removed from the high-dimensional feature set, and the most sensitive and easily classifiable low-dimensional feature set can be obtained. Compared with other methods (9 methods such as EO, MRFO, GWO, etc.), the proposed GNDO method provides better feature optimization performance and higher fault diagnosis accuracy.
(3) The proposed MPA-SVM classifier can adaptively select the pattern recognition parameters of data samples (
However, the classification performance of this method will need further improvement under time-varying speed conditions. Meanwhile, in future research, we plan to compare and analyse the proposed adaptive SVM classifier with new methods such as adaptive CatBoost, adaptive LightGBM, and adaptive XGBoost, etc. By introducing computational effort, and complexity and applying it to other types of equipment faults (such as gearboxes, motors, one-way valves, etc.), strengthens comparison to determine its effectiveness and universality.
Data availability statement
The raw data supporting the conclusion of this article will be made available by the authors, without undue reservation.
Author contributions
MM: Conceptualization, Formal Analysis, Funding acquisition, Investigation, Methodology, Software, Writing–original draft. CZ: Conceptualization, Project administration, Resources, Writing–review and editing. BX: Supervision, Validation, Writing–review and editing. DL: Supervision, Validation, Writing–review and editing. JY: Validation, Writing–review and editing. SL: Data curation, Writing–original draft. YL: Data curation, Visualization, Writing–original draft. TT: Data curation, Writing–original draft.
Funding
The authors declare financial support was received for the research, authorship, and/or publication of this article. The Project of Quzhou Science and Technology Plan (Nos. 2021K31 and 2020014), General Scientific Research Project Funding from Zhejiang Provincial Department of Education (Y202353293), the National Natural Science Foundation of China (No. 62363036), the PhD research startup foundation of Yunnan Normal University (No. 01000205020503131), Fundamental Research Program of Yunnan Province (No. 202201AU070055), Yunnan Fundamental Research Projects (No. 202301AT070256), Baoshan Xingbao Young Talent Training Project (No. 202303), The10th batches of Baoshan young and middle-aged leaders training project in academic and technical (202109).
Acknowledgments
The author sincerely thanks the team for their guidance, and thanks the Case West Reserve University and Paderborn University for their bearing datasets and check valve datasets. The author sincerely expresses thanks to the reviewers for taking the time to review the paper in a busy schedule.
Conflict of interest
Author BX was employed by the company Shimge Pump Industry (Zhejiang) Co., Ltd.
The remaining authors declare that the research was conducted in the absence of any commercial or financial relationships that could be construed as a potential conflict of interest.
Publisher’s note
All claims expressed in this article are solely those of the authors and do not necessarily represent those of their affiliated organizations, or those of the publisher, the editors and the reviewers. Any product that may be evaluated in this article, or claim that may be made by its manufacturer, is not guaranteed or endorsed by the publisher.
References
1. Wang Y, Yang M, Li Y, Xu Z, Wang J, Fang X. A multi-input and multi-task convolutional neural network for fault diagnosis based on bearing vibration signal. IEEE Sensors J (2021) 21:10946–56. doi:10.1109/jsen.2021.3061595
2. Zhou S, Lu Y, Bao D, Wang K, Shan J. Real-time data-driven fault diagnosis of proton exchange membrane fuel cell system based on binary encoding convolutional neural network. Int J Hydrogen Energ (2022) 47:10976–89. doi:10.1016/j.ijhydene.2022.01.145
3. Zheng X, Tang YY, Zhou J. A framework of adaptive multiscale wavelet decomposition for signals on undirected graphs. IEEE Trans Signal Process (2019) 67(7):1696–711. doi:10.1109/tsp.2019.2896246
4. Milovanović M, Tomić BM, Saulig N. Wavelets and stochastic theory: past and future. Solitons and Fractals (2023) 173:113724. doi:10.1016/j.chaos.2023.113724
5. Pan H, Liang Z, Lu J, Tu K, Xie N. Nonlocal low rank regularization method for fractal image coding under salt-and-pepper noise. Fractals (2023) 31(07):2350076. doi:10.1142/s0218348x23500767
6. Guido RC, Pedroso F, Contreras RC, Rodrigues LC, Guariglia E, Neto JS. Introducing the Discrete Path Transform (DPT) and its applications in signal analysis, artefact removal, and spoken word recognition. Digital Signal Process. (2021) 117:103158. doi:10.1016/j.dsp.2021.103158
7. Han S, Feng Z. Deep subclass alignment transfer network based on time-frequency features for intelligent fault diagnosis of planetary gearboxes under time-varying speeds. Meas Sci Tech (2022) 33(10):105010. doi:10.1088/1361-6501/ac7b14
8. Lv Y, Zhao W, Zhao Z, Li W, Ng KK. Vibration signal-based early fault prognosis: status quo and applications. Adv Eng Inform (2022) 52:101609. doi:10.1016/j.aei.2022.101609
9. Li MW, Xu DY, Geng J, Hong WC. A ship motion forecasting approach based on empirical mode decomposition method hybrid deep learning network and quantum butterfly optimization algorithm. Nonlinear Dyn (2022) 107:2447–67. doi:10.1007/s11071-021-07139-y
10. Ali M, Prasad R, Xiang Y, Jamei M, Yaseen ZM. Ensemble robust local mean decomposition integrated with random forest for short-term significant wave height forecasting. Renew Energ (2023) 205:731–46. doi:10.1016/j.renene.2023.01.108
11. Kumar A, Berrouche Y, Zimroz R, Vashishtha G, Chauhan S, Gandhi C, et al. Non-parametric Ensemble Empirical Mode Decomposition for extracting weak features to identify bearing defects. Measurement (2023) 211:112615. doi:10.1016/j.measurement.2023.112615
12. Wang L, Liu Z, Miao Q, Zhang X. Time-frequency analysis based on ensemble local mean decomposition and fast kurtogram for rotating machinery fault diagnosis. Mech Syst Signal Process (2018) 103:60–75. doi:10.1016/j.ymssp.2017.09.042
13. Yang L, Su H, Zhong C, Meng Z, Luo H, Li X, et al. Hyperspectral image classification using wavelet transform-based smooth ordering. Int J Wavelets, Multiresolution Inf Process (2019) 17(06):1950050. doi:10.1142/s0219691319500504
14. Ni C, Peng W. An integrated approach using empirical wavelet transform and a convolutional neural network for wave power prediction. Ocean Eng (2023) 276:114231. doi:10.1016/j.oceaneng.2023.114231
15. Dragomiretskiy K, Zosso D. Variational mode decomposition. IEEE Trans Signal Process (2014) 62(3):531–44. doi:10.1109/tsp.2013.2288675
16. Li H, Wu X, Liu T, Li S, Zhang B, Zhou G, et al. Composite fault diagnosis for rolling bearing based on parameter-optimized VMD. Measurement (2022) 201:111637. doi:10.1016/j.measurement.2022.111637
17. Rayi VK, Mishra SP, Naik J, Dash P. Adaptive VMD based optimized deep learning mixed kernel ELM autoencoder for single and multistep wind power forecasting. Energy (2022) 244:122585. doi:10.1016/j.energy.2021.122585
18. Zhou X, Li Y, Jiang L, Zheng F, Zhao J, Zhao L. A case report of right atrial epithelioid hemangioendothelioma with multiple pulmonary metastases. Measurement (2020) 14:173–8. doi:10.1111/crj.13121
19. Junior RFR, dos Santos Areias IA, Campos MM, Teixeira CE, da Silva LEB, Gomes GF. Fault detection and diagnosis in electric motors using 1d convolutional neural networks with multi-channel vibration signals. Measurement (2022) 190:110759. doi:10.1016/j.measurement.2022.110759
20. Tripathy RK, Gajbhiye P, Acharya UR. Automated sleep apnea detection from cardio-pulmonary signal using bivariate fast and adaptive EMD coupled with cross time-frequency analysis. Comput Biol Med (2020) 120. doi:10.1016/j.compbiomed.2020.103769
21. Huang Y, Hasan N, Deng C, Bao Y. Multivariate empirical mode decomposition-based hybrid model for day-ahead peak load forecasting. Energy (2022) 239:122245. doi:10.1016/j.energy.2021.122245
22. ur Rehman N, Aftab H. Multivariate variational mode decomposition. IEEE Trans signal Process (2019) 67:6039–52. doi:10.1109/tsp.2019.2951223
23. Meng A, Zhu Z, Deng W, Ou Z, Lin S, Wang C, et al. A novel wind power prediction approach using multivariate variational mode decomposition and multi-objective crisscross optimization based deep extreme learning machine. Energy (2022) 260:124957. doi:10.1016/j.energy.2022.124957
24. Gao J, Yuan H, Yang A, Rong M, Dai R, Peng Z, et al. A failure detection method based on multivariate variational mode decomposition and skewness for modular DC circuit breakers. Int J Electr Power Energ Syst (2023) 148:108972. doi:10.1016/j.ijepes.2023.108972
25. Song Q, Jiang X, Du G, Liu J, Zhu Z. Smart multichannel mode extraction for enhanced bearing fault diagnosis. Mech Syst Signal Process (2023) 189:110107. doi:10.1016/j.ymssp.2023.110107
26. Zhao D, Liu S, Du H, Wang L, Miao Z. Deep branch attention network and extreme multi-scale entropy based single vibration signal-driven variable speed fault diagnosis scheme for rolling bearing. Adv Eng Inform (2023) 55:101844. doi:10.1016/j.aei.2022.101844
27. Song H, Yuan R, Lv Y, Pan H, Yang X. Improved 2-D multiscale fractional dispersion entropy: a novel health condition indicator for Fault Diagnosis of rolling bearings. IEEE Sensors J (2023) 24:3431–44. doi:10.1109/jsen.2023.3343399
28. Rostaghi M, Khatibi MM, Ashory MR, Azami H. Fuzzy dispersion entropy: a nonlinear measure for signal analysis. IEEE Trans Fuzzy Syst (2021) 30(9):3785–96. doi:10.1109/tfuzz.2021.3128957
29. Tan H, Xie S, Liu R, Cheng J, Jing K. Fatigue condition diagnosis of rolling bearing based on normalized balanced multiscale sample entropy. Int J Fatigue (2023) 172:107642. doi:10.1016/j.ijfatigue.2023.107642
30. Li Y, Wang S, Yang Y, Deng Z. Multiscale symbolic fuzzy entropy: an entropy denoising method for weak feature extraction of rotating machinery. Mech Syst Signal Process (2022) 162:108052. doi:10.1016/j.ymssp.2021.108052
31. Zhang X, Zhang M, Wan S, He Y, Wang X. A bearing fault diagnosis method based on multiscale dispersion entropy and GG clustering. Measurement (2021) 185:110023. doi:10.1016/j.measurement.2021.110023
32. Li Y, Guo Z, Li Z, Deng Z, Noman K. Instantaneous angular speed based Fault Diagnosis of multi cylinder marine diesel engine using intrinsic multiscale dispersion entropy. IEEE Sensors J (2023) 23:9523–35. doi:10.1109/jsen.2023.3257832
33. Zhou X, Li Y, Jiang L, Zhou L. Fault feature extraction for rolling bearings based on parameter-adaptive variational mode decomposition and multi-point optimal minimum entropy deconvolution. Meas (2021) 173:108469. doi:10.1016/j.measurement.2020.108469
34. Zhang B, Miao Y, Lin J, Li H. Weighted envelope spectrum based on the spectral coherence for bearing diagnosis. ISA Trans (2022) 123:398–412. doi:10.1016/j.isatra.2021.05.012
35. Kafantaris E, Lo TYM, Escudero J. Stratified multivariate multiscale dispersion entropy for physiological signal analysis. IEEE Trans Biomed Eng (2022) 70:1024–35. doi:10.1109/tbme.2022.3207582
36. Li G, Hou Y, Yang H. A novel method for frequency feature extraction of ship radiated noise based on variational mode decomposition, double coupled Duffing chaotic oscillator and multivariate multiscale dispersion entropy. Alexandria Eng J (2022) 61:6329–47. doi:10.1016/j.aej.2021.11.059
37. Ma Y, Cheng J, Wang P, Yang Y. A new rotating machinery fault diagnosis method for different speeds based on improved multivariate multiscale fuzzy distribution entropy. Nonlinear Dyn (2023) 111:16895–919. doi:10.1007/s11071-023-08609-1
38. Zhou J, Yang Y, Li X, Wang H, Sun Z, Zhu X, et al. Serum amyloid P component level is associated with clinical response to escitalopram treatment in patients with major depressive disorder. Mechanism Machine Theor Dyn Machine Syst Gears Power Trandmissions Robots Manipulator Syst Computer-Aided Des Methods (2022) 146(172-):172–8. doi:10.1016/j.jpsychires.2021.12.051
39. Zhang Y, Jin Z, Mirjalili S. Generalized normal distribution optimization and its applications in parameter extraction of photovoltaic models. Energ Convers Manag (2020) 224:113301. doi:10.1016/j.enconman.2020.113301
40. Hu Y, Zhang Y, Gao X, Gong D, Song X, Guo Y, et al. A federated feature selection algorithm based on particle swarm optimization under privacy protection. Knowledge-Based Syst (2023) 260:110122. doi:10.1016/j.knosys.2022.110122
41. Pan H, Chen S, Xiong H. A high-dimensional feature selection method based on modified Gray Wolf Optimization. Appl Soft Comput (2023):110031. doi:10.1016/j.asoc.2023.110031
42. Got A, Moussaoui A, Zouache D. Hybrid filter-wrapper feature selection using Whale Optimization Algorithm: a Multi-Objective approach. Expert Syst Appl (2021) 183:115312. doi:10.1016/j.eswa.2021.115312
43. Guo T, Yu K, Aloqaily M, Wan S. Constructing a prior-dependent graph for data clustering and dimension reduction in the edge of AIoT. Future Generation Comp Syst (2022) 128:381–94. doi:10.1016/j.future.2021.09.044
44. Zhao W, Wang L, Zhang Z. Atom search optimization and its application to solve a hydrogeologic parameter estimation problem. Knowledge-Based Syst (2019) 163:283–304. doi:10.1016/j.knosys.2018.08.030
45. Ma BJ, Pereira JLJ, Oliva D, Liu S, Kuo Y. Manta ray foraging optimizer-based image segmentation with a two-strategy enhancement. Knowledge-Based Syst (2023):110247. doi:10.1016/j.knosys.2022.110247
46. Hu J, Gui W, Heidari AA, Cai Z, Liang G, Chen H, et al. Dispersed foraging slime mould algorithm: continuous and binary variants for global optimization and wrapper-based feature selection. Knowledge-Based Syst (2022) 237:107761. doi:10.1016/j.knosys.2021.107761
47. Pan H, Xu H, Zheng J, Su J, Tong J. Multi-class fuzzy support matrix machine for classification in roller bearing fault diagnosis. Adv Eng Inform (2022) 51:101445. doi:10.1016/j.aei.2021.101445
48. He K, Yu D, Wang D, Chai M, Lei S, Zhou C. Graph attention network-based fault detection for UAVs with multivariant time series flight data. IEEE Trans Instrumentation Meas (2022) 71:1–13. doi:10.1109/tim.2022.3219489
49. Liu X, Lei Y, Li N, Si X, Li X. RUL prediction of machinery using convolutional-vector fusion network through multi-feature dynamic weighting. Mech Syst Signal Process (2023) 185:109788. doi:10.1016/j.ymssp.2022.109788
50. Zhou K, Diehl E, Tang J. Deep convolutional generative adversarial network with semi-supervised learning enabled physics elucidation for extended gear fault diagnosis under data limitations. Mech Syst Signal Process (2023) 185:109772. doi:10.1016/j.ymssp.2022.109772
51. Li X, Jiang H, Xie M, Wang T, Wang R, Wu Z. A reinforcement ensemble deep transfer learning network for rolling bearing fault diagnosis with Multi-source domains. Adv Eng Inform (2022) 51:101480. doi:10.1016/j.aei.2021.101480
52. Vos K, Peng Z, Jenkins C, Shahriar MR, Borghesani P, Wang W. Vibration-based anomaly detection using LSTM/SVM approaches. Mech Syst Signal Process (2022) 169:108752. doi:10.1016/j.ymssp.2021.108752
53. Li E, Zhou J, Shi X, Jahed Armaghani D, Yu Z, Chen X, et al. Developing a hybrid model of salp swarm algorithm-based support vector machine to predict the strength of fiber-reinforced cemented paste backfill. Eng Comput (2021) 37:3519–40. doi:10.1007/s00366-020-01014-x
54. Wen L, Cao Y. A hybrid intelligent predicting model for exploring household CO2 emissions mitigation strategies derived from butterfly optimization algorithm. Sci Total Environ (2020) 727:138572. doi:10.1016/j.scitotenv.2020.138572
55. Shao K, Fu W, Tan J, Wang K. Coordinated approach fusing time-shift multiscale dispersion entropy and vibrational Harris hawk’s optimization-based SVM for fault diagnosis of rolling bearing. Measurement (2020) 173:108580. doi:10.1016/j.measurement.2020.108580
56. Wang Z, Yao L, Cai Y, Zhang J. Mahalanobis semi-supervised mapping and beetle antennae search based support vector machine for wind turbine rolling bearings fault diagnosis. Renew Energ (2020) 155:1312–27. doi:10.1016/j.renene.2020.04.041
57. Faramarzi A, Heidarinejad M, Mirjalili S, Gandomi AH. Marine predators algorithm: a nature-inspired metaheuristic. Expert Syst Appl (2020) 152:113377. doi:10.1016/j.eswa.2020.113377
58. Chen X, Qi X, Wang Z, Cui C, Wu B, Yang Y. Fault diagnosis of rolling bearing using marine predators’ algorithm-based support vector machine and topology learning and out-of-sample embedding. Measurement (2021) 176:109116. doi:10.1016/j.measurement.2021.109116
59. Ikram RMA, Ewees AA, Parmar KS, Yaseen ZM, Shahid S, Kisi O. The viability of extended marine predators’ algorithm-based artificial neural networks for streamflow prediction. Appl Soft Comput (2022) 131:109739. doi:10.1016/j.asoc.2022.109739
60. Yousri D, Elaziz MA, Oliva D, Abraham A, Alotaibi MA, Hossain MA. Fractional-order comprehensive learning marine predators’ algorithm for global optimization and feature selection. Knowledge-based Syst (2022)(Jan.10) 235. doi:10.1016/j.knosys.2021.107603
61. Jamei M, Ali M, Karbasi M, Sharma E, Chu X, Yaseen ZM. A high dimensional features-based cascaded forward neural network coupled with MVMD and Boruta-GBDT for multi-step ahead forecasting of surface soil moisture. Eng Appl Artif Intelligence (2023) 120:105895. doi:10.1016/j.engappai.2023.105895
62. Zhang Y, Zhang H, Yang Y, Liu N, Gao J. Seismic random noise separation and attenuation based on MVMD and MSSA. IEEE Trans Geosci Remote Sensing (2021) 60:1–16. doi:10.1109/tgrs.2021.3131655
63. Song Q, Jiang X, Wang S, Guo J, Huang W, Zhu Z. Self-adaptive multivariate variational mode decomposition and its application for bearing fault diagnosis. IEEE Trans Instrumentation Meas (2022) 71:1–13. doi:10.1109/tim.2021.3139660
64. Zhou F, Han J, Yang X. Multivariate hierarchical multiscale fluctuation dispersion entropy: applications to fault diagnosis of rotating machinery. Appl Acoust (2021) 182:108271. doi:10.1016/j.apacoust.2021.108271
65. Ahmed S, Sheikh KH, Mirjalili S, Sarkar R. Binary simulated normal distribution optimizer for feature selection: theory and application in COVID-19 datasets. Expert Syst Appl (2022) 200:116834. doi:10.1016/j.eswa.2022.116834
66. Lao Z, He D, Wei Z, Shang H, Jin Z, Miao J, et al. Intelligent fault diagnosis for rail transit switch machine based on adaptive feature selection and improved LightGBM. Eng Fail Anal (2023) 148:107219. doi:10.1016/j.engfailanal.2023.107219
67. Tang S, Zhu Y, Yuan S. A novel adaptive convolutional neural network for fault diagnosis of hydraulic piston pump with acoustic images. Adv Eng Inform (2022) 52:101554. doi:10.1016/j.aei.2022.101554
68. Chi Y, Dong Y, Wang J, Yu FR, Leung VCM. Knowledge-based fault diagnosis in industrial Internet of Things: a survey. IEEE Internet Things J (2022) 9:12886–900. doi:10.1109/JIOT.2022.3163606
69. Loparo KA. Bearings vibration dataset (2023). Available at: http://csegroups.case.edu/bearingdatacenter/pages/download-data-file.
70. Lessmeier C, Kimotho JK, Zimmer D, Sextro W. Condition monitoring of bearing damage in electromechanical drive systems by using motor current signals of electric motors: a benchmark data set for data-driven classification. In: European Conference of the Prognostics and Health Management Society; 5-8 July 2016; Bilbao, Spain (2016).
Keywords: multivariate variational mode decomposition, multivariate multiscale dispersion entropy, generalized normal distribution optimization, marine predators’ algorithm-based optimization support vector machine, joint evaluation function, fault diagnosis
Citation: Mao M, Zhou C, Xu B, Liao D, Yang J, Liu S, Li Y and Tang T (2024) Fault diagnosis method using MVMD signal reconstruction and MMDE-GNDO feature extraction and MPA-SVM. Front. Phys. 12:1301035. doi: 10.3389/fphy.2024.1301035
Received: 24 September 2023; Accepted: 25 January 2024;
Published: 28 February 2024.
Edited by:
Emanuel Guariglia, São Paulo State University, BrazilReviewed by:
Changqing Cheng, Binghamton University, United StatesSripathy Budhi, VIT University, India
Copyright © 2024 Mao, Zhou, Xu, Liao, Yang, Liu, Li and Tang. This is an open-access article distributed under the terms of the Creative Commons Attribution License (CC BY). The use, distribution or reproduction in other forums is permitted, provided the original author(s) and the copyright owner(s) are credited and that the original publication in this journal is cited, in accordance with accepted academic practice. No use, distribution or reproduction is permitted which does not comply with these terms.
*Correspondence: Chengjiang Zhou, Y2hlbmdqaWFuZ3pob3VAZm94bWFpbC5jb20=; Jingzong Yang, eWppbmd6b25nQGZveG1haWwuY29t