 Xu Zhang1,2†
 Qi-Xue Li1,2†Huan-Kai Zhang1,2Ji-Xun Liu1,2Guo-Chao Wang1,2Xiao-Xiao Ma1,2Ling-Xiao Zhu1,2*Shu-Hua Yan1,2*
- 1College of Intelligence Science and Technology, National University of Defense Technology, Changsha, Hunan, China
- 2Interdisciplinary Center for Quantum Information, National University of Defense Technology, Changsha, Hunan, China
The state preparation is a crucial procedure in atom interferometry; however, there is a shortage of detailed experimental studies on determining the optimal method for achieving this. This paper investigates and compares two methods for state preparation: the combined use of microwave and Raman light (M-R) and the combined use of optical pumping, microwave, and Raman light (O-M-W). The experimental results demonstrate that the M-R method improves the efficiency of Raman transitions for atom interference, which is helpful in enhancing the contrast of the interference fringes. The O-M-R method increases the quantity of prepared atoms, thereby enhancing the signal-to-noise ratio of the detected signals. This work helps provide a useful experimental basis and reference for researchers to design a suitable state preparation scheme.
1 Introduction
Atomic interferometers based on stimulated Raman transitions have become a powerful instrument with a wide range of applications over the past 30 years [1–3]. Due to high sensitivity, they are widely used in high-precision measurements of angular velocity [4, 5], gravity [6–9], gravitational gradient [10–12], fine-structure constant [13, 14], gravitational constant [15, 16], gravitational waves [17–19], and the test of equivalence principle [20, 21].
The measurement sensitivity of atomic interferometers significantly depends on the contrast of interference fringes, which is mainly influenced by the results of state preparation. There are two main reasons for this. First, the interference process is affected by the magnetic field, which shifts the atomic energy levels due to the Zeeman effect. The distribution of atoms in different magneton energy levels leads to a deterioration of the stripe contrast and a decrease in the measurement sensitivity. To minimize the effect of the magnetic field, the atoms should be prepared in a magnetically insensitive state. Second, even though the atomic groups have been cooled down with the temperature of several μK, it still has a certain velocity distribution width. This results in a different transition probability for each atom with various velocities when interacting with Raman light. This also leads to a lower fringe contrast [3]. In order to increase the contrast, it is better to select atoms with a narrower velocity distribution before the atomic interference procedure. Thus, the state preparation determines the number of effective atoms that would be involved in interference, which is one of the key procedures of atomic interferometers and also a crucial factor in the measurement sensitivity.
In previous studies, various methods of state preparation have been used. To make atoms magnetically insensitive, it is necessary to select the atoms in the
In this paper, we present detailed experiments and discussions on two state preparation methods. One method is a combination of microwave and Raman light, which is referred to as the M-R method. The other is a combination of optical pumping, microwave, and Raman, which is referred to as the O-M-R method. In Section 2, we analyzed the principles of state selection by microwave, Raman light, and optical pumping. In Section 3, we described the experimental setup and steps for M-R and O-M-R methods. Then, we compared the efficiency of the two methods for preparing atoms in the desired state, as well as the numbers and temperatures of atomic groups. In particular, to compare the effects of the two methods on the atom interferometry, with state-prepared atomic groups, we also tested the efficiency of the stimulated Raman transitions and the noise of atomic detection. In Section 4, we analyzed the scope of application and the selection basis of the two state preparation methods.
2 Methods
Our analysis is based on an 87Rb atomic interferometer, and the principles and ideas could be applied to other types of atomic interferometers. Typically, state preparation involves two steps: selection and blow-away. The selection refers to picking a portion of atoms to the target state, while the blow-away refers to removing undesired atoms from the atomic group.
For the state preparation by microwave or Raman light, the selection of the
In addition, stimulated Raman transitions can also select a narrower velocity distribution of atoms. Assume that the velocity distribution of atoms is Gaussian type and the Gaussian width is
where
However, the state preparation methods using microwave or Raman light require the removal of atoms in the
The blow-away step follows immediately after the selection. A laser beam in resonance with the
3 Experiment
3.1 Experimental setup
The experiments in this work are based on the 87Rb atomic interferometer, and its schematic diagram is shown in Figure 1. The three pairs of cooling light are counter-propagating, circularly polarized, and perpendicular to each other. The Raman light, repumping light, pumping light, and detection light are time-multiplexed in the vertical direction with linear polarization, and the blow-away light is horizontally orientated traveling wave. Both the microwave antenna and the beam expander of the blow-away light are mounted on the bottom of the magnetic-optical trap (MOT) chamber. The microwave signal is generated by a low-noise, highly integrated microwave source, and the pulse width of the microwave signal can be controlled by a transistor–transistor logic (TTL) signal. The power of the microwave signal is set to 27 dBm, and the frequency is set to ∼6.834 GHz. The microwave source is connected to a microwave antenna, and the orientation of the microwave antenna is adjusted so that the direction of the microwave magnetic vector is aligned with the direction of the quantization axis. The pumping light is linearly polarized and can be considered a synthesis of two circularly polarized lights, which can be achieved without introducing additional experimental setups. Before the state preparation, the atoms are cooled by the MOT and polarization gradient cooling (PGC) with the atomic number of ∼108 and the atomic temperature of approximately 2 μK.
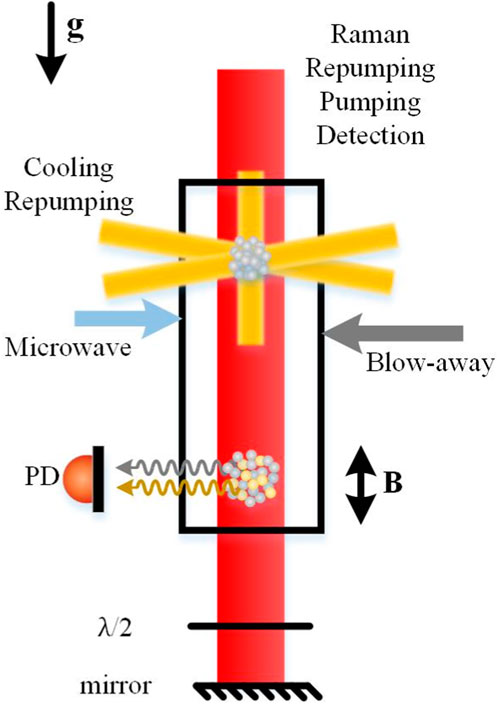
FIGURE 1. Schematic diagram of atom interferometry.
3.2 Experimental steps
We designed two state preparation methods for comparison. The timing diagram of the M-R method is shown in Figure 2A,and the process of state preparation is shown in Figure 2C. An extra 2-ms-long repumping light after PGC is remained to ensure atoms in the
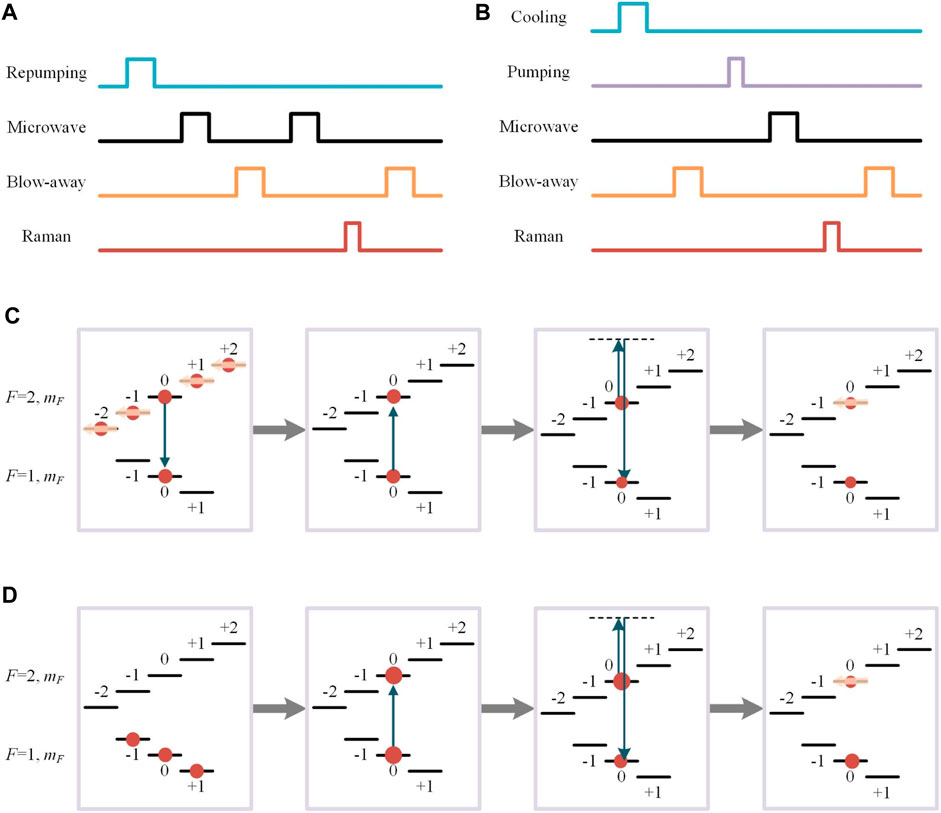
FIGURE 2. Schematic diagram of state preparation. (A) Timing diagram of the M-R method. (B) Timing diagram of the O-M-R method. (C) Process of state preparation by the M-R method. (D) Process of state preparation by the O-M-R method.
The timing diagram of the O-M-R method is shown in Figure 2B, and the process of state preparation is shown in Figure 2D. An extra 2-ms-long cooling light after PGC is remained to ensure atoms in the
The subsequent steps are the same in both state preparation timing sequences with different effects. Since the blow-away light in our experiment only acts on atoms in the
3.3 Experimental results
To compare the effects of the two state preparation methods, we analyze the experimental results after the action of microwave and Raman light, respectively. Figure 3A shows the Rabi oscillations driving by microwave after the first microwave π pulse in the M-R method (the dotted blue line) or the pumping light in the O-M-R method (the solid red line). The width of the microwave π pulse is approximately 400 μs. After the first microwave π pulse, the efficiency of the second microwave π pulse is about 96%, but after the pumping light, the efficiency of the microwave π pulse is about 87%. On one hand, this suggests that the efficiency of the microwave selected states is high. On the other hand, the transition efficiency driving by microwave after optical pumping is lower than that after microwave, suggesting that there may be residual atoms in other magneton energy levels after optical pumping. It is possible that the efficiency is related to the linear polarization degree of the pumping light. On one hand, we can improve the linear polarization of the pumping light by installing a linear polarizer, and on the other hand, we can improve the stability of polarization by improving the stability of temperature and humidity.
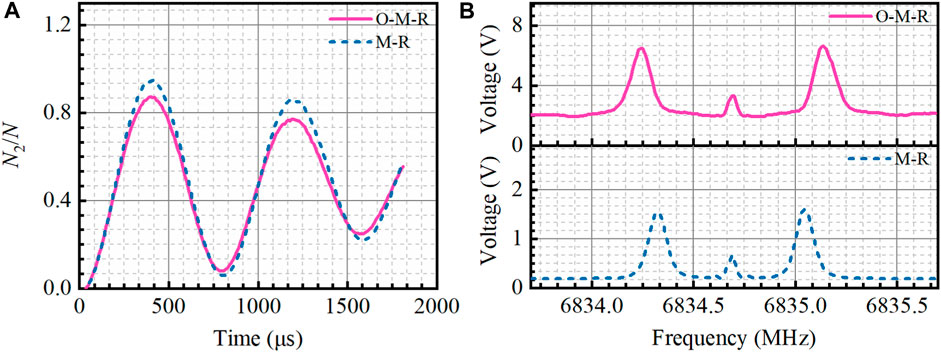
FIGURE 3. Rabi oscillations and Raman spectra during the state preparation. (A) Microwave Rabi oscillations after the first microwave π pulse in the M-R method (the dotted blue line) or the pumping light in the O-M-R method (the solid red line), where N2 is the number of atomic groups in the
The Raman spectra after two microwave π pulses in the M-R method (the dashed blue line) or the pumping light and microwave π pulse in the O-M-R method (the solid red line) are shown in Figure 3B. The duration of the microwave π pulse is much longer than that of the pumping light, resulting in different turn-on times of the Raman pulse. So, the peaks of two curves in the figure corresponding to different frequencies are due to the various Doppler detuning processes. The amplitude of the Raman spectrum corresponds to the number of atomic groups, which is 1.6 V and 6.6 V, respectively. The difference of amplitude demonstrates that the number of atoms obtained through the utilization of optical pumping is over four times greater than that of microwave. Since the atoms in the
After the state preparation, the effects on Raman transitions of two methods were compared by applying a Raman π pulse, the length of which is 15 μs. The testing results are shown in Figure 4A. The maximum transition efficiency displayed in the Raman spectra was 59% with the M-R method and 44% with the O-M-R method. The lower transition efficiency with the O-M-R method may be caused by spontaneous radiation, excited background vapor, and other unknown factors.
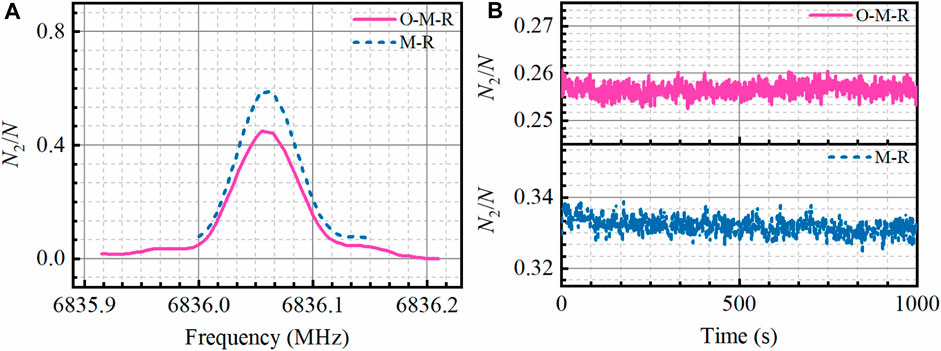
FIGURE 4. Raman spectra after the state preparation. (A) Raman spectra after state selection by the M-R method (the dashed blue line) or the O-M-R method (the solid red line), where N2 is the number of atomic groups in the
In addition, after the state preparation, a Raman π/2 pulse was added to compare the detection noise of two methods, as shown in Figure 4B. The standard deviations of the atom population ratio for the long-term tests were 0.0024 with the M-R method and 0.0014 with the O-M-R method. When measuring gravity, the noise of the atomic transition probability can be converted to the noise of the gravity measurement with the expression shown below:
where A is the amplitude of the interference fringe, keff is the effective wavevector, and T is the free evolution time. In particular, when the gravity measurement is performed in our atom interferometry with the free evolution time of 70 ms and the repetition frequency of 1 Hz, the amplitudes of interferometric fringes for those two methods are 0.2 and 0.15, respectively. Therefore, the gravity measurement noises (sensitivity) induced by detection are calculated to be 15.2 μGal/shot and 11.8 μGal/shot when the state preparation uses the M-R method and the O-M-R method, respectively. Thus, although the O-M-R method increases the number of atoms and reduces the detection noise, it also reduces the Raman transition efficiency, leading to a lower contrast of interference fringes.
Based on the results of all the above experiments, we considered suggestions of determining a suitable state preparation method for atom interferometry. If the number of atoms is sufficiently much and a better contrast of interference fringe is desired, the M-R method or its variants can be used as a preferred state preparation solution, and when a larger number of atoms is desired to reduce the detection noise, then the O-M-R method or its variants can be chosen.
4 Conclusion
In this paper, we have performed detailed experiments and analysis of two state preparation methods for atom interferometry. One is the M-R method, which is a combination of microwave and Raman light. The other is the O-M-R method, which is a combination of optical pumping, microwave, and Raman. The transition efficiency driven by the microwave π pulse in the M-R method is 96%, whereas the transition efficiency driven by the optical pumping light in the O-M-R method is approximately 87% with a temperature increase of 1.9 μK. The experimental results show that the M-R method enhances the efficiency of Raman transitions, which contributes to a higher contrast of interference fringes. The O-M-R method results in a significant increase in the number of atoms, which improves the signal-to-noise ratio of the detected signals. Therefore, the experimenter can select a more suitable method for state selection based on different experimental requirements to optimize the measurement. To achieve a better contrast of interference fringe when the number of atoms is sufficiently high, the M-R method can be chosen. Conversely, if the goal is to reduce detection noise and increase the number of atoms, the O-M-R method is preferred. The results and discussions presented above, which are based on the 87Rb systems, can also provide guidance for other alkali species.
Data availability statement
The original contributions presented in the study are included in the article/Supplementary Material; further inquiries can be directed to the corresponding authors.
Author contributions
XZ: writing–review and editing and writing–original draft. Q-XL: writing–review and editing and writing–original draft. H-KZ: writing–review and editing. J-XL: writing–review and editing. G-CW: writing–review and editing. X-XM: writing–review and editing. L-XZ: writing–review and editing. S-HY: writing–review and editing.
Funding
The author(s) declare that financial support was received for the research, authorship, and/or publication of this article. This work was supported by the National Natural Science Foundation of China (grant no. 12004428), the Natural Science Foundation for outstanding young of Hunan Province, China (grant no. 2021JJ20047), the China Postdoctoral Science Foundation (grant no. 2020M683729), and the Science Foundation of Hunan Province, China (grant no. 2021JJ30774).
Acknowledgments
The authors thank Yaning Wang for the meaningful advice and discussions.
Conflict of interest
The authors declare that the research was conducted in the absence of any commercial or financial relationships that could be construed as a potential conflict of interest.
Publisher’s note
All claims expressed in this article are solely those of the authors and do not necessarily represent those of their affiliated organizations, or those of the publisher, the editors, and the reviewers. Any product that may be evaluated in this article, or claim that may be made by its manufacturer, is not guaranteed or endorsed by the publisher.
References
1. Kasevich M, Chu S. Atomic interferometry using stimulated Raman transitions. Phys Rev Lett (1991) 67(2):181–4. doi:10.1103/physrevlett.67.181
2. Peters A, Chung KY, Young B, Hensley J, Chu S. Precision atom interferometry. Phil Trans R Soc Lond Ser A: Math Phys Eng Sci (1997) 355(1733):2223–33. doi:10.1098/rsta.1997.0121
3. Peters A, Chung KY, Chu S. High-precision gravity measurements using atom interferometry. Metrologia (2001) 38(1):25–61. doi:10.1088/0026-1394/38/1/4
4. Savoie D, Altorio M, Fang B, Sidorenkov L, Geiger R, Landragin A. Interleaved atom interferometry for high-sensitivity inertial measurements. Sci Adv (2018) 4(12):eaau7948. doi:10.1126/sciadv.aau7948
5. Avinadav C, Yankelev D, Shuker M, Firstenberg O, Davidson N. Rotation sensing with improved stability using point-source atom interferometry. Phys Rev A (2020) 102(1):013326. doi:10.1103/physreva.102.013326
6. Hu Z-K, Sun B-L, Duan X-C, Zhou M-K, Chen L-L, Zhan S, et al. Demonstration of an ultrahigh-sensitivity atom-interferometry absolute gravimeter. Phys Rev A (2013) 88(4):043610. doi:10.1103/physreva.88.043610
7. Ménoret V, Vermeulen P, Le Moigne N, Bonvalot S, Bouyer P, Landragin A, et al. Gravity measurements below 10− 9 G with a transportable absolute quantum gravimeter. Scientific Rep (2018) 8(1):12300. doi:10.1038/s41598-018-30608-1
8. Wu X, Pagel Z, Malek BS, Nguyen TH, Zi F, Scheirer DS, et al. Gravity surveys using a mobile atom interferometer. Sci Adv (2019) 5(9):eaax0800. doi:10.1126/sciadv.aax0800
9. Xu V, Jaffe M, Panda CD, Kristensen SL, Clark LW, Müller H. Probing gravity by holding atoms for 20 seconds. Science (2019) 366(6466):745–9. doi:10.1126/science.aay6428
10. Mcguirk JM, Foster G, Fixler J, Snadden M, Kasevich M. Sensitive absolute-gravity gradiometry using atom interferometry. Phys Rev A (2002) 65(3):033608. doi:10.1103/physreva.65.033608
11. Sorrentino F, Bodart Q, Cacciapuoti L, Lien Y-H, Prevedelli M, Rosi G, et al. Sensitivity limits of a Raman atom interferometer as a gravity gradiometer. Phys Rev A (2014) 89(2):023607. doi:10.1103/physreva.89.023607
12. Stray B, Lamb A, Kaushik A, Vovrosh J, Rodgers A, Winch J, et al. Quantum sensing for gravity cartography. Nature (2022) 602(7898):590–4. doi:10.1038/s41586-021-04315-3
13. Cladé P, de Mirandes E, Cadoret M, Guellati-Khélifa S, Schwob C, Nez F, et al. Determination of the fine structure constant based on bloch oscillations of ultracold atoms in a vertical optical lattice. Phys Rev Lett (2006) 96(3):033001. doi:10.1103/PhysRevLett.96.033001
14. Cadoret M, de Mirandes E, Cladé P, Guellati-Khélifa S, Schwob C, Nez F, et al. Combination of bloch oscillations with a ramsey-bordé interferometer: new determination of the fine structure constant. Phys Rev Lett (2008) 101(23):230801. doi:10.1103/PhysRevLett.101.230801
15. Sorrentino F, Lien YH, Rosi G, Cacciapuoti L, Prevedelli M, Tino GM. Sensitive gravity-gradiometry with atom interferometry: progress towards an improved determination of the gravitational constant. New J Phys (2010) 12(9):095009. doi:10.1088/1367-2630/12/9/095009
16. Rosi G, Sorrentino F, Cacciapuoti L, Prevedelli M, Tino GM. Precision measurement of the Newtonian gravitational constant using cold atoms. Nature (2014) 510(7506):518–21. doi:10.1038/nature13433
17. Dimopoulos S, Graham PW, Hogan JM, Kasevich MA, Rajendran S. Atomic gravitational wave interferometric sensor. Phys Rev D (2008) 78(12):122002. doi:10.1103/PhysRevD.78.122002
18. Hogan JM, Johnson DMS, Dickerson S, Kovachy T, Sugarbaker A, Chiow S-W, et al. An atomic gravitational wave interferometric sensor in low earth orbit (Agis-Leo). Gen Relativity Gravitation (2011) 43(7):1953–2009. doi:10.1007/s10714-011-1182-x
19. Graham PW, Hogan JM, Kasevich MA, Rajendran S. New method for gravitational wave detection with atomic sensors. Phys Rev Lett (2013) 110(17):171102. doi:10.1103/PhysRevLett.110.171102
20. Varoquaux G, Nyman RA, Geiger R, Cheinet P, Landragin A, Bouyer P. How to estimate the differential acceleration in a two-species atom interferometer to test the equivalence principle. New J Phys (2009) 11(11):113010. doi:10.1088/1367-2630/11/11/113010
21. Padmanabhan H, Padmanabhan T. Nonrelativistic limit of quantum field theory in inertial and noninertial frames and the principle of equivalence. Phys Rev D (2011) 84(8):085018. doi:10.1103/PhysRevD.84.085018
22. Guo J, Ma S, Zhou C, Liu J, Wang B, Pan D, et al. Vibration compensation for a vehicle-mounted atom gravimeter. IEEE Sensors J (2022) 22(13):12939–46. doi:10.1109/jsen.2022.3179297
23. Lamporesi G. (2006). Determination of the gravitational constant by atom interferometry. Firenze, Italy: Università degli Studi di Firenze.
24. Rosi G. (2012). Precision gravity measurements with atom interferometry. Tuscany, Italy: University of Pisa.
25. Zi F, Zhang X, Huang M, Li N, Huang K, Lu X. A compact atom interferometer for field gravity measurements. Laser Phys (2019) 29(3):035504. doi:10.1088/1555-6611/aafd26
26. Fu Z, Wu B, Cheng B, Zhou Y, Weng K, Zhu D, et al. A new type of compact gravimeter for long-term absolute gravity monitoring. Metrologia (2019) 56(2):025001. doi:10.1088/1681-7575/aafcc7
27. Bin W, Yin Z, Bing C, Dong Z, Kai-Nan W, Xin-Xin Z, et al. Static measurement of absolute gravity in truck based on atomic gravimeter. Acta Physica Sinica (2020) 69(6):060302. doi:10.7498/aps.69.20191765
28. McGuirk J. M. (2002). High precision absolute gravity gradiometry with atom interferometry. CA, United States : Stanford University.
29. Di Domenico G, Devenoges L, Dumas C, Thomann P. Combined quantum-state preparation and laser cooling of a continuous beam of cold atoms. Phys Rev A (2010) 82(5):053417. doi:10.1103/physreva.82.053417
30. Szymaniec K, Park SE. Primary frequency standard npl-csf2: optimized operation near the collisional shift cancellation point. IEEE Trans Instrumentation Meas (2010) 60(7):2475–81. doi:10.1109/tim.2010.2088430
31. Duan Y-X, Wang B, Xiang J-F, Liu Q, Qu Q-Z, Lü D-S, et al. State preparation in a cold atom clock by optical pumping. Chin Phys Lett (2017) 34(7):073201. doi:10.1088/0256-307x/34/7/073201
Keywords: atom interferometry, state preparation, optical pumping, microwave transitions, Raman transitions
Citation: Zhang X, Li Q-X, Zhang H-K, Liu J-X, Wang G-C, Ma X-X, Zhu L-X and Yan S-H (2024) Experiment and analysis of state preparation for atom interferometry. Front. Phys. 12:1377829. doi: 10.3389/fphy.2024.1377829
Received: 28 January 2024; Accepted: 29 February 2024;
Published: 08 March 2024.
Edited by:
Han Pu, Rice University, United StatesReviewed by:
Cs Unnikrishnan, Tata Institute of Fundamental Research, IndiaBen Edward Sauer, Imperial College London, United Kingdom
Copyright © 2024 Zhang, Li, Zhang, Liu, Wang, Ma, Zhu and Yan. This is an open-access article distributed under the terms of the Creative Commons Attribution License (CC BY). The use, distribution or reproduction in other forums is permitted, provided the original author(s) and the copyright owner(s) are credited and that the original publication in this journal is cited, in accordance with accepted academic practice. No use, distribution or reproduction is permitted which does not comply with these terms.
*Correspondence: Ling-Xiao Zhu, emh1bGluZ3hpYW8zMUAxNjMuY29t; Shu-Hua Yan, eWFuc2h1aHVhOTk2QDE2My5jb20=
†These authors have contributed equally to this work and share first authorship