 Yue Chang
 Teng Hu
 Fang Lou
- Institute of Computer Application, China Academy of Engineering Physics, Mianyang, China
In recent years, Internet of Things security incidents occur frequently, which is often accompanied by malicious events. Therefore, anomaly detection is an important part of Internet of Things security defense. In this paper, we create a process whitelist based on the K-Core decomposition method for detecting anomalous processes in IoT devices. The method first constructs an IoT process network according to the relationships between processes and IoT devices. Subsequently, it creates a whitelist and detect anomalous processes. Our work innovatively transforms process data into a network framework, employing K-Core analysis to identify core processes that signify high popularity. Then, a threshold-based filtering mechanism is applied to formulate the process whitelist. Experimental results show that the unsupervised method proposed in this paper can accurately detect anomalous processes on real-world datasets. Therefore, we believe our algorithm can be widely applied to anomaly process detection, ultimately enhancing the overall security of the IoT.
1 Introduction
Due to the limitations of IoT devices, such as low power consumption, small size and low cost, the security performance of IoT is poor, so these IoT devices are easy to be attacked by hackers. It remains challenging to protect against hacker attacks. There are many factors that can be a threat to server security, such as IoT device vulnerability, virus, malicious procedure, etc. Common attack contains worm, botnet, Trojan horse and DDOS attack (distributed denial of service). Most of these attacks invade the IoT devices by using the malicious process and then hackers implement the further attack. In the network security field, server security occupies an important position. While someone runs the vicious procedure, it always starts some anomalous processes in the IoT devices. If we can detect anomalous process as early as possible, then we will solve the problems in the early stage and avoid heavy loss.
At present, the main technology of anomalous process detection is firewall and intrusion detection technology. As a cordon between the internal network and the public network, the firewall blocks most malicious attacks. However, the effect of the firewall is limited because its defense strategy is static and can only block attacks from the outside network. Intrusion detection technology effectively remedies the short-comings of the firewall. Intrusion Detection System can monitor the real-time status of the IoT devices and detect the anomalous action. Intrusion Detection Systems detect the process mainly by process behavior [1], but there is a problem that we cannot find the anomalous process in time. Besides, Intrusion Detection Systems heavily depend on rules and expert experience. Some researchers proposed to detect anomalous processes based on the system call sequence [2] and this method required kernel process data.
In this work, we detect anomalous processes in IoT devices from a different perspective. The principle of anomalous processes detection is that anomalous processes detection only works in a few IoT devices Therefore, it is necessary to calculate the popularity of Internet of Things devices, and the higher the popularity is, the less suspicious process is. Considering the relationship between the processes and servers, we propose a new approach that can efficiently detect the malicious process in a short time. The proposed approach is as follows. Firstly, we build process white list by using a graph algorithm called K-Core, then we detect the anomalous processes in the servers based on this white list. The strength of this proposed method is that we build the anomaly detection model by constructing the process network. Moreover, our method is unsupervised and we can find out anomalous processes in servers quickly.
The rest of this paper is organized as follows. We briefly review related works in Section 2. Section 3 introduces the proposed method to build weighted process networks. Detailed explanation of detecting anomalous processes is presented in Section 3.3, and the evaluation of the proposed method is discussed in Section 4 and finally we draw a conclusion and discuss future work in Section 5.
2 Related work
The process can be defined as a basic unit of system dynamic execution operation and it is a dynamic concept. Processes in servers are not only the dynamic implementation of programs but also the resource scheduling and allocation. There is a big difference between the process and the program. Programs are static instructions or code sets, while processes are the dynamic execution of programs. Process monitoring is an important part of network security technology. Most intrusion detection systems and anti-virus software have the process monitoring module in the servers.
Considerable research efforts have been devoted to monitoring the process in the servers. In 1996, Stephanie Forrest et al. firstly proposed the delay-embedded sequence model, and analyzed the process behavior based on the system call sequence [2]. In 1998, Hofmeyr proposed an N-gram anomaly detection model [3], which is used to monitor the process behavior. Much work so far has focused on detecting anomalous processes at home and abroad and made outstanding achievements, such as the Fuzzy ART neural network algorithm, the method based on the hidden Markov model, the method based on frequency statistics and method of data mining. The main focus of this research is to extract the characteristics of subsequences for the process. These detection methods ignore the global characteristics of the process with a shortage of poor timeliness.
Besides, much work has focused on anomaly intrusion detection. The system detects anomaly behavior by using statistical profiles such as IDES [4–6], and inductive pattern generation, as in TIM [7]. These methods require an audit trail of actions to all users in servers. Moreover, these detection methods will perform terribly if we change the model of user behavior in a new environment. Levitt et al. proposed the method to define normal behavior for privileged processes [8, 9]. Sezgin proposed the intrusion detection instrument called AID4I and achieved better accuracy than traditional intrusion detection methods in experiments on public datasets [10].
In addition to the detection based on rule matching, there are also researches that use machine learning to detect anomalies. For example, Yang et al. constructed LM-BP algorithm from the characteristics of the Internet of Things [11]. Zhang et al. designed an intrusion detection system based on genetic algorithm and deep confidence network, which can adaptively change the network structure to adapt to different types of attacks in the Internet of Things [12]. Bhatt et al. designed a hybrid machine learning detection system called HADS to detect anomalies in time series with different characteristics generated by Internet of Things devices [13]. Weinger B et al. use supervised deep learning to achieve higher detection accuracy through special processing of data features [14]. Alaiz-Moreton et al. realized anomaly detection by multi-classifying the traffic of IoT devices [15]. Nagarajan proposed a new hybrid deep learning in Industrial Control Systems, which can be used to detect unknown attacks [16]. Al-Wesabi proposed an optimization algorithm based on federated learning and reached great results in IoT attack detection [17].
In this paper, we proposed an unusual method to detect anomalous processes. Firstly, we build the weighted process network based on the relationship between processes and IoT devices. Then creating a process white list by using the K-Core decomposition method. Finally, we can detect anomalous process by comparing with the white list.
3 Materials and methods
Processes running in IoT devices can be divided into four categories: server system process, the third-party application process, user-initiated process, and anomalous process. The first three kinds of processes are common processes, and they are widely distributed in devices. The last kind of process is running in devices by hackers or other attackers. The distribution density in the devices is different among these processes. Then we can establish the process network topology with these distribution characteristics of processes.
In this section, we build a graph of processes based on the relationship between processes and IoT devices. And we will introduce some definitions used in this paper.
3.1 Establishing the process network topology
We mainly collect the following two types of process logs, the real-time status logs of processes in the operating system kernel and snapshots of processes in the server. We monitor the whole life cycle of all processes and find out the popular processes that could be considered as normal processes by analyzing the process graph.
In this paper, an independent process
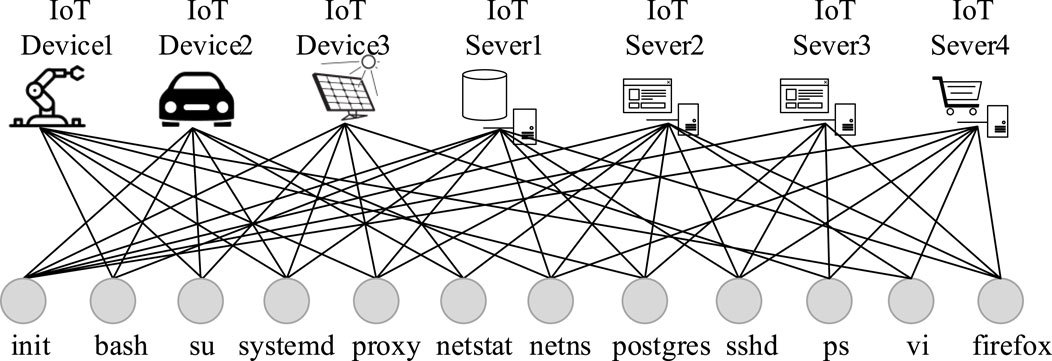
Figure 1. Processes in different servers.
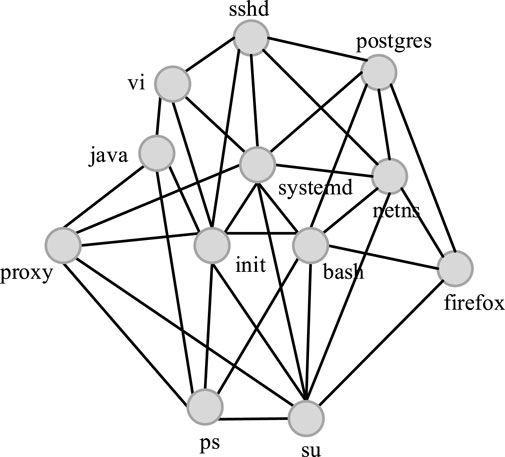
Figure 2. Process network.
System processes such as system daemon processes, system log management processes and kernel processes are very popular in devices. The execution of these processes guarantees the basic functions of devices. We can find these processes in mainstream operating systems such as Ubuntu, CentOS, Red Hat, and Kali. The second variety of processes is mainly third-party processes such as Apache and Nginx applications which are very popular in many devices. The third kind of process is user-initiated process. In enterprises or huge server clusters, users will startup similar processes such as the enterprises’ OA system processes. All three of these processes are popular in the devices. And in the process network topology graph, the corresponding nodes play an important role in the whole network graph.
The more popular processes are in the devices, the greater the core degree of the corresponding nodes are, and the more influential they are in the process network topology graph. Therefore, the problem of finding popular processes in devices is transformed into the problem of finding core nodes in the network graph.
3.2 Building the weighted process graph
Graph density is an important index to measure the edge density of a network graph [18]. The specific definition of graph density is the ratio of the actual number of edges to the maximum potential number of edges in the network. After constructing the process network graph on the IoT devices, we found that the value of the process network graph density is too high. And when the number of IoT devices increases, the graph density changes little. Such a process network graph structure is not an ideal model to analyze processes.
We make some improvements to the undirected process network graph shown in Figure 2. The approach is to represent the progress network with a weighted graph. If two independent processes
Where,
As shown in Figure 3, process 2 runs in the devices {a, b, c}, process 3 runs in the devices {a, c} and process 5 runs in the devices {c}, then we perform the following steps. First, we gather the set of devices which one process has ever been running in, such that
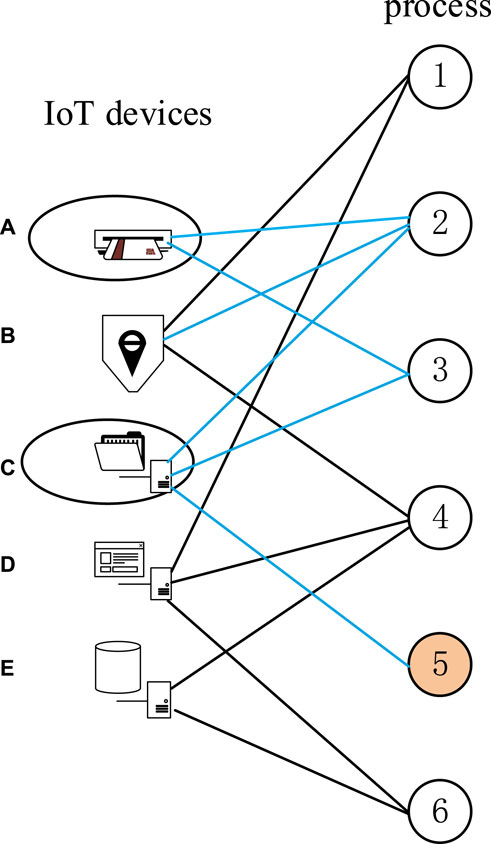
Figure 3. Processes in different IoT servers.
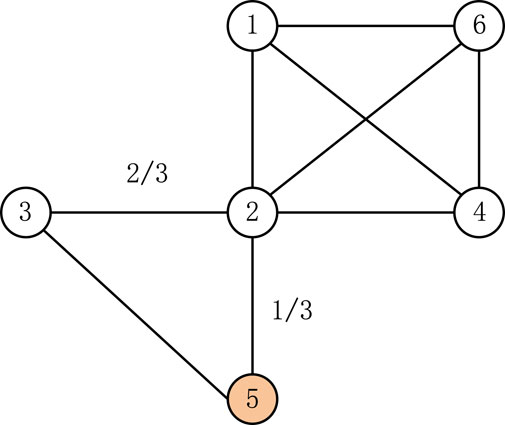
Figure 4. Weighted process network.
To form the process white list, we impose the following conditions: 1) Malicious processes run on a small number of servers; 2) Processes running on a large number of devices are more trustworthy; 3) The strength of association between two processes is related to the number of common servers they share. Based on the premise, we can further deduce that the number of servers a process resides on has a significant impact on its suspicion level. For example, when a suspicious process and a common process run on the same device, the association between the two processes increases the node degree of the suspicious process, which is not as expected. To model more realistically, it is necessary to eliminate this bias. Therefore, we introduce a weighting factor C, when the number of devices on which a process resides is small, its weighting factor C is small. When the number of devices is large, the weighting factor is large, and it is less influenced by the number of devices. Furthermore, we can define C as following:
Where,
With the above processing, we can construct the weighted undirected graph based on the relationship between processes and devices. After analyzing the coreness of all nodes in the graph, we can obtain the widely popular processes in the devices. These popular processes are legitimate and can be used to create process white list.
3.3 Detecting anomalous processes
In this section, K-Core algorithm is proposed to help create a process white list. According to previous classification, the first three kinds of processes are very popular and their nodes are core nodes. If we find out these core nodes based on K-Core algorithm, then we can find out the popular processes and write them to the white list.
The node importance of complex networks, including the influence, status, the popularity of nodes and the synthesis of these elements, was first raised by social relationship scientists [19, 20]. With the development of society, the research value of this study has been gradually discovered, and it plays an important role in the communication network, social network, and engineering practice. There are many indicators or methods to judge the importance of nodes, such as degree, betweenness, coreness, degree centrality and ranking of node importance based on random walk model [21, 22], the ranking of node importance based on propagation dynamics [23, 24]. Kitsak first proposed that the node importance depends on its location in the network [25], and then used the K-Core decomposition algorithm to rank the importance of nodes. Among these indicators and methods, the coreness can obtain a more accurate ranking of node importance than others such as betweenness. And it is easy to realize with the K-Core algorithm. The time complexity of the K-Core algorithm is O (N), which is suitable for huge complex networks.
3.3.1 Algorithm description
K-Core decomposition method is classical in graph theory which can be used to analyze the importance of nodes in the network [26]. The main idea is to iteratively generate different kinds of node groups with different k-values (
As shown in Figure 5, there is the K-Core decomposition of a network. The nodes of the outer layer compose shell 1 (
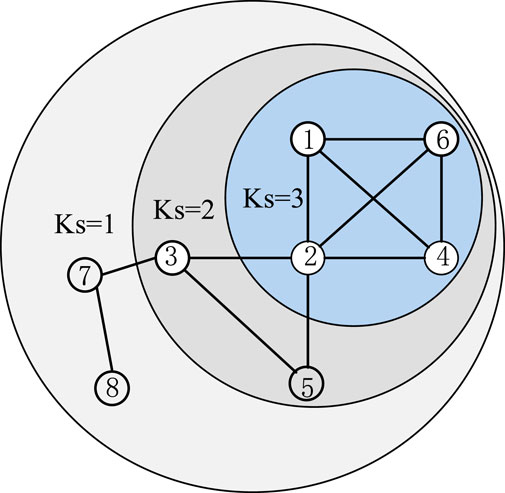
Figure 5. Illustration of K-Core concept.
Algorithm 1.K-Core decomposition.
Input: Network graph data.
Output: The list of different k-values
1:
2: for all i ← 0 to n do
3: d[i] ← degree(i)
4: D[d[i]].add(i)
5: end for
6: for k to degree(max) do
7:
8: while D[k] not empty do
9: D[k].remove(vertex)
10: S[vertex] ←
11: end while
12:
13: end for
14: return S
In Algorithm 1, we define three arrays, D which contains a list of the nodes with a different degree, d which holds the degree of each node and S holds the k-values of all nodes. Firstly, we initialize three arrays and
3.3.2 Creating process white list based on K-Core
The K-Core decomposition method is used to analyze unweighted undirected graphs. And this is a major limitation of k-core decomposition method. However, most real networks are weighted in practice, and the weight property describes the model’s important features. In order to overcome these limitations, Garas and Schweitzer proposed a weighted K-Core decomposition method [27]. The basic idea is to redefine the weighted degree of a node, they considered both the degree of a node and the weights of its links. And the new degree is the multiplication of two types.
In this work, we define a weighted degree of one node which is the sum over all its link weights. Then we use K-Core decomposition method to partition a network into sub-structures that are directly linked to centrality [28]. After finishing one decomposition, we calculate all nodes’ weighted degree again to prepare the next decomposition. This procedure is repeated iteratively until all nodes are removed from the network.
A more detailed description of creating process white list based on K-Core is as follows:
1) Using the approach in Section 3 to build a weighted process network;
2) For process
3) Using Eq. 4 and the K-Core decomposition method in Algorithm 1 to calculate all nodes’ k-values. And then we can obtain a group of different k-values;
4) Choosing a threshold k-value then filter out the processes whose k-values are less than the threshold value;
5) After filtering, we can obtain the process white list.
3.3.3 Detecting anomalous process
We introduce the method to create a process white list including building process networks. However, the final goal of our work is to detect anomalous processes. Therefore, we detect anomalous processes by using the white list. Users can integrate the proposed method to some systems. For example, users can use directly detect anomalous process by comparing with the process white list. Engineering implementation is involved in detecting anomalous processes based on white list. And different user scenarios entail different software architectures. Since our work involves real-time detection of large volumes of IoT data, we utilize Kafka, Spark, etc. We transmit process data by Kafka and detect anomalous processes in Spark. The spark system can help us deal with huge process data in time.
4 Results
In this section, we test our proposed method on the real-world process data. All of our process data have been generated on IoT servers. And we gather the snapshots of these servers’ processes at different time intervals.
4.1 The process network
We build the process network topology structure on different data sets. As shown in Table 1, we provide some detailed statistical properties of process networks. In this table, the number of processes is equivalent to the number of nodes. We obtain the dense network on processes data of three servers for which the number of edges is about 20 times higher than the number of nodes. This is supported by the conclusion that there is a close relationship between processes and servers. The number of edges is about 14 times higher than the number of nodes when the number of servers is equivalent to 30. While the number of servers increase, we can obtain the sparse process networks.
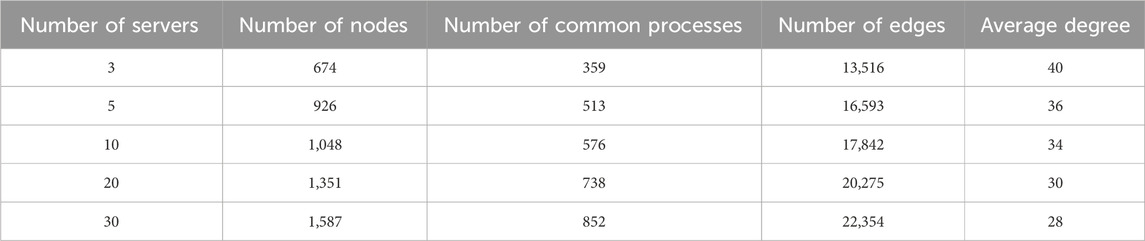
Table 1. Statistical properties of process networks.
4.2 The process whitelist
We use the K-Core decomposition method to partition the process network into sub-structures on ten servers. And Figure 6 shows K-values of all processes. There are 1,048 processes which run on 10 servers. We can see that about 300 processes are in the group of 160-core which is the biggest k-value. These processes are very popular in servers. Moreover, 87% of these processes are server system processes. This is supported by the appearance that there are some system processes which are very popular. K-values of the rest of processes are less than the k-value of system processes. We can see that there are several obvious steps from this diagram.
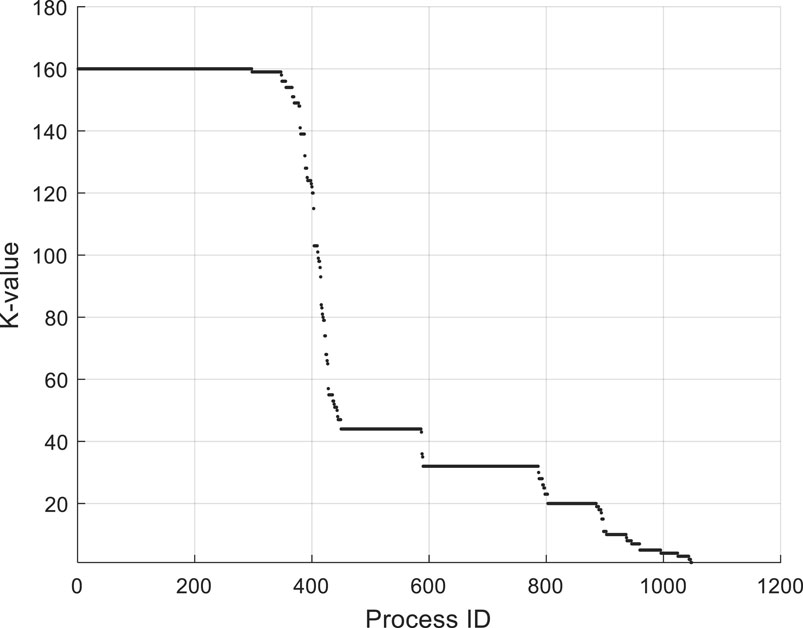
Figure 6. K-values of processes.
There are some processes whose k-values are less than 10. And part of them is user-initiated processes such as “python test_one.py” which runs on only one server. Besides, there are many processes whose k-values are in the area around the average degree. Most of these processes are third party processes such as “firefox” and “nginx.” These processes are popular in some special servers. Some processes such as “ps–ef,” “ls–al” and “tailf” are system processes, but not always run on the servers. Therefore, the k-values of these processes are less than expected.
In our work, we gather process data on 30 servers and obtain 1,587 processes. The servers contain IoT database servers, web servers, spark clustering servers and so on. Finally, we obtain the process white list based on K-Core decomposition method. And Table 2 shows part of the white list.
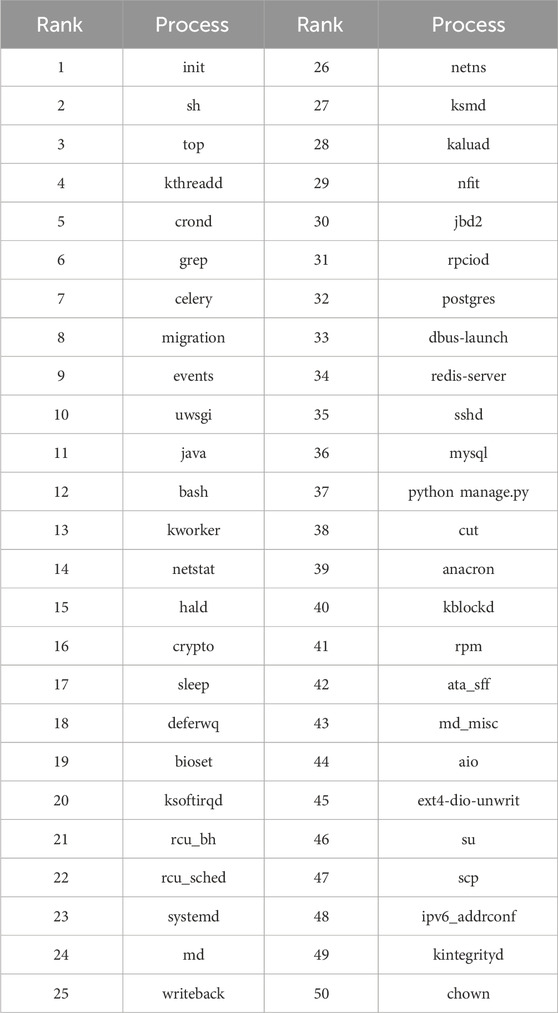
Table 2. Process white list.
Ranking refers to the popularity ranking of processes, where a higher process ranking indicates greater popularity among IoT devices and lower suspicion. By predefining thresholds, highly ranked processes are written into the white list, which can then be used for anomalous process detection. The result in Table 2 shows that the most popular processes are mainly system processes such as “init” and “crond.”
4.3 Anomaly detection of real-world data
In Section 3, we discussed how to detect anomalous processes. The important part is to create a process white list and then we compare process data with the white list to detect. In this procedure, we use real-world process data that conclude process data in database servers and process data in Hadoop clustering servers. Surprisingly, we find out several anomalous processes in Hadoop clustering servers which are viciously used to produce bitcoin. The anomalous processes are “sustes,” “sh mr.sh” and “sh i.sh” etc. We find that hackers make use of vulnerability to invade our servers and download malicious procedure such as “mr.sh” and “i.sh” from proxy servers in a foreign country. We didn’t know this problem in our Hadoop servers until detecting anomalous processes based on the process white list. The proposed anomaly detection method helps us find the threat in clustering servers and avoid huge damage. Table 3 shows the malicious processes and vicious proxy IPs.

Table 3. Information of malicious processes.
This real intrusion was mainly from Canada and the malicious procedure is used to produce bitcoin. The IPs which hackers used in Table 3 are the experimental servers.
5 Discussion
We introduced a novel method to create process white list which used to detect anomalous processes. Different from previous approaches, the proposed method transforms the process data into networks based on the relationship between processes and IoT devices. Then we use K-Core decomposition method to partition the process network into sub-structures. It is generally accepted that the K-Cores with the biggest coreness values represent the most popular nodes of the whole network. Therefore, we filter processes by controlling threshold k-value. The popular processes such as system processes are put into the white list. The rest of the work is simple. Just compare process data with the white list and we can detect anomalous processes in devices. The proposed method is unsupervised so we don’t need labeled data. From the section of experimental results, we can see that processes at the front of the white list are mainly system processes and they are very popular in devices. This is consistent with the observation we expected. Notably, the proposed method helps us find out the threat in clustering devices and avoid huge damage.
The method proposed in this paper is suitable for detecting less popular anomalous processes. It is difficult to detect widely prevalent malicious processes used for attacks when most devices in the IoT have already been compromised. For example, in DDOS attack scenarios, attackers may use compromised C&C servers to send commands to a large number of IoT devices. Therefore, processes generated by these commands are highly prevalent in the current IoT environment, and such processes may be included in our white list, thereby eliminating their suspicion and causing leaks. One way to address these issues is for security experts to intervene. After generating the process white list, security experts further analyze and remove suspicious processes to improve the credibility of the white list.
The current work does not consider the influence of parent-child process relationships on correlation. Therefore, in future research, we consider introducing the natural correlation between processes to detect anomalous processes. Compared to the undirected graph structure in the current work, the future plan is to use a directed graph to represent parent-child process relationships. The probability that the parent process or child process of a malicious process is malicious is relatively high. Therefore, after introducing the directed graph, it is possible to model and detect malicious process networks more realistically. To address the limitations of the current work, subsequent work will incorporate process features such as resource consumption and file transfer into the attributes of graph nodes. For IoT environments vulnerable to DDoS attacks, data theft, etc., the calculation function of the weight factor will be adjusted to achieve better results.
Data availability statement
The data analyzed in this study is subject to the following licenses/restrictions: The dataset cannot be publicly disclosed due to confidentiality reasons. Requests to access these datasets should be directed to YC, MTU2NjcwODM1MjFAMTYzLmNvbQ==.
Author contributions
YC: Conceptualization, Data curation, Investigation, Methodology, Software, Validation, Writing–original draft. TH: Writing–review and editing. FL: Data curation, Funding acquisition, Project administration, Resources, Writing–review and editing. TZ: Writing–review and editing. MY: Writing–review and editing. SY: Writing–review and editing.
Funding
The author(s) declare that financial support was received for the research, authorship, and/or publication of this article. This work was supported by the Presidential Foundation of CAEP (Grant No. YZJJZQ2023026).
Acknowledgments
The authors would like to thank the editors and reviewers for their efforts in supporting the publication of this paper.
Conflict of interest
The authors declare that the research was conducted in the absence of any commercial or financial relationships that could be construed as a potential conflict of interest.
Publisher’s note
All claims expressed in this article are solely those of the authors and do not necessarily represent those of their affiliated organizations, or those of the publisher, the editors and the reviewers. Any product that may be evaluated in this article, or claim that may be made by its manufacturer, is not guaranteed or endorsed by the publisher.
References
1. Gupta J, Sharma S Handbook of research on information security and assurance. Information Science Publishing (2008).
2. Forrest S, Hofmeyr SA, Somayaji A, Longstaff TA A sense of self for unix processes. In: Proc. 1996 IEEE Symp. Security and Privacy; 06-08 May 1996; Oakland, CA, USA (1996). p. 120–8.
3. Hofmeyr SA, Forrest S, Somayaji A Intrusion detection using sequences of system calls. J Comput Security (1998) 6:151–80. doi:10.3233/jcs-980109
4. Anderson D, Frivold A T Valdes Next-generation intrusion detection expert system (NIDES): a summary (1995).
5. Denning DE An intrusion-detection model. IEEE Trans Softw Eng (1987) SE-13(2):222–32. doi:10.1109/TSE.1987.232894
6. Lunt T, Tamaru A, Gilham F, Jagannathan R, Neumann P, Javitz H, et al. A real-time intrusion detection expert system (IDES) (1992).
7. Teng HS, Chen K, Lu SC Security audit trail analysis using inductively generated predictive rules. In: Proceedings of the Sixth Conference on Artificial Intelligence Applications; 05-09 May 1990; Santa Barbara, CA, USA (1990). p. 24–9.
8. Levitt GFK Property-based testing of privileged programs. In: Proceedings of the 10th Annual Computer Security Applications Conference; 05-09 December 1994; Orlando, FL, USA (1994). p. 154–63.
9. Ko C, Levitt GFK Automated detection of vulnerabilities in privileged programs by execution monitoring. In: Proceedings of the 10th Annual Computer Security Applications Conference; 05-09 December 1994; Orlando, FL, USA (1994). p. 134–44.
10. Sezgin A, Boyaci A. AID4I: an intrusion detection framework for industrial Internet of Things using automated machine learning. Comput Mater Continua (2023) 76:2121–43. n. pag. doi:10.32604/cmc.2023.040287
11. Yang A, Zhuansun Y, Liu C, Li J, Zhang C Design of intrusion detection system for Internet of Things based on improved BP neural network. IEEE Access (2019) 7:106043–52. doi:10.1109/ACCESS.2019.2929919
12. Zhang Y, Li P, Wang X Intrusion detection for IoT based on improved genetic algorithm and deep belief network. IEEE Access (2019) 7:31711–22. doi:10.1109/ACCESS.2019.2903723
13. Bhatt P, Morais A HADS: hybrid anomaly detection system for IoT environments. In: 2018 International Conference on Internet of Things, Embedded Systems and Communications (IINTEC); 20-21 December 2018; Hamammet, Tunisia (2018). p. 191–6. doi:10.1109/IINTEC.2018.8695303
14. Weinger B, Kim J, Sim A, Nakashima M, Moustafa N, Wu KJ Enhancing IoT anomaly detection performance for federated learning. In: 2020 16th International Conference on Mobility, Sensing and Networking (MSN); 17-19 December 2020; Tokyo, Japan (2020). p. 206–13. doi:10.1109/MSN50589.2020.00045
15. Alaiz-Moretón H, Aveleira-Mata J, Ondicol-Garcia J, Castañeda ÁL, García I, Benavides C Multiclass classification procedure for detecting attacks on MQTT-IoT protocol. Complex (2019) 2019:1–11. doi:10.1155/2019/6516253
16. Nagarajan S, Kayalvizhi S, Subhashini R, Anitha V Hybrid honey badger-world cup algorithm-based deep learning for malicious intrusion detection in industrial control systems. Comput Ind Eng (2023) 180:109166. doi:10.1016/j.cie.2023.109166
17. Al-Wesabi FN, Mengash HA, Marzouk R, Alruwais N, Allafi R, Rana A, et al. Pelican optimization algorithm with federated learning driven attack detection model in Internet of Things environment. Future Gener Comput Syst (2023) 148:118–27. doi:10.1016/j.future.2023.05.029
18. Intanagonwiwat C, Estrin D, Govindan R, Heidemann J Impact of network density on data aggregation in wireless sensor networks. In: Proc. 22nd Int'l Conf. Distributed Computing Systems (ICDCS '02); 02-05 July 2002; Vienna, Austria (2002).
19. Centola D The spread of behavior in an online social network experiment. Science (2010) 329:1194–7. doi:10.1126/science.1185231
20. Ugander J, Backstrom L, Marlow C, Kleinberg J Structural diversity in social contagion. Proc Nat Acad Sci (2012) 109(16):5962–6. doi:10.1073/pnas.1116502109
21. Page L, Brin S, Motwani R, Winograd T The pagerank citation ranking: bringing order to the web, technical report, computer system laboratory. Stanford Univ. (1998).
22. Kleinberg JM Authoritative sources in a hyperlinked environment. J ACM (1999) 46(5):604–32. doi:10.1145/324133.324140
23. Bond RM, Fariss CJ, Jones JJ, Kramer ADI, Marlow C, Settle JE, et al. A 61-million-person experiment in social influence and political mobilization. Nature (2012) 489(7415):295–8. doi:10.1038/nature11421
24. Muchnik L, Aral S, Taylor SJ. Social influence bias: a randomized experiment. Science (2013) 341(6146):647–51. doi:10.1126/science.1240466
25. Kitsak M, Gallos LK, Havlin S, Liljeros F, Muchnik L, Stanley H, et al. Identification of influential spreaders in complex networks. Nat Phys (2010) 6:888–93. doi:10.1038/nphys1746
26. García-Algarra J, Pastor JM, Iriondo JM, Galeano J. Ranking of critical species to preserve the functionality of mutualistic networks using the k-core decomposition. PeerJ (2017) 5:e3321. doi:10.7717/peerj.3321
27. Garas A, Schweitzer F, Havlin S A k-shell decomposition method for weighted networks. New J Phys (2012) 14:083030. doi:10.1088/1367-2630/14/8/083030
Keywords: Internet of Things, process network, white list, anomaly detection, process rank
Citation: Chang Y, Hu T, Lou F, Zeng T, Yin M and Yang S (2024) Anomalous process detection for Internet of Things based on K-Core. Front. Phys. 12:1391266. doi: 10.3389/fphy.2024.1391266
Received: 25 February 2024; Accepted: 04 April 2024;
Published: 24 April 2024.
Edited by:
Yuanyuan Huang, Chengdu University of Information Technology, ChinaCopyright © 2024 Chang, Hu, Lou, Zeng, Yin and Yang. This is an open-access article distributed under the terms of the Creative Commons Attribution License (CC BY). The use, distribution or reproduction in other forums is permitted, provided the original author(s) and the copyright owner(s) are credited and that the original publication in this journal is cited, in accordance with accepted academic practice. No use, distribution or reproduction is permitted which does not comply with these terms.
*Correspondence: Teng Hu, bWFpbGh1dGVuZ0BnbWFpbC5jb20=