Abstract
Introduction:
Innovative energy startups are expediting the energy transition through the adoption of emerging technologies, including blockchain, fintech, artificial intelligence, and crowdfunding. However, existing research primarily focuses on technological capabilities at the startup level and macro-level national applications to explore the current state of innovative energy adoption. In contrast, limited attention has been paid to analyzing the role attributes of innovative energy startups and their correlations with potential success, which are critical for understanding their development trajectories within the energy market.
Methods:
This study develops a temporal investment information network for global energy startups, drawing on data from energy enterprises worldwide between 2005 and 2024. The research examines the role attributes of startups and explores the temporal topological characteristics of the network. We propose a success evaluation model based on the features of successful startups to assess the potential of innovative energy startups.
Results and Discussion:
The findings indicate that, despite their relatively small market share, innovative energy startups exert significant influence. Notably, successful startups typically exhibit higher betweenness centrality and lower closeness centrality. Moreover, factors such as network degree, centrality, and government administrative capacity play crucial roles in determining the success of innovative energy startups. In the evaluation model constructed using these factors, network structural characteristics contribute the most, achieving an evaluation accuracy of 0.984. This study provides valuable insights for policymakers evaluating innovative energy development trends and for investors assessing the potential of startups.
1 Introduction
Innovative energy has become a forefront issue on the global economic and environmental agenda due to its ability to ensure economic competitiveness [1, 2], improve energy efficiency [3], reduce environmental pollution, and mitigate climate change [4]. Among them, innovative energy startups serve as a new perspective for studying energy market development by analyzing their market return effects and connectivity [5], risk spillover effects [6], extreme uncertainty connectedness [7], and environmental sustainability and its development [8, 9] in comparison to other types of startups. The individual roles and topological characteristics of startups can reflect system structure and interaction patterns [10], thereby revealing interconnections, dependencies, and interactions among startups. However, existing literature primarily examines innovative energy startups from a national perspective [11] and a technological perspective [12–14], neglecting the individual roles and interrelationships of these startups. Therefore, depicting the roles and positions of innovative energy startups within the business ecosystem is of significant importance.
One of the goals of startup development is business success. Existing research analyzes whether a startup can succeed from two main perspectives. First, from a micro-level perspective focusing on individual startups, studies have identified success factors such as innovative business models and collaborations, while failure factors include strong incumbent industries and unfavorable investor sentiment [15, 16]. Second, from a macro-level systemic perspective, research explores investment information on innovative energy startups [17, 18], characterizes static network capital through the final network structure [19], examines communication patterns among startups [20, 21], and uncovers potential dependencies, such as knowledge linkages [22], to assess the likelihood of future success [23–25]. In the energy market, traditional social network analysis (SNA) is suitable for examining stable structural patterns, such as the relationship between energy and capabilities [26] and the fixed spatial distribution of energy consumption [27]. However, due to the rapid environmental changes and increasing competitive pressures driven by technological innovations [28], the success of innovative energy startups increasingly depends on the ability to capture and analyze the dynamic characteristics of the energy market. Temporal networks have demonstrated advantages in capturing dynamic network changes, whether in studying startup growth [29] or optimizing stock market investment portfolios [30]. Therefore, by depicting the dynamic topological characteristics of innovative energy startups through the network structure of temporal networks and leveraging network features to analyze successful energy startups and their connections with innovative energy startups, it is possible to explore the future development directions of innovative energy startups.
To address the existing gaps in understanding the market dynamics and success mechanisms of energy startups, this study introduces an innovative framework that integrates both static and temporal network perspectives. Drawing on a comprehensive dataset of 26,188 investment records, we construct global static and temporal investment networks encompassing 3,592 energy startups connected through shared investors. This network approach reveals both the market structure of innovative energy startups and their evolving connections with successful startups over time, using key metrics such as betweenness and closeness centrality. Building on structural positioning in the networks, we evaluate the role attributes of startups and examine the correlation between network properties and startup success. Furthermore, we develop a novel correlation analysis model to assess success potential in the energy startup. Finally, we apply this model to explore the future development paths of innovative energy startups, providing new insights into the dynamic evolution of the energy startup landscape.
The research work of this paper is as follows. In Section 2, we briefly review the relevant literature and emphasize the necessity of incorporating dynamic network attributes into the analysis of the success correlation of innovative energy startups. Section 3 presents the data. In Section 4, we outline the construction of the network model and the evaluation model, along with their analytical methods. Section 5 discusses the results. Finally, in Section 6, we provide a summary and propose directions for future research.
2 Literature review
The role of innovative energy in the global energy market is increasingly recognized [31, 32]. As one of the key subjects in innovative energy research, startups are studied across various dimensions, including technology types [33, 34], real-world applications [35], investment [36], regional distribution [37], and policy design [38]. Among these factors, the role of government in promoting innovative energy startups is crucial. Governments support these startups by implementing proactive regulatory policies, funding private enterprises, offering innovation awards, and relaxing market constraints [39, 40]. This support plays a significant role in fostering their growth [41]. However, despite the supportive role of government in advancing energy technologies, a significant commercialization gap in energy innovation remains [40, [42]]. In practice, the successful deployment and diffusion of energy innovation rely heavily on the implementation capabilities of startups, and the effectiveness of policy measures often varies depending on firm-specific characteristics. Yet, existing research tends to overlook the individual roles and features of innovative energy startups, which are crucial for driving the development of energy innovation.
Investment activities play a pivotal role in the growth trajectory of startups. However, the absence of historical benchmarks, the volatility of entrepreneurial ecosystems, and the rapid movement of capital continue to pose significant challenges to successful investment outcomes [43, 44]. Existing literature primarily focuses on assessing entrepreneurial success through financial and operational indicators [82], with funding capacity often used as a proxy—reflected in outcomes such as initial public offerings [45], financing rounds [46], and acquisitions [47, 48]. From the perspective of founding teams, factors such as prior experience, educational background, skills, and even personality traits have been shown to influence startup performance [49, 50]. From the investor’s standpoint, although startup investment entails high risk, investors often play a central role in critical strategic decisions [51, 52]. However, despite the pivotal role of investment in startup success, existing research has paid relatively limited attention to the mechanisms through which investment-related information functions, particularly in the context of innovative energy startups [53, 54]. The impact of investment information on the developmental trajectories of such startups remains an underexplored area worthy of further investigation.
There are complex interactions among innovative energy startups. Through network analysis based on investment information, we can characterize the role attributes and topological features of innovative energy startups from a macro perspective. Role attributes refer to the relational assets generated by an individual’s interactions within a complex external network [55]. Establishing network connections with external resources plays a crucial role in facilitating information exchange [56], which helps explore the development of individuals within the network [19]. In practice, the network effects generated by role attributes facilitate information transmission between indirectly connected individuals through intermediaries [19]. For example, although Startup A and Startup C may not have a direct connection, technology [57], knowledge [58], and information [22] can be exchanged through an intermediary, Startup B. Increasingly, network-based technology diffusion models have explored how information spreads across different network configurations, highlighting the importance of role attributes in information acquisition [59–62]. The theory of preferential attachment [63] further explains this mechanism by suggesting that firms with stronger role attributes are more likely to attract new connections. As a result, these firms become increasingly central within the network structure. Moreover, some studies explore energy startups through the topological features of networks. For example, [19] constructed a global diffusion network for climate change mitigation technologies using patent data, company relationships, and business scale in their study of energy startups. By calculating network attributes such as degree, closeness centrality, and betweenness centrality, they found significant network effects in link quantity and structural positioning. Similarly, [64] analyzed the Chinese energy industry and energy startup market using network metrics such as degree, closeness centrality, and betweenness centrality, uncovering spillover effects in the stock market and the role of carbon markets in network benefits. However, these studies analyze energy startups solely based on the final static network structure and overlook the impact of market dynamics such as changes in investment information on the network role attributes and topological features of individual startups.
Temporal networks enable the dynamic characterization of network roles by continuously tracking key nodes [65, 66] and their associated nodes over time [67]. Therefore, this study introduces an analytical framework that integrates both static and temporal network perspectives, using investment information to construct a dynamically evolving investment network that captures the individual attributes of innovative energy startups across different time periods. By analyzing the topological features of successful startups, we further identify key structural characteristics that influence the growth of energy startups. This approach not only overcomes the limitations of traditional static analyses by capturing the impact of market dynamics on startup roles, but also provides a novel tool for exploring the developmental trajectories of innovative energy startups.
3 Data
This study constructs an investment information network for energy startups using global corporate data sourced from the Crunchbase database (https://www.crunchbase.com/), covering the period from January 2005 to July 2024. The dataset includes critical information such as announcement dates, investor names, funding status, organization industries, country-level geographic data, and administrative capacity data of energy startups.
We categorize energy market startups into three types: traditional energy startups, renewable energy startups, and innovative energy startups. Innovative energy startups refer to those that integrate technologies such as blockchain, fintech, artificial intelligence, and crowdfunding into their organizational structures and industrial domains to drive the transformation of the energy sector [68–70]. Renewable energy startups are defined as those whose organizational industries include the renewable energy sector, while all other startups are classified as traditional energy startups by default. Furthermore, we classify energy market startups based on their success status. Unlike previous studies that measure success using economic indicators such as corporate performance [71], we define a successful energy startup as one that has achieved either an initial public offering (IPO) or has been acquired through a merger or acquisition (M&A). This binary classification is widely used in innovation and entrepreneurship literature as a practical proxy for success, due to the clear and observable nature of these outcomes [72]. Ultimately, our dataset comprises 295 innovative energy startups (3.3%), 3,488 renewable energy startups (39.2%), and 5,117 traditional energy startups (57.5%). Among them, only 1,507 startups (16.9%) are classified as successful, highlighting the considerable challenges startups face in achieving success.
Government administrative capacity is measured by government effectiveness and regulatory quality. This variable reflects the government’s ability to regulate the local energy startup market and the ease with which investors can conduct business in the country [19]. Data on national administrative capacity are sourced from the Worldwide Governance Indicators provided by the World Bank (https://www.worldbank.org/). Government effectiveness captures the credibility of the government’s commitment to policies and the quality of their implementation, while regulatory quality reflects the government’s ability to formulate laws and regulations that enable and promote private sector development [73]. We take the average of the estimated governance values for each country from 1996 to 2022 as a measure of its government effectiveness and regulatory quality.
4 Methods
The methodological framework of this study consists of three components. In Section 4.1, we construct a static network of global energy startup investment information and employ network statistical analysis to examine the overall market characteristics of energy startups. In Section 4.2, we build a temporal network of investment information between startups to analyze the dynamic market characteristics of innovative and successful energy startups. In Section 4.3, we develop an evaluation model based on the network variables from Section 4.2, exploring the relationship between these variables and startup success while assessing the accuracy of the evaluation model.
4.1 Static investment information network analysis
We construct a static investment information network for energy startups, where startups are represented as nodes, and edges indicate the presence of shared investors between startups. In this section, we treat the network as an outcome rather than a process and analyze the global distribution of investment resources in the energy market by characterizing the static features of startups.
We construct static network where startups are represented as nodes, and edges indicate the presence of shared investors between startups. Startups without shared investors are removed, resulting in a final network comprising 3,592 energy startup nodes and 26,188 edges. Among these, there are 138 innovative energy startups, 1,520 renewable energy startups, 1,936 traditional energy startups, and 711 successful startups, as shown in Figure 1. Ranking countries by the number of energy startups, we find that the top six countries account for 70% of the market’s startups, with over 90% of successful startups located in these countries. Detailed information is presented in Table 1.
FIGURE 1
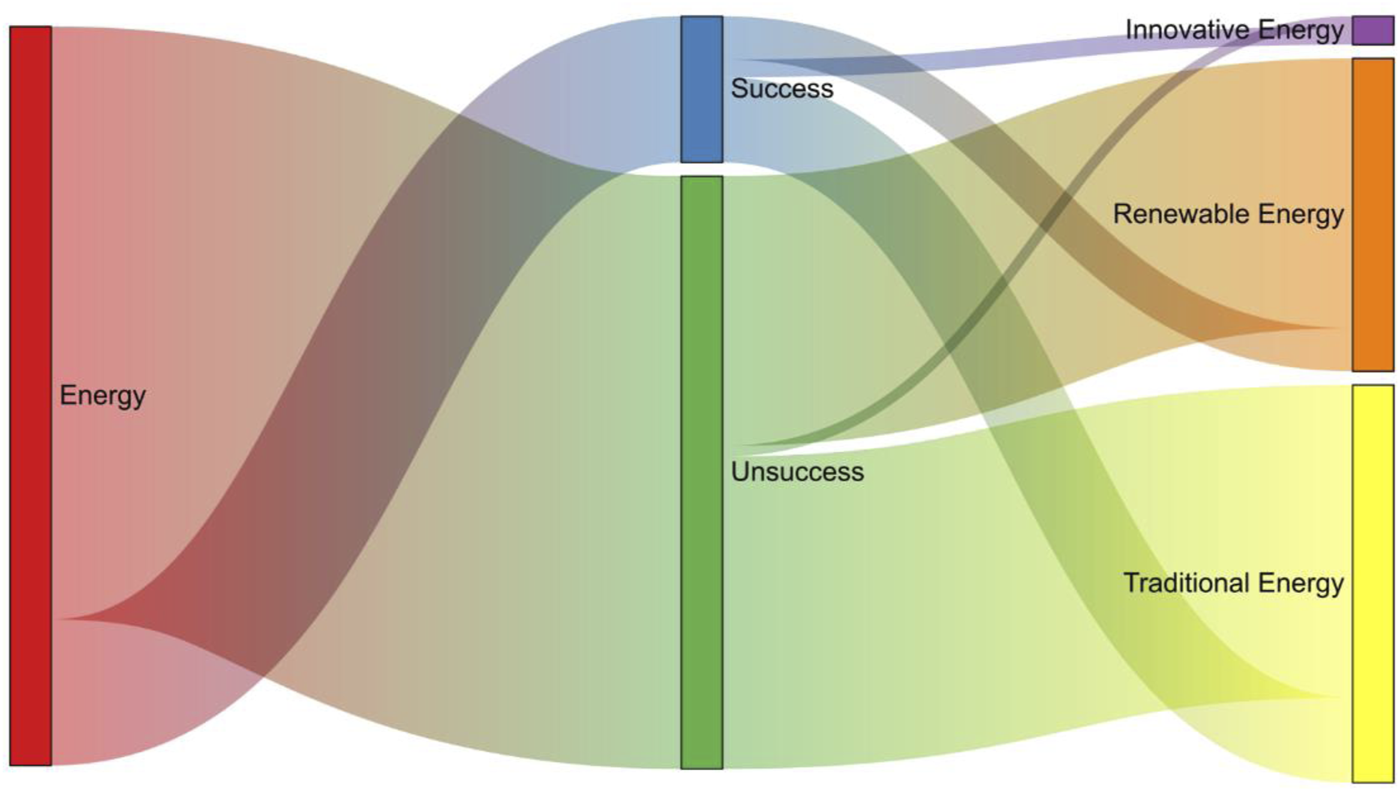
Energy startups market distribution.
TABLE 1
| Country | Innovative energy | Renewable energy | Traditional energy | Success | Government effectiveness | Regulatory quality |
|---|---|---|---|---|---|---|
| USA | 56 | 652 | 918 | 343 | 1.521 | 1.474 |
| Canada | 11 | 117 | 207 | 147 | 1.769 | 1.646 |
| UK | 11 | 110 | 139 | 30 | 1.601 | 1.722 |
| Germany | 11 | 61 | 65 | 22 | 1.553 | 1.572 |
| Spain | 1 | 36 | 102 | 138 | 1.175 | 1.066 |
| China | 1 | 25 | 78 | 14 | 1.010 | 1.014 |
Scale of energy startups and distribution of government capacity in the top six countries.
Edges reflect the interactions between startups through investment information. We measure edges using investment data between startups, including in-degree, out-degree, weighted in-degree, and weighted out-degree. Specifically, in-degree represents the number of investments received from investors of other startups, indicating a startup’s attractiveness to investors. Out-degree represents the number of investments made by a startup’s investors in other startups, reflecting the extent of capital spillover. The weight of an edge represents the frequency of investment transactions, capturing the intensity of investment activity. Mathematically, following [74], we define a network , where denotes the set of nodes, representing different startups, and represents the set of edges, which can be expressed in matrix form, as shown in Equation 1:where is the link from startups to ,which can be defined as shown in Equation 2:
Furthermore, structural positionalities assess the importance of startups in the network by considering their connections. We measure structural positionalities using betweenness centrality, which captures intermediation capacity, and closeness centrality, which reflects the average distance to other nodes. Specifically, betweenness centrality quantifies the frequency with which a startup appears on the shortest paths between indirectly connected startups, indicating its ability to control information flow within the network. This can be calculated by Equation 3:where represents the set of nodes, denotes the total number of shortest paths between nodes i and j, and signifies the shortest path from node i to node j that passes through node u.
Closeness centrality quantifies a startup’s proximity to all other startups in the network by measuring the average length of the shortest paths from the startup to all other startups. It reflects the relative position of a node within the network, indicating how close the startup is to other startups on average. The closeness centrality measure of startup is written as Equation 4:where represents the set of nodes, is the total number of nodes, and denotes the shortest path distance between nodes and .
4.2 Temporal investment information network analysis
In the static analysis, the dynamic characteristics of the network are ignored, and only the final structure of the network is considered. However, the frequent occurrence of investment activities leads to continuously changing potential connections between startups, and these changes have a significant impact on the startups. Therefore, we construct a temporal investment information network for energy startups, maintaining the same node and edge definitions as in the static network but incorporating time information labels. In this section, we analyze the dynamic process of the network to capture the changes in investment information of startups across different periods. Network topology features are measured based on the volume of connections and structural positions [19]. We consider the relationship between a startup’s access to investment and its connections with other startups as well as its position within the network structure, through temporal betweenness centrality and temporal closeness centrality.
Figure 2 visualizes the global energy startups investment information network, where each node represents a startup, and the connection between nodes represents that two startups have a common investor. When an investor invests in different startups successively, then the network has a directed edge from the former startup to the latter startup.
FIGURE 2
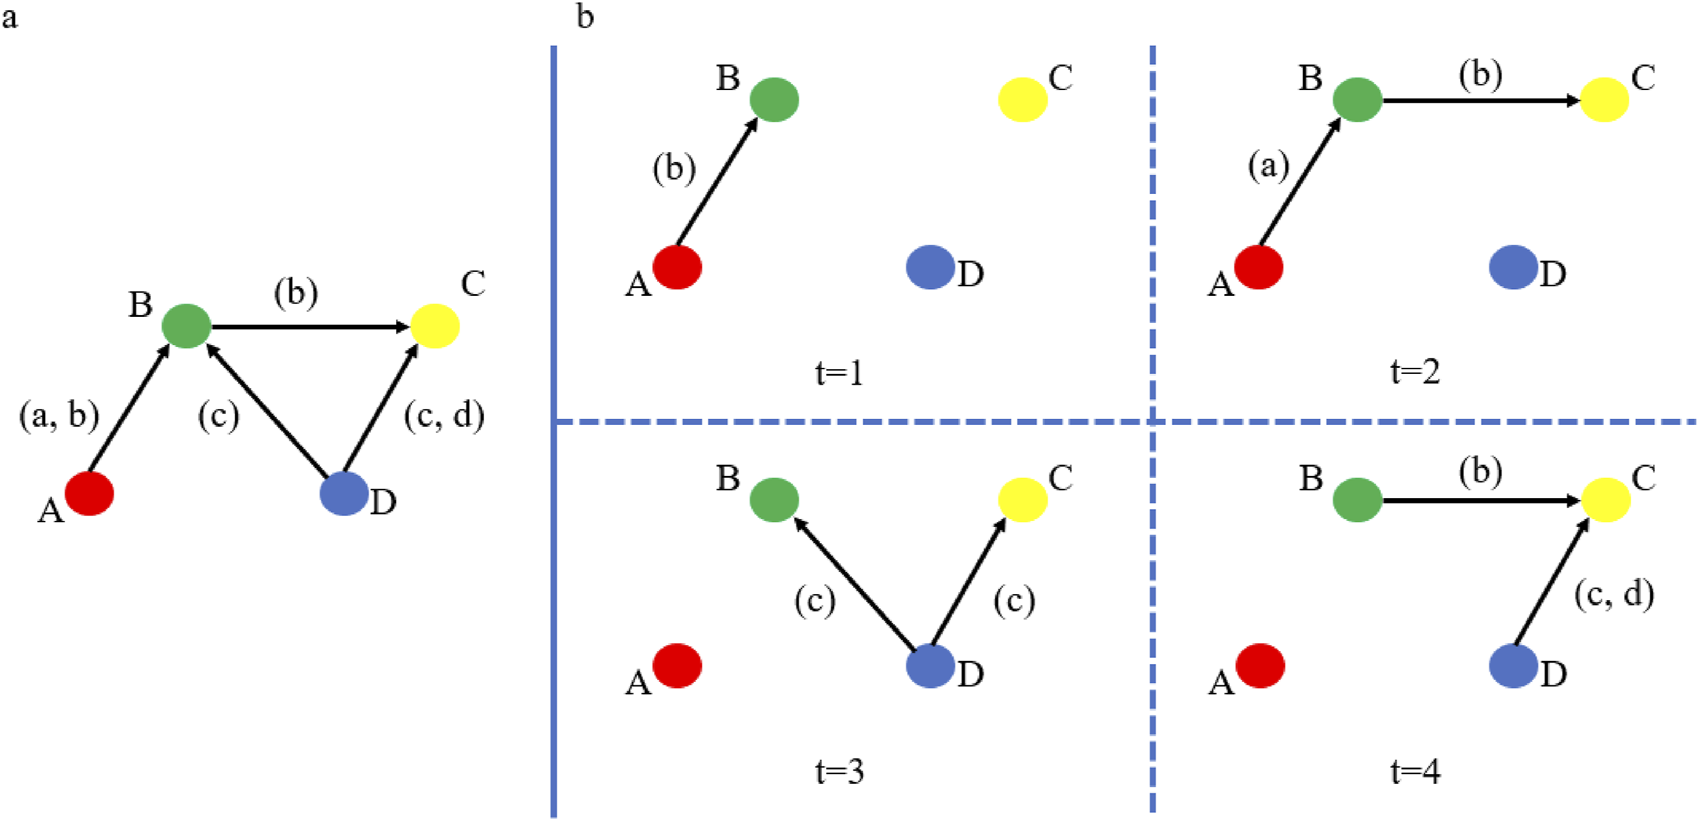
Schematic representation of global energy startups investment information network. (a) Static investment information network. (b) Temporal investment information network. Note: ABCD represent different startups, abcd denote different investors, and 1234 represent the time. The connecting edges between two startups suggest that they have a common investor, and the arrow direction represents the sequential order of the investor's investments, with the earlier-invested startup pointing to the later-invested one. The temporal network can depict the dynamics of market changes, such as the static network failing to display the investment changes of investor b due to the absence of its duration, and such changes have an impact on startups ABC.
Mathematically, following [75],the temporal network is defined at time , where the edges are represented by .At time i, if an investor first invests in startup m and then in startup n, a directed edge is created from m to n. The weight of the edge represents the number of investors who meet this condition. For example, if investors a, b, c, and d invest in startups A and B at time i, with A being invested in before B, then the directed edge , specifically expressed as Equations 5, 6:
Both temporal betweenness centrality and temporal closeness centrality require the definition of shortest paths over time. We first identify the shortest paths at each time point and then count the number of shortest paths within a specified time period. The process is described as follows in Equation 7:
Where represents the shortest path between nodes i and j at time t, and represents the count of the shortest paths from node i to node j at each time point up to time t. Thus, temporal betweenness centrality and temporal closeness centrality can be expressed as Equations 8, 9:
Where represents the number of shortest paths passing through node u between nodes i and j at time t, and represents the number of shortest paths between nodes u and v at time t.
4.3 Construction of the success evaluation model
To explore the relationship between the network variables formed by the flow of investment information among startups and the success of energy startups, we introduce Pearson correlation into our study (43) to measure the correlation of the network variables. The matrix of the Pearson correlation coefficient, P, is defined as follows in Equations 10, 11:where and are the length of two data series, is the pearson correlation coefficient between m and n, t is the number of spot data for each variable. is the average percentage value of m, is the average percentage value of n. We then estimate the following Equation 12 based on the relationship between the network variables and startup success:
Where measures the success potential of startup i. α, β and γ are the weight of different scores, and ε is an adjustment factor. represents the linkage volumes of startup i in the network, consisting of in-degree, out-degree, weighted in-degree, and weighted out-degree. denotes the structural position of startup i in the network, including temporal betweenness centrality and temporal closeness centrality. Additionally, represents control variables that may influence startup success, including government effectiveness and regulatory quality.
Finally, we evaluate the performance of the prediction model using the Area Under the Receiver Operating Characteristic Curve (AUC). Specifically, we adopt the roc_auc_score function from the Scikit-learn library [76], which is based on the Wilcoxon-Mann-Whitney statistic. This method measures the model’s ability to distinguish between positive and negative samples by comparing the ranking of predicted scores. We randomly select 80% of the innovative energy startups as the training set and the remaining 20% as the testing set. The model’s predictive accuracy is assessed by evaluating its ability to correctly predict the success of startups in the testing set, as shown in Equation 13:
Where m is the number of positive samples, n is the number of negative samples, and are the predicted scores for positive and negative samples respectively, and , 0.5 if , and 0 otherwise.
5 Results and discussion
5.1 Statistic topology on investment information network
The investment information network of energy startups exhibits complex statistical topological characteristics, with varying positions and influence of different types of startups within the network. Based on static topological analysis methods, we conduct an empirical study of the investment information networks of innovative energy, renewable energy, and traditional energy startups.
Table 2 provides the basic characteristics of energy market startups in the static network. Market share indicates the percentage of the total investment funds accounted for by the startups. Closeness centrality and betweenness centrality are calculated based on the results of the centrality experiments [77].
TABLE 2
| Type | Market occupancy | Average in-degree | Average out-degree | Average weighted in-degree | Average weighted out-degree | Static closeness centrality | Static betweenness centrality |
|---|---|---|---|---|---|---|---|
| Innovative Energy | 0.9351% | 1.715 | 1.701 | 5.365 | 5.350 | 0.118 | 3.040 |
| Renewable Energy | 30.855% | 1.662 | 1.664 | 6.718 | 6.716 | 0.130 | 2.942 |
| Traditional Energy | 68.209% | 1.564 | 1.564 | 7.576 | 7.577 | 0.133 | 2.564 |
Static network characteristics.
Note: Bold values indicate the best performance in each column.
Innovative energy startups account for less than 1% of the market, while traditional energy startups, with a market share of over 60%, remain the main force in the energy investment and financing market. However, for the three types of energy startups—innovative energy, renewable energy, and traditional energy—both the in-degree and out-degree have gradually decreased, while the weighted degree has gradually increased. Although innovative energy startups have fewer connections with other startups, the weight of these connections in the network is larger. This indicates that compared to traditional and renewable energy startups, innovative energy startups may be more inclined to select specific and strategically significant partners for in-depth cooperation, such as preferring to collaborate with institutions like venture capital and private equity, which typically provide larger amounts of investment. The betweenness centrality further reflects this, as innovative energy startups in the network are more reflective of the flow trend of investment information, and startups influence the direction and speed of the dissemination of investment information. However, the closeness centrality of innovative energy startups is the lowest among the three types of startups, possibly due to their low market share, which prevents startups from reaching more startups quickly and slows access to market information.
Although innovative energy startups have a small market share, as indicated by centrality, their influence is not insignificant. Startups with high centrality are highly connected nodes in the investment and financing network, and the resulting market influence cannot be solely determined by market share. These innovative energy startups with high centrality have a huge market influence that can have a wide impact on the investment trends of the whole investment and financing and thus dominate the development of the energy industry. In addition, markets are sensitive to volatile information, and technological innovations in the energy industry and uncertainties in economic policies can exacerbate the volatility of investment and financing in the energy market, which may in turn affect investment behavior. Therefore, analyzing the investment and financing patterns of the energy market solely based on market share and the static network is restrictive. It is necessary to conduct a dynamic analysis of the investment and financing network.
5.2 Dynamic roles of innovative energy startups
We observe the development of the energy market in recent years from a dynamic perspective. Innovative energy startups entered the market in 2010. Figure 3 shows the temporal betweenness and closeness centrality values of innovative energy startups in the temporal network from 2010 to 2024. We can observe that the distribution of betweenness centrality values is relatively uniform, with the majority being 0.000356 and 0.000178. While the closeness centrality values are relatively dispersed but concentrated within the range of 0.0006–0.001. Figure 4 separately presents the temporal betweenness and closeness centrality of the three types of startups - innovative energy, renewable energy, and traditional energy - from 2005 to 2024. In Figure 4a, the peak of connectivity in 2010 represents that innovative energy startups received significant attention immediately upon entering the market. Due to political unrest in the Middle East and the shale gas revolution in the United States, the energy market declined continuously until the Paris Climate Agreement in 2015 revitalized the energy market and maintained a relatively stable development in the subsequent years, especially with innovative energy startups becoming a key center for investment. However, both the COVID-19 pandemic in 2019 and the Russia-Ukraine war in 2022 affected the global financial market, and the energy investment and financing market was also impacted due to the interrelationships of investments among startups.
FIGURE 3
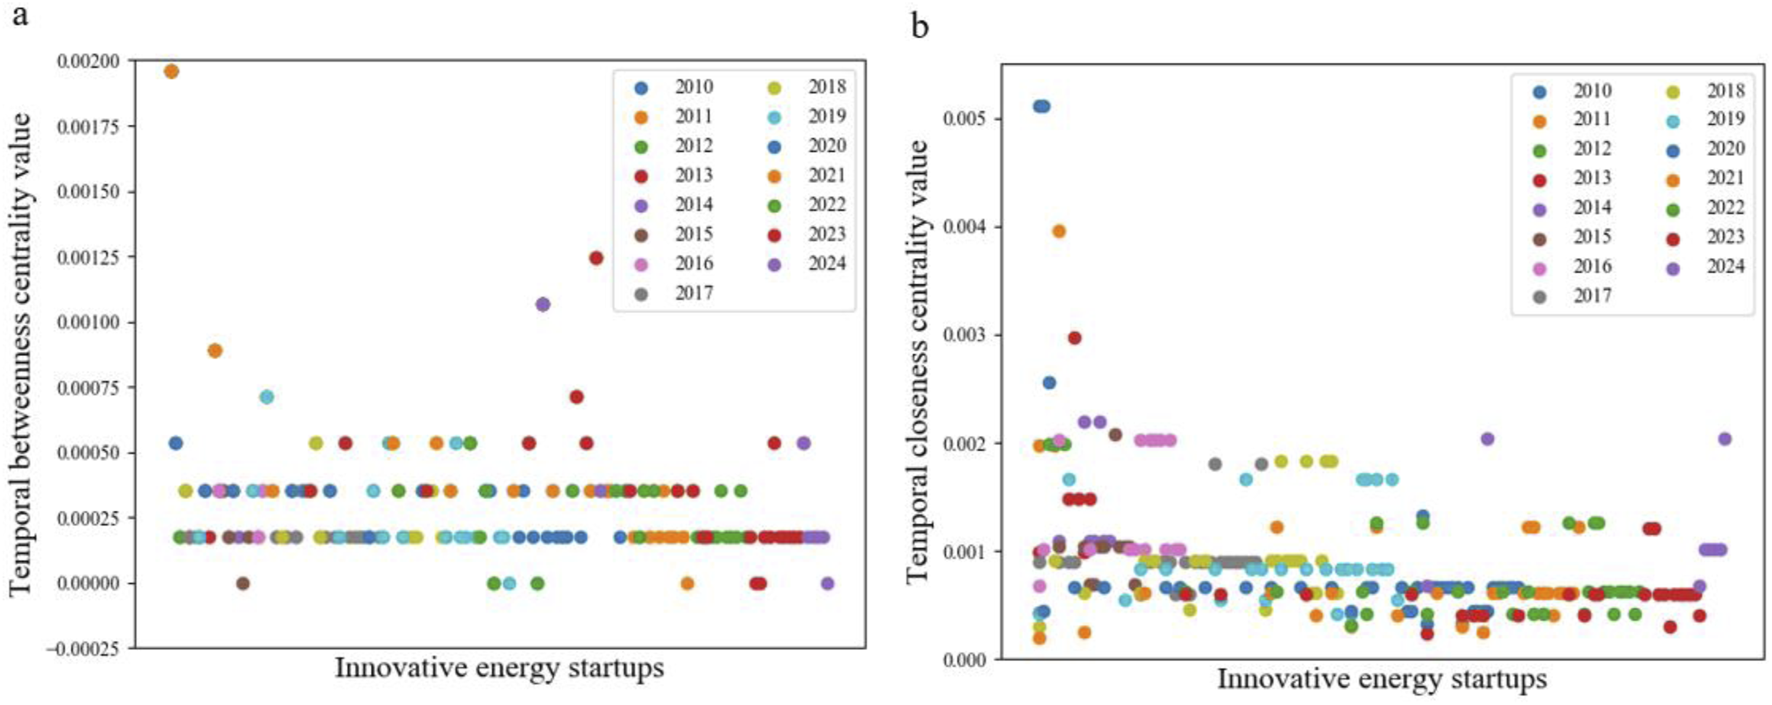
Temporal centrality values of innovative energy startups. (a) Temporal betweenness centrality of innovative energy startups. (b) Temporal closeness centrality of innovative energy startups.
FIGURE 4
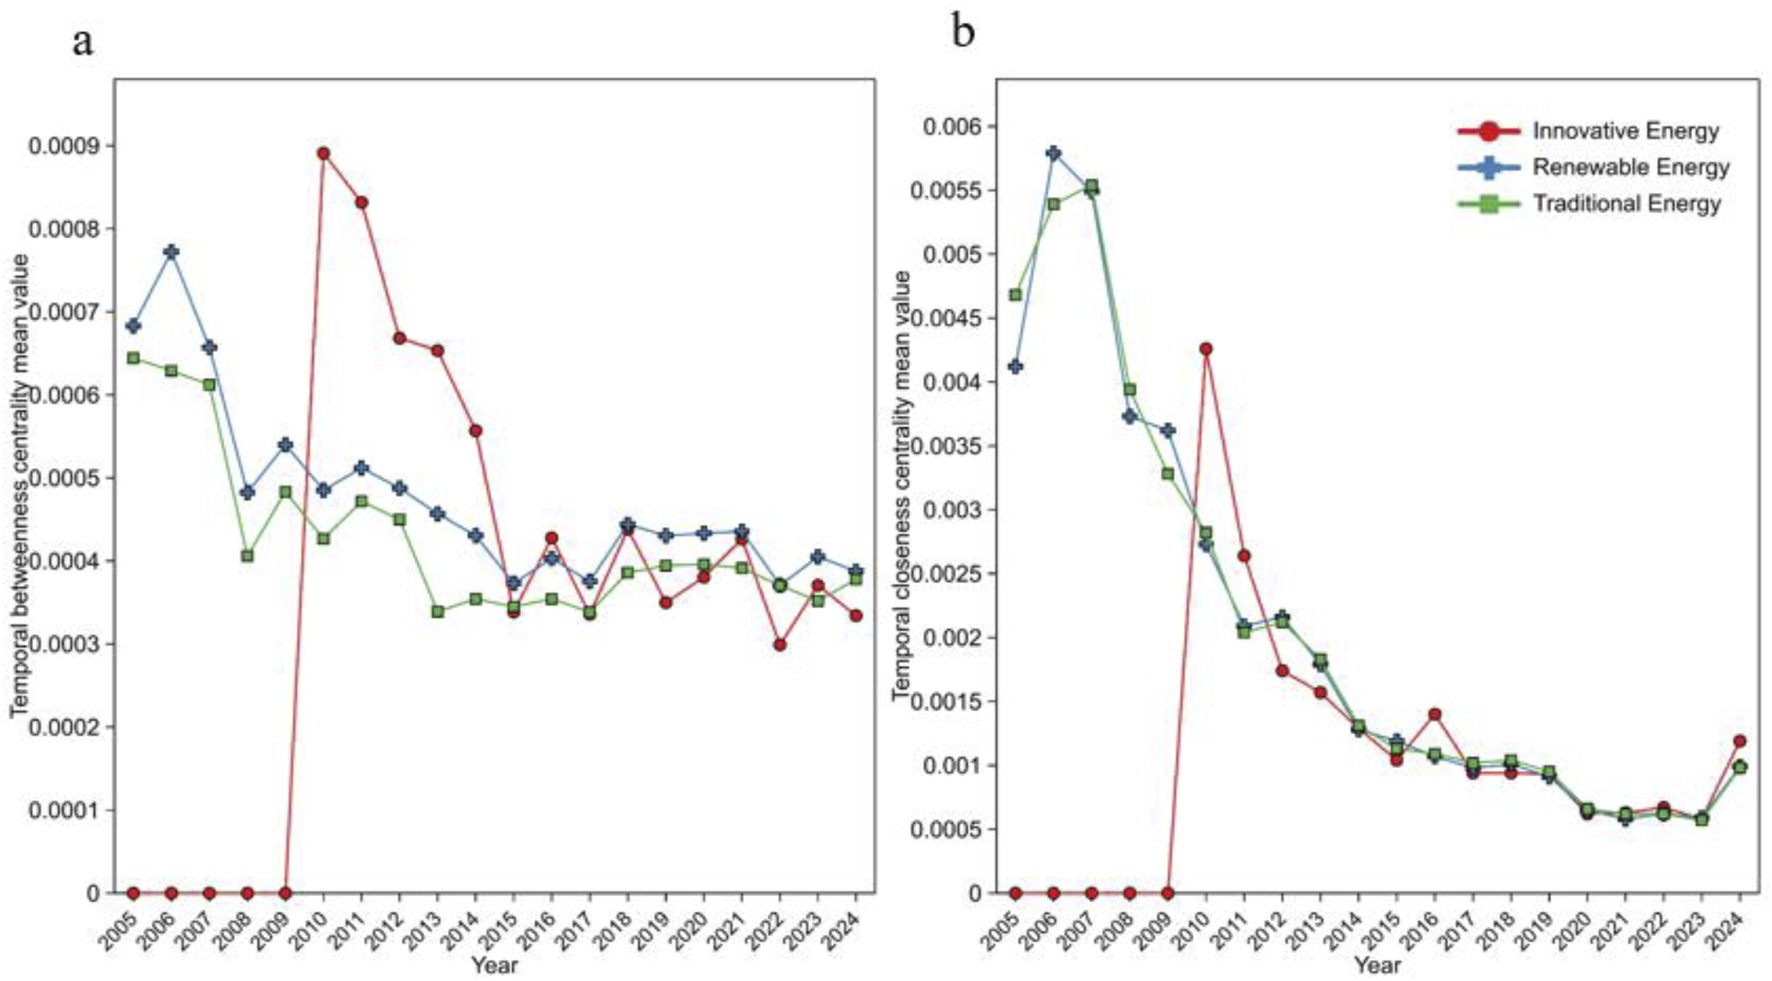
Temporal centrality of energy startups divided by industries. (a) Temporal betweenness centrality of startups. (b) Temporal closeness centrality of startups. Note: We depict the changing trends of centrality for startups classified by business type. The vertical axis of (a) represents the average temporal betweenness centrality, and the vertical axis of (b) represents the average temporal closeness centrality. Innovative energy startups are represented by red circles, renewable energy startups by blue crosses, and traditional energy startups by green squares.
We found that temporal closeness centrality differs from the traditional closeness centrality observed in static networks. Notably, with the exception of the initial phase when innovative energy startups enter the market, the three categories of startups exhibit near-total synchronization in subsequent years. As illustrated in Figure 4b, innovative energy startups displayed elevated closeness centrality during their market entry phase, a phenomenon that can be attributed to robust governmental and startup support, policy incentives, and significant capital investment. These factors collectively facilitated the rapid advancement of innovative energy technologies, bolstered investor confidence, and reinforced the startups’ prominence within the network. While traditional energy sources continue to dominate global energy supply and renewable energy sectors experience rapid growth, innovative energy startups have secured a distinct strategic position within the energy network, driven by their potential for technological disruption and their capacity to shape future industry developments.
Moreover, our analysis reveals a high degree of consistency in the changes of betweenness centrality between innovative energy startups and renewable energy startups, although innovative energy startups exhibit greater volatility. This consistency can be attributed to the shared focus of both types of startups on sustainability, their commitment to developing environmentally friendly solutions, reducing reliance on traditional energy sources such as fossil fuels, and fostering the green economy. Additionally, both categories benefit from supportive policies enacted by governments and international organizations aimed at advancing the application of and investment in clean energy technologies. However, while both innovative and renewable energy startups must remain agile in response to market dynamics, adjusting business models and technological innovations to satisfy consumer demands, innovative energy startups face heightened demands in terms of technological advancements and real-time market responsiveness. Consequently, they are more sensitive to market fluctuations. This increased sensitivity is further compounded by the fact that innovative energy startups span innovations across both traditional and renewable energy sectors, meaning that shifts in either domain can affect their market positioning. Given that innovative energy startups are still in the development phase, with technologies and markets continuing to evolve, the risks associated with investment returns are more pronounced. These factors collectively contribute to the heightened volatility observed in the betweenness centrality of innovative energy startups.
5.3 Dynamic roles of success energy startups
Through both static and dynamic analyses of the energy market, we have elucidated the characteristics of the overall energy market landscape. To investigate the relationship between successful energy startups and the energy market, we employed a temporal network framework to capture the structural positions of successful energy startups within the network, as illustrated in Figures 5, 6. Figure 5 presents the temporal trends of betweenness and closeness centrality for successful energy startups from 2005 to 2024. Our findings reveal that the distribution patterns of successful startups exhibit a notable consistency with those of innovative energy startups with regard to the distribution of betweenness centrality, which demonstrates a more uniform spread compared to closeness centrality. In the subsequent analysis, we compared the centrality values of successful startups against those of unsuccessful startups, with the results presented in Figure 6.
FIGURE 5
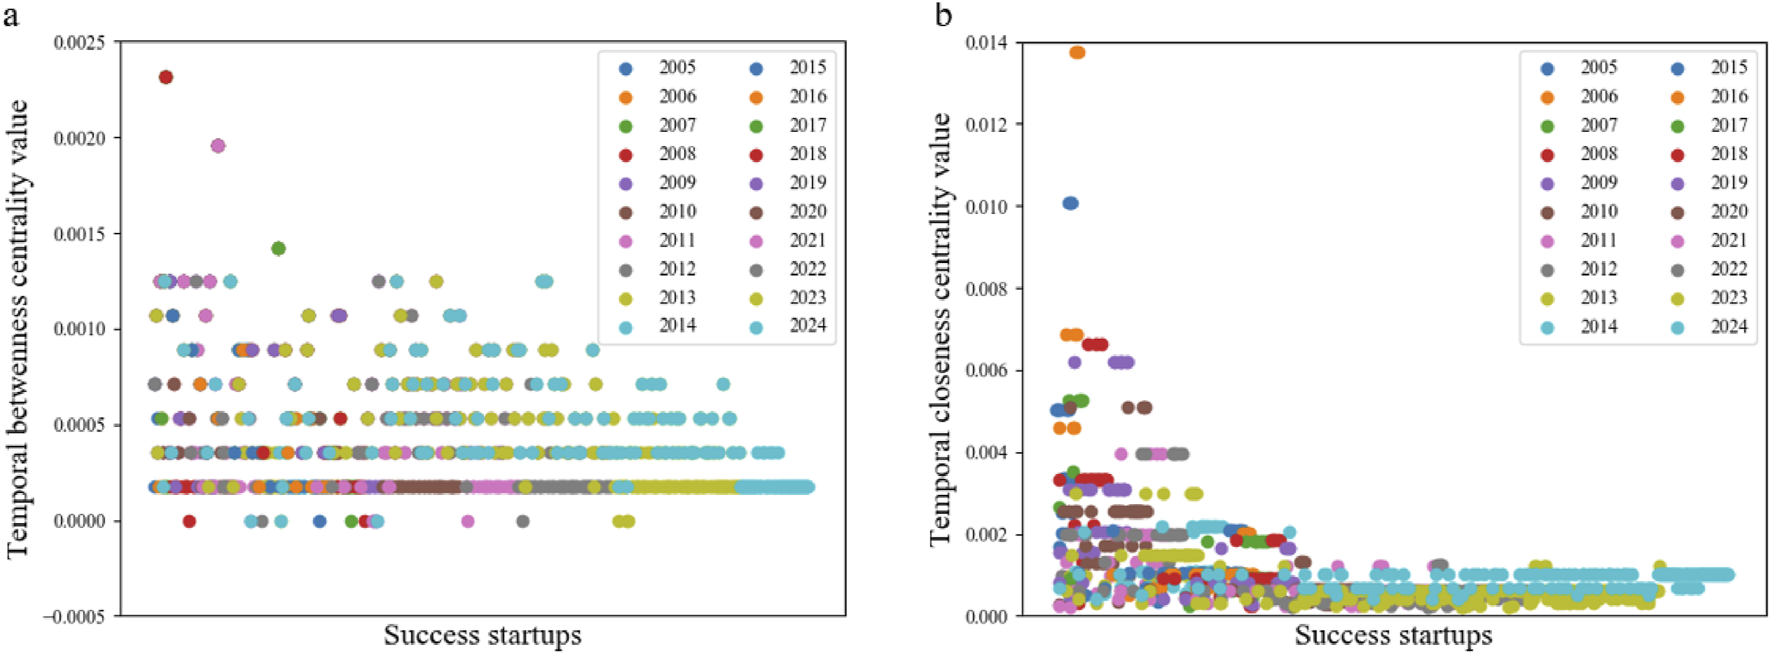
Temporal centrality values of successful startups. (a) Temporal betweenness centrality of successful startups. (b) Temporal closeness centrality of successful startups.
FIGURE 6
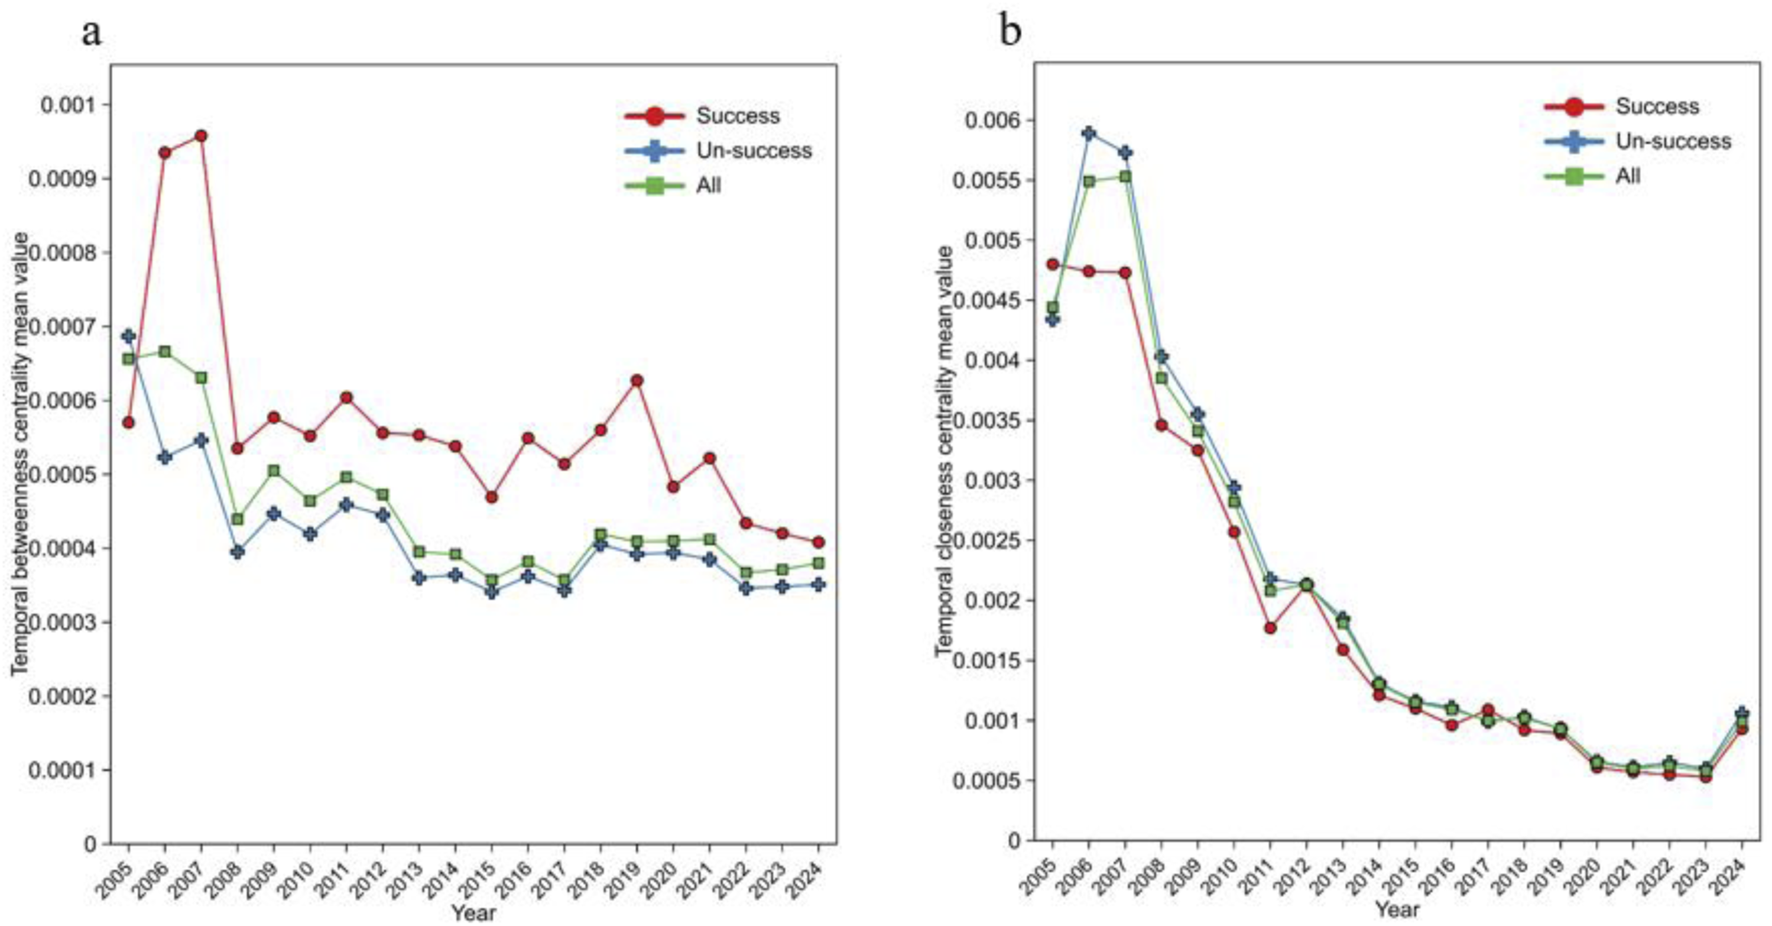
Temporal centrality of energy startups divided by success. (a) Temporal betweenness centrality. (b) Temporal closeness centrality. Note: The evolving trends in centrality for startups, categorized by success and unsuccess, are presented from 2005 to 2024. The vertical axis of (a) corresponds to the average temporal betweenness centrality of the startups, while the vertical axis of (b) reflects the average temporal closeness centrality. Successful startups are denoted by red circles, unsuccessful startups by blue crosses, and all startups are represented by green squares.
Through Figure 6, we find that successful startups generally have higher betweenness centrality than unsuccessful startups, while closeness centrality shows the opposite. Successful startups, as “bridge” nodes, play an important intermediary role in the flow of investment information between different startups, acting as links connecting multiple startups through shared investors. The high betweenness centrality of successful startups indicates their ability to attract a large number of investors and foster strong connections between investors, demonstrating high ‘investment accessibility’. High betweenness centrality also suggests that successful startups occupy a strategic position in the energy network, holding influence and power within the entire investment ecosystem. When a startup is involved in multiple investment paths, it can control the speed of information flow or selectively distribute information and opportunities to other startups. Thus, successful startups can obtain important resources through their investment information networks and may even influence the choice of cooperation partners by investors. Low closeness centrality indicates that successful startups are more distantly connected to other startups in the network, located at relatively peripheral positions, and cannot quickly access investment resources. Although successful startups play an important bridging role in the investment network, they are not located in the core areas. This could mean that successful startups are more involved in decentralized investment fields or maintain connections with specific investment circles that are not at the center of the entire investment network. Their low closeness centrality might reflect their focus on specific fields or markets rather than broad participation in all investors’ views.
Successful startups have strong cross-domain resource integration capabilities. Due to fewer direct connections with other startups, successful startups may rely on other startups to transmit information and resources, potentially affecting the timeliness of information acquisition. However, successful startups have a diverse group of investors who invest in various fields and startups, enabling them to establish extensive indirect connections through investors and access resources and information from different areas. Therefore, successful startups can acquire diverse resources and opportunities, promoting cross-domain collaboration. We find that for energy startups, although the lack of direct connections with other startups reduces the timeliness of information acquisition, increasing competition in specific fields, the diversified investment structure and indirect connections between startups may offer more flexibility and opportunities. Startups should focus on developing diversified investment portfolios to attract a broad range of investors and increase indirect connections with other startups, rather than relying solely on core investors or mainstream investment circles in the market.
5.4 Evaluation on success potential of innovative energy startups
5.4.1 Connection between startups role characteristics and success
Table 3 presents the estimated results of the relationship between startups’ combined characteristics, including their own attributes and network topological features, and startups success. Given that different network indicators conceptually capture different aspects of network role attributes, we introduce them separately into the econometric model. This mitigates issues of over-identification and multicollinearity [78]. Therefore, we estimate six independent econometric regression models, each focusing on a single network variable.
TABLE 3
| Characteristic | 1 | 2 | 3 | 4 | 5 | 6 |
|---|---|---|---|---|---|---|
| Indegree (log) | 0.411*** (0.531) | |||||
| Outdegree (log) | 0.349** (0.547) | |||||
| Weight Indegree (log) | 0.417* (0.733) | |||||
| Weight Outdegree (log) | 0.633*** (0.749) | |||||
| Betweenness centrality (log) | 0.484** (0.627) | |||||
| Closeness centrality (log) | 0.249** (0.168) | |||||
| Country (log) | 0.111 (0.542) | 0.204 (0.385) | 0.221 (1.568) | 0.371* (0.644) | 0.437*** (0.436) | 0.382** (0.182) |
| Government effectiveness (log) | 0.312* (1.382) | 0.005 (0.843) | 0.381* (1.568) | 0.213 (0.919) | 0.061 (2.955) | 0.165* (0.745) |
| Regulatory quality (log) | 0.752*** (1.372) | 0.377** (0.843) | 0.822** (1.568) | 0.631*** (0.919) | 0.667*** (2.954) | 0.166 (0.745) |
| Adjusted R-squared | 0.411 | 0.035 | 0.417 | 0.063 | 0.0085 | 0.025 |
Regression results of startups role characteristics.
Note: Standard errors are in parentheses. ***p < 0.01, **p < 0.05, *p < 0.1. We log-transform all variables to produce normally distributed model residuals. Additionally, before the log transformation, we add the mean to variables with zero values to address the issue of zeros in the dataset.
For network variables, both in-degree and weighted out-degree are statistically significantly positively correlated with successful startups at the 10% level. Additionally, out-degree, temporal betweenness centrality, and temporal closeness centrality show significance at the 5% level. These results suggest that network structure characteristics can be used to describe the characteristics of investment information in successful energy startups.
Model 1 and model 4 demonstrate relatively higher adjusted R-squared values (0.411 and 0.417, respectively), suggesting that in-degree and weighted in-degree can explain variations in startup success. This implies that the sheer number and the strength of incoming investment links may reflect external recognition or trust, which is important for startup credibility.
Regulatory quality exhibits a consistent and statistically significant positive association with startup success in five of six models, highlighting the importance of institutional environment. Government effectiveness also shows marginal significance in models, further emphasizing the role of governance in enabling entrepreneurial success.
Although model 5 and model 6 have relatively low adjusted R-squared values, the individual coefficients remain informative, suggesting that betweenness centrality and closeness centrality, while not sufficient alone, may still exert meaningful influence when considered jointly with others.
5.4.2 Accuracy of the success evaluation model
Based on the connections in 5.4.1, we design the success evaluation model, assign weights to the indicators, and evaluate its performance. Since a higher AUC indicates greater evaluation accuracy for successful startups, Table 4 confirms the validity of the proposed model. We adjusted the weights of different subsections, and notably, considering any subsection alone did not provide the best representation of the success evaluation score for successful startups. To maximize the AUC value, we exhaustively search all combinations of the weights , , , under the constraint that , where with a step size of 0.1. A higher weight indicates a greater contribution of the corresponding factor to the AUC, and thus a stronger influence on the evaluation of startup success. A weight of 0 implies that the factor has no impact on the success evaluation, while a weight of 1 indicates that the evaluation is solely determined by that single factor. When considering the network in combination with government control capacity as additional information, the AUC reaches its maximum, and the network structure characteristics contribute the most to the success evaluation of startups (with high β values when maximum AUC is achieved). Therefore, considering each startup’s role and dynamic trends in the network helps achieve a higher and more stable AUC (0.984), indicating better potential to assess future success.
TABLE 4
| α | β | γ | Success AUC |
|---|---|---|---|
| 1 | 0 | 0 | 0.916 |
| 0 | 1 | 0 | 0.967 |
| 0 | 0 | 1 | 0.889 |
| 0.3 | 0.6 | 0.1 | 0.984 |
Model precision measured by AUC.
Note: α, β, and γ are the coefficients measuring enterprise degree, centrality, and government administrative capacity. Bold values indicate the best performance.
To mitigate the risk of overfitting caused by the relatively small sample size of innovative energy startups, this study incorporated a larger dataset. Specifically, we used data from 8,900 energy startups, including 1,507 successful and 7,393 unsuccessful cases. A stratified random sampling approach was employed, allocating 80% of the data for training and 20%. When the weight parameters satisfied the condition , the model achieved an AUC of 0.875 on the test set, indicating a certain level of robustness.
To validate the robustness of our experiments, we employ a five-fold cross-validation approach. For each parameter combination (α, β, γ), the data is divided into five parts: in each iteration, one part is used for validation and the remaining four for training. We then compute the average AUC and its standard deviation for each combination. The top five AUC results obtained from the experiments are shown in Table 5. The standard deviation for each group is around 0.005, indicating the experiment demonstrates reasonable stability and robustness.
TABLE 5
| α | β | γ | mean_AUC | Std |
|---|---|---|---|---|
| 0.3 | 0.6 | 0.1 | 0.9839 | 0.0052 |
| 0.4 | 0.6 | 0.0 | 0.9837 | 0.0051 |
| 0.4 | 0.5 | 0.1 | 0.9829 | 0.0056 |
| 0.2 | 0.7 | 0.1 | 0.9819 | 0.0053 |
| 0.2 | 0.6 | 0.2 | 0.9815 | 0.0060 |
Five-fold cross-validation results of AUC.
5.5 Estimation on success potentials of innovative energy startups
We used the success evaluation model to evaluate innovative energy startups, comparing the top 20 innovative energy startups with successful startups, as shown in Figure 7.
FIGURE 7
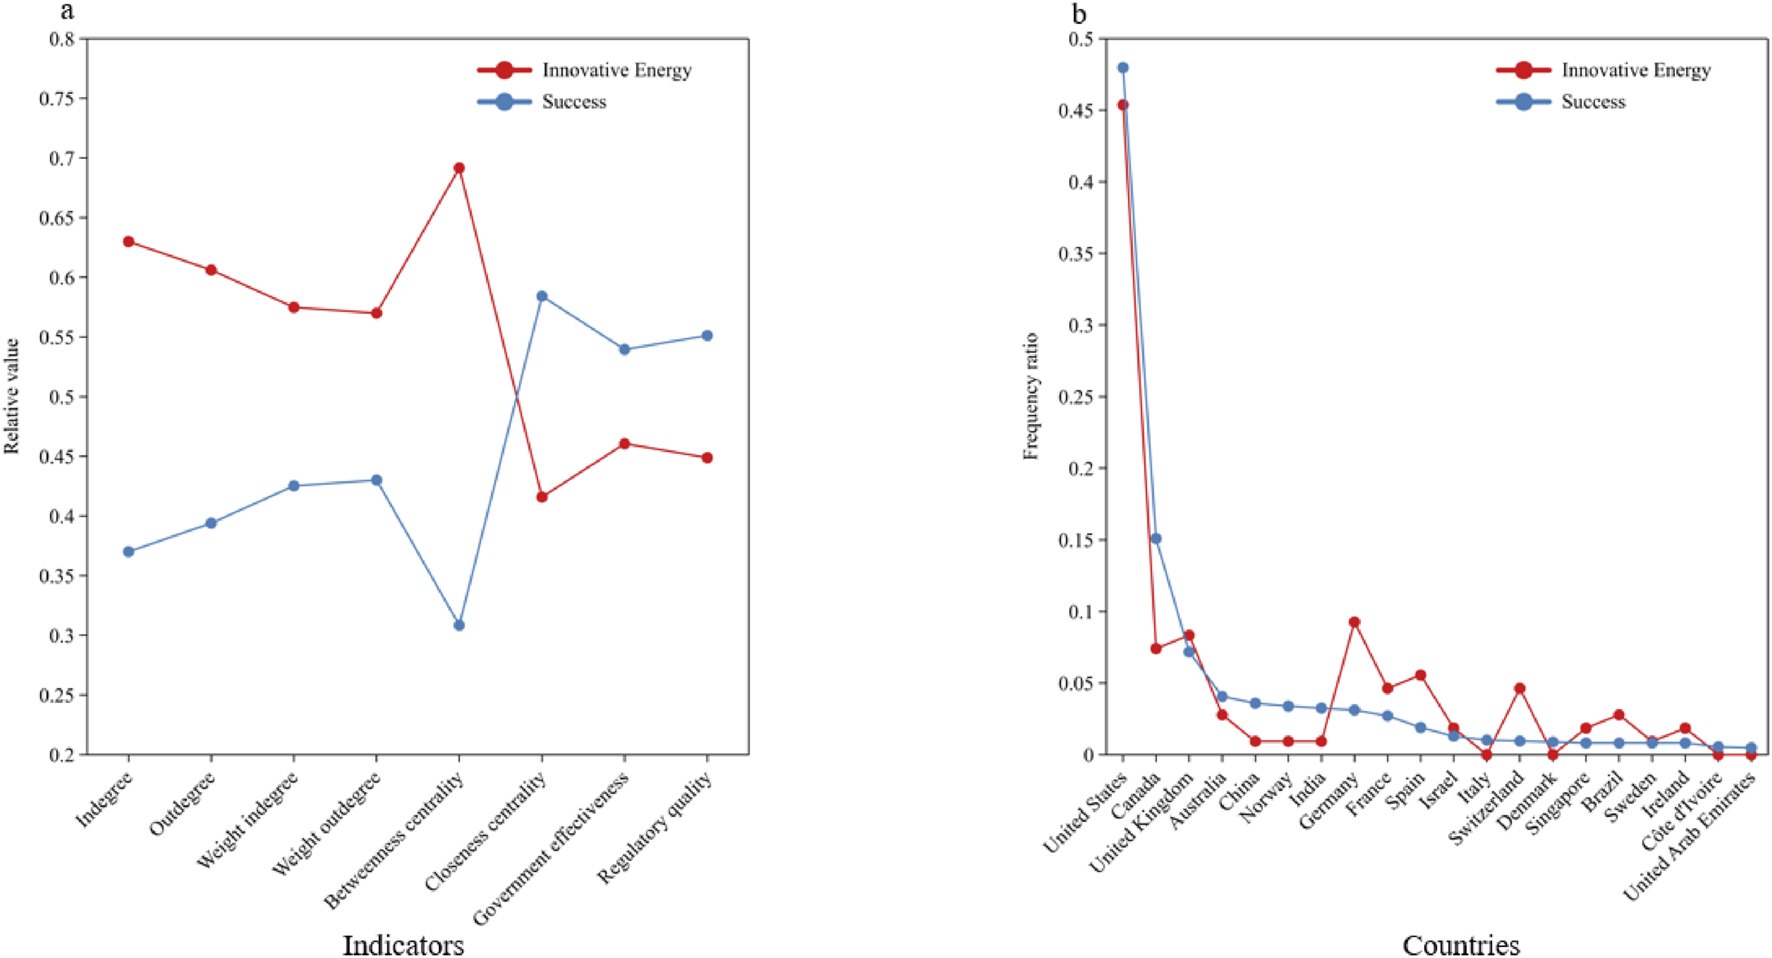
Comparison of successful energy startups and innovative energy startups. Note: We compared the values of various indicators for successful and innovative startups, as well as their national distribution. (a) shows the relative value (sum equal to 1) of each indicator for the startups. (b) shows the frequency distribution of startups in the top 20 countries where successful startups appear most frequently. Red represents innovative energy startups, and blue represents successful startups.
We found that innovative startups have higher in-degree, weighted in-degree, and betweenness centrality than successful startups, with the largest difference being in betweenness centrality. However, innovative startups lag behind successful startups in terms of closeness centrality, government efficiency, and regulatory quality.
The higher in-degree and weighted in-degree of innovative startups indicate they can attract more investment but are less effective in preventing investment outflow. The narrowing gap in weighted in-degree suggests that the strength of connections between startups plays a balancing role. Among the structural positions, betweenness centrality shows the greatest deviation between innovative and successful startups. Innovative startups have high betweenness centrality because they act as intermediaries for investment information, attracting a lot of investment. However, due to the high demands for technological updates and the high volatility of technology, compared to other startups, innovative startups’ risks are greater and cannot stabilize the investment. The lower closeness centrality means innovative startups are relatively distant from others in the network, while they play an important role in connecting different startups, they are not located in the network’s central area and cannot quickly reach other startups, possibly being far from the core decision-making circle of investments. Energy startups can play a controlling role in the flow of information, but their efficiency in actively acquiring and disseminating information is relatively low. They rely more on other startups to obtain investment information, and sending investment information to other parts of the network takes more time. Innovative energy startups play key roles in certain paths or network branches, ensuring the connectivity of different sub-networks or startup groups, but their influence or efficiency is more localized in specific sub-networks and not in the information center of the entire network.
Innovative startups perform worse than successful startups in terms of government efficiency and regulatory quality, indicating that government administrative capacity has a positive impact on promoting startup development. This emphasizes the critical role of high-quality, efficient services and a supportive regulatory environment in driving startup progress [19]. Innovative startups and successful startups show similarities in the countries they are located in, especially in developed countries like the U.S. and the U.K. On the one hand, emerging startups have the advantage of catching up by rapidly adopting innovative technologies in their industrial structure, and developed countries typically have more advanced technologies that startups can learn from to gain advantages [79]. On the other hand, governments in developed economies have been actively implementing policies to accelerate emerging technologies like AI and blockchain, and startups use effective policies to speed up technological innovation and follow or even lead market trends. For example, the Inflation Reduction Act enacted in the United States in 2022 (https://www.govinfo.gov/content/pkg/PLAW-117publ169/html/PLAW-117publ169.htm) provides targeted tax incentives for energy-related enterprises, including renewable energy development, electric vehicle adoption, and energy efficiency improvements. This policy significantly lowers the financing barriers for relevant startups and enhances their survivability and competitiveness during the early stages of development. Therefore, the country and its administrative capacity have a positive impact on energy startups, playing a key role in promoting their investment.
6 Conclusion
To achieve the energy development goals, the future development of innovative energy startups has attracted active exploration from global businesses and governments. In this paper, we contribute to this discussion by analyzing the positioning of innovative energy startups in the market through the construction of an investment information network among energy startups and by evaluating the future development directions of these startups based on assessments of their success. We argue that, in addition to the influence of domestic government administrative capabilities and policies, the development of innovative energy startups is also shaped by various forms of role attributes within the investment information network.
Firstly, although innovative energy startups account for only 0.9351% of the global energy market, their high centrality in the network suggests that they serve as highly connected nodes within the investment information network. Thus, market influence does not solely depend on market share; these highly central innovative energy startups, possessing significant market influence, can exert widespread effects on the investment trends in financing, thus shaping the development of the energy industry. From the perspectives of in-degree and weighted in-degree, innovative energy startups are more likely to engage in deep collaborations with specific, strategically important partners, and these deep collaborators typically provide significant amounts of investment.
Secondly, when innovative energy startups first enter the market, they attract substantial attention, aided by policy incentives and significant capital inflows. The connectivity of these startups fluctuates frequently, which can be explained by recent social and extreme economic events. The volatility of innovative energy startups is consistent with that of renewable energy startups during the same period, likely due to their shared focus on sustainability and benefit from green economy policies. However, innovative energy startups are more pronounced than renewable energy startups, being more sensitive to technology and market potential, and tend to react more strongly to market fluctuations.
Thirdly, successful energy startups exhibit high betweenness centrality and low closeness centrality within the network compared to other startups. High betweenness centrality indicates the ability to control the speed of information flow or selectively allocate information or opportunities to other startups, while low closeness centrality suggests that these startups are more inclined to participate in decentralized investment areas or non-network-centered investment circles. Thus, successful startups possess strong cross-domain resource integration capabilities, with a diversified investor base leading to extensive indirect connections between startups. As a result, these startups can access a wide range of resources and opportunities despite having fewer direct links with other startups.
Subsequent quantitative analysis of various indicators of successful startups reveals that network degree, network centrality, and government administrative capacity all have an impact on startup success. To further quantify the contribution of each indicator, we conducted an in-depth analysis using the success evaluation model, which has been proven to be reliable. The results indicate that network structural characteristics contribute the most to the evaluation of successful startups, with the model achieving an AUC of 0.967 when the weight is set to 1. Further optimization of weight allocation shows that when network degree, network centrality, and government administrative capacity are assigned weights of 0.3, 0.6, and 0.1, respectively, the AUC of the model improves to 0.984, demonstrating that this weighting scheme more effectively assesses startup success potential.
Finally, through the analysis of successful startups, we find that innovative energy startups can enhance their competitiveness and attractiveness by improving their market layout, business models, and strategies, gaining more capital favor and improving their potential for success and development opportunities. First, a high in-degree indicates that innovative startups have the ability to attract investment, but it is more important to stabilize existing investments. Secondly, the high betweenness centrality and low closeness centrality of innovative energy startups indicate they have the ability to control the flow of investment information, but their information dissemination efficiency is low. Therefore, startups need to expand their influence beyond localized or specific sub-networks and enhance their ability to actively acquire and disseminate investment information, thereby positioning themselves in the network’s center. Central positioning in capital flows provides startups with opportunities to access diverse resources, capabilities, and markets [80], creating excellent opportunities for knowledge sharing and learning [81], which have strategic value, allowing startups to acquire new technologies before widespread adoption, creating a virtuous cycle in technological innovation. Finally, in addition to developed countries, startups should also consider countries with proactive policies and clear development directions. For example, the Chinese government released the “Energy Production and Consumption Revolution Strategy (2016-2030)” in 2016 (https://www.gov.cn/xinwen/2017-04/25/content_5230568.htm), clearly stating the need to promote the deep integration of the internet with distributed energy technology, advanced grid technology, and energy storage technology, and to vigorously develop smart energy technologies. In 2020, the “Energy Development in the New Era” (http://www.scio.gov.cn/gxzt/dtzt/2020/xsddzgnyfzbps/) further transformed the government’s functions, supporting the development of new technologies, models, and industries, and promoting the deep integration of energy technology with modern information, materials, and advanced manufacturing technologies. China is advancing the energy industry toward intelligence and greening through policy support, market opening, innovative applications, digital transformation, and achieving carbon emission goals.
Therefore, based on the results of this study, governments should support high-potential innovative energy startups, particularly in their early stages, through instruments such as guidance funds and investment subsidies. These measures can help stabilize existing investor relationships and reduce financing uncertainty. In addition, for startups that serve as bridging nodes in the network, governments may consider designating them as key channels for technology diffusion by offering targeted support through technology pilot programs and public service platforms, thereby enhancing the overall efficiency of industry innovation. From the startup perspective, startups should actively improve their capabilities in acquiring and disseminating information. This can be achieved by participating in industry alliances and advancing digital infrastructure to strengthen their learning and communication capacities. Furthermore, they should seek to connect with diverse investor groups to expand their influence within the network. In the context of globalization, startups are also encouraged to explore emerging markets with strong policy orientation and substantial support, such as China, in order to leverage policy incentives and reinforce their central positioning in global capital and innovation networks.
Our study has some limitations. First, we focus on the investment information flow between startups, without considering intra-startup relationships. Future research could integrate the internal dynamics of startups and their impact on development. Second, we use IPO and M&A status as indicators of startup success. While this approach offers clear and observable outcomes, it does not capture other important dimensions of success, such as revenue growth, market influence, or long-term sustainability. We plan to explore alternative success metrics in future work as more comprehensive data become available. Furthermore, the proportion of innovative energy startups in our sample is relatively low. This distribution reflects the actual scarcity of such startups within the broader energy startup ecosystem, but it may also limit the generalizability of our findings regarding innovative energy startups. Future research should incorporate larger and more representative samples of innovative energy startups to further validate the conclusions drawn in this study. Finally, this study finds a significant association between high centrality and startup success, but does not establish a causal relationship. Future research may adopt longitudinal approaches such as panel data models, which track the characteristics of multiple entities over time, to examine the causal mechanisms implied by our findings.
Statements
Data availability statement
The original contributions presented in the study are included in the article/supplementary material, further inquiries can be directed to the corresponding author.
Author contributions
YW: Data curation, Formal Analysis, Investigation, Methodology, Writing – original draft. QG: Conceptualization, Funding acquisition, Supervision, Writing – review and editing.
Funding
The author(s) declare that financial support was received for the research and/or publication of this article. The authors are grateful for the funding from the National Natural Science Foundation of China (Grant No. 42001236), Young Elite Scientist Sponsorship Program by Bast (Grant No. BYESS2023413), and the National Natural Science Foundation of China (Grant No. 71991481, 71991480).
Conflict of interest
The authors declare that the research was conducted in the absence of any commercial or financial relationships that could be construed as a potential conflict of interest.
Generative AI statement
The author(s) declare that no Generative AI was used in the creation of this manuscript.
Publisher’s note
All claims expressed in this article are solely those of the authors and do not necessarily represent those of their affiliated organizations, or those of the publisher, the editors and the reviewers. Any product that may be evaluated in this article, or claim that may be made by its manufacturer, is not guaranteed or endorsed by the publisher.
References
1.
TuYWuW. How does green innovation improve enterprises’ competitive advantage? The role of organizational learning. Sustainable Prod Consumption (2021) 26:504–16. 10.1016/j.spc.2020.12.031
2.
EckerFHahnelUJJSpadaH. Promoting decentralized sustainable energy systems in different supply scenarios: the role of autarky aspiration. Front Energy Res (2017) 5:14. 10.3389/fenrg.2017.00014
3.
WurlodJDNoaillyJ. The impact of green innovation on energy intensity: an empirical analysis for 14 industrial sectors in OECD countries. Energy Econ (2018) 71:47–61. 10.1016/j.eneco.2017.12.012
4.
RehmanSUKrausSShahSAKhaninDMahtoRV. Analyzing the relationship between green innovation and environmental performance in large manufacturing firms. Technol Forecast Social Change (2021) 163:120481. 10.1016/j.techfore.2020.120481
5.
AliSIjazMSYousafILiY. RETRACTED: connectedness and portfolio management between renewable energy tokens and metals: evidence from TVP-VAR approach. Energy Econ (2023) 127:107103. 10.1016/j.eneco.2023.107103
6.
GuQLiSTianSWangY. Impact of climate risk on energy market risk spillover: evidence from dynamic heterogeneous network analysis. Energy Econ (2024) 137:107775. 10.1016/j.eneco.2024.107775
7.
UddinGSLuoTYahyaMJayasekeraRRahmanMLOkhrinY. Risk network of global energy markets. Energy Econ (2023) 125:106882. 10.1016/j.eneco.2023.106882
8.
BoonsF. Creating ecological value: an evolutionary approach to business strategies and the natural environment. Cheltenham, UK: Edward Elgar Publishing (2009).
9.
HenryMBauwensTHekkertMKirchherrJ. A typology of circular start-ups: an analysis of 128 circular business models. J Clean Prod (2020) 245:118528. 10.1016/j.jclepro.2019.118528
10.
AnconaACinelliMFerraroGIovanellaA. Network-based principles of entrepreneurial ecosystems: a case study of a start-up network. Small Business Econ (2023) 61(4):1497–514. 10.1007/s11187-023-00738-6
11.
YuYQayyumMLiS. Trade dynamics of environmental goods within global energy economy and their impacts on green technological innovation: a complex network analysis. Energy Econ (2024) 140:107957. 10.1016/j.eneco.2024.107957
12.
OkrahJNeppA. Factors affecting startup innovation and growth. Journal of Advanced Management Science (2018) 6(1):34–38. 10.18178/joams.6.1.34-38
13.
BergerLABergerDR. The talent management handbook: creating a sustainable competitive advantage by selecting, developing, and promoting the best people. McGraw-Hill (2011).
14.
CapassoMTreibichTVerspagenB. The medium-term effect of R&D on firm growth. Small Business Econ (2015) 45:39–62. 10.1007/s11187-015-9640-6
15.
BockenNMP. Sustainable venture capital–catalyst for sustainable start-up success?J Clean Prod (2015) 108:647–58. 10.1016/j.jclepro.2015.05.079
16.
SkawińskaEZalewskiRI. Success factors of startups in the EU—A comparative study. Sustainability (2020) 12(19):8200. 10.3390/su12198200
17.
MelcangiDTurenJ. Subsidizing startups under imperfect information. J Monetary Econ (2023) 139:93–109. 10.1016/j.jmoneco.2023.06.008
18.
AwayaYKrishnaV. Startups and upstarts: disadvantageous information in r&d. J Polit Economy (2021) 129(2):534–69. 10.1086/711953
19.
ZhangJBallasDLiuX. Global climate change mitigation technology diffusion: a network perspective. Energy Econ (2024) 133:107497. 10.1016/j.eneco.2024.107497
20.
XuJHYiBWFanY. Economic viability and regulation effects of infrastructure investments for inter-regional electricity transmission and trade in China. Energy Econ (2020) 91:104890. 10.1016/j.eneco.2020.104890
21.
KennedyKMEdwardsMRDoblingerCThomasZHBorreroMAWilliamsEDet alThe effects of corporate investment and public grants on climate and energy startup outcomes. Nat Energy (2024) 9:883–93. 10.1038/s41560-024-01530-w
22.
GuanWGuanQDuanYXiangC. Finding successful startups by using information flows among investors in higher order network of investments. IEEE Trans Comput Social Syst (2024) 11(5):5803–14. 10.1109/tcss.2024.3394439
23.
ChiYHuNLuDYangY. Green investment funds and corporate green innovation: from the logic of social value. Energy Econ (2023) 119:106532. 10.1016/j.eneco.2023.106532
24.
RehmanIUShahzadFLaiqueUHanifMA. Does environmental innovation improve investment efficiency. Borsa Istanbul Rev (2024) 24(1):164–75. 10.1016/j.bir.2023.11.007
25.
XuJZengSQiSCuiJ. Do institutional investors facilitate corporate environmental innovation. Energy Econ (2023) 117:106472. 10.1016/j.eneco.2022.106472
26.
SicilianoGCantoniRLonnPPorNKrySMornCet al“leave no one behind”. A power-capabilities-energy justice perspective on energy transition in remote rural communities in Cambodia. World Development (2025) 185:106793. 10.1016/j.worlddev.2024.106793
27.
BuYWangEBaiJShiQ. Spatial pattern and driving factors for interprovincial natural gas consumption in China: based on SNA and LMDI. J Clean Prod (2020) 263:121392. 10.1016/j.jclepro.2020.121392
28.
SinghMJiaoJKlobasaMFrietschR. Making energy-transition headway: a data driven assessment of German energy startups. Sustainable Energy Tech Assessments (2021) 47:101322. 10.1016/j.seta.2021.101322
29.
ChengDNiuZZhangL. Delinquent events prediction in temporal networked-guarantee loans. IEEE Trans Neural Networks Learn Syst (2020) 34(4):1692–704. 10.1109/tnnls.2020.3027346
30.
ZhaoLWangGJWangMBaoWLiWStanleyHE. Stock market as temporal network. Physica A: Stat Mech its Appl (2018) 506:1104–12. 10.1016/j.physa.2018.05.039
31.
GallagherKSHoldrenJPSagarAD. Energy-technology innovation. Annu Rev Environ Resour (2006) 31(1):193–237. 10.1146/annurev.energy.30.050504.144321
32.
PlankJDoblingerC. The firm-level innovation impact of public R&D funding: evidence from the German renewable energy sector. Energy policy (2018) 113:430–8. 10.1016/j.enpol.2017.11.031
33.
MacGillivrayAJeffreyHWallaceR. The importance of iteration and deployment in technology development: a study of the impact on wave and tidal stream energy research, development and innovation. Energy Policy (2015) 87:542–52. 10.1016/j.enpol.2015.10.002
34.
KimKKimY. Role of policy in innovation and international trade of renewable energy technology: empirical study of solar PV and wind power technology. Renew Sustainable Energy Rev (2015) 44:717–27. 10.1016/j.rser.2015.01.033
35.
DarmaniAArvidssonNHidalgoAAlborsJ. What drives the development of renewable energy technologies? Toward a typology for the systemic drivers. Renew Sustainable Energy Rev (2014) 38:834–47. 10.1016/j.rser.2014.07.023
36.
GrublerAAnadónLDGallagherKSKempenerRO'RourkeAWilsonC. Global R&D, market formation, and diffusion investments in energy technology innovation. In: Learning from historical successes and failures. Cambridge, UK: Cambridge University Press (2013). p. 292.
37.
KarltorpKGuoSSandénBA. Handling financial resource mobilisation in technological innovation systems-the case of Chinese wind power. J Clean Prod (2017) 142:3872–82. 10.1016/j.jclepro.2016.10.075
38.
SmithAContrerasGATBrisboisMCLacey-BarnacleMSovacoolBK. Inclusive innovation in just transitions: the case of smart local energy systems in the UK. Environ Innovation Societal Transitions (2023) 47:100719. 10.1016/j.eist.2023.100719
39.
ReichmanJHRaiAKNewellRGWienerJB. Intellectual property and alternatives: strategies for green innovation. Intellect Property Rights Leg Econ Challenges Development (2014) 356–91. 10.1093/acprof:oso/9780199660759.003.0012
40.
GoldsteinADoblingerCBakerEAnadónLD. Startups supported by ARPA-E were more innovative than others but an investment gap May remain. Nat Energy (2020) 5(10):741–2. 10.1038/s41560-020-00691-8
41.
JordaanSMRomo-RabagoEMcLearyRReidyLNazariJHerremansIM. The role of energy technology innovation in reducing greenhouse gas emissions: a case study of Canada. Renew Sustainable Energy Rev (2017) 78:1397–409. 10.1016/j.rser.2017.05.162
42.
JenkinsJ. Bridging the clean energy valleys of death: helping American entrepreneurs meet the nations energy innovation imperative. Oakland, CA: Breakthrough Institute (2022).
43.
GuanQAnHWangKDuanYZhangY. Functional trade patterns and their contributions to international photovoltaic trade revealed by network motifs. Energy (2020) 195:116989. 10.1016/j.energy.2020.116989
44.
BonaventuraMCiottiVPanzarasaPLiveraniSLacasaLLatoraV. Predicting success in the worldwide start-up network. Scientific Rep (2020) 10(1):345. 10.1038/s41598-019-57209-w
45.
MannRJSagerTW. Patents, venture capital, and software start-ups. Res Policy (2007) 36(2):193–208. 10.1016/j.respol.2006.10.002
46.
ArroyoJCoreaFJimenez-DiazGRecio-GarciaJA. Assessment of machine learning performance for decision support in venture capital investments. Ieee Access (2019) 7:124233–43. 10.1109/access.2019.2938659
47.
HegdeDTumlinsonJ. Does social proximity enhance business partnerships? Theory and evidence from ethnicity's role in US venture capital. Management Sci (2014) 60(9):2355–80. 10.1287/mnsc.2013.1878
48.
NandaRRhodes-KropfM. Investment cycles and startup innovation. J Financial Econ (2013) 110(2):403–18. 10.1016/j.jfineco.2013.07.001
49.
BanerjiDReimerT. Startup founders and their LinkedIn connections: are well-connected entrepreneurs more successful?Comput Hum Behav (2019) 90:46–52. 10.1016/j.chb.2018.08.033
50.
GloorPAColladonAFGrippaFHadleyBMWoernerS. The impact of social media presence and board member composition on new venture success: evidences from vc-backed US startups. Technol Forecast Social Change (2020) 157:120098. 10.1016/j.techfore.2020.120098
51.
HuangLPearceJL. Managing the unknowable: the effectiveness of early-stage investor gut feel in entrepreneurial investment decisions. Administrative Sci Q (2015) 60(4):634–70. 10.1177/0001839215597270
52.
MaaroufAFeuerriegelSPröllochsN. A fused large language model for predicting startup success. Eur J Oper Res (2025) 322(1):198–214. 10.1016/j.ejor.2024.09.011
53.
ConnellyBLCertoSTIrelandRDReutzelCR. Signaling theory: a review and assessment. J Management (2011) 37(1):39–67. 10.1177/0149206310388419
54.
ParhankangasAEhrlichM. How entrepreneurs seduce business angels: an impression management approach. J Business Venturing (2014) 29(4):543–64. 10.1016/j.jbusvent.2013.08.001
55.
HugginsRThompsonP. A network-based view of regional growth. J Econ Geogr (2014) 14(3):511–45. 10.1093/jeg/lbt012
56.
HugginsRJohnstonAThompsonP. Network capital, social capital and knowledge flow: how the nature of inter-organizational networks impacts on innovation. Industry and Innovation (2012) 19(3):203–32. 10.1080/13662716.2012.669615
57.
FerrierGDReyesJZhuZ. Technology diffusion on the international trade network. J Public Econ Theor (2016) 18(2):291–312. 10.1111/jpet.12186
58.
FaemsDBosBNoseleitFLetenB. Multistep knowledge transfer in multinational corporation networks: when do subsidiaries benefit from unconnected sister alliances?J Management (2020) 46(3):414–42. 10.1177/0149206318798037
59.
BakshyERosennIMarlowCAdamicL. The role of social networks in information diffusion. In: Proceedings of the 21st international conference on World Wide Web (2012). p. 519–28.
60.
ZhangZKLiuCZhanXXLuXZhangCXZhangYC. Dynamics of information diffusion and its applications on complex networks. Phys Rep (2016) 651:1–34. 10.1016/j.physrep.2016.07.002
61.
ZhangLLuoMBoncellaRJ. Product information diffusion in a social network. Electron Commerce Res (2020) 20:3–19. 10.1007/s10660-018-9316-9
62.
YingJ. Gradual information diffusion across commonly owned firms. J Financial Econ (2024) 156:103852. 10.1016/j.jfineco.2024.103852
63.
BarabásiALAlbertR. Emergence of scaling in random networks. Science (1999) 286(5439):509–12. 10.1515/9781400841356.349
64.
DongQZhaoYMaXZhouY. Risk spillover between carbon markets and stock markets from a progressive perspective: measurements, spillover networks, and driving factors. Energy Econ (2024) 129:107228. 10.1016/j.eneco.2023.107228
65.
FireMGuestrinC. The rise and fall of network stars: analyzing 2.5 million graphs to reveal how high-degree vertices emerge over time. Inf Process and Management (2020) 57(2):102041. 10.1016/j.ipm.2019.05.002
66.
NsourFSayamaH. Hot-get-richer network growth model. In: International Conference on Complex Networks and Their Applications. Cham: Springer International Publishing (2020). p. 532–43.
67.
BarnesMRNicosiaVCleggRG. Measuring social mobility in temporal networks. Scientific Rep (2025) 15(1):5941. 10.1038/s41598-025-89090-1
68.
WangZLiMLuJChengX. Business innovation based on artificial intelligence and blockchain technology. Inf Process and Management (2022) 59(1):102759. 10.1016/j.ipm.2021.102759
69.
TengMShenM. Fintech and energy efficiency: evidence from OECD countries. Resour Policy (2023) 82:103550. 10.1016/j.resourpol.2023.103550
70.
AriIKocM. Philanthropic-crowdfunding-partnership: a proof-of-concept study for sustainable financing in low-carbon energy transitions. Energy (2021) 222:119925. 10.1016/j.energy.2021.119925
71.
DejD. Defining and measuring entrepreneurial success. Entrepreneurship: a psychological approach (2010). p. 89–102.
72.
AmorosoNBellantuonoLMonacoADe NicolòFSommaEBellottiR. Economic interplay forecasting business success. Complexity (2021) (1):8861267. 10.1155/2021/8861267
73.
KaufmannDKraayAMastruzziM. The worldwide governance indicators: methodology and analytical issues. World Bank Policy Res Working Paper (2011) 3(2):220–46. 10.1017/s1876404511200046
74.
NewmanM. Networks. Oxford, UK: Oxford University Press (2018).
75.
HolmePSaramäkiJ. Temporal networks. Phys Rep (2012) 519(3):97–125. 10.1016/j.physrep.2012.03.001
76.
HandDJTillRJ. A simple generalisation of the area under the ROC curve for multiple class classification problems. Machine Learn (2001) 45:171–86. 10.1023/a:1010920819831
77.
BrandesU. A faster algorithm for betweenness centrality. J Math Sociol (2001) 25(2):163–77. 10.1080/0022250x.2001.9990249
78.
ShiSWongSKZhengC. Network capital and urban development: an inter-urban capital flow network analysis. Reg Stud (2022) 56(3):406–19. 10.1080/00343404.2021.1955098
79.
GrublerA. Energy transitions research: insights and cautionary tales. Energy policy (2012) 50:8–16. 10.1016/j.enpol.2012.02.070
80.
LinJY. New structural economics: a framework for rethinking development. The World Bank Res Observer (2011) 26(2):193–221. 10.1093/wbro/lkr007
81.
ChengHWJ. Factors affecting technological diffusion through social networks: a review of the empirical evidence. The World Bank Res Observer (2022) 37(2):137–70. 10.1093/wbro/lkab010
82.
Díaz-SantamaríaCBulchand-GidumalJ. Econometric estimation of the factors that influence startup success. Sustainability (2021) 13(4):2242.
Summary
Keywords
innovative energy startups, temporal networks, investment information, success relevance, development direction
Citation
Wang Y and Guan Q (2025) Studies on innovative energy startups’ topological roles and their correlation with success: based on temporal networks. Front. Phys. 13:1610832. doi: 10.3389/fphy.2025.1610832
Received
13 April 2025
Accepted
11 July 2025
Published
30 July 2025
Volume
13 - 2025
Edited by
Ze Wang, Capital Normal University, China
Reviewed by
Jionghao Huang, Peking University, China
Min Pang, Southwest Jiaotong University, China
Updates
Copyright
© 2025 Wang and Guan.
This is an open-access article distributed under the terms of the Creative Commons Attribution License (CC BY). The use, distribution or reproduction in other forums is permitted, provided the original author(s) and the copyright owner(s) are credited and that the original publication in this journal is cited, in accordance with accepted academic practice. No use, distribution or reproduction is permitted which does not comply with these terms.
*Correspondence: Qing Guan, guanqing35@126.com
Disclaimer
All claims expressed in this article are solely those of the authors and do not necessarily represent those of their affiliated organizations, or those of the publisher, the editors and the reviewers. Any product that may be evaluated in this article or claim that may be made by its manufacturer is not guaranteed or endorsed by the publisher.