- 1College of International Economics and Trade, Ningbo University of Finance and Economics, Ningbo, Zhejiang, China
- 2Ningbo Philosophy and Social Science Key Research Base “Research Base on Digital Economy Innovation and Linkage with Hub Free Trade Zones”, Ningbo, China
- 3Planning and Academic Office, Zhejiang Wanli University, Ningbo, China
- 4College of Foreign Languages, Shanghai Jianqiao University, Shanghai, China
As over 80% of global trade relies on maritime transport, and container shipping accounts for more than 90% of the total value of maritime trade. The research on collusion strategies in a monitored container transport chain based on a tripartite evolutionary game, which this paper tackles, is a very interesting topic as an application of game theory. In today’s world where global supply chains are becoming more complex, understanding the strategic interactions between the parties involved in container transport (shippers, carriers, port operators, etc.) is an essential task for improving logistics efficiency and realizing a fair competitive environment. This study investigates the strategic interactions among container terminals, liner enterprises, and Port Authorities under regulatory supervision, revealing two critical regimes. Firstly, when fines fall below regulatory costs, collusion persists despite lax supervision, stabilizing the system at a suboptimal equilibrium regardless of penalty-subsidy combinations. Secondly, when fines exceed costs, an evolutionary stable strategy (ESS) emerges if the total penalty-subsidy value undercuts collusion profits; otherwise, cyclical instability occurs as regulators oscillate between enforcement and relaxation due to fiscal constraints. Numerical simulations validate these dynamics, demonstrating how cost-profit thresholds govern strategic outcomes. Using a tripartite evolutionary game model and numerical simulations, we demonstrate how cost-profit thresholds govern these strategic outcomes. Our findings highlight the necessity of designing penalty structures that simultaneously ensure regulatory cost recovery and neutralize collusion incentives, providing actionable insights for maritime policymakers to balance deterrence effectiveness with enforcement sustainability in container shipping markets.
1 Introduction
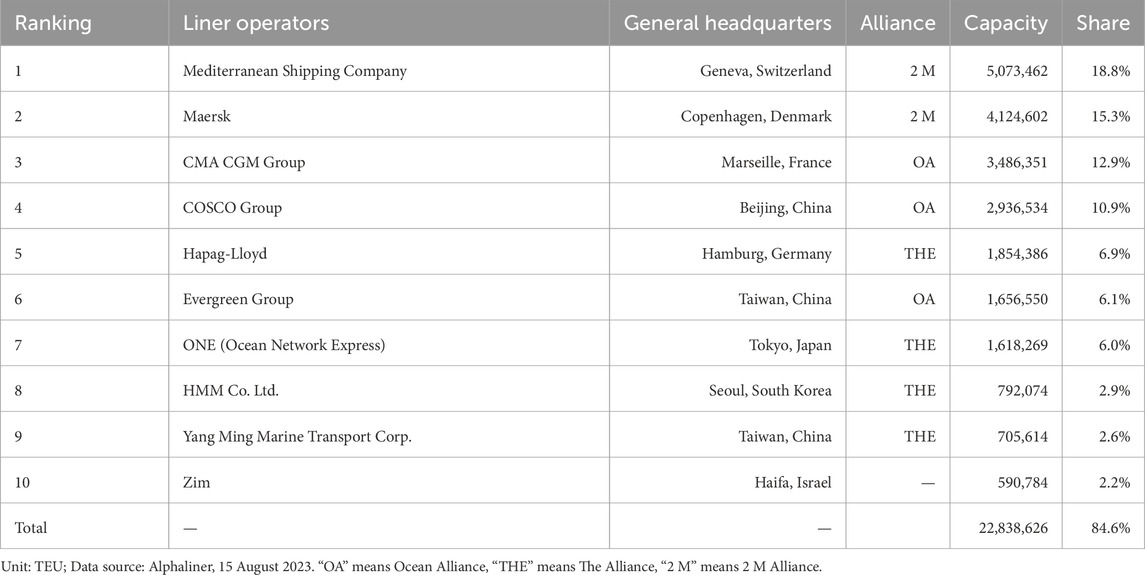
Over 80% of global trade is delivered through international shipping. As the most efficient and economical mode of transport for most goods, maritime shipping offers a reliable and affordable way to move products across borders. The vital industry supports global trade, fosters economic growth, and contributes to the prosperity of nations and communities around the world. The share of container shipping is about 60% by volume (tonnage), however, it accounts for over 90% of the total value of international maritime trade. Containerization is at the heart of modern shipping, as standardized containers have significantly improved loading and unloading efficiency and transportation safety, making them a critical pillar of global supply chains1. The top 10 Liner operators2, reported by Alphaliner which is the world-renowned shipping consulting center, indicates that all liner operators are striving for new future, as shown in Table 1.
The One Hundred Container Ports 2024, published by the world’s oldest shipping newspaper Lloyd’s List, let the world see the strong growth in China and the Middle East region. The container throughput of global top 10 container ports in the world increased slowly from 264.2 million TEU in 2020 to 300.5 million TEU in 2024, with an annual growth rate (AGR) of 3.5%.
Port, which is the hub of maritime transportation, plays an important role in promoting international trade and economic [1]. Most container ports have entered the post-epidemic recovery phase of covid-19, but still face rural tests [2]. In short term, port shutdowns caused by the epidemic continue to be staged [3]; in long term, labor shortages and industrial shifts brought by the disappearance of China’s demographic dividend make the ports facing the more and more severe situation in the future [4]. With the increasing demand of total logistics and supply chain, container terminals have the motive for collusion [5].
This study addresses three critical research questions: (1) What are the long-term optimal equilibrium strategies for a container terminal, the Port Authority, and a liner company under varying scenarios? (2) How should these three stakeholders select their long-term optimal strategies in a game-theoretic framework? (3) Does the adoption of these optimal strategies lead to an improvement in overall social welfare? To investigate these questions, we propose a tripartite evolutionary game model to analyze the dynamic interactions and decision-making processes among the stakeholders.
The remainder of this paper is structured as follows. Section 2 reviews the literature on container shipping supply chains, evolutionary game theory, and collusion regulation. Section 3 develops the formal models for each scenario under study. In Section 4, we analyze evolutionary stable strategy. In Section 5, a numerical simulation is applied. Section 6 presents the policy implications derived from our analysis, while Section 7 concludes the study by summarizing key findings and suggesting promising avenues for future research.
2 Literature review
2.1 Container shipping chain
The literature on carrier-port collusion has evolved along three key dimensions: First, vertical integration strategies [6]; second, competitive dynamics in port clusters [7]; and third, network position analysis [8]. This progression reflects a methodological shift from case-based studies to formal game theory and ultimately to network science applications, collectively deepening our understanding of tacit collusion in maritime logistics systems.
Scholarly investigations of maritime cooperation have progressed from initial studies of carrier-downstream alliances [9] to contemporary analyses of major carriers’ strategic diversification [10], advanced network architectures including both conventional [11], and foldable container systems [12], and operational decision-making frameworks ranging from game-theoretic models [13] to risk assessment tools [14]. This evolution reflects the field’s growing sophistication in addressing complex coordination challenges. Addressing the critical challenge of network reliability, Huang et al. [15] proposed a systematic approach for determining hub port locations and their associated non-hub port allocations in container shipping systems.
2.2 Evolutionary game theory
Evolutionary game theory, originally formalized through the Hawk-Dove game framework [16], has become an established methodology for examining strategic interactions among stakeholders and predicting industry dynamics over extended time horizons.
Evolutionary game theory has been widely applied across diverse industries to analyze multi-stakeholder interactions. In the sharing economy, scholars have employed tripartite evolutionary models to examine regulatory strategies [17], sustainable development mechanisms [18], and policy response dynamics [19]. Similar approaches have been adopted in energy systems research, including studies on thermal energy policy impacts [20] and behaviorally-augmented analyses of energy markets [21]. The framework has further demonstrated its versatility in business resilience studies [22] and maritime environmental governance [23], particularly regarding strategic interactions in ballast water management.
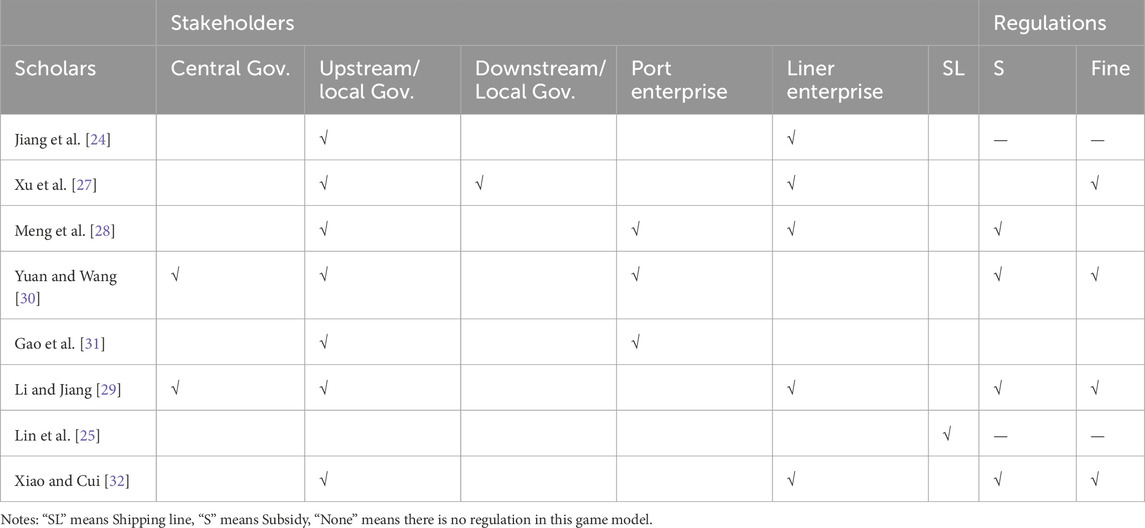
Especially, the container liner shipping industry has seen extensive application of evolutionary game theory to analyze multi-stakeholder interactions. Jiang et al. [24] examined the divergent benefits between governments and shipping companies under China’s Emission Control Area (ECA) regulations. Subsequent studies expanded this framework: Lin et al. [25] incorporated evolutionary stable strategies to assess green maritime markets, while Hu and Dong [26] modeled carrier interactions across peak and off-seasons. Further methodological advancements include tripartite model integrating prospect theory to evaluate electric ship adoption, supported by system dynamics simulations [27]. Meng et al. [28] similarly employed a three-party framework to study carbon emission reduction strategies among governments, ports, and carriers. Recent work has focused on policy-driven interactions, including analysis of marine pollution control [29] and investigation of cleaner production incentives in ports [30]. Gao et al. [31] further advanced this field through dynamic simulation of government-port enterprise relations. A comprehensive summary of these evolutionary game applications in container shipping is presented in Table 2.
2.3 Supervision on collusion
This section synthesizes key studies examining supervision mechanisms to deter collusion. Early theoretical work by Faure-Grimaud et al. [33] established a framework for evaluating supervisory efficiency in both centralized and decentralized organizational structures. Subsequent empirical research has explored diverse dimensions of supervision. In Organizational Dynamics, Fang et al. [34] demonstrated how social relationships between executives can compromise financial reporting integrity; Che et al. [35] revealed a critical trade-off in hierarchical systems between supervision inefficiency and supervisor-agent collusion risks. In Regulatory Policy Effects, Meng et al. [28] quantified how government regulatory costs and incentive structures influence emission control enforcement. Xiao and Cui [32] emphasized the necessity for adaptive regulatory policies responsive to market evolution. In Sector-Specific Applications, Lee et al. [36] identified emerging supervisory challenges of maritime sustainability. Xu et al. [27] modeled electric ship industry development through a tripartite evolutionary game framework. In Bargaining Power Dynamics, Mookherjee and Tsumagari [37] challenged conventional wisdom by proving supervisor hiring only benefits principals when supervisors maintain adequate bargaining power over agents.
2.4 Summary
While existing studies have examined the roles of central/local governments, ports, and liner companies in isolation, this study addresses a critical gap in the literature by investigating the long-term strategic interactions between container terminals and liner enterprises under Port Authority supervision. To achieve this, we develop a tripartite evolutionary game model that incorporates three key stakeholders (terminal operators, liner companies, and Port Authority) and applies evolutionary game theory to analyze sustained strategic adaptation.
This study makes three key contributions as follows: (1) Analysis of Port Authority supervision’s long-term impact on collusion strategies in container shipping chains; (2) Development of a novel tripartite evolutionary game model integrating; (3) Port Authority, terminal, and liner enterprise dynamics Validation of equilibrium stability through systematic numerical simulations.
3 Model
3.1 Problem description
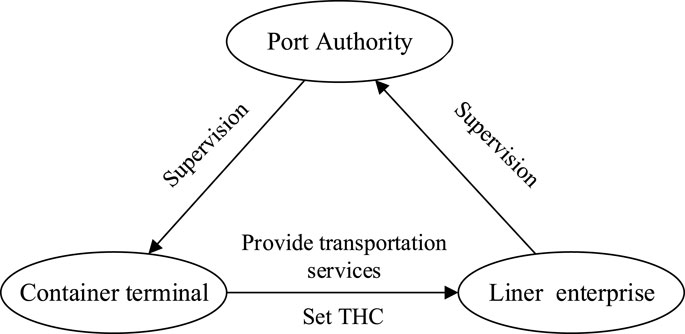
This study examines a tripartite container shipping system comprised of container terminals, liner enterprises, and the Port Authority. Within this framework, terminals and liners face strategic choices between collusion or non-collusion behaviors in long-term operations, while the Port Authority determines its regulatory intensity (strict vs. lax supervision). Figure 1 presents the evolutionary game framework depicting these strategic interactions.
3.2 Basic assumptions
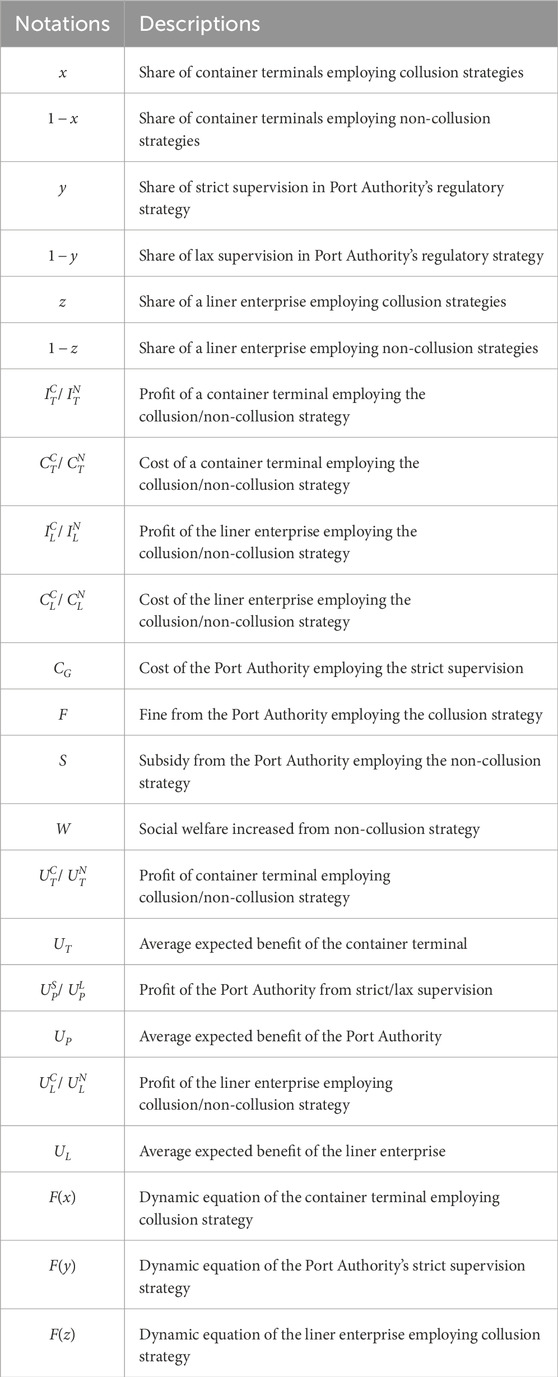
Building on prior analysis, this study conceptualizes container shipping chain governance as a dynamic equilibrium process involving multi-period strategic interactions among key stakeholders. We develop a tripartite evolutionary game model to examine the equilibrium strategies emerging between container terminals, liner enterprises, and the Port Authority, their long-term interactive behaviors, and policy implications for effective governance. All notations are defined in Table 3 [17,18].
This is an incomplete information game, the payoffs of others are uncertain, the stakeholders’ strategies evolve in the population through trial and error and natural selection, rather than static optimal solutions. The game model is grounded in the following key assumptions:
Assumption 1. The model comprises three boundedly rational actors - a container terminal, the Port Authority, and a liner enterprise - each making strategic decisions based on self-interest maximization [27]. The boundedly rational actors suggests three stakeholders do not have access to all information or accurately process complex information, and participants rely on limited data and simplified models for decision-making.
Assumption 2. This study characterizes the strategic choices of three agents using probability distributions, let
Assumption 3. When opting for collusion, a container terminal earns higher profit
Assumption 4. Similarly, for liner companies, collusion generates profit
Assumption 5. Under strict supervision, the Port Authority imposes fines on colluding terminals or liner companies, earning revenue
3.3 Replicator dynamic equations
Consistent with the bounded rational behavior specified in Assumption 1, we design the tripartite evolutionary game’s payoff matrix as presented in Table 4.
The respective payoffs for each stakeholder across different strategic scenarios are specified below:
The container terminal’s expected payoff under collusion is
The Port Authority obtains expected payoff
The liner enterprise achieves expected payoff
The evolutionary dynamics of the tripartite system, following Bomze [38], are expressed through these replicator dynamic equations:
The container terminal’s collusion strategy:
The Port Authority’s supervision strategy:
The liner enterprise’s collusion strategy:
The complete evolutionary dynamics can be obtained by substituting the payoff expressions (1)–(9) into the replicator dynamic Equations 10–12, resulting in:
4 Evolutionary stability analysis
Following Friedman’s [39] stability criteria: (i) A strategy proportion represents an evolutionary stable strategy (ESS) if it demonstrates asymptotic stability; (ii) An equilibrium point (EP) is ESS when all trajectories (tr) in its neighborhood converge to it under the replicator dynamic system (RDS); (iii) This stability is determined through Jacobian matrix analysis, obtained by partial differentiation of the dynamic system. Solving the partial derivative, the Jacobean Matrix can be obtained below:
In which,
The EPs of the RDS are
Substituting
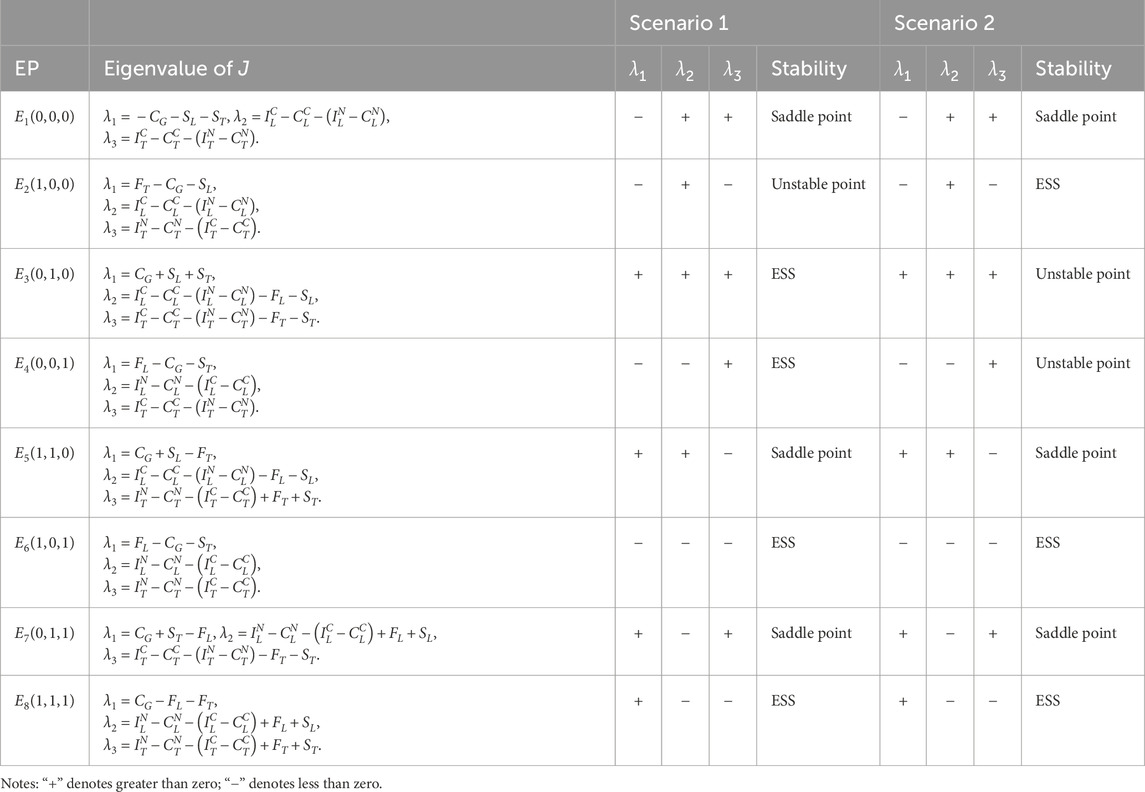
Through eigenvalue analysis of the Jacobian matrices, we classify equilibrium points according to Friedman [39]: (i) Evolutionary Stable Strategy (ESS): det(J) > 0 and trace(J) < 0; (ii) Unstable point: det(J) > 0 and trace(J) > 0; (iii) Saddle point: det(J) ≤ 0 or indeterminate. This stability classification establishes two crucial proportional relationships in the system:
Proportion 1: When regulatory fines fail to cover enforcement costs, the system converges to an evolutionary stable strategy profile (Collusion, Lax Supervision, Collusion). This equilibrium emerges irrespective of the relative magnitude between penalty-subsidy combinations (F + S) and the collusion profit differential, demonstrating inherent limitations of under-resourced regulatory regimes.
A. When the total fines imposed on colluding firms remain insufficient to offset the Port Authority’s enforcement costs and subsidy expenditures:
While
Scenario 1: When
Scenario 2: When
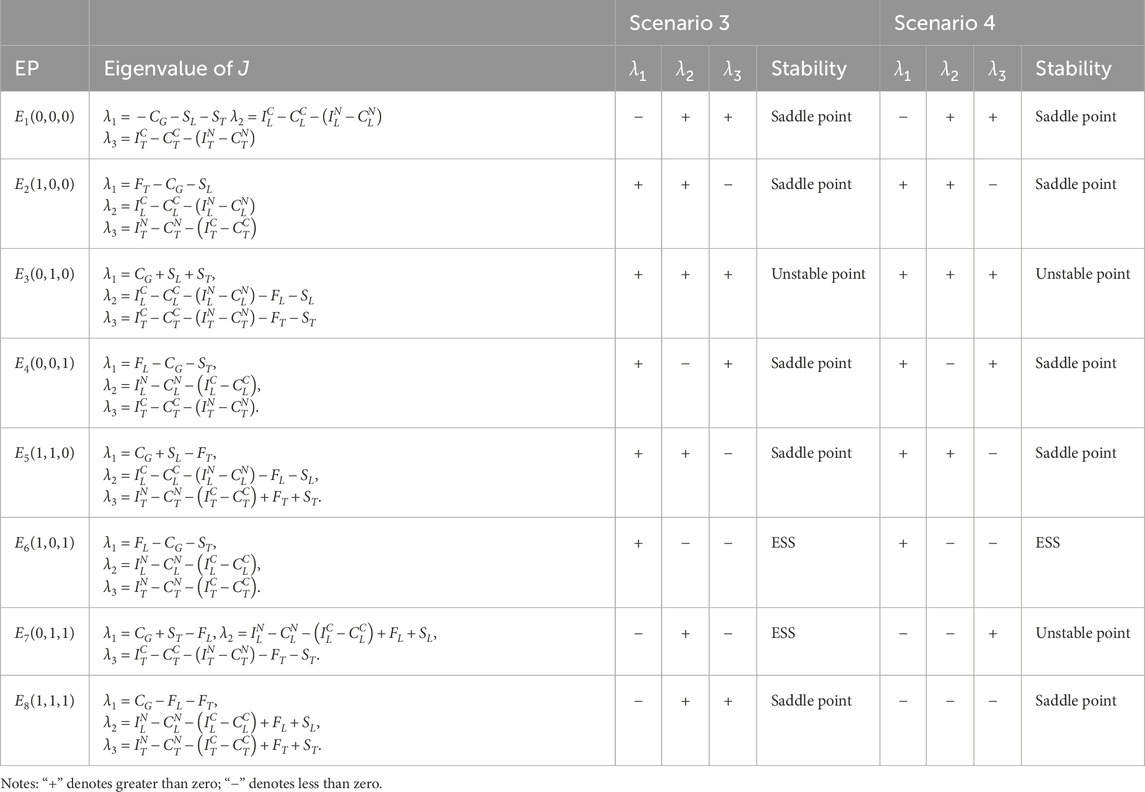
Proportion 2: When fines exceed the Port Authority’s operational costs, the evolutionary stable strategy (ESS) will stabilize at collusion under strict supervision if and only if the combined value of fines and subsidies is lower than the welfare gap generated by the container shipping chain’s collusion strategy. Conversely, no ESS exists when this combined value surpasses the profit differential of the collusion strategy.
B. When the combined penalties imposed on both the container terminal and the liner company exceed the total of the Port Authority’s operational costs and any subsidies provided:
Under conditions
Scenario 3: When
Scenario 4: Under
5 Numerical simulation
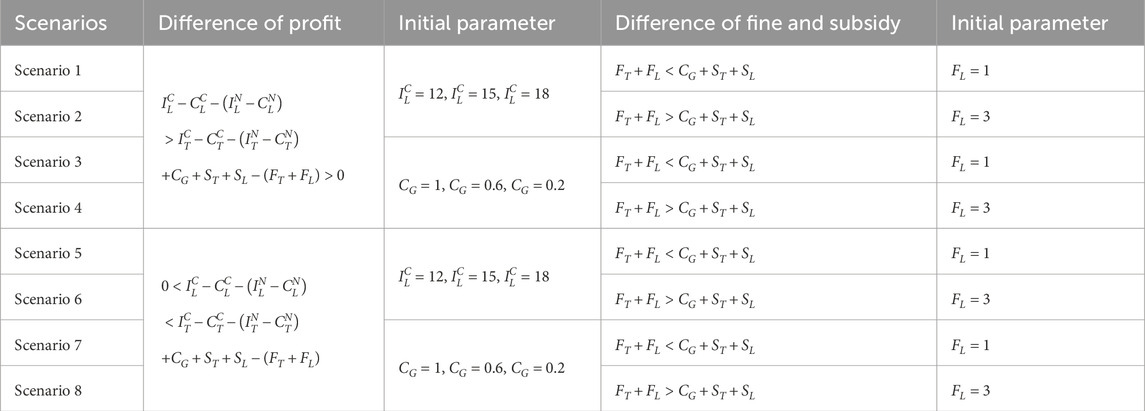
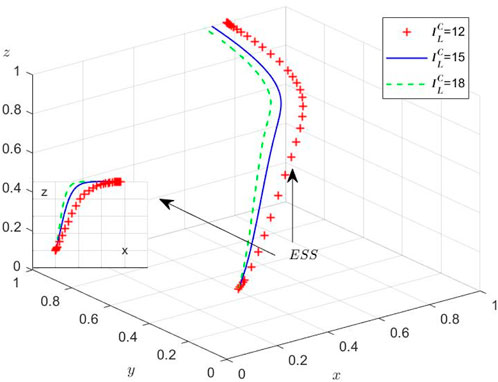
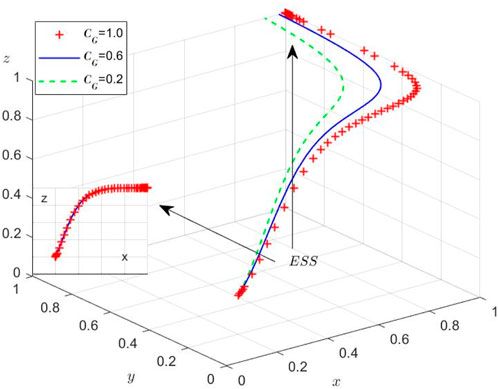
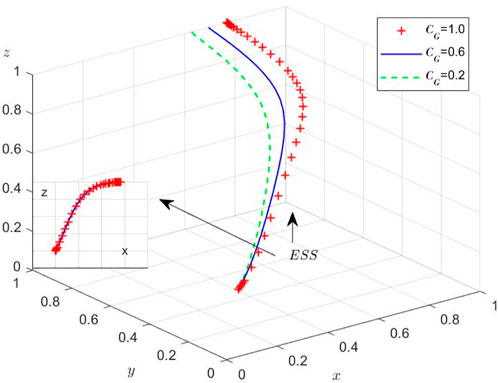
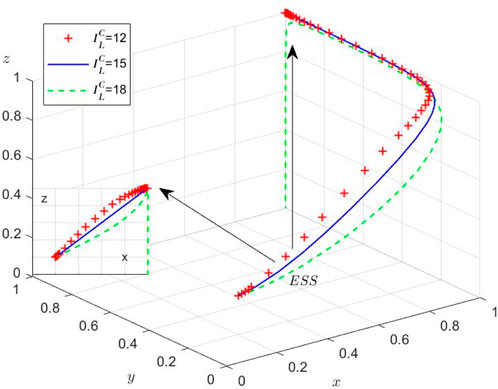
While the theoretical equilibria have been established, we conduct numerical simulations to elucidate the system’s behavioral dynamics under varying initial conditions. Using MATLAB R2012a on a computational platform (Intel 8-core processor, 16GB RAM, NVIDIA GTX 2050), we examine the evolutionary trajectories among the three stakeholders through four distinct experimental scenarios. These simulations specifically investigate: (1) regulatory inattention to supply chain violations, (2) market adaptation mechanisms, and (3) sensitivity to initial strategy distributions. Then, the Initial parameters and their values of different scenarios are set and shown in Table 7.
Based on the aforementioned simulation framework, the obtained results are summarized below:
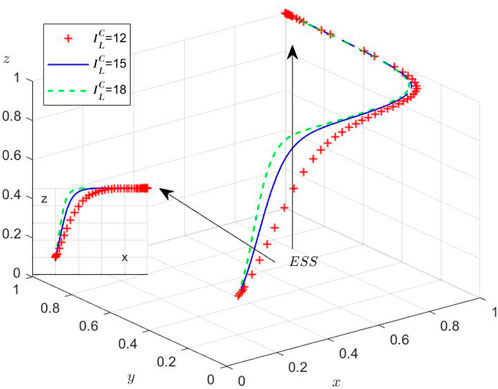
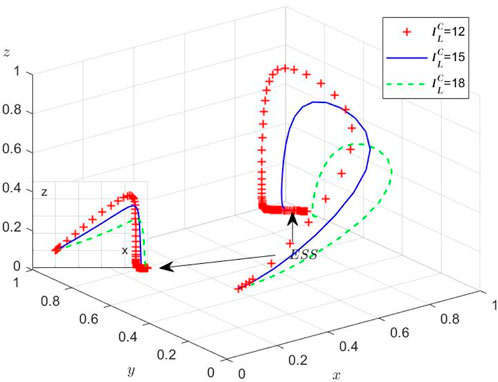
Scenario 1: Under
As liner enterprises’ collusion profits rise, their incentive to collude intensifies, prompting stronger regulatory intervention from the Port Authority to restore social welfare. Nevertheless, China’s recent shipping policy reforms face implementation challenges: (1) regulatory frameworks are in a trial-and-error phase, (2) enforcement mechanisms remain ineffective, and (3) excessive supervision costs create perverse incentives for the Port Authority to ignore collusion. This regulatory vacuum has fostered rampant collusion, a suboptimal equilibrium that undermines the long-term viability of container shipping supply chains.
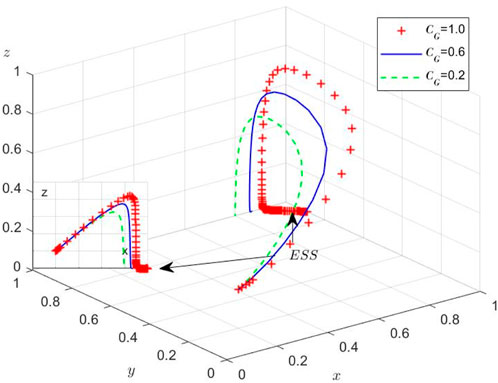
Scenario 2: When
The Port Authority’s limited regulatory capacity prevents sustained strict supervision, creating conditions conducive to collusion. Our dynamic model reveals an adaptive equilibrium where the container terminal and liner enterprise modulate collusion intensity in response to regulatory vigilance, while the Port Authority calibrates enforcement levels based on observed collusion prevalence (Figure 3). This tripartite strategic interdependence demonstrates continuous adaptation to market conditions.
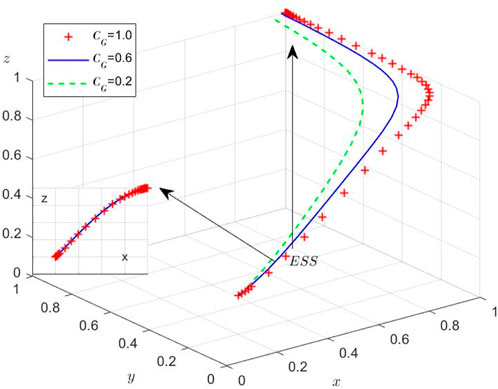
Scenario 3: Under
Scenario 4: Under
Scenario 5: When
Scenario 6: Under
Scenario 7: Under
Scenario 8: When
6 Policy implication
From a game-theoretic perspective, the container terminal and liner enterprise will rationally adopt non-collusion strategies when the combined value of regulatory penalties and incentives exceeds the welfare differential generated by collusion practices. For the Port Authority, optimizing enforcement mechanisms through either increased penalty for collusion or enhanced subsidies for compliance represents a viable pathway to promote industry health and social welfare enhancement. However, this regulatory calculus must satisfy the fundamental economic constraint whereby the total penalty-subsidy outlay exceeds supervisory costs, as otherwise fiscal unsustainability would inevitably drive regulators toward lax enforcement strategies. This equilibrium analysis reveals the critical financial thresholds necessary for effective maritime supply chain governance.
From the social welfare perspective, explicitly incorporating the negative externalities (welfare losses) to third parties (society as a whole) caused by bilateral collusion into the current payoff matrix, this can provide a path to answer the more profound policy question of “what is the optimal level of monitoring from the perspective of social welfare?”
7 Conclusion
The analysis reveals a dual-threshold regulatory dynamic in container shipping markets. When collusion proves more profitable than compliance, two distinct regimes emerge: if fines remain below the Port Authority’s operational costs, terminals and liners persistently collude despite strict supervision, creating a stable but socially suboptimal equilibrium. Conversely, when fines surpass regulatory costs, the system exhibits either disciplined operations (if penalties and subsidies jointly undercut collusion profits) or chronic instability (if they exceed them). In the latter case, cyclical behavior develops - the Port Authority initially crack down on collusion but eventually relax enforcement due to unsustainable costs, triggering renewed collusion attempts and perpetuating a regulatory pendulum effect. These findings highlight the delicate balance required in maritime governance, where penalty structures must simultaneously cover enforcement costs while remaining proportionally calibrated to the economic incentives driving collusion.
The study demonstrates that effective anti-collusion frameworks require fine-tuning three interdependent levers: penalty severity must first clear the cost-recovery threshold for regulators, then the combined value of sanctions and incentives must be strategically positioned between operational costs and illicit profits to prevent either regulatory capture or enforcement collapse. This “goldilocks zone” for maritime regulation emerges when ensuring fiscal sustainability and neutralizing profit motives without triggering oscillatory behavior. Real-world policy applications should therefore incorporate dynamic adjustment mechanisms that respond to evolving market conditions and cost structures within shipping networks.
8 Discussions
However, it is important to acknowledge that due to challenges in acquiring real-world operational data, the numerical simulations in our model employ hypothetical initial conditions to demonstrate the theoretical outcomes. While this approach effectively illustrates the fundamental dynamics of the tripartite evolutionary game, incorporating realistic demand and price uncertainties inherent in container shipping markets would further enhance the model’s practical relevance. Future research could productively expand this framework by integrating stochastic elements to better capture the volatility of shipping demand, freight rate fluctuations, and other market uncertainties that significantly influence strategic decision-making among terminals, liners, and regulators. In order to make the theoretical suggestions of this study more certain, it is essential to conduct empirical research to investigate the financial data of shipping companies and port terminals, the actual state of port usage fees, and the amount of fines in past cases of antitrust violations, and to set each parameter of the model in a realistic numerical range.
In the current model, each player’s strategy is set to a simple binary choice such as “collude/not collude” and “strict/lax supervision.” However, real strategic interactions are more complex. For example, the “surveillance intensity” may be a continuous variable, and collusion should involve “exploitation of third parties (e.g., shippers and end consumers) through bilateral collusion.” In addition, factors such as a “reputation system” or more sophisticated “counterstrategies” are not considered in the current model.
The current model assumes perfect detection of collusion under strict supervision, as reflected in Assumption 5 and the payoff matrix, where fines are always imposed on colluding firms when the Port Authority adopts strict supervision. However, in reality, the detection is rarely perfect, the Port Authority should take lots of resources to regulate, which is not possible in reality, nor is it possible to regulate all collusion, it is just an ideal state of affairs.
In particular, it is recommended that the introduction of agent-based modeling (ABM) as a direction for future research. Argue that ABM, which allows each player (agent) to have individual information, learning abilities, and heterogeneous rules of behavior, may enable analysis of emergent collusion patterns and system vulnerability to external shocks that cannot be captured by our homogeneous evolutionary game model. In addition, point out the importance of incorporating into the model how cultural and institutional factors such as business practices and the independence of regulatory authorities affect the content of players’ bounded rationality. This will pave the way for broader theory construction that explains why collusion patterns differ across countries and regions.
Data availability statement
The original contributions presented in the study are included in the article/supplementary material, further inquiries can be directed to the corresponding author.
Author contributions
ZL: Data curation, Conceptualization, Writing – review and editing, Writing – original draft, Software, Formal Analysis. YX: Resources, Writing – review and editing, Data curation, Investigation. YG: Writing – review and editing, Software, Validation, Investigation. YL: Methodology, Data curation, Writing – review and editing.
Funding
The author(s) declare that no financial support was received for the research and/or publication of this article.
Conflict of interest
The authors declare that the research was conducted in the absence of any commercial or financial relationships that could be construed as a potential conflict of interest.
Generative AI statement
The author(s) declare that no Generative AI was used in the creation of this manuscript.
Publisher’s note
All claims expressed in this article are solely those of the authors and do not necessarily represent those of their affiliated organizations, or those of the publisher, the editors and the reviewers. Any product that may be evaluated in this article, or claim that may be made by its manufacturer, is not guaranteed or endorsed by the publisher.
Footnotes
1https://www.imo.org/en/About/Pages/Default.aspx
2https://alphaliner.axsmarine.com/PublicTop100
References
1. Wan C, Zhao Y, Zhang D, Yip TL. Identifying important ports in maritime container shipping networks along the Maritime Silk Road. Ocean Coastal Manage (2021) 211:105738. doi:10.1016/j.ocecoaman.2021.105738
2. Zhang Y, Sun Z. The coevolutionary process of maritime management of shipping industry in the context of the COVID-19 pandemic. J Mar Sci Eng (2021) 9(11):1293. doi:10.3390/jmse9111293
3. Marschke M, Vandergeest P, Havice E, Kadfak A, Duker P, Isopescu I, et al. COVID-19, instability and migrant fish workers in Asia. Maritime Stud (2021) 20(1):87–99. doi:10.1007/s40152-020-00205-y
4. Zwanka RJ, Buff C. COVID-19 generation: a conceptual framework of the consumer behavioral shifts to be caused by the COVID-19 pandemic. J Int Consumer Marketing (2021) 33(1):58–67. doi:10.1080/08961530.2020.1771646
5. Dong G, Huang R, Ng P. Tacit collusion between two terminals of a port. Transportation Res E: Logistics Transportation Rev (2016) 93:199–211. doi:10.1016/j.tre.2016.06.001
6. Tan Z, Meng Q, Wang F, Kuang HB. Strategic integration of the inland port and shipping service for the ocean carrier. Transportation Res Part E: Logistics Transportation Rev (2018) 110:90–109. doi:10.1016/j.tre.2017.12.010
7. Dong G, Zheng S, Lee PTW. The effects of regional port integration: the case of Ningbo-Zhoushan Port. Transportation Res Part E: Logistics Transportation Rev (2018) 120:1–15. doi:10.1016/j.tre.2018.10.008
8. Zhang Q, Pu S, Luo L, Liu Z, Xu J. Revisiting important ports in container shipping networks: a structural hole-based approach. Transport Policy (2022) 126:239–48. doi:10.1016/j.tranpol.2022.07.020
9. Wang J, Liu J, Zhang X. Service purchasing and market-entry problems in a shipping supply chain. Transportation Res Part E: Logistics Transportation Rev (2020) 136:101895. doi:10.1016/j.tre.2020.101895
10. Paridaens H, Notteboom T. Logistics integration strategies in container shipping: a multiple case-study on Maersk Line, MSC and CMA CGM. Res Transportation Business and Manage (2022) 45:100868. doi:10.1016/j.rtbm.2022.100868
11. Zhou S, Ji B, Song Y, Samson SY, Zhang D, Van Woensel T. Hub-and-spoke network design for container shipping in inland waterways. Expert Syst Appl (2023) 223:119850. doi:10.1016/j.eswa.2023.119850
12. Jeong Y, Kim G. Reliable design of container shipping network with foldable container facility disruption. Transportation Res Part E: Logistics Transportation Rev (2023) 169:102964. doi:10.1016/j.tre.2022.102964
13. Dong G, Liu Z, Lee PTW, Chi X, Ye J. Port governance in the post COVID-19 pandemic era: heterogeneous service and collusive incentive. Ocean and Coastal Manage (2023) 232:106427. doi:10.1016/j.ocecoaman.2022.106427
14. Nguyen S, Chen PSL, Du Y. Risk assessment of maritime container shipping blockchain-integrated systems: an analysis of multi-event scenarios. Transportation Res Part E: Logistics Transportation Rev (2022) 163:102764. doi:10.1016/j.tre.2022.102764
15. Huang L, Tan Y, Guan X. Hub-and-spoke network design for container shipping considering disruption and congestion in the post COVID-19 era. Ocean and Coastal Manage (2022) 225:106230. doi:10.1016/j.ocecoaman.2022.106230
16. Smith JM. Evolutionary game theory. Physica D: Nonlinear Phenomena (1986) 22(1-3):43–9. doi:10.1016/0167-2789(86)90232-0
17. Lei LC, Gao S, Zeng EY. Regulation strategies of ride-hailing market in China: an evolutionary game theoretic perspective. Electron Commerce Res (2020) 20(3):535–63. doi:10.1007/s10660-020-09412-5
18. Pu D, Xie F, Yuan G. Active supervision strategies of online ride-hailing based on the tripartite evolutionary game model. IEEE Access (2020) 8:149052–64. doi:10.1109/access.2020.3012584
19. Zhang Y, Xiang C, Li L, Jiang H. Evolutionary game analysis and simulation with system dynamics for behavioral strategies of participants in crowd logistics. Transportation Lett (2021) 13(7):540–54. doi:10.1080/19427867.2020.1783609
20. Fang Y, Chen L, Mei S, Wei W, Huang S, Liu F. Coal or electricity? An evolutionary game approach to investigate fuel choices of urban heat supply systems. Energy (2019) 181:107–22. doi:10.1016/j.energy.2019.04.129
21. Wang XP, Zhang ZM, Guo ZH, Chang S, Sun LH. Energy structure transformation in the context of carbon neutralization: evolutionary game analysis based on inclusive development of coal and clean energy. J Clean Prod (2023) 398:136626. doi:10.1016/j.jclepro.2023.136626
22. Hafezalkotob A, Nersesian L, Fardi K. A policy-making model for evolutionary SME Behavior during a pandemic recession supported on Game Theory Approach. Comput and Ind Eng (2023) 177:108975. doi:10.1016/j.cie.2022.108975
23. Ye J, Chen J, Shi J, Jie Z, Hu D. Game analysis of ship ballast water discharge management—triggered by radioactive water release from Japan. Ocean and Coastal Manage (2022) 228:106303. doi:10.1016/j.ocecoaman.2022.106303
24. Jiang B, Wang X, Xue H, Li J, Gong Y. An evolutionary game model analysis on emission control areas in China. Mar Pol (2020) 118:104010. doi:10.1016/j.marpol.2020.104010
25. Lin DY, Juan CJ, Ng M. Evaluation of green strategies in maritime liner shipping using evolutionary game theory. J Clean Prod (2021) 279:123268. doi:10.1016/j.jclepro.2020.123268
26. Hu ZH, Dong YJ. Evolutionary game models of cooperative strategies in blockchain-enabled container transport chains. Asia-Pacific J Oper Res (2022) 39(01):2140029. doi:10.1142/s0217595921400297
27. Xu L, Di Z, Chen J. Evolutionary game of inland shipping pollution control under government co-supervision. Mar Pollut Bull (2021) 171:112730. doi:10.1016/j.marpolbul.2021.112730
28. Meng L, Liu K, He J, Han C, Liu P. Carbon emission reduction behavior strategies in the shipping industry under government regulation: a tripartite evolutionary game analysis. J Clean Prod (2022) 378:134556. doi:10.1016/j.jclepro.2022.134556
29. Li JM, Jiang SS. How can governance strategies be developed for marine ecological environment pollution caused by sea-using enterprises? —A study based on evolutionary game theory. Ocean and Coastal Manage (2023) 232:106447. doi:10.1016/j.ocecoaman.2022.106447
30. Yuan K, Wang X. Promoting cleaner production in ports: analysis of joint governance by central and local governments. Transportation Res Rec (2023):03611981231175909.
31. Gao W, Guo W, Zhou S, Wu S, Yang Z. The evolution of the relationship among stakeholders in port integration: evidence from tripartite evolutionary game analysis. Ocean and Coastal Manage (2023) 240:106628. doi:10.1016/j.ocecoaman.2023.106628
32. Xiao G, Cui W (2023). Evolutionary game between government and shipping enterprises based on shipping cycle and carbon quota[J]. Front Mar Sci, 10, 1132174, doi:10.3389/fmars.2023.1132174
33. Faure-Grimaud A, Laffont JJ, Martimort D. Collusion, delegation and supervision with soft information. Rev Econ Stud (2003) 70(2):253–79. doi:10.1111/1467-937x.000244
34. Fang X, He K, Meng Y, Ye J. Supervision or collusion? CEO–CFO social ties and financial reporting quality. J Account Lit (2022) 44(2/3):133–53. doi:10.1108/jal-03-2022-0031
35. Che X, Huang Y, Zhang L. Supervisory efficiency and collusion in a multiple-agent hierarchy. Games Econ Behav (2021) 130:425–42. doi:10.1016/j.geb.2021.09.003
36. Lee PTW, Kwon OK, Ruan X. Sustainability challenges in maritime transport and logistics industry and its way ahead. Sustainability (2019) 11(5):1331. doi:10.3390/su11051331
37. Mookherjee D, Tsumagari M. Regulatory mechanism design with extortionary collusion. J Econ Theor (2023) 208:105614. doi:10.1016/j.jet.2023.105614
38. Bomze IM. Lotka-Volterra equation and replicator dynamics: a two-dimensional classification. Biol cybernetics (1983) 48(3):201–11. doi:10.1007/bf00318088
Keywords: container shipping industry, evolutionary game theory, port authority, liner enterprise, strict supervision
Citation: Liu Z, Xu Y, Gao Y and Li Y (2025) Collusion strategies of container shipping chain under supervision based on tripartite evolutionary game. Front. Phys. 13:1629665. doi: 10.3389/fphy.2025.1629665
Received: 16 May 2025; Accepted: 16 July 2025;
Published: 31 July 2025.
Edited by:
Matjaž Perc, University of Maribor, SloveniaReviewed by:
Min Xu, Chinese Academy of Fishery Sciences, ChinaQi Xu, Guilin University of Electronic Technology, China
Copyright © 2025 Liu, Xu, Gao and Li. This is an open-access article distributed under the terms of the Creative Commons Attribution License (CC BY). The use, distribution or reproduction in other forums is permitted, provided the original author(s) and the copyright owner(s) are credited and that the original publication in this journal is cited, in accordance with accepted academic practice. No use, distribution or reproduction is permitted which does not comply with these terms.
*Correspondence: Zongtuan Liu, enRsaXVAbmJ1ZmUuZWR1LmNu
 Zongtuan Liu
 Ying Xu1,2