- 1School of Financial Technology, Shanghai Lixin University of Accounting and Finance, Shanghai, China
- 2Antai College of Economics and Management, Shanghai Jiao Tong University, Shanghai, China
- 3School of Economics and Management, Tongji University, Shanghai, China
Introduction: This study investigates the effect of recently implemented quote limits policy in China’s A-share Main Board market, a mechanism designed to enhance market stability. We examine whether this policy achieves its goals uniformly across distinct large-cap (HS300) and mid-to-small cap (CSI500) market segments.
Methods: Utilizing the Multifractal Detrending Moving Average Cross-Correlation analysis (MF-X-DMA) and the nonlinear Granger causality test, we assess the policy’s potential heterogeneous impact on these two indices.
Results: Our findings reveal that the policy decreases market efficiency and increases cross-market co-movement complexity for HS300, while conversely improving market efficiency and information flow for CSI500.
Discussion: We offer novel empirical evidence on this policy using nonlinear methods. Our findings highlight the potentially divergent and unintended consequences of “one-size-fits-all” financial regulations across varied market segments, providing valuable insights for policymakers.
1 Introduction
Global financial markets, while important for capital allocation and economic growth, are often prone to extreme volatility and market anomalies. To mitigate systemic risks and safeguard investor interests, regulators worldwide have actively implemented various market stability mechanisms. For instance, in the United States, key mechanisms include comprehensive circuit breakers, order protection rule, and market-wide trading halts during periods of intense volatility. Similarly, Japan’s equity markets utilize daily price range limits (often called “daily price limits”) for individual stocks and futures contracts, alongside circuit breakers applied to major indices like the Nikkei 225, to ensure orderly price formation. These measures generally aim to curb excessive speculation, prevent “flash crashes,” and ensure orderly trading. As the world’s second-largest economy, China’s financial market regulators have similarly intensified efforts to refine trading mechanisms, particularly in response to its burgeoning stock market and increasing participation.
A significant development in this regard is the recent introduction of the quote limits system (also called “price cage”) in China’s A-share Main Board market. This policy, detailed in revised trading rules issued by the Shanghai Stock Exchange and Shenzhen Stock Exchange on 17 February 2023, became effective on 10 April 2023, coinciding with the listing of the first batch of registration-based main board stocks. Specifically, during the continuous auction phase (9:30-11:30 and 13:00-14:57), buy orders are restricted to a maximum of 102% of the benchmark selling price, while sell orders cannot be below 98% of the benchmark buying price. This “refusal mechanism” for invalid orders is designed to prevent large abnormal quotes, counter manipulative behaviors, and ultimately enhance market stability.
Despite the recent implementation and significant regulatory implications of this policy, empirical research on the A-share Main Board’s quote limits remains limited. While existing literature [1–5] extensively analyzes the impact of broader price limit policies (e.g., daily price limits or circuit breakers) on market quality, few studies have investigated the effects of the more continuously applied quote limits, particularly within the unique context of China’s market and on distinct market segments. This research gap presents an important opportunity to contribute to a deeper understanding of real-world policy outcomes.
To understand whether this policy achieves its intended goals uniformly across diverse market segments, this study specifically focuses on two pivotal and distinct benchmarks of the Chinese equity market: the large-cap HS 300 (HS300) and the mid-to-small cap CSI 500 (CSI500) indices. Given that component stocks of these two indices differ in market capitalization, investor composition, and liquidity profiles, the quote limits policy may exert differential impacts [6–10]. For instance, CSI500 stocks are often more susceptible to manipulative practices, as their relatively smaller market size allows for significant price fluctuations with comparatively less capital. Conversely, extreme price movements in large-cap stocks (HS300) are less likely to be driven purely by manipulation and may, instead, more frequently stem from informed trading activities or the rapid incorporation of significant news. Therefore, we hypothesize that the quote limits policy might differentially impact these two market segments: for the HS300, it could inadvertently restrict the execution of legitimate informed trades, thereby potentially distorting information processing and leading to decreased market efficiency. Conversely, for the mid-to-small cap CSI500, the policy might effectively curb speculative and manipulative behaviors, thus fostering greater market orderliness and enhancing overall efficiency.
Understanding financial market dynamics requires moving beyond traditional linear frameworks, as market returns often exhibit complex, non-Gaussian, and multi-scale characteristics [11–19]. For example, Gu and Huang [20] and Zhou et al. [21] demonstrate that daily stock returns frequently display high kurtosis (indicating “fat tails”) and non-zero skewness, highlighting their significant deviations from normality. Such widely observed features, including leptokurtosis and long-range correlations, are very common in financial time series [17, 22]. Traditional linear models are often insufficient to capture these intricate aspects, such as varying degrees of market efficiency across different scales and complex nonlinear interdependencies [23]. Therefore, advanced non-linear and multifractal analysis tools are essential for comprehensively uncovering the underlying mechanisms and policy impacts [12, 21, 24].
A substantial body of literature, grounded in fractal theory and nonlinear dynamics, provids a suite of powerful tools for such analyses. Based on the fractal theory, some studies propose various multifractal analysis techniques, such as Detrended Fluctuation Analysis (DFA) [25], Multifractal Detrended Fluctuation Analysis (MF-DFA) [26], Detrended Cross-Correlation Analysis (DCCA) [27], Multifractal Detrended Cross-Correlation Analysis (MF-DCCA) [28], and Multifractal Detrending Moving Average Cross-Correlation Analysis (MF-X-DMA) [29]. These methods are also widely used to analyze the structure of financial markets and the cross-correlations among them. For example, Zhou et al. [21] and Acikgoz [16] utilize MF-DCCA to examine multifractal characteristics and long-range cross correlations among individual stocks or financial markets. Among these methods, the MF-X-DMA is known for its enhanced robustness in removing local trends, making it particularly well-suited for analyzing non-stationary financial time series [30]. Following the work of Jiang and Zhou [29], Li et al. [30] apply the MF-X-DMA method to test exchange rate regime reform. Mikhaylov et al. [31] use the MF-X-DMA to examine the factors affecting open innovation. Utilizing MF-X-DMA, Ruan et al. [1] show that relaxing daily price limits increases market multifractality. To complement the analysis of complex market structures, the nonlinear Granger causality test proposed by Baek and Brock [32] has become a widely-used tool for identifying directional influence in nonlinear financial systems [1, 15, 33]. For instance, Zhou et al. [34] use it to assess the effect of options trading. Zhang et al. [24] employ nonlinear Granger causality to map systemic risk networks. Vogl and Kojić [35] also use nonlinear Granger causality to test the interplay between cryptocurrencies and related indices.
Based on the implementation of the quote limits policy in the Chinese A-share Main Board market, we use MF-X-DMA and nonlinear Granger causality test to examine the impact of this policy on the HS300 and CSI500 indices. Our findings, consistent with the aforementioned hypothesized divergence, show that the policy reduces the market efficiency of the HS300 index, but improves the efficiency of the CSI500 index. Furthermore, in the cross-market context, the policy increases the complexity of co-movement and strengthens futures-to-spot causality for the HS300, which suggests potentially less efficient cross-market information transmission. In contrast, for the CSI500, it simplifies co-movement complexity and establishes a more integrated bidirectional nonlinear causality, indicating improved information flow.
This research contributes to the existing literature in several ways. First, this is among the first empirical studies to investigate the effects of the recently implemented and more granular quote limits policy on China’s A-share Main Board. Unlike studies on broader price limits [1, 4, 5, 36], our focus on this precise mechanism and its effects on distinct market segments offers a more targeted understanding of contemporary Chinese market regulation.
Second, by extending the conventional event study framework, we employ a sophisticated combination of advanced methodologies, including MF-X-DMA and nonlinear Granger causality tests. These methods are uniquely suited to uncover the complex, non-linear, multifractal characteristics and causal relationships within financial time series [1, 15, 16, 20–22, 37, 38], which standard linear models might overlook. This rigorous approach provides a more comprehensive assessment of market efficiency and information transmission dynamics under policy interventions.
Third, our findings offer empirical evidence of the heterogeneous impact of a single regulatory policy on different market capitalization segments (large-cap HS300 vs. mid-to-small cap CSI500). This highlights that a “one-size-fits-all” regulatory approach may lead to divergent, and possibly unintended, consequences across varied market ecosystems, offering valuable insights for policymakers designing tailored and effective regulations.
The remainder of this paper is organized as follows. Section 2 introduces the methodologies used in this paper. Section 3 details our data and provides descriptive statistics. Section 4 presents the analysis of the quote limits’ effect on individual market efficiency, followed by Section 5, which examines its impact on spot-futures market cross-correlations and causality. Finally, Section 6 concludes with a summary of findings, policy implications, and future research directions.
2 Methodology
Given the multifractal and nonlinear nature of financial markets, this paper follows related literature [11, 13–15, 21, 38] and employs a combination of methodologies to investigate the multifaceted impact of China’s Main Board quote limits policy on market efficiency and inter-market linkages. Specifically, we utilize the MF-X-DMA to uncover the multifractal characteristics of individual market returns and their cross-correlations, and the Nonlinear Granger Causality test to identify the directional causal relationships between spot and futures markets. This section provides a brief introduction to these two methods.
2.1 MF-X-DMA
Financial time series often exhibit complex, multi-scale behaviors that linear models cannot fully capture. The MF-X-DMA, originally proposed by Jiang and Zhou [29], is a robust technique well-suited for analyzing such non-stationary and multifractal properties, particularly in cross-correlated series. Its primary advantage lies in effectively removing local trends, thereby providing a more accurate estimation of scaling exponents compared to other methods like MF-DFA. Therefore, we also apply this method to both individual index returns (HS300 and CSI500) and their respective spot-futures cross-correlations. The core steps of the MF-X-DMA procedure are as follows:
Step 1: Constructing integrated profiles
For two time series,
where
Step 2: Segmentation of profiles
The integrated profiles
Step 3: Detrending via moving average filtering
For each segment v (where v = 1,2, … ,2Ns), and for both integrated profiles
where
Step 4: Computing detrended covariance
The detrended covariance for each segment v is then calculated from the residuals after local trend removal as follows:
where,
Step 5: Deriving the qth order fluctuation function
The overall qth order fluctuation function
For
For
The parameter q allows for differentiation between small and large fluctuations: negative q values emphasize small fluctuations, while positive q values highlight large fluctuations.
Step 6: Determining the scaling exponent
The relationship between
where
Step 7: Characterizing multifractality
To further quantify the multifractality, we derive the multifractal Renyi exponent
where
The degree of multifractality is typically measured by (Equation 1) the width of the multifractal spectrum (i.e.,
2.2 Nonlinear granger causality test
While multifractal analysis reveals the complexity of market dynamics, understanding the directional influence between markets also requires a causality framework. Given the acknowledged nonlinear characteristics of financial data, traditional linear Granger causality tests may be insufficient. Therefore, we employ the non-linear Granger causality test, a non-parametric statistical method proposed by Baek and Brock [32], to analyze causal relationships, particularly between spot and futures markets for the HS300 and CSI500 indices. This method is important for uncovering intricate, non-linear predictive power that might be obscured by linear approaches.
The fundamental idea of the non-linear Granger causality test is to assess whether past values of one time series (Y) improve the prediction of another time series (X), beyond what can be predicted by past values of X alone, while considering non-linear dependencies.
Specifically, the nonlinear Granger causality test is conducted as follows:
Let
The null hypothesis H0 that Y does not non-linearly Granger cause X is formally expressed by comparing the following conditional probabilities:
where, Pr (⋅) denotes probability,
To operationalize this comparison, the conditional probabilities are expressed as ratios of joint probabilities, computed using correlation integral estimators. These estimators count the number of pairs (t,s) for which the specified vectors are within the distance
The test statistic is then constructed based on these ratios of correlation integrals, and under the null hypothesis, it follows an asymptotically normal distribution as follows:
where σ2 is the asymptotic variance. A statistically significant value of the test statistic leads to the rejection of the null hypothesis, indicating that Y non-linearly Granger causes X. We perform this test symmetrically to also examine if X nonlinearly Granger causes Y. This allows us to comprehensively assess the directionality and strength of information flow between the spot and futures markets of the HS300 and CSI500 indices before and after the implementation of quote limits.
3 Data, variables, and descriptive statistics
3.1 Data and variables
To investigate whether the implementation of quote limits has diverse impacts across different stock market segments, we select two prominent and distinct benchmarks of the Chinese equity market: the large-cap HS 300 Index (HS300) and the small-cap CSI 500 Index (CSI500). Specifically, the HS300 comprises 300 A-share stocks with large market capitalization and good liquidity listed on the Shanghai and Shenzhen stock exchanges, serving as a key indicator for the overall performance of China’s large-cap, blue-chip companies. In contrast, the CSI500 includes 500 A-share stocks with medium and small market capitalization, representing the performance of mid-to-small cap enterprises and offering insights into a broader range of market participants and growth-oriented sectors.
Daily closing prices for both the spot indices (HS300 and CSI500) are sourced from the China Stock Market and Accounting Research (CSMAR) database, a widely used financial database in related literature [39–41]. To ensure stationarity and facilitate subsequent econometric and multifractal analyses, these price series are transformed into daily logarithmic returns, consistent with related literature [42–44]. Specifically, the daily logarithmic return (Rt) for an asset at day t is calculated as the difference between the natural logarithm of the current day’s closing price (Pt) and that of the previous day’s closing price (Pt−1), expressed as follows:
For a robust comparative analysis of the policy’s effect, we use a specific observation window encompassing 2 years prior to and 2 years following the implementation of the quote limits policy. Specifically, the pre-event period (“Pre”) is defined from 10 April 2021, to 9 April 2023, while the post-event period (“Post”) extends from 10 April 2023, to 9 April 2025.
3.2 Descriptive statistics
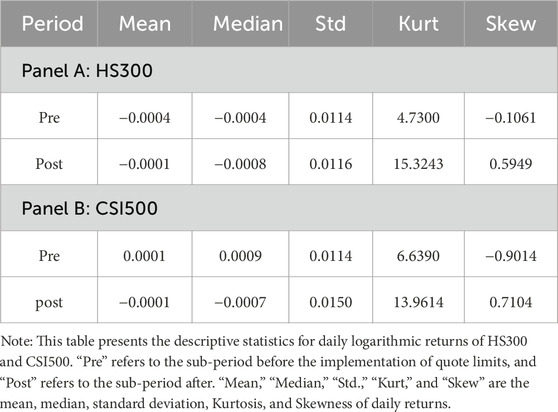
Table 1 presents the descriptive statistics for the daily logarithmic returns of both the spot indices across these two distinct periods. As shown, the daily logarithmic returns for both HS300 and CSI500 indices consistently show low means, medians, and standard deviations across both pre- and post-event periods, indicating stable average returns and relatively consistent overall volatility. However, pronounced deviations from normality are clear in the higher-order moments. All series display kurtosis values greater than 3, indicating strong leptokurtosis or “fat tails.” Notably, during the post-event period (“Post”), the kurtosis for HS300 and CSI500 returns dramatically increases, suggesting a heightened probability of extreme price movements. In addition, the skewness values are consistently non-zero, indicating asymmetry.
These non-normal distributions, particularly their heightened leptokurtosis and shifts in asymmetry following the implementation of quote limits, highlight the inherent multifractal nature of these financial time series. Therefore, it is necessary to employ sophisticated tools such as the MF-X-DMA approach to capture complex, scale-dependent correlations.
4 Effect of quote limits on stock market efficiency
4.1 Analysis of the generalized hurst exponent
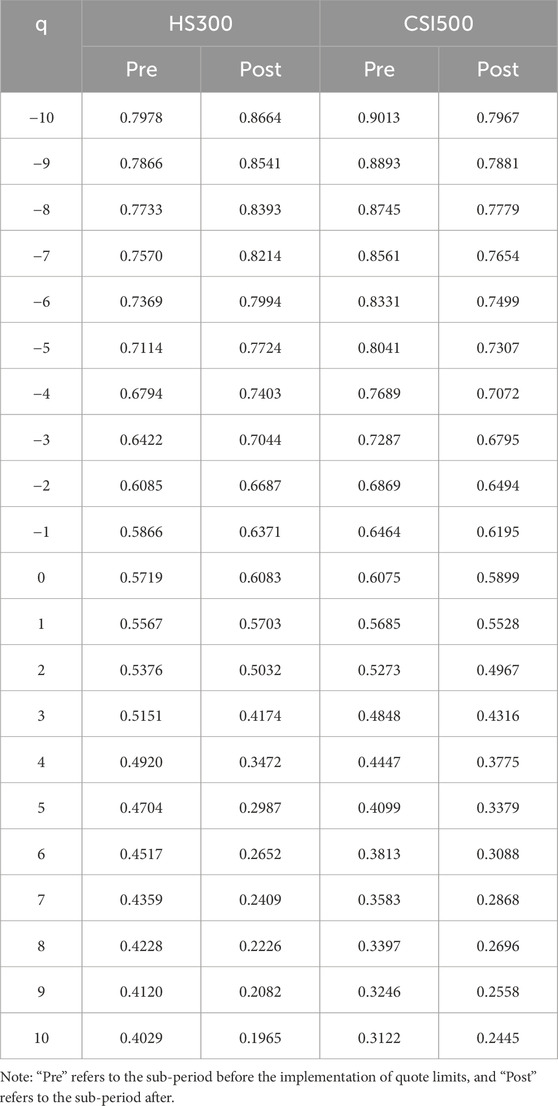
We first use the MF-X-DMA method to calculate the generalized Hurst exponent, H(q), for the HS300 and CSI500 index returns across for q ranging from −10 to 10. The results are presented in Table 2. As shown, for the HS300 index, H(q) shows a noticeable decreasing trend with increasing q before the implementation of quote limits. This pattern signals persistence in small fluctuations and a shift towards anti-persistence in large fluctuations. After the event, persistence in small fluctuations strengthens, while the tendency for reversals after large price swings also becomes more pronounced. For instance, H(q) at q = −10 rises sharply from 0.7978 to 0.8664, indicating strengthened persistence of small fluctuations. Conversely, the H(q) value at q = 10 drops dramatically from 0.4029 to 0.1965, suggesting a much stronger tendency for price reversals following large swings.
In contrast, for the CSI500 index, H(q) also decreases with increasing q before the event, showing persistence across most fluctuation sizes. After the implementation of quote limits, the persistence in small price movements weakens, while the tendency for reversals after large price swings strengthens, similar to the behavior of the HS300. For example, H(q) at q = −10 decreases from 0.9013 to 0.7967, suggesting a weakening of small fluctuation persistence. Meanwhile, H(q) at q = 10 drops from 0.3122 to 0.2445, indicating stronger anti-persistence for large fluctuations.
In sum, while both indices are multifractal and experience a stronger reversal tendency for large price swings post-event, the behavior of small price movements diverges significantly. The HS300 shows increased persistence in small fluctuations, whereas the CSI500 exhibits decreased persistence.
4.2 Change in the degree of multifractality
This section investigates the effect of quote limits on market efficiency by analyzing the change in the degree of multifractality in the HS300 and CSI500 index returns around the quote limits event. Specifically, we first follow related literature [1, 13, 14, 45, 46] and use two measures to proxy market efficiency: 1) the width of the multifractal spectrum (Δα) and 2) the degree of multifractality (Δh). Accordingly, Δα measures the range of scaling exponents present in the data, indicating the heterogeneity of the fractal properties. Δh quantifies the extent to which a time series or dataset exhibits multifractal characteristics, implying that its scaling behavior requires a continuous spectrum of exponents for description, rather than a single fractal dimension. Consequently, larger Δα or Δh indicates stronger multifractality and thus lower market efficiency.
In addition, we follow related literature [47, 48] and use the Market Deficiency Measure (MDM) to inversely measure market efficiency. Specifically, MDM is computed as follows:
where H (-10) and H (10) are generalized Hurst exponents when q = −10 and q = 10, respectively; and |⋅| denotes the absolute value function. Similarly, higher MDM suggests stronger multifractality and potentially lower market efficiency due to increased predictability based on scale of fluctuations.
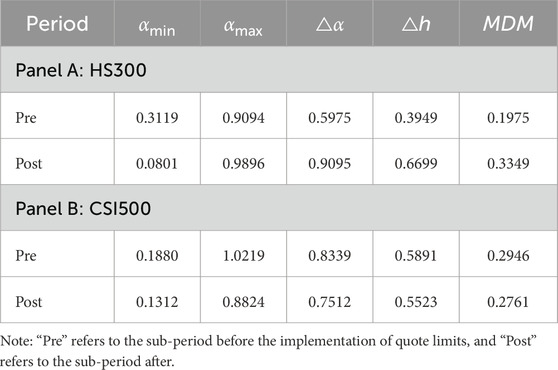
Table 3 reports results of changes in these measures for the HS300 and CSI500 indices. For the HS300 index, all three multifractal indicators (Δα, Δh, and MDM) show a substantial increase after the implementation of the quote limits. This widening of the multifractal spectrum and the higher MDM value suggest a more pronounced multifractal structure and a greater disparity in the scaling behavior of different magnitude price fluctuations. Therefore, the increased multifractality implies that the implementation of quote limits likely led to a decrease in the market efficiency of the HS300 index.
In contrast, the CSI500 index exhibits a decrease in all three multifractal indicators (Δα, Δh, and MDM) following the quote limits event. The narrower multifractal spectrum and the lower MDM value indicate a reduction in the strength of multifractality and a more homogeneous scaling behavior across different fluctuation magnitudes. This suggests that the quote limits event is associated with an increase in the market efficiency of the CSI500 index.
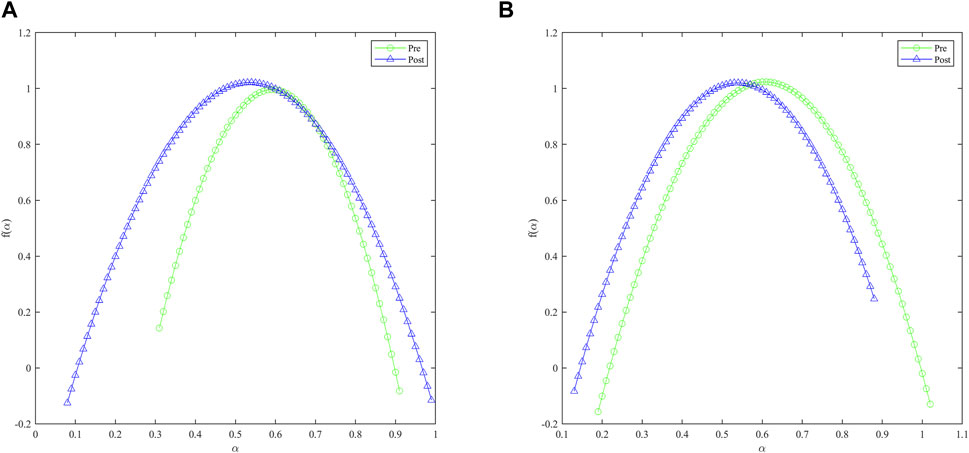
Figure 1 illustrates the changes in the multifractal spectrum, f(α), for both indices around the quote limits event. As depicted, the multifractal spectrum for the HS300 index becomes wider after the event, while that for the CSI500 index becomes narrower post-event. This also indicates that quote limits event strengthens multifractality in the HS300 index returns but attenuates multifractality in the CSI500 index returns.
In conclusion, the implementation of quote limits has a divergent impact on the market efficiency of the two indices. It decreases the market efficiency of the HS300 by increasing its multifractal characteristics, while conversely increasing the market efficiency of the CSI500 by reducing its multifractal characteristics.
4.3 Change in multifractal sources
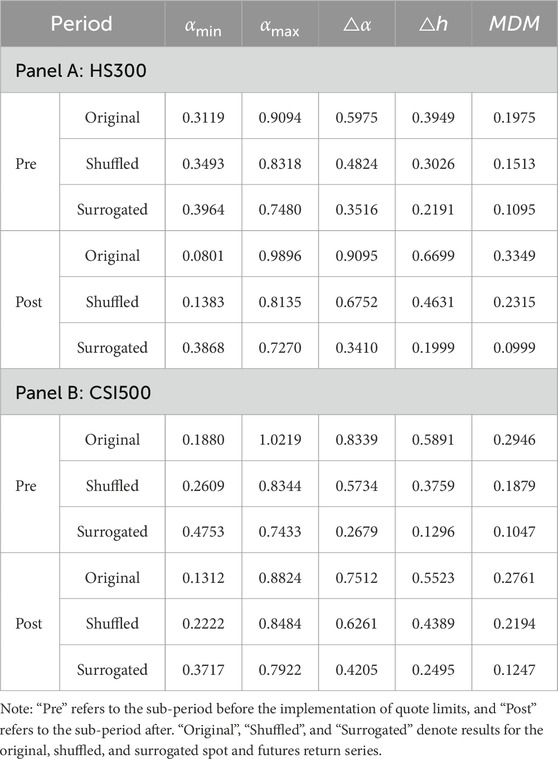
This section investigates the potential impact of the quote limits event on the sources of multifractality in the HS300 and CSI500 index returns. According to Kantelhardt et al. [26], Zhou [12], and Kwapień et al. [49] multifractality in financial time series typically arises from two main sources: 1) a broad, non-Gaussian probability distribution of returns (e.g., fat tails) and 2) temporal correlations, which can be linear or nonlinear. Following established methodologies in related literature [1, 17, 22, 50, 51], we use surrogate analysis to disentangle these sources. Specifically, shuffling the original series destroys temporal correlations while preserving the amplitude distribution. In contrast, creating surrogate series preserves linear correlations but randomizes nonlinear structures. Therefore, significant multifractality remaining in the shuffled series suggests the importance of the amplitude distribution, while a reduction in multifractality in the surrogated series points to the role of nonlinear temporal correlations.
Table 4 reports the multifractal spectra characteristics of the shuffled and surrogated series for both the HS300 and CSI500 indices before and after the event. For both indices, there is a consistent reduction in multifractality of the shuffled and surrogated series both before and after the implementation of quote limits. Specifically, the shuffled series retain a noticeable level of multifractality, indicating that the non-Gaussian amplitude distribution remains a significant contributor. Moreover, the surrogated series exhibit a further decrease in multifractality, suggesting that nonlinear temporal correlations also play a significant role in generating the observed multifractal behavior in both indices across both periods.
Overall, the quote limits event does not fundamentally change the primary sources of multifractality in the returns of either the large-cap HS300 or small-cap CSI500 index. For both indices, the multifractal characteristics consistently stem from a combination of a non-trivial amplitude distribution and nonlinear temporal correlations, both before and after the implementation of the quote limits. These results suggest that the policy primarily influences the degree of multifractality rather than introducing or eliminating its fundamental sources.
5 Effect of quote limits on cross-correlation between spot and futures market
5.1 Cross-correlation test
Following Kristoufek [52] and Ruan et al. [1], we first employ the DMA coefficient to quantify the linear cross-correlation between two time series at various time scales. Specifically, the DMA coefficient (
Accordingly,
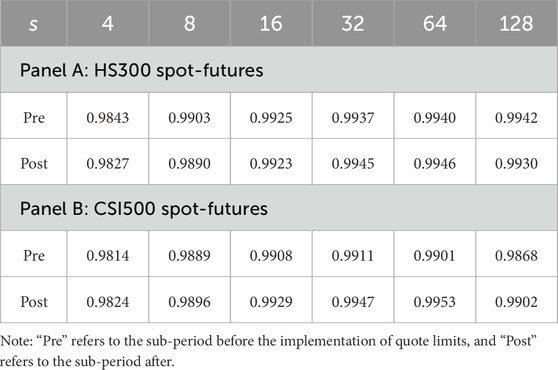
Table 5 presents the DMA coefficients between spot and futures returns for the HS300 and CSI500 indices before and after the implementation of quote limits. As shown, for the HS300 index, the DMA coefficients between spot and futures returns are consistently close to 1 before the quote limits event across all scales (s = 4–128). After the event, these coefficients remain high, with only minor fluctuations observed. Specifically, there is a slight decrease at shorter time scales (s = 4, 8) and a slight increase at longer time scales (s = 32, 64), with a small decrease at s = 128. Overall, the quote limits event appears to have a minimal impact on the strong positive linear cross-correlation between HS300 spot and futures returns.
Similarly, for the CSI500 index, the DMA coefficients between spot and futures returns exhibit strong positive linear correlation across all time scales before the event. Following the implementation of quote limits, the DMA coefficients remain high, showing a slight increase at shorter and intermediate scales (s = 4–64) and a slight increase followed by a decrease at the longest scale (s = 128). The magnitude of these changes is also small, indicating that the fundamental strong positive linear cross-correlation between CSI500 spot and futures returns was largely unaffected by the event.
Overall, the quote limits event does not significantly affect the strong positive linear relationship between the spot and futures returns for both the HS300 and CSI500.
5.2 Effect on the multifractality of spot-futures cross-correlations
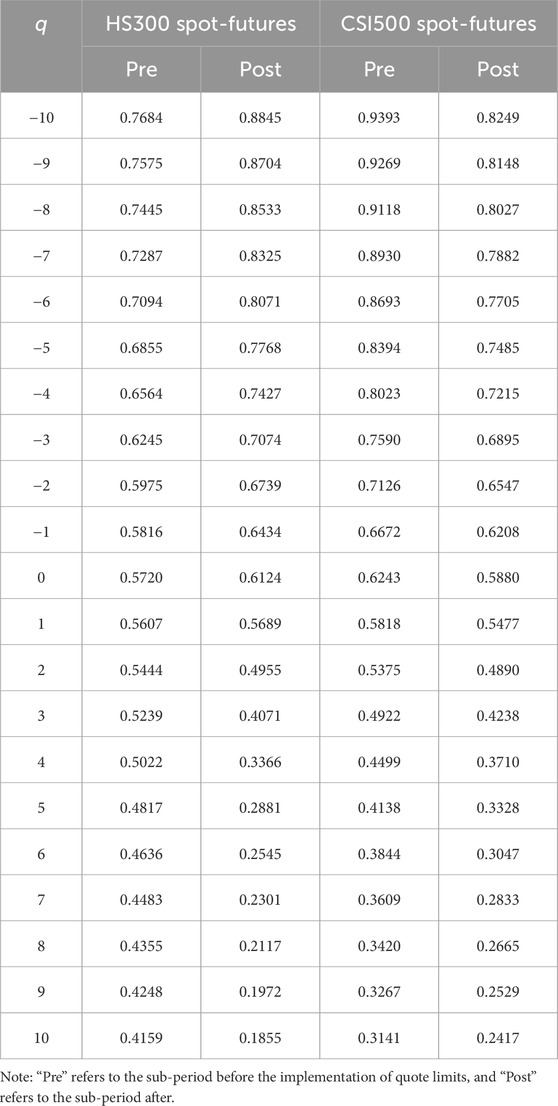
Table 6 presents the generalized Hurst exponent H(q), calculated using the MF-X-DMA method, for the cross-correlation between spot and futures returns for q ranging from −10 to 10. As shown, before the implementation of quote limits, the H(q) for both HS300 and CSI500 spot-future cross-correlations vary with q, indicating the presence of multifractal characteristics. Specifically, the decreasing trend of H(q) with increasing q suggests that large cross-correlation fluctuations scale differently from small ones. After the quote limits event, the behavior of H(q) diverges for the two respective spot-futures cross-correlations. For HS300 spot-future cross-correlations, H(q) generally increases for negative q and decreases for large positive q, implying enhanced persistence in small cross-correlation fluctuations and stronger anti-persistence in large ones. Conversely, for CSI500 spot-futures cross-correlations, H(q) generally decreases across the q range, suggesting a weakening of persistence for both small and large cross-correlation fluctuations.
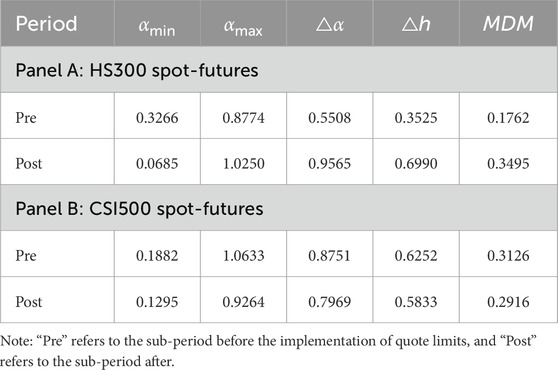
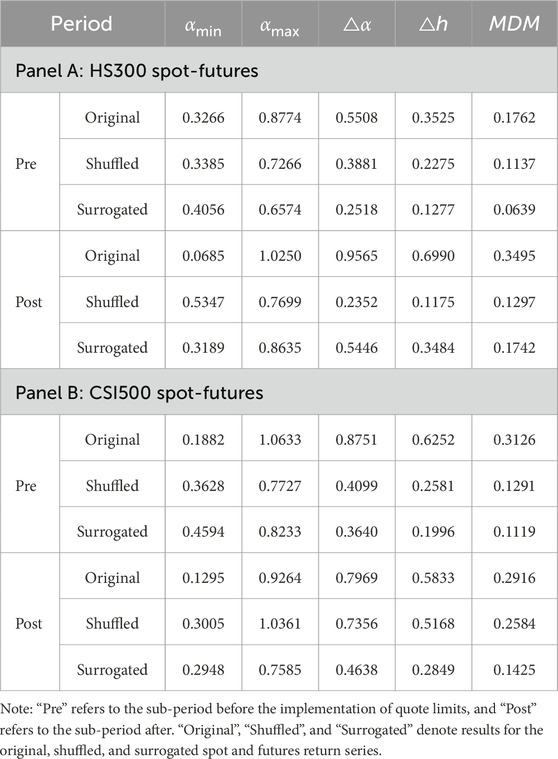
To assess the impact of quote limits on the multifractality of spot-futures cross-correlation, we compute three indicators as in Table 3, i.e., the width of the multifractal spectrum (Δα), the degree of the generalized Hurst exponent (Δh), and the Market Deficiency Measure (MDM). Accordingly, higher values of these indicators signify stronger multifractality, implying more complex and heterogeneous co-movement across different fluctuation magnitudes.
Table 7 reports the results for HS300 and CSI500 spot-futures cross-correlations before ajnd after the event. As shown, post-event values for Δα, Δh, and MDM for the HS300 spot-futures cross-correlation all exhibit a substantial increase compared to pre-event levels. This increase in all three measures suggests that the quote limits policy leads to a higher degree of multifractality in the relationship between HS300 spot and futures returns, indicating a more complex co-movement across varying fluctuation magnitudes. In contrast, for the CSI500 spot-futures cross-correlation, the post-event values for Δα, Δh, and MDM all show a decrease from their pre-event levels. This consistent decrease in multifractal indicators suggests that the implementation of quote limits results in a reduced degree of multifractality in the co-movement between CSI500 spot and futures returns, potentially indicating a simplification of their relationship. The multifractal spectrum depicted in Figure 2 also shows a similar pattern.
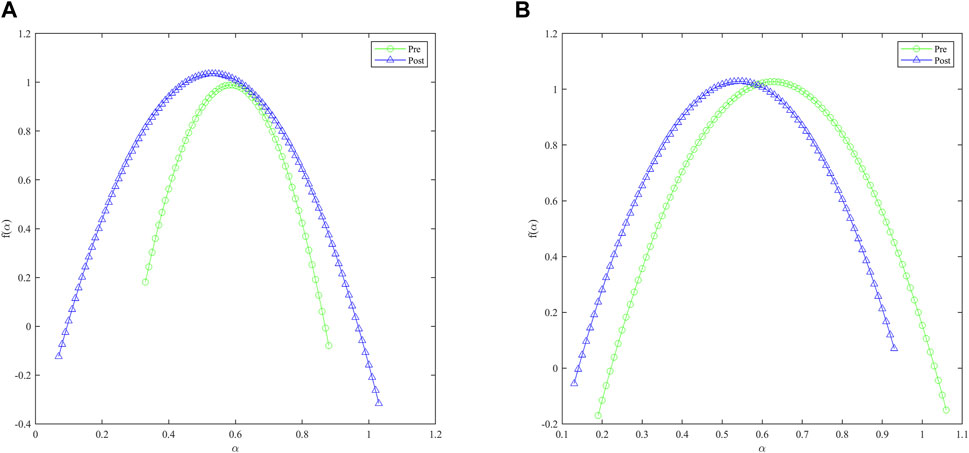
Figure 2. Change in Multifractal spectra for spot-futures cross-correlations. (A): HS300 spot-futures. (B): CSI500 spot-futures.
In sum, the implementation of quote limits has a heterogeneous influence on the dynamics between the derivative and underlying markets for these two key Chinese equity indices. It increases the complexity of the co-movement of HS300 spot-futures returns, indicating less efficient cross-market information transmission. In contrast, it decreases the complexity of the co-movement of CSI500 spot-futures returns, leading to a more efficient cross-market information transmission. These results can also help explain our findings regarding the divergent impact of quote limits on individual market efficiency, i.e., increased complexity for HS300 spot-futures cross-correlation aligns with decreased efficiency of the HS300 index, and vice versa for CSI500.
5.3 Change in multifractal sources of spot-futures cross-correlations
Using the same methodology outlined in Section 4.3, we then examine whether the sources of multifractality in spot-futures cross-correlations are affected by the implementation of quote limits. Table 8 presents the multifractal measures for the original, shuffled, and surrogated series before and after the event.
For the HS300 spot-futures cross-correlation, the multifractal sources exhibit a notable change. Before the event, both the shuffled and surrogated series show reduced multifractality compared to the original, indicating contributions from both the non-Gaussian amplitude distribution and nonlinear temporal dependencies. After the event, while the original series display stronger multifractality, the surrogated series show a substantial increase in multifractality. This suggests that linear temporal correlations become a more significant driver of multifractality in the HS300 spot-future cross-correlation following the implementation of quote limits. The shuffled series, in contrast, show a much lower level of multifractality, implying a diminished role of the amplitude distribution alone.
The multifractal sources for the CSI500 spot-futures cross-correlation exhibit a different pattern. Before the event, similar to the HS300 spot-futures returns, both shuffled and surrogated series showed reduced multifractality. After the event, the shuffled series still exhibited a considerable level of multifractality, suggesting a persistent role of the amplitude distribution. The surrogated series showed a modest increase in multifractality compared to its pre-event level, indicating a potentially slightly enhanced role of linear temporal correlations.
Comparing the two indices, the quote limits event appears to have a distinct impact on the sources of multifractality in their spot-futures cross-correlations. For HS300, the increased multifractality seems to be primarily driven by linear temporal correlations. For CSI500, while there is a slight increase in the contribution from linear temporal correlations, the amplitude distribution remains a relevant source of multifractality.
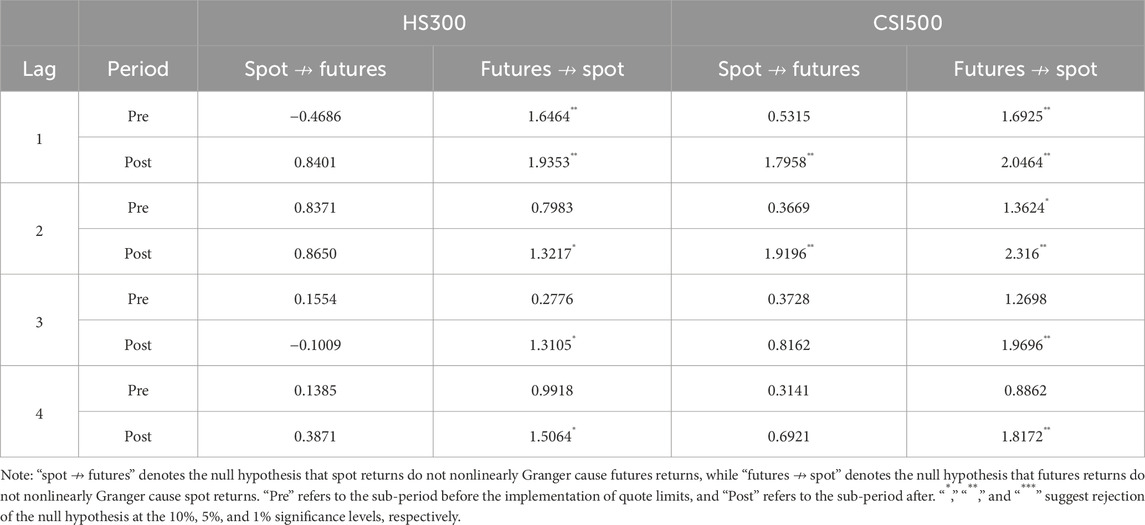
5.4 Change in nonlinear granger causality
Nonlinear Granger causality tests whether past values of one return series contain unique nonlinear information that improves the prediction of another series’ current values [28, 37, 53, 54]. In financial contexts, this implies that certain past price movements or trading activities in one market (e.g., futures) can provide nonlinear predictive power for another related market (e.g., spot), reflecting potentially asymmetric or complex information transmission and market efficiency dynamics [1, 15, 24, 55].
Table 9 presents results of the Nonlinear Granger causality test. For the HS300 spot and futures return series, significant nonlinear Granger causality runs unidirectionally from futures to spot returns at lag 1 before the implementation of quote limits. After the event, this unidirectional causality persists at lag 1 and becomes significant at lags 2, 3, and 4 (at the 10% level). There is no evidence of nonlinear causality from spot to futures in either period. Consequently, the quote limits event appears to strengthen and broaden the nonlinear influence of HS300 futures returns on spot returns across multiple lags. This may be due to the decreased market efficiency of the HS300 spot market, thereby strengthening the informational leadership of the futures market over the spot market.
Regarding the CSI500 index, before the event, there exists significant nonlinear Granger causality from futures to spot returns at lags 1 and 2. Post-event, this unidirectional causality not only remains significant but also strengthens across lags 1 to 4. Notably, a bidirectional nonlinear Granger causality emerges at lags 1 and 2, with significant causality running from spot to futures as well. Therefore, the quote limits event fundamentally altered the nonlinear causal relationship between CSI500 spot and futures returns, establishing a more integrated and sophisticated bidirectional information flow at shorter lags. This finding aligns with the results of increased market efficiency and reduced complexity for the CSI500 spot market, implying a more mature relationship between the derivative and its underlying.
Overall, the quote limits policy also has a distinct impact on their nonlinear causal relationships. Specifically, it primarily enhances the existing unidirectional causality from futures to spot for HS300, whereas it leads to a more significant change by establishing a bidirectional nonlinear causality at shorter lags, alongside the strengthening of the futures-to-spot causality for CSI500.
6 Conclusion and discussion
This study investigated the impact of the quote limits policy on market efficiency and the complex dynamics between spot and futures markets of the HS300 and CSI500 indices. Using the MF-X-DMA approach and nonlinear Granger causality tests, our findings reveal a significantly different impact on these two key Chinese equity benchmarks.
Specifically, the implementation of quote limits decreases the market efficiency of the large-cap HS300 index, evidenced by a marked increase in multifractal characteristics in HS300 index returns. For the HS300 spot-futures relationship, while linear correlations remain robust, the complexity of co-movement increases, and nonlinear Granger causality from futures to spot is strengthened and broadened, suggesting a more dominant and potentially asymmetric information flow from the derivatives market. Notably, for HS300, the increased multifractality in spot-futures cross-correlations appears to be primarily driven by linear temporal correlations.
In contrast, the policy enhances the market efficiency of the mid-to-small cap CSI500 index, reflected in a reduction in multifractal characteristics in the CSI500 index returns. More importantly, the cross-market analysis shows a simplification of co-movement complexity and the emergence of bidirectional nonlinear Granger causality between spot and futures returns. This indicates the development of a more interactive and bidirectional information flow, where both markets dynamically influence each other. For CSI500, the sources of multifractality in spot-futures cross-correlations show a slight increase in the contribution from linear temporal correlations, though the amplitude distribution remains a relevant source.
From a policy perspective, our findings highlight that a “one-size-fits-all” approach to market regulation may yield unintended consequences. While the quote limits policy achieves its goal of stabilizing certain market segments or curtailing excessive speculation (as seen in CSI500s increased efficiency), it simultaneously introduces new complexities or reduced efficiency in others (as observed in HS300). This underscores the critical need for policymakers to adopt tailored regulatory designs that account for the unique characteristics of different market segments and to continuously assess the actual impact of regulations. For market participants, our results imply the necessity of developing segment-specific trading strategies and adaptive risk management frameworks, given the distinct alterations in market dynamics for the HS300 versus the CSI500.
A possible concern is that changes in multifractal characteristics can be influenced by various complex factors and may not represent the sole or absolute measure of market efficiency. Furthermore, while this study reveals the impact of the quote limits system at the index level, future research could further explore the system’s effects on the multifractal characteristics of individual stocks. This would allow for more granular insights into market dynamics and help prevent the loss of detailed information that can occur through index-level averaging.
Data availability statement
Publicly available datasets were analyzed in this study. This data can be found here: The raw data supporting the conclusions of this article will be made available by the authors, without undue reservation. Requests to access these datasets should be directed to Linsen Yin, eWxzQGxpeGluLmVkdS5jbg==.
Author contributions
DL: Funding acquisition, Writing – original draft, Formal Analysis, Software, Writing – review and editing, Visualization, Data curation, Validation, Conceptualization, Methodology. YZ: Writing – review and editing, Conceptualization, Writing – original draft, Validation, Data curation, Methodology, Formal Analysis. JZ: Validation, Data curation, Writing – review and editing, Methodology. LY: Validation, Project administration, Conceptualization, Writing – original draft, Resources, Formal Analysis, Funding acquisition.
Funding
The author(s) declare that financial support was received for the research and/or publication of this article. The authors wish to express their gratitude for the support provided by the Shuguang Program of Shanghai Education Development Foundation and Shanghai Municipal Education Commission (No. 22SG55), the Humanities and Social Science Fund of Ministry of Education of the People’s Republic of China (No. 21YJC790082), and the National Natural Science Foundation of China (No. 72103139).
Conflict of interest
The authors declare that the research was conducted in the absence of any commercial or financial relationships that could be construed as a potential conflict of interest.
Generative AI statement
The author(s) declare that no Generative AI was used in the creation of this manuscript.
Publisher’s note
All claims expressed in this article are solely those of the authors and do not necessarily represent those of their affiliated organizations, or those of the publisher, the editors and the reviewers. Any product that may be evaluated in this article, or claim that may be made by its manufacturer, is not guaranteed or endorsed by the publisher.
References
1. Ruan Q, Hu S, Zhang J, Chu X, Lv D. Relaxing daily price limits and stock market cross-correlation: evidence from MF-X-DMA analysis. Fluctuation Noise Lett (2023) 22:2350042. doi:10.1142/s0219477523500426
2. Wang X, Kim MH, Suardi S. Herding and China's market-wide circuit breaker. J Banking and Finance (2022) 141:106533. doi:10.1016/j.jbankfin.2022.106533
3. Switzer LN, Yue H. Effects of the short sale circuit breaker on the stock market. J Int Financial Manage and Account (2019) 30:250–74. doi:10.1111/jifm.12105
4. Deb SS, Kalev PS, Marisetty VB. Are price limits really bad for equity markets? J Banking and Finance (2010) 34:2462–71. doi:10.1016/j.jbankfin.2010.04.001
5. Liang H, Sun Y, Xu C, Xiong W, Cai W. Unleashing stock volatility and its implications for stock crash risk: evidence from China’s price limit policies. Res Int Business Finance (2024) 71:102455. doi:10.1016/j.ribaf.2024.102455
6. Heflin F, Shaw KW. Trade size and informed trading: which trades are “big”. J Finan Res (2005) 28:133–63. doi:10.1111/j.1475-6803.2005.00118.x
7. Bogousslavsky V, Fos V, Muravyev D. Informed trading intensity. J Finance (2024) 79:903–48. doi:10.1111/jofi.13320
8. Chan K, Fong W-M. Trade size, order imbalance, and the volatility–volume relation. J Finan Econ (2000) 57:247–73. doi:10.1016/S0304-405X(00)00057-X
9. Lee J, Yi CH. Trade size and information-motivated trading in the options and stock markets. J Finan Quant Anal (2001) 36:485–501. doi:10.2307/2676221
10. Zhao R, Cui Y, Liu X. Tick size and market quality using an agent-based multiple-order-book model. Front Phys (2020) 8:8–2020. doi:10.3389/fphy.2020.00135
11. Lu X, Tian J, Zhou Y, Li Z. Multifractal detrended fluctuation analysis of the Chinese stock index futures market. Physica A: Stat Mech its Appl (2013) 392:1452–8. doi:10.1016/j.physa.2012.11.037
12. Zhou W-X. Finite-size effect and the components of multifractality in financial volatility. Chaos, Solitons and Fractals (2012) 45:147–55. doi:10.1016/j.chaos.2011.11.004
13. Lee M-J, Choi S-Y. Comparing market efficiency in developed, emerging, and frontier equity markets: a multifractal detrended fluctuation analysis. Fractal and Fractional (2023) 7:478. doi:10.3390/fractalfract7060478
14. Jiang Z-Q, Xie W-J, Zhou W-X, Sornette D. Multifractal analysis of financial markets: a review. Rep Prog Phys (2019) 82:125901. doi:10.1088/1361-6633/ab42fb
15. Kojić M, Mitić P, Antunes De Araujo FH. Multiscale nonlinearity in energy commodities and bond markets: MFDCCA via MODWT and granger causality. Fractals (2025) 33(0):2550030. doi:10.1142/s0218348x25500306
16. Acikgoz T. The multifractal nature of cross-correlations between emerging market equities and financial assets: an econophysics perspective. Comput. Econ. Netherlands: Springer (2025). doi:10.1007/s10614-025-10991-4
17. Zhao R, Dai P-FA. A multifractal cross-correlation analysis of economic policy uncertainty: evidence from China and US. Fluctuation Noise Lett (2021) 20:2150041. doi:10.1142/s0219477521500413
18. Ghosh I, Chaudhuri TD, Sarkar S, Mukhopadhyay S, Roy A. Macroeconomic shocks, market uncertainty and speculative bubbles: a decomposition-based predictive model of Indian stock markets. China Finance Rev Int (2025) 15:166–201. doi:10.1108/CFRI-09-2023-0237
19. Zhang L, Hua L. Market predictability before the closing bell rings. Risks (2024) 12:180. doi:10.3390/risks12110180
20. Gu D, Huang J. Multifractal detrended cross-correlation analysis of high-frequency stock series based on ensemble empirical mode decomposition. Fractals (2020) 28:2050035. doi:10.1142/s0218348x20500358
21. Zhou W, Huang J, Wang M. Multifractal characteristics and information flow analysis of stock markets based on multifractal detrended cross-correlation analysis and transfer entropy. Fractal and Fractional (2025) 9:14. doi:10.3390/fractalfract9010014
22. Ye S, Dai P-F, Nguyen HT, Huynh NQA. Is the cross-correlation of EU carbon market price with policy uncertainty really being? A multiscale multifractal perspective. J Environ Manage (2021) 298:113490. doi:10.1016/j.jenvman.2021.113490
23. Hou L, Pan Y. Evaluating the connectedness of commodity future markets via the cross-correlation network. Front Phys (2022) 10:10–2022. doi:10.3389/fphy.2022.1017009
24. Zhang P, Yin S, Sha Y. Global systemic risk dynamic network connectedness during the COVID-19: evidence from nonlinear Granger causality. J Int Finan Markets, Inst Money (2023) 85:101783. doi:10.1016/j.intfin.2023.101783
25. Peng CK, Buldyrev SV, Havlin S, Simons M, Stanley HE, Goldberger AL. Mosaic organization of DNA nucleotides. Phys Rev E (1994) 49:1685–9. doi:10.1103/PhysRevE.49.1685
26. Kantelhardt JW, Zschiegner SA, Koscielny-Bunde E, Havlin S, Bunde A, Stanley HE. Multifractal detrended fluctuation analysis of nonstationary time series. Physica A: Stat Mech its Appl (2002) 316:87–114. doi:10.1016/S0378-4371(02)01383-3
27. Podobnik B, Stanley HE. Detrended cross-correlation analysis: a new method for analyzing two nonstationary time series. Phys Rev Lett (2008) 100:084102. doi:10.1103/PhysRevLett.100.084102
28. Zhou W-X. Multifractal detrended cross-correlation analysis for two nonstationary signals. Phys Rev E (2008) 77:066211. doi:10.1103/PhysRevE.77.066211
29. Jiang Z-Q, Zhou W-X. Multifractal detrending moving-average cross-correlation analysis. Phys Rev E (2011) 84:016106. doi:10.1103/PhysRevE.84.016106
30. Li J, Lu X, Qu L. Effectiveness of the RMB exchange rate regime reform: a new perspective from MF-DMA and MF-X-DMA. Physica A: Stat Mech its Appl (2019) 531:121535. doi:10.1016/j.physa.2019.121535
31. Mikhaylov A, Dinçer H, Yüksel S. Analysis of financial development and open innovation oriented fintech potential for emerging economies using an integrated decision-making approach of MF-X-DMA and golden cut bipolar q-ROFSs. Financial Innovation (2023) 9:4. doi:10.1186/s40854-022-00399-6
32. Baek E, Brock W. A general test for nonlinear Granger causality: bivariate model. Iowa State University and University of Wisconsin at Madison Working Paper (1992).
33. Diks C, Wolski M. Nonlinear Granger causality: guidelines for multivariate analysis. J Appl Econom (2016) 31:1333–51. doi:10.1002/jae.2495
34. Zhou Y, Lu B, Lv D, Ruan Q. The informativeness of options-trading activities: non-linear analysis based on MF-DCCA and Granger test. Physica A: Stat Mech its Appl (2019) 534:122269. doi:10.1016/j.physa.2019.122269
35. Vogl M, Kojić M. Green cryptocurrencies versus sustainable investments dynamics: exploration of multifractal multiscale analysis, multifractal detrended cross-correlations and nonlinear Granger causality. Physica A: Stat Mech its Appl (2024) 653:130085. doi:10.1016/j.physa.2024.130085
36. Tao J, Yingying W, Jingyi Z. The performance of China’s stock market price limits: noise mitigator or noise maker? China Finance Rev Int (2017) 7:85–97. doi:10.1108/CFRI-07-2016-0096
37. Cao G, Xu W. Nonlinear structure analysis of carbon and energy markets with MFDCCA based on maximum overlap wavelet transform. Physica A: Stat Mech its Appl (2016) 444:505–23. doi:10.1016/j.physa.2015.10.070
38. Wang F, Ye X, Chen H, Wu C. A portfolio strategy of stock market based on mean-MF-X-DMA model. Chaos, Solitons and Fractals (2021) 143:110645. doi:10.1016/j.chaos.2020.110645
39. Wang C, Wang C, Wu W. Customers' stock price crash risk and suppliers' investment inefficiency: evidence from China. Account and Finance (2023) 63:5069–92. doi:10.1111/acfi.13143
40. Titman S, Wei C, Zhao B. Corporate actions and the manipulation of retail investors in China: an analysis of stock splits. J Finan Econ (2022) 145:762–87. doi:10.1016/j.jfineco.2021.09.018
41. Carpenter JN, Lu F, Whitelaw RF. The real value of China’s stock market. J Finan Econ (2021) 139:679–96. doi:10.1016/j.jfineco.2020.08.012
42. Boungou W, Yatié A. The impact of the Ukraine–Russia war on world stock market returns. Econ Lett (2022) 215:110516. doi:10.1016/j.econlet.2022.110516
43. Vidal-Tomás D. The new crypto niche: NFTs, play-to-earn, and metaverse tokens. Finance Res Lett (2022) 47:102742. doi:10.1016/j.frl.2022.102742
44. Grobys K, Junttila J. Speculation and lottery-like demand in cryptocurrency markets. J Int Finan Markets, Inst Money (2021) 71:101289. doi:10.1016/j.intfin.2021.101289
45. Zunino L, Tabak BM, Figliola A, Pérez DG, Garavaglia M, Rosso OA. A multifractal approach for stock market inefficiency. Physica A: Stat Mech its Appl (2008) 387:6558–66. doi:10.1016/j.physa.2008.08.028
46. Fernandes LHS, de Araújo FHA, Silva IEM. The (in)efficiency of NYMEX energy futures: a multifractal analysis. Physica A: Stat Mech its Appl (2020) 556:124783. doi:10.1016/j.physa.2020.124783
47. Castro AL, Marcato ALM, Aguiar EPD. Multifractal analysis of the Brazilian electricity market. IEEE Access (2023) 11:98939–57. doi:10.1109/ACCESS.2023.3313099
48. Ock SE, Lee M, Song JW. Multifractal analysis of the impact of fuel cell introduction in the Korean electricity market. Fractal and Fractional (2024) 8:573. doi:10.3390/fractalfract8100573
49. Kwapień J, Blasiak P, Drożdż S, Oświęcimka P. Genuine multifractality in time series is due to temporal correlations. Phys Rev E (2023) 107:034139. doi:10.1103/PhysRevE.107.034139
50. Rak R, Grech D. Quantitative approach to multifractality induced by correlations and broad distribution of data. Physica A: Stat Mech its Appl (2018) 508:48–66. doi:10.1016/j.physa.2018.05.059
51. Drożdż S, Kwapień J, Oświecimka P, Rak R. Quantitative features of multifractal subtleties in time series. Europhysics Lett (2009) 88:60003. doi:10.1209/0295-5075/88/60003
52. Kristoufek L. Detrending moving-average cross-correlation coefficient: measuring cross-correlations between non-stationary series. Physica A: Stat Mech its Appl (2014) 406:169–75. doi:10.1016/j.physa.2014.03.015
53. Shojaie A, Fox EB. Granger causality: a review and recent advances. Annu Rev Stat Its Appl (2022) 9:289–319. doi:10.1146/annurev-statistics-040120-010930
54. Diks C, Panchenko V. A new statistic and practical guidelines for nonparametric Granger causality testing. J Econ Dynam Control (2006) 30:1647–69. doi:10.1016/j.jedc.2005.08.008
Keywords: quote limits, MF-X-DMA, A-share, nonlinear Granger causality, cross-correlation
Citation: Lv D, Zhou Y, Zhang J and Yin L (2025) Unintended consequences of quote limits policy on stock market dynamics: evidence from the MF-X-DMA analysis. Front. Phys. 13:1642788. doi: 10.3389/fphy.2025.1642788
Received: 07 June 2025; Accepted: 24 June 2025;
Published: 11 July 2025.
Edited by:
Ze Wang, Capital Normal University, ChinaReviewed by:
Lu Zhang, Northern Illinois University, United StatesAdrian Zoicas-Ienciu, Universitatea Babes Bolyai, Romania
Copyright © 2025 Lv, Zhou, Zhang and Yin. This is an open-access article distributed under the terms of the Creative Commons Attribution License (CC BY). The use, distribution or reproduction in other forums is permitted, provided the original author(s) and the copyright owner(s) are credited and that the original publication in this journal is cited, in accordance with accepted academic practice. No use, distribution or reproduction is permitted which does not comply with these terms.
*Correspondence: Linsen Yin, eWxzQGxpeGluLmVkdS5jbg==
 Dayong Lv
 Yaping Zhou
 Jiarui Zhang
 Linsen Yin