 Rosa Musotto
 Giovanni Pioggia
- Institute for Biomedical Research and Innovation, National Research Council, IRIB-CNR, Messina, Italy
Neuronal oscillations play a crucial role in brain function, regulating processes such as perception, cognition, and motor control. These oscillations are characterized by frequencies that define specific neural states and interactions. This study investigates a neuro mechanical model that emulates brain wave frequencies using a system of five identical masses connected by springs with variable stiffness. The mass-spring arrangement serves as an analog for neuronal oscillations, with each spring's stiffness adjusted to produce frequencies that approximate the characteristic brain wave bands: Delta, Theta, Alpha, Beta, and Gamma. The model leverages coupled oscillations to represent neural interactions, mirroring how groups of neurons may synchronize to generate brain rhythms. Through a three-step optimization process, the spring constants were fine-tuned to align the system’s natural frequencies with target brain wave frequencies. Initial settings ensured a monotonic trend in stiffness, while the Nelder-Mead algorithm minimized the deviations from target frequencies. The resulting model successfully matched Delta, Theta, and Alpha frequencies closely, while Beta and Gamma bands showed moderate deviations, highlighting the need for further refinement or an expanded system. A comparison between this model and neural dynamics suggests that pulse transmission in a mass-spring system resembles neuronal depolarization waves. The analogy draws parallels between oscillatory interactions in physical and biological systems, where each unit influences its neighbor to transmit energy or signals. The study concludes that simplified mechanical systems can effectively approximate brain oscillations, offering a foundation for exploring cognitive states through physical modeling and suggesting potential avenues for neuro engineering and cognitive research.
Introduction
Eigenfrequencies and eigenmodes are fundamental concepts in the study of dynamic systems. The study of a system’s eigenfrequencies and eigenmodes spans several disciplines, offering vital insights into the behavior of complex systems. Herzog et al [1] have recently demonstrated the importance of measuring eigenfrequencies in biological systems and more specifically in monitoring the mechanical properties of mammalian cells, highlighting how these parameters can provide information on their physiology. Furthermore, the Angler’s [2] work introduced the metaphor of the ‘Symphonies of Life’, arguing that biological systems oscillate according to harmonic patterns defined by specific frequencies of their own, analogous to what happens in physical and mechanical systems. The Kaya and Henry research [3] into the internal rhythms of biological systems suggests that biological systems possess their own frequencies that regulate their interactions and responses to external stimuli. Understanding, therefore, the fundamental mechanisms that regulate oscillations in large-scale brain circuits is essential for knowledge of their role in brain processes, both under adaptive and pathological conditions. Brain oscillations recorded by means of electroencephalography (EEG) date back decades, when they were initially termed “eigenströme” [4]. Over time, it became possible to classify brain oscillations into distinct frequency bands, each associated with specific brain areas, functions and cognitive states. Among the most commonly described frequency bands are delta, theta, alpha, beta, and gamma. These oscillations represent a key element of neural dynamics and are an important field of study in both neuroscientific and clinical fields. Delta waves occur mainly during deep sleep and deep meditation. They are related to reparative processes and cell regeneration. Their presence is indicative of states of drowsiness and lack of awareness. Theta waves are frequently observed during the transition phase between wakefulness and sleep, frequently during meditation and in states of deep relaxation. They are associated with processes of getting back in touch with deep emotions, creativity and learning abilities. Alterations in the oscillations of the delta and theta frequency bands have been found in pathologies such as schizophrenia and epilepsy, suggesting dysfunctions in the neuronal circuits that mediate the oscillations of these bands [5]. Alpha waves predominate during states of relaxation and calm, typically when the eyes are closed but one is not yet asleep. They are associated with states of calm and mental clarity, and indicate reduced active thought activity [6, 7]. Beta waves occur during phases of high cognitive activity and attention. They are most prominent when awake and alert, particularly during intense mental activity. These waves are shown to correlate with states of attention, concentration and activation. They have also been shown to increase during motor activities, suggesting a crucial role in motor coordination and cognition [8]. Gamma waves are the higher frequency bands and are associated with complex cognitive processes such as information processing and sensory integration. They are believed to play a crucial role in cognition, such as perception and consciousness [9–12].
This organization reflects how specific frequencies correlate with different mental states and brain activities, from restful to highly alert conditions [13, 14].
The figure provides a dual-bar horizontal plot illustrating the frequency and amplitude ranges for each brain wave mode: Delta, Theta, Alpha, Beta, and Gamma. Along the vertical axis, each brain wave type is represented with frequency and amplitude ranges shown as distinct horizontal bars.
The red bars depict the frequency ranges in Hertz (Hz) for each mode, progressing from the lowest frequencies in Delta waves to the highest in Gamma waves. Specifically, Delta waves range from 0 to 4 Hz, Theta waves from 4 to 7 Hz, Alpha waves from 8 to 12 Hz, Beta waves from 13 to 30 Hz, and Gamma waves span the highest range, from 30 to 100 Hz [15–18]. This spectrum of frequencies aligns with the functional roles of these brain waves, from deep relaxation and sleep to alert and high-cognitive states.
In contrast, the blue bars illustrate the amplitude ranges in microvolts (µV) for each brain wave, which tend to decrease as frequency increases. Delta waves, linked with deep sleep, show the highest amplitude range from 20 to 200 µV. Theta waves, associated with light sleep, have an amplitude range of 5–100 µV. Alpha waves, reflecting a relaxed but alert state, range from 10 to 60 µV in amplitude. Beta waves, which are associated with active thinking, exhibit a narrower amplitude range from 5 to 30 μV, while Gamma waves, involved in high-level cognitive functions, display the lowest amplitude range of 1–10 µV.
Each bar is labeled with its precise range, enabling a clear reference for both frequency and amplitude across the different brain waves. The figure highlights the inverse relationship between frequency and amplitude; lower-frequency waves such as Delta and Theta tend to have higher amplitudes, while higher-frequency waves like Beta and Gamma are associated with lower amplitudes. This visual layout effectively illustrates the functional differences among brain wave modes, capturing the progression from low-frequency, high-amplitude waves associated with sleep to high-frequency, low-amplitude waves characteristic of alertness and cognitive processing.
Understanding the intricate dynamics of these oscillations and their role in cognition [19] has led to the development of simplified models to replicate neural oscillations.
In this context, the present work explores a model that employs a system of five identical masses linked in sequence by springs with variable stiffness to simulate these brain waves. This mass-spring system serves as an analogy for coupled neuronal oscillations, with each spring’s stiffness fine-tuned to produce oscillatory frequencies that closely match the characteristic frequency bands observed in brain activity. The model leverages the interaction of these coupled oscillators to emulate how neural oscillations may arise from synchronized neuron populations.
This mass-spring framework is particularly insightful as it not only models individual oscillatory frequencies but also illustrates how these frequencies interact. As each mass represents a group of neurons, the oscillatory modes produced by their coupling mirror the natural oscillations within the brain. The varying stiffness in each spring allows the model to mimic different oscillatory regimes by adjusting the mass’s resonant frequencies, enabling it to align with specific brain wave bands: Delta, Theta, Alpha, Beta, and Gamma. For instance, a lower stiffness may correspond to a slower frequency like Delta, while higher stiffness produces faster oscillations akin to Gamma waves.
The global incidence of neurodegenerative disorders is becoming an increasingly critical issueworldwide, mainly due to an aging population and an increase in the prevalence of chronic diseases.In recent decades, the incidence and prevalence of these disorders have shown a significant increase,presenting significant challenges for health systems and societies. Among the most prevalentdisorders are Alzheimer’s disease (AD) and Parkinson’s disease (PD), which together account for the majority of cases of dementia and neurodegeneration, severely affecting both cognitive function and motor skills and patients’ quality of life [20]. According to recent estimates, about 35 million people live with AD and about 6 million with PD globally [21]. More broadly, the World HealthOrganization reports that more than 55 million people are living with a form of dementia today, witha projection that it could reach 139 million by 2050 [22]. These statistics highlight not only how prevalent neurodegenerative disorders already are, but also how their prevalence is set to increase dramatically, with an estimated growth of up to 166 percent over the next 30 years [23]. In addition to genetic predisposition and aging, several environmental factors contribute to the onset and progression of neurodegenerative disorders. In particular, it has been shown that the presence of positive bivalent cations, such as calcium, copper, and zinc, can modulate protein aggregation and influence neurotoxic processes [24]. Similarly, physicochemical parameters such as pH and ionicstrength play key roles in the stability of amyloid proteins and their propensity to aggregate, thusaffecting the pathogenesis of many neurodegenerative diseases [25]. Taken together, the growing epidemiological impact and the contribution of environmental factors underscore the urgency of developing new theoretical and computational frameworks capable of providing a more comprehensive understanding of brain dynamics and related pathological rhythms, paving the way for innovative prevention and intervention strategies.
The present work sheds light on how simplified physical systems can help us understand complex neural oscillations by approximating the synchronization and resonance behaviors observed in the brain. By simulating brain wave-like behavior in a controlled, tunable environment, this model opens up new possibilities for exploring how various oscillatory modes interact, transfer energy, and collectively support the brain’s vast cognitive repertoire. As research continues to reveal the role of neural oscillations in processes like attention, memory, and perception, models like these contribute valuable insights into the oscillatory nature of brain function, potentially guiding future developments in neuroengineering and cognitive neuroscience.
The model
A system of 5 equal masses m connected by 5 identical springs with stiffness k represents a linear chain of coupled oscillators. Each mass is subject to forces from the neighboring springs, and the motion of each mass influences, and is influenced by, the neighboring masses. The dynamics of this system can be described by a set of coupled second-order differential equations, where the force on each mass i (except for the ends) depends on the displacements
For each mass, Newton’s second law gives:
for
This approach leads to an eigenvalue problem where the frequencies
In a system of 5 masses connected by springs, we can calculate the frequencies of the 5 normal modes using the following approximation:
Where N = 5 is the number of masses), n ranges from 1 to 5 (representing the normal modes), k is the spring constant, and m is the mass of each individual mass.
Each value of n corresponds to a different normal mode with a unique oscillation frequency, with the first mode n = 1 having the lowest frequency and the fifth mode n = 5 the highest.
The lowest frequency mode, or fundamental mode, represents a motion where all masses oscillate in phase, while higher modes show increasingly complex phase differences. These solutions reveal how energy can transfer across the masses, with implications for understanding wave propagation, resonance, and stability in mechanical and physical systems.
System description: five coupled masses and variable spring constants
In the following analysis, we modeled a physical system composed of five identical masses connected in a linear arrangement by springs with varying stiffness, k, between each consecutive pair of masses. The goal was to simulate the eigenfrequencies of this system, ensuring they closely matched specific brain wave frequency bands: Delta (2.0 Hz), Theta (5.5 Hz), Alpha (10.0 Hz), Beta (21.5 Hz), and Gamma (65.0 Hz). More in details, each of the five masses is set to a constant value of m = 5 10−15 kg, representing an approximation based on neuronal mass. The spring constants between each pair of masses were varied (i.e.,
In other words, in order to align the eigenfrequencies of a 5-mass spring system with specific target brain wave frequencies, we implemented a systematic optimization process.
This process required balancing the spring constants
Mathematical model of the system
The employed model consists of five identical masses, arranged linearly, with each pair connected by a spring. This setup can be described by a system of coupled differential equations for the displacements of the masses, which can be expressed in matrix form as:
Where
The mass matrix,
where
The stiffness matrix
To determine the eigenfrequencies, we solve the generalized eigenvalue problem:
Where
The eigenfrequencies
The objective was to adjust the
The optimization aimed to minimize the sum of squared deviations between the calculated eigenfrequencies and the target frequencies. The objective function is defined as:
Where
This penalty increases the objective value if the monotonic constraint is violated, guiding the optimization toward a decreasing
Then, we applied the optimization using a stepwise refinement process in three steps.
i .Initial guesses: we started with an initial sequence of
ii .Objective minimization: using the Nelder-Mead optimization algorithm, we iteratively adjusted the
iii .Further Fine-Tuning: The optimization was iteratively refined by adjusting the bounds and initial guesses, emphasizing closer alignment with Delta, Theta, and Alpha, while reducing deviations for Beta and Gamma.
The final optimized values of the spring constants
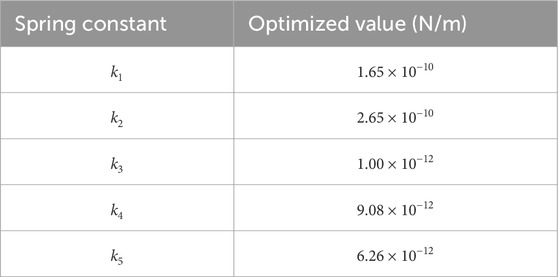
Table 1. Final optimized values of the spring constants ki for the 5-mass system. The table reports the optimized values of the spring constants k1–k5, expressed in Newtons per meter (N/m), obtained at the end of the optimization process. These values were adjusted to align the system’s eigenfrequencies with the target brainwave frequency bands (Delta, Theta, Alpha, Beta, Gamma). The slight non-monotonic variation between k1 and k2 reflects the compromise reached by the optimization algorithm to minimize the overall error in the simulated frequencies.
The resulting simulated eigenfrequencies and their deviations from the target values are given in Table 2.
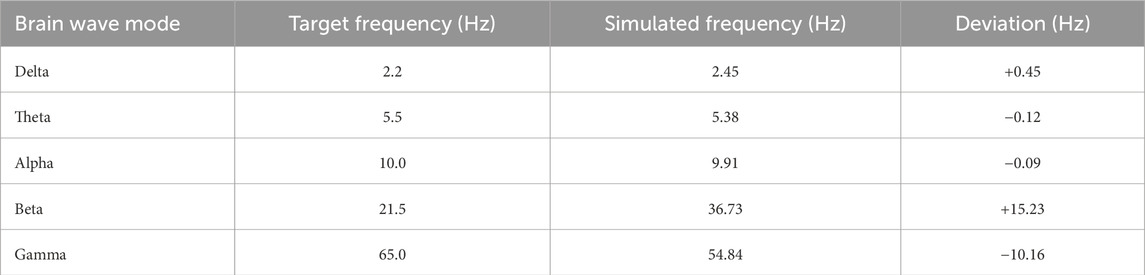
Table 2. Comparison between target and simulated eigenfrequencies for the 5-mass spring system. The table compares the target brainwave frequencies (Delta, Theta, Alpha, Beta, Gamma) with the corresponding eigenfrequencies obtained from the optimized mass-spring model. Deviations are generally small for lower-frequency bands (Delta, Theta, Alpha), indicating good alignment, while larger deviations are observed for higher-frequency bands (Beta and Gamma), suggesting the need for further refinement of the model at higher frequencies.
In Figure 1 the target vs. simulated eigenfrequencies for the 5-mass spring system is plotted; it shows the good alignment between the target brain wave frequencies and the simulated eigenfrequencies achieved after optimization.
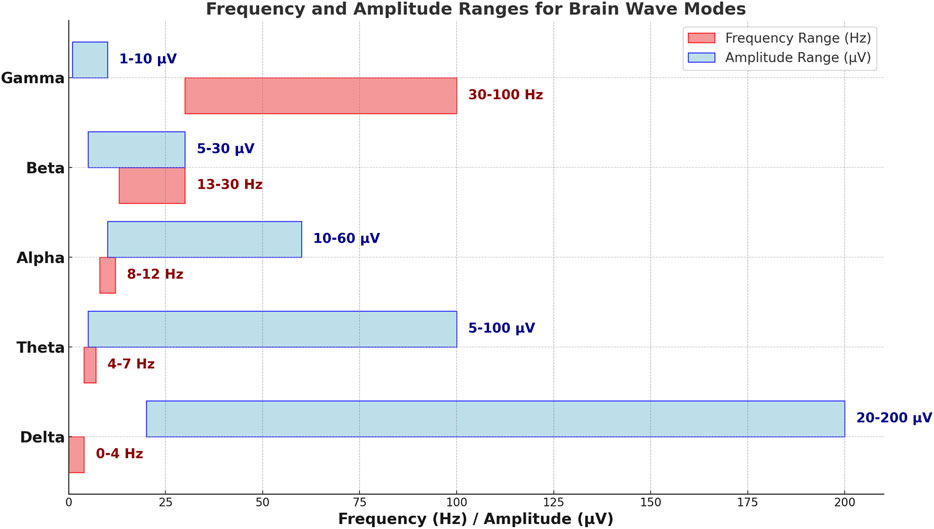
Figure 1. Frequency and amplitude ranges for Delta, Theta, Alpha, Beta, and Gamma brain waves. Red bars represent frequency ranges (Hz), increasing from low-frequency Delta waves to high-frequency Gamma waves. Blue bars indicate amplitude ranges (µV), showing an inverse relationship with frequency, where lower-frequency waves have higher amplitudes. This layout highlights the functional distinctions among brain wave modes, from relaxation and sleep to alertness and cognition.
In Figure 2 the optimized spring constants
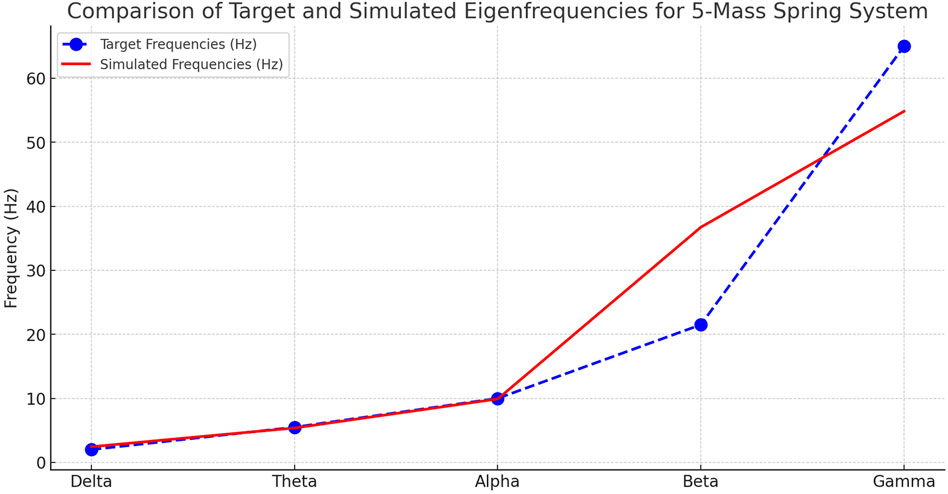
Figure 2. Comparison of target and simulated self-frequencies for the 5-mass system. The figure compares the target frequencies associated with the Delta, Theta, Alpha, Beta and Gamma brain bands with the self-frequencies obtained from the optimised mass-spring model. The bars show the alignment between the target values (in red) and simulated values (in blue) for each oscillatory mode. The model accurately reproduces the lower frequencies (Delta, Theta, Alpha), while showing more marked deviations for the high-frequency bands (Beta and Gamma), indicating the need for further structural refinements for a more faithful representation of high-frequency brain oscillations. All values are deterministic outputs of the simulation; therefore, no experimental variability or standard deviation bars are reported.
The blue curve provides a fit of the obtained data with an exponential model; more in details the fit curve is:
The approach used in this model can be criticized due to the inverse relationship between the spring constant
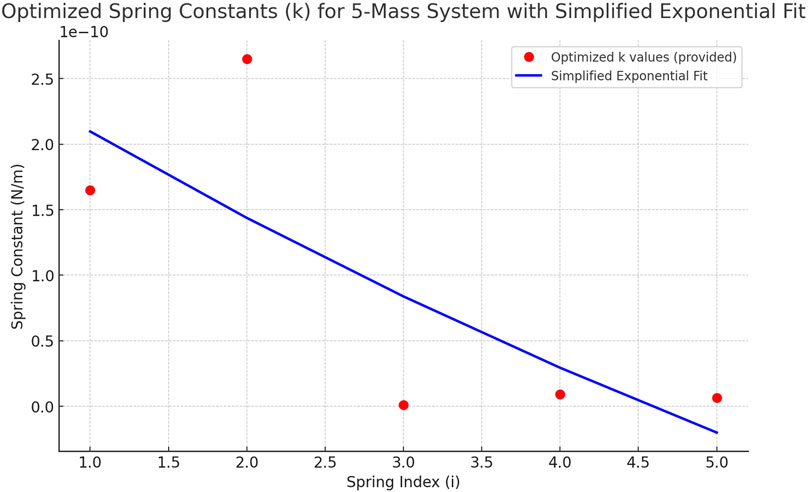
Figure 3. Optimised values of elastic constants ki in the 5-mass system. The figure shows the trend in the values of the elastic constants obtained at the end of the optimisation process, with the aim of matching the system’s self-frequencies to the brain frequency bands (Delta, Theta, Alpha, Beta, Gamma). The values of ki show a decreasing trend, imposed as a constraint during optimisation to maintain consistency with the physical model. The blue curve represents an exponential fit of the data, suggesting a functional relationship between the position of the spring in the chain and its stiffness. The optimized stiffness constants correspond to the best-fit solution of the numerical algorithm. As these are simulation parameters, no variability across experimental trials is available.
A refined approach
Starting from the consideration that a system of 5 masses connected by springs, the frequencies of the 5 normal modes are furnished by the expression:
where N = 5 is the number of masses), n ranges from 1 to 5 (representing the normal modes),
k is the spring constant, and m is the mass of each individual mass.
To improve the correspondence, we can modify the constant the expression in:
i.e., we can introduce a transformation function that allows to scale the formula differently for each mode instead of using a single constant.
In this adjustment, we calculated different
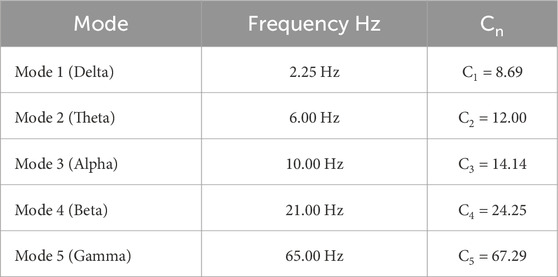
Table 3. Adaptation constants Cn for each brainwave mode in the mass-spring model. This table lists the adaptation constants Cn calculated for each oscillation mode (Delta, Theta, Alpha, Beta, Gamma) to scale the system’s frequencies and better match the observed brainwave frequencies. In this approach, Cn values are not physical spring constants but fitting parameters that allow the mass-spring model to emulate the frequency characteristics of neural oscillations.
In this mass-spring model of brain waves, each mode corresponds to a specific brain wave frequency and is characterized by a compliance. The compliance values reflect the flexibility of the spring associated with each mode, with higher compliance corresponding to lower stiffness.
The energy of each oscillatory mode is related to its frequency. Higher frequencies typically correspond to higher energies, as energy in oscillatory systems is proportional to the square of the frequency. In this model, as we move from Mode 1 (Delta) to Mode 5 (Gamma), we observe increasing frequencies: 2.25 Hz, 6.00 Hz, 10.00 Hz, 21.00 Hz, and 65.00 Hz. This increase in frequency corresponds to increasing energy levels for each successive mode.
In this model, each mode represents a different brain wave frequency: higher frequency modes, such as Gamma (65.00 Hz), require higher rigidity, as stiffer springs support faster oscillations. In contrast, lower frequencies like Delta (2.25 Hz) correspond to springs with lower rigidity allowing for slower oscillations and lower energy levels. This interpretation aligns with physical principles, where increasing the spring’s rigidity enables higher energy oscillations at faster frequencies.
The graph shows the relationship between
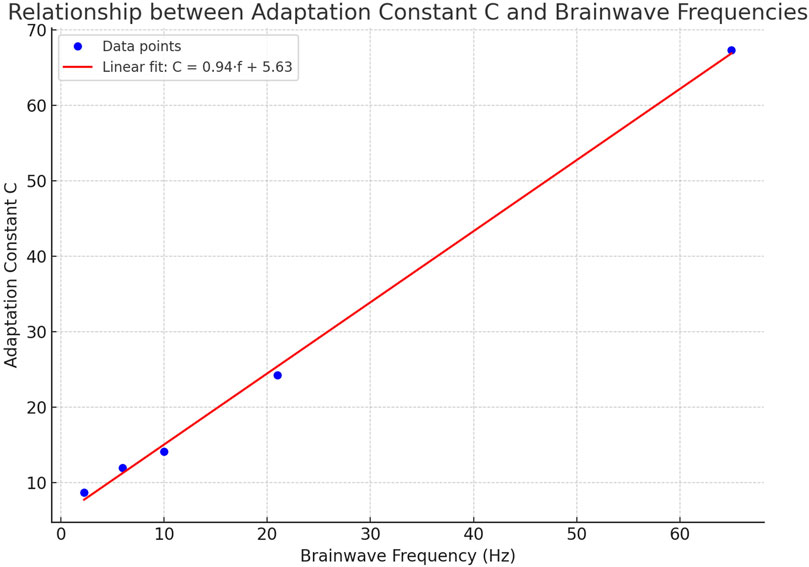
Figure 4. Relationship between adaptation constant C and brainwave frequencies. The plot illustrates the linear relationship between the adaptation constant CC and the corresponding brainwave frequencies (Delta, Theta, Alpha, Beta, Gamma) derived from the five-mode mass-spring model. Blue dots represent the calculated data points, while the red line shows the best linear fit, described by the equation
This relationship describes how the value of
The simplest case
In a two-mass, three-spring system with two equal masses m and three identical springs with spring constant k, we can achieve a pulse transfer from the first to the second mass by setting initial conditions that activate only the “out-of-phase” normal mode. Here, a detailed description of the physical process, explaining the initial conditions is reported.
The system consists of two masses m, labeled as m1 and m2, and three springs with stiffness k. In particular, the leftmost spring connects m1 to a fixed wall; the middle spring connects m1 and m2; the rightmost spring connects m2 to another fixed wall.
The forces on each mass due to the springs can be derived using Newton’s second law:
For m1:
For m2:
where
In this system, we have two characteristic oscillation frequencies (eigenfrequencies):
i .An in-phase mode
ii .Out-of-phase mode
To create a pulse transfer from
For displacement, let’s set
For the velocity, set
These initial conditions excite only the out-of-phase mode, resulting in an oscillatory transfer of energy between
With these initial conditions, the system behaves as follows:
At t = 0,
This generates an energy transfer to
Here is a series of three plots showing the initial phase of the mass-spring system, from t = 0 up to the first maximum elongation of the second mass m2 (see Figure 5). Each plot illustrates a key moment in the energy transfer from m1 to m2, following the out-of-phase mode. This progression visualizes how the initial displacement of m1 shifts towards m2 through the coupling spring.
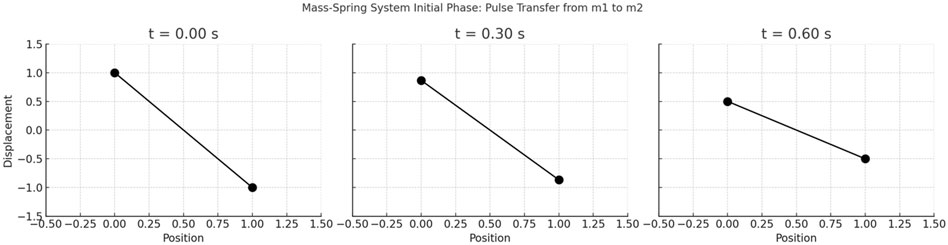
Figure 5. Initial phase of energy transfer in a two-mass, three-spring system, from t = 0 up to the first maximum elongation of the second mass m2. At t = 0, m1 is displaced from its equilibrium position while m2 remains at rest, setting up the initial conditions that excite only the out-of-phase normal mode. This mode causes the two masses to oscillate in opposite directions, generating a transfer of energy from m1 to m2. The plots capture three snapshots of this process, illustrating the gradual transfer of energy and the resulting displacement of m2 as it reaches its first maximum elongation. Each plot shows both the position of m1 and m2 at a specific time, highlighting the oscillatory motion and energy exchange between the masses. All values are deterministic model outputs, and no experimental variability or statistical error bars are applicable.
The transmission of a pulse in a system of coupled masses and springs has a striking analogy to the way depolarization waves propagate in neurons, particularly along the axon during nerve signal transmission. In both systems, the fundamental process involves energy or a signal passing from one point to the next, facilitated by the interactions between units (masses and springs in the mechanical system, or ion channels and membrane potentials in neurons).
A term that captures the idea of treating a network of neurons as a system of interacting masses and springs is Neuromechanical Network Model. This term suggests a framework that combines the structural and dynamic properties of neural networks (neurons and synapses) with the principles from mechanics (masses and springs) to model the propagation of signals as wave-like interactions. This approach acknowledges that neural dynamics can sometimes resemble the oscillatory and propagative behaviors of coupled oscillators, such as in a mass-spring system. In the following a comparison among the two different systems is proposed.
In both the mass-spring system and neurons, an initial disturbance propagates through a chain of coupled elements, creating a wave-like transmission. In the mass-spring model, displacing one mass (e.g., m1) sets off a disturbance that travels along the chain as energy transfers through the elastic coupling of the springs. Each mass influences the next, with spring stiffness k determining the strength and speed of this interaction. Similarly, in neurons, an initial depolarization triggered by a stimulus causes ion channels to open, allowing positive ions to enter and creating a local shift in membrane potential. This charge movement then induces neighboring segments to depolarize as well, establishing a continuous wave-like flow along the axon.
In both systems, coupling between adjacent elements is essential for signal transmission. In the mass-spring chain, springs connect neighboring masses, allowing energy to move smoothly down the line; in neurons, voltage-gated ion channels in the axon membrane act as links, triggering depolarization sequentially along each segment and facilitating the spread of the action potential.
The speed of signal propagation in each system depends on specific factors. In the mass-spring setup, the pulse transfer rate increases with spring stiffness and lighter masses. In neurons, conduction velocity is influenced by axon diameter and myelination; myelin sheaths enable faster transmission through saltatory conduction, where the action potential “jumps” between nodes of Ranvier.
As energy or signal propagates, it gradually attenuates. In the mass-spring chain, damping (like friction) causes a gradual reduction in pulse amplitude. For neurons, each axon segment enters a refractory period after depolarization, preventing it from immediately reactivating and ensuring unidirectional signal flow along the axon.
Both systems exhibit a cycle of activation and recovery at each point, as seen in an extended mass-spring chain where an introduced pulse propagates through oscillations driven by the springs’ restoring forces. Similarly, in neurons, a depolarization wave initiated at one end, such as the axon hillock, travels along the axon with each section undergoing a cycle of depolarization, repolarization, and refractory period.
Thus, whether initiated by pulling a mass or stimulating a neuron, both systems rely on coupled interactions to propagate disturbances sequentially, transmitting energy in the mass-spring model or an action potential in the neuron.
Conclusion
The 5-mass spring model provides a simplified yet insightful analogy for understanding brain wave frequencies in terms of mechanical oscillations. By connecting five equal masses in a linear chain with springs of varying stiffness, we effectively modeled different oscillatory modes that resemble brain wave frequencies. The choice of distinct spring constants enabled us to fine-tune each mode’s eigenfrequency to approximate the Delta, Theta, Alpha, Beta, and Gamma brain wave bands, which are key in describing different mental and cognitive states.
The optimization process played a central role, employing a three-step refinement that balanced physical constraints with numerical techniques to achieve frequency alignment. Initially, the system was configured with linearly decreasing spring constants, ensuring a monotonic trend. Using the Nelder-Mead algorithm, spring constants were iteratively adjusted to minimize the deviation of the calculated eigenfrequencies from target brain wave frequencies. Despite limitations in precisely aligning all modes particularly Beta and Gamma the optimization achieved close alignment for Delta, Theta, and Alpha bands, which reflects the fundamental frequencies associated with lower cognitive and restful states. The more challenging high-frequency Beta and Gamma bands were approximated, with deviations indicating a need for further refinement, potentially through additional mass-spring pairs or a continuous system approach. In particular, while the current five-mass configuration reproduces Delta, Theta, and Alpha rhythms with good accuracy, the Beta and Gamma bands remain only approximated, with deviations that reflect the limited degrees of freedom of the system. Two potential strategies may help overcome this limitation: (i) increasing the number of masses, which would enrich the eigenmode spectrum and shift higher modes toward the desired frequency ranges, and (ii) introducing viscous damping, which could modulate both frequency and bandwidth, thus improving the correspondence with Beta and Gamma rhythms.
In terms of the physical model, each spring constant reflects an incremental damping effect, with decreasing values representing progressively lower resistance to oscillatory transfer. This pattern mirrors the gradual dissipation seen in higher brain frequencies and the persistence of low-frequency rhythms like Delta. The penalty function introduced during optimization successfully enforced a decreasing sequence in the spring constants, ensuring the model adhered to realistic physical constraints.
In a single degree-of-freedom oscillator, the classical mechanical intuition is that increasing stiffness directly increases the natural frequency. In our multi-mass coupled system, however, the effective frequencies emerge from the global eigenvalue structure of the stiffness matrix. As a result, changes in a single spring constant can shift specific modes up or down depending on the interaction with neighboring elements and the boundary conditions, sometimes producing counterintuitive trends. This highlights the phenomenological nature of the present formulation and suggests that imposing monotonic constraints on stiffness values or introducing additional couplings may provide a refinement that aligns more closely with classical expectations.
The importance of models lies in their ability to reduce the complexity of the biological system while maintaining its essential characteristics [26, 27], facilitating theoretical and applied exploration of neural function.
In conclusion, this model offers a framework for exploring neural oscillations using a simplified mechanical system, providing a basis for future studies on brain wave dynamics. By simulating brain wave frequencies with a mass-spring system, it allows researchers to investigate the interactions of oscillatory modes and their potential roles in cognitive functions. This approach could inspire new methods for modeling complex neural networks and deepen our understanding of resonance, energy transfer, and synchronization in the brain. Additionally, the model’s tunability adjusting spring constants to emulate different frequency bands presents a versatile tool for examining how changes in neural oscillations may influence cognition, paving the way for applications in neuroengineering and computational neuroscience.
Beyond its descriptive role, the proposed neuromechanical framework may also inspire potential applications. By tuning the stiffness parameters, the model could mimic pathological rhythms such as epileptic synchronization, while its intuitive mechanical analogy may support the design of bio-inspired oscillatory devices and provide conceptual tools for neuroengineering applications.
Data availability statement
The raw data supporting the conclusions of this article will be made available by the authors, without undue reservation.
Author contributions
RM: Methodology, Conceptualization, Data curation, Visualization, Validation, Investigation, Supervision, Funding acquisition, Writing – review and editing, Project administration, Resources, Formal Analysis, Writing – original draft, Software. GP: Project administration, Funding acquisition, Resources, Visualization, Formal Analysis, Validation, Conceptualization, Supervision, Data curation, Methodology, Investigation, Writing – review and editing, Writing – original draft, Software.
Funding
The author(s) declare that no financial support was received for the research and/or publication of this article.
Conflict of interest
The authors declare that the research was conducted in the absence of any commercial or financial relationships that could be construed as a potential conflict of interest.
The author(s) declared that they were an editorial board member of Frontiers, at the time of submission. This had no impact on the peer review process and the final decision.
Generative AI statement
The author(s) declare that no Generative AI was used in the creation of this manuscript.
Any alternative text (alt text) provided alongside figures in this article has been generated by Frontiers with the support of artificial intelligence and reasonable efforts have been made to ensure accuracy, including review by the authors wherever possible. If you identify any issues, please contact us.
Publisher’s note
All claims expressed in this article are solely those of the authors and do not necessarily represent those of their affiliated organizations, or those of the publisher, the editors and the reviewers. Any product that may be evaluated in this article, or claim that may be made by its manufacturer, is not guaranteed or endorsed by the publisher.
References
1. Herzog S, Fläschner G, Incaviglia I, Casares-Arias J, Ponti A, Strohmeyer N, et al. Monitoring the mass, eigenfrequency, and quality factor of Mammalian cells. Nat Commun (2024) 15(1):1751. doi:10.1038/s41467-024-46056-7
2. Angeler DG. Biological systems — “symphonies of life”: reviving friedrich cramer's general resonance theory. BioEssays (2023) 45(11):2300113. doi:10.1002/bies.202300113
3. Kaya E, Henry MJ. Reliable estimation of internal oscillator properties from a novel, fast-paced tapping paradigm. Scientific Rep (2022) 12(1):20466. doi:10.1038/s41598-022-24453-6
5. Hu Y, Wu J, Cao Y, Tang X, Wu G, Guo Q, et al. Abnormal neural oscillations in clinical high risk for psychosis: a magnetoencephalography method study. Gen Psychiatry (2022) 35(2):e100712. doi:10.1136/gpsych-2021-100712
6. Bollimunta A, Mo J, Schroeder CE, Ding M. Neuronal mechanisms and attentional modulation of corticothalamic alpha oscillations. The J Neurosci (2011) 31(13):4935–43. doi:10.1523/jneurosci.5580-10.2011
7. Haegens S, Cousijn H, Wallis G, Harrison PJ, Nobre AC. Inter- and intra-individual variability in alpha peak frequency. NeuroImage (2014) 92:46–55. doi:10.1016/j.neuroimage.2014.01.049
8. Moënne-Loccoz C, Astudillo-Valenzuela C, Skovgård K, Salazar-Reyes C, Barrientos S, García-Núñez X, et al. Cortico-striatal oscillations are correlated to motor activity levels in both physiological and parkinsonian conditions. Front Syst Neurosci (2020) 14:56. doi:10.3389/fnsys.2020.00056
9. Lu Q, Zhenpeng M, Li W. Effects on the motor cortex in gamma rhythm in terms of central pattern generator. Ieee Access (2019) 7:136369–77. doi:10.1109/access.2019.2942712
10. Jacobs J, Kahana M. Neural representations of individual stimuli in humans revealed by gamma-band electrocorticographic activity. J Neurosci (2009) 29(33):10203–14. doi:10.1523/jneurosci.2187-09.2009
11. Buzsáki G, Draguhn A. Neuronal oscillations in cortical networks. Science (2004) 304(5679):1926–9. doi:10.1126/science.1099745
12. Uhlhaas PJ. High-frequency oscillations in schizophrenia. Clin EEG Neurosci (2011) 42(2):77–82. doi:10.1177/155005941104200208
13. Magazù S, Caccamo MT. Parametric resonance brain model. Scientific Rep (2024) 14(1):24657. doi:10.1038/s41598-024-76610-8
14. Calabrò E, Magazù S. Spectroscopic detection of chromatin uncoiling and chromosome alignment in neuronal-like cells under exposure to low intensity magnetic fields. Spectrosc Lett (2024) 57(7):412–9. doi:10.1080/00387010.2024.2362368
15. E Niedermeyer, and FL da Silva, editors. Electroencephalography: basic principles, clinical applications, and related fields. Lippincott Williams and Wilkins (2005).
16. Izsák J, Theiss S, Illes S. Ontogeny of oscillatory slow-wave and neuronal population activity in human ipsc-3d cortical circuits. (2022) doi:10.1101/2022.03.14.484311
17. Cho O, Han-Moi S, Lee W. Real-time 3d fluid digital art using bci sensor. (2014) doi:10.14257/astl.2014.67.18
18. Nooripour R, Viki M, Ghanbari N, Farmani F, Emadi F. Alpha/Theta neurofeedback rehabilitation for improving attention and working memory in female students with learning disabilities. Obm Neurobiol (2024) 08(03):1–20. doi:10.21926/obm.neurobiol.2403229
19. Sergi A, Messina A, Saija R, Martino G, Caccamo MT, Kuo MF, et al. Time-irreversible quantum-classical dynamics of molecular models in the brain. Symmetry (2025) 17(2):285. doi:10.3390/sym17020285
20. Nappo R, Simeoli R. Il contributo dell'intelligenza artificiale nella diagnosi dei disturbi neurodegenerativi. Rivista Sperimentale Di Freniatria (2024) 148(3):131–44. doi:10.3280/rsf2024-003008
21. Kamagata K, Andica C, Kato A, Saito Y, Uchida W, Hatano T, et al. Diffusion magnetic resonance imaging-based biomarkers for neurodegenerative diseases. Int J Mol Sci (2021) 22(10):5216. doi:10.3390/ijms22105216
22. World Health Organization. Global status report on the public health response to dementia. Geneva: WHO (2021).
23. Völter F, Beyer L, Eckenweber F, Scheifele M, Bui N, Patt M, et al. Assessment of perfusion deficit with early phases of [18f]pi-2620 tau-pet versus [18f]flutemetamol-amyloid-pet recordings. Eur J Nucl Med Mol Imaging (2022) 50(5):1384–94. doi:10.1007/s00259-022-06087-y
24. Carapeto AP, Marcuello C, Faísca PFN, Rodrigues MS. Morphological and biophysical study of S100A9 protein fibrils by atomic force microscopy imaging and nanomechanical analysis. Biomolecules (2024) 14(9):1091. doi:10.3390/biom14091091
25. Wang H, Wu J, Sternke-Hoffmann R, Zheng W, Mörman C, Luo J. Multivariate effects of pH, salt, and Zn2+ ions on Aβ40 fibrillation. Commun Chem (2022) 5:171. doi:10.1038/s42004-022-00786-1
26. Musotto R, Wanderlingh U, Pioggia G. Ca2+ waves in astrocytes: computational modeling and experimental data. Front Cell Neurosci (2025) 19:1536096. doi:10.3389/fncel.2025.1536096
Keywords: delta, theta, alpha, beta, gamma
Citation: Musotto R and Pioggia G (2025) Neuromechanical network model. Front. Phys. 13:1656677. doi: 10.3389/fphy.2025.1656677
Received: 30 June 2025; Accepted: 02 September 2025;
Published: 19 September 2025.
Edited by:
Sergei Fedotov, The University of Manchester, United KingdomReviewed by:
Carlos Marcuello, Instituto de Nanociencia y Materiales de Aragón (INMA), SpainShiquan Wang, Nanyang Technological University, Singapore
Copyright © 2025 Musotto and Pioggia. This is an open-access article distributed under the terms of the Creative Commons Attribution License (CC BY). The use, distribution or reproduction in other forums is permitted, provided the original author(s) and the copyright owner(s) are credited and that the original publication in this journal is cited, in accordance with accepted academic practice. No use, distribution or reproduction is permitted which does not comply with these terms.
*Correspondence: Rosa Musotto, cm9zeS5tdXNvdHRvQGlyaWIuY25yLml0