 Karin Karlsson
 Karin Rådholm
 Elizabeth Dunford
 Jason H. Y. Wu
 Bruce Neal2
- 1Department of Medical Sciences, Uppsala University, Uppsala, Sweden
- 2The George Institute for Global Health, University of New South Wales, Sydney, NSW, Australia
- 3Department of Health, Medicine and Caring Sciences, Linköping University, Linköping, Sweden
- 4Department of Nutrition, Gillings Global School of Public Health, The University of North Carolina at Chapel Hill, Chapel Hill, NC, United States
- 5The School of Population Health, University of New South Wales, Sydney, NSW, Australia
Background: Dietary sodium has a dose-response relationship with cardiovascular disease, and sodium intake in Sweden exceeds national and international recommendations. Two thirds of dietary sodium intake comes from processed foods, and adults in Sweden eat more processed foods than any other European country. We hypothesized that sodium content in processed foods is higher in Sweden than in other countries. The aim of this study was to investigate sodium content in processed food items in Sweden, and how it differs from Australia, France, Hong Kong, South Africa, the United Kingdom and the United States.
Methods: Data were collected from retailers by trained research staff using standardized methods. Data were categorized into 10 food categories and compared using Kruskal-Wallis test of ranks. Sodium content in the food items was compared in mg sodium per 100 g of product, based on the nutritional content labels on the packages.
Results: Compared to other countries, Sweden had among the highest sodium content in the “dairy” and “convenience foods” categories, but among the lowest in “cereal and grain products,” “seafood and seafood products” and “snack foods” categories. Australia had the overall lowest sodium content, and the US the overall highest. The highest sodium content in most analyzed countries was found in the “meat and meat products” category. The highest median sodium content in any category was found among “sauces, dips, spreads and dressings” in Hong Kong.
Conclusion: The sodium content differed substantially between countries in all food categories, although contrary to our hypothesis, processed foods overall had lower sodium content in Sweden than in most other included countries. Sodium content in processed food was nonetheless high also in Sweden, and especially so in increasingly consumed food categories, such as “convenience foods”.
1. Introduction
An excessive intake of dietary sodium is linked to an increased risk of cardiovascular diseases (CVDs) (1–3), largely mediated by an increased blood pressure (2). In 2019, it was estimated that high sodium intake alone attributed to 1.89 million deaths globally (4). In Sweden, high sodium intake approximated accounted for 20% of all myocardial infarctions and 10% of all strokes (5). Reducing sodium intake has recently been convincingly demonstrated to reduce the risk of CVDs and mortality (6). The main contributors to dietary sodium intake in Sweden, as well as many other countries, are processed or ultra-processed food items (7–9). Previous studies from other countries estimate that processed foods generally account for 66–80% of population dietary sodium intake, with the remainder deriving from salt added at the table or during cooking (10–12). Packaged processed- and ultra-processed foods are often high in sodium, saturated fat and sugar (13–15).
The Nordic Nutritional Recommendations (NNR) and the Swedish Food Agency recommend a maximum intake of 6 g salt (2,400 mg sodium) per day (16, 17). The only current initiative to lower sodium intake is the “green keyhole,” a front-of-pack label for consumers that indicates the best in class products, which have lower sodium, saturated fat, sugar as well as higher fiber content. The criteria for putting the label on a food item differs between food categories (18). The Swedish Food Agency also provides information on their website on why it is important to lower sodium intake and suggestions on how to do it (19). The current estimated intake of dietary salt in Sweden is 10–12 g (4,160–5,000 mg sodium) per day per capita (20, 21), and adults in Sweden have been shown to be among the highest consumers of ultra-processed foods in Europe (22). Consumption of ultra-processed foods in Sweden has increased significantly in recent decades (23) simultaneously as consumption of freshly prepared meals has decreased (23, 24).
One way to lower population sodium intake is to develop food policies targeting food manufacturers and encouraging the lowering of sodium content in their products (25–27). To better understand if this would be an effective strategy, and how such types of policies should be formulated, the sodium content in commercially available food items needs to be reviewed. The aim of this study was to examine the sodium content in processed food items in Sweden and how it differs from that in other countries. No previous studies have examined the content of sodium in food items in Sweden compared to other countries on an extensive food category level. The hypothesis of this study was that processed food items in Sweden contain more sodium than comparable foods in other countries. The specific research questions were: (1) How much sodium do processed food items in Sweden contain? and (2) How does sodium content in processed food items in Sweden differ from that in other countries with FoodSwitch data (Australia, France, Hong Kong, South Africa, the United Kingdom and the United States), and how does sodium content differ in processed foods across food categories?
2. Materials and methods
2.1. Study design
This was an observational, cross-sectional and multinational study examining sodium content in Swedish processed food items, and comparing the sodium content in processed food items from Australia, France, Hong Kong, South Africa, the United Kingdom and the United States.
2.2. Data collection
The Swedish data were collected for this study in 2021. Data were extracted from four large Swedish retailer databases: DABAS, ICA, Coop and City Gross. The Swedish data were manually categorized by researchers with the Department of Medical Sciences at Uppsala University. Data were categorized according to the FoodSwitch categorization system to be comparable with the other datasets.
For this project, the available FoodSwitch data from six countries were included for comparison. Countries were selected to ensure a broad geographical comparison to the Swedish data. The George Institute for Global Health's FoodSwitch Branded Food Composition Database contains nutrition information for packaged foods from multiple countries. Product information in FoodSwitch is controlled with an established quality assurance protocol, reviewed and categorized into the database (28). Further details of collection and extraction of data for each specific country within the FoodSwitch database are as follows: Australia: Collected in 2013–2022, extracted in 2022; France: Collected in 2021, extracted in 2022; Hong Kong: Collected in 2017–2019, extracted in 2022; South Africa: Collected in 2016–2021, extracted in 2022; UK: Collected in 2013–2020, extracted in 2022.
2.3. Food categories
The selected food categories were influenced by the WHO benchmarks for sodium content in food, published in 2021 (29). Analyses were examined using 10 broad food categories: “bread and bakery products,” “cereal and grain products,” “convenience foods,” “dairy,” “edible oils and oil emulsions,” “fruits, vegetables, nuts and legumes,” “meat and meat products,” “sauces, dressings, dips and spreads,” “seafood and seafood products” and “snack foods.” A description of food items in the included categories can be found in Supplementary Table 1. Sodium content in the food items was compared in mg sodium per 100 g of product, based on the nutritional content labels on the packages.
2.4. Statistical analysis
Statistical analyses were conducted using the statistical software Stata (17.0, StataCorp. LLC, College Station, TX). Kruskal–Wallis test of ranks followed by the post-hoc test Dunn's pairwise comparisons of means were used to determine differences in distribution of sodium content between countries. The post-hoc test, Dunn's pairwise comparison of means test, where the rank sum means are compared to each other (30), was made with a Benjamini–Hochberg procedure to keep the false discovery rate at 5%.
Items were excluded if they had missing values for sodium content, if the value for sodium was zero or if the value was incorrect. The incorrect values were identified by comparing items, specifically extreme outliers, with the nutritional information on the manufacturer website. Additionally, the following food types, that mainly consists of sodium, were excluded: “herbs,” “herb pastes,” “curry powder mixes,” “herbs and spices,” “spices,” “seasonings,” “salt,” “baking soda,” “baking powder” and “bicarb soda.”
A country was defined as having sodium contents higher or lower than most countries if the sodium values were higher or lower than >5 countries.
2.5. Ethical considerations
This study used secondary food composition data, for which ethical approval is not needed. The data are not considered sensitive and cannot be linked to individuals.
3. Results
3.1. Derivation of the study database
In total, the multinational database had 482,737 items in the included food categories. After removal of missing data, zero values, incorrect values and sub-categories the total study sample was n = 3,89,596 (see Figure 1).
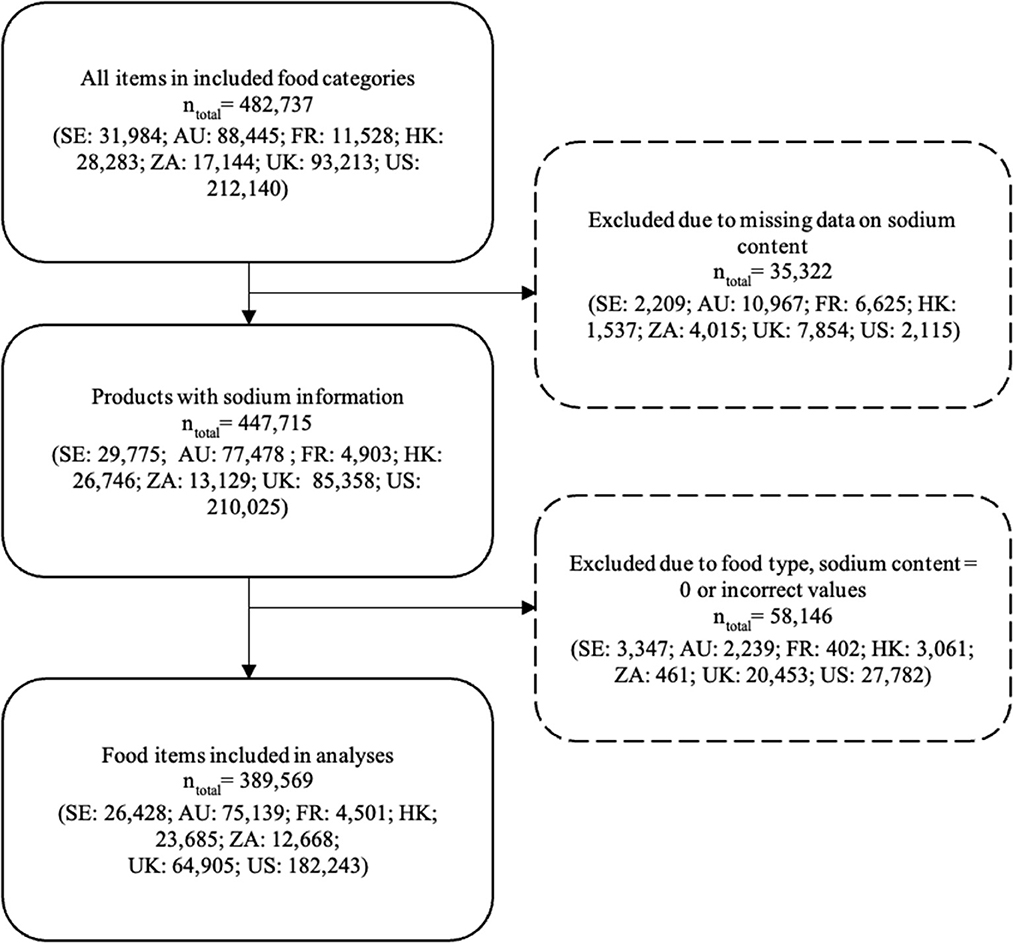
Figure 1. Flowchart illustrating the exclusion of data. SE, Sweden; AU, Australia; FR, France; HK, the Hong Kong Special Administrative Region of the People's Republic of China; ZA, South Africa; UK, United Kingdom; US, United States.
3.2. Sodium content in processed foods by country
The sodium content in each food category is described by country in Table 1.
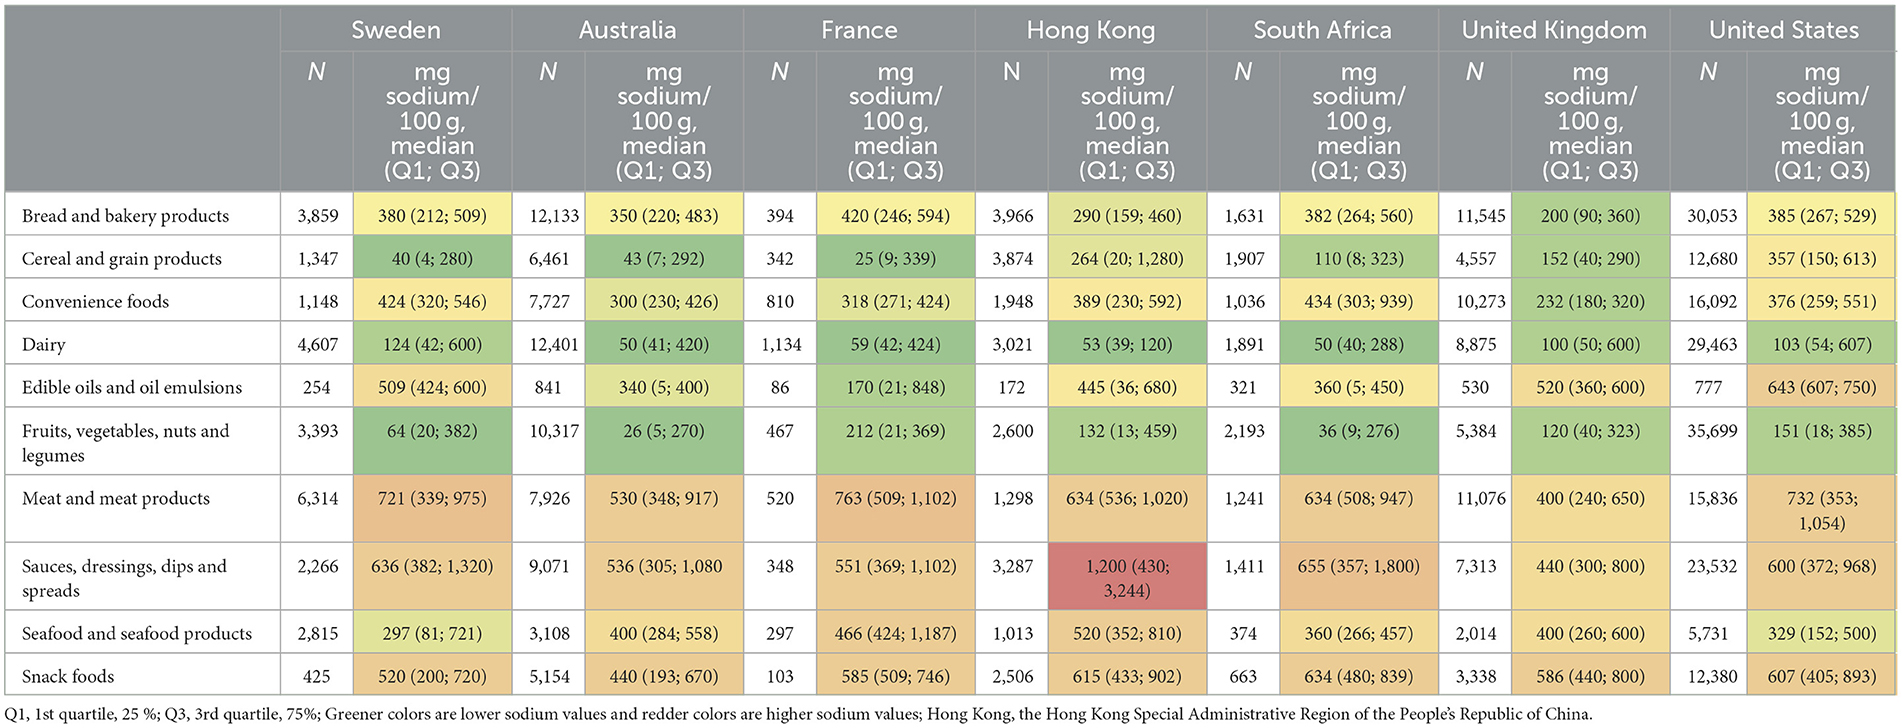
Table 1. Characteristics of sodium content in each food category by country.
The processed food categories in Sweden had the following ranking from highest median sodium content to lowest: “meat and meat products,” “sauces, dressings, dips and spreads,” “snack foods,” “edible oils and oil emulsions,” “convenience foods,” “bread and bakery products,” “seafood and seafood products,” “dairy,” “fruits, vegetables, nuts and legumes” and “cereal and grain products.”
Table 2 shows the ranking of each country in relation to each other based on median sodium content in the different food categories, with the highest rank indicating the highest sodium content. Based on the rankings in Table 2, Australia had the overall lowest sodium content while the United States had the highest. The rankings also show that Sweden had among the lowest sodium content in the “seafood and seafood products,” “cereal and grain products” and “snack foods,” and overall ranked with the third lowest sodium content of all countries. The highest sodium contents in Sweden, compared to the other countries, were identified in the “dairy” and “convenience foods” categories.
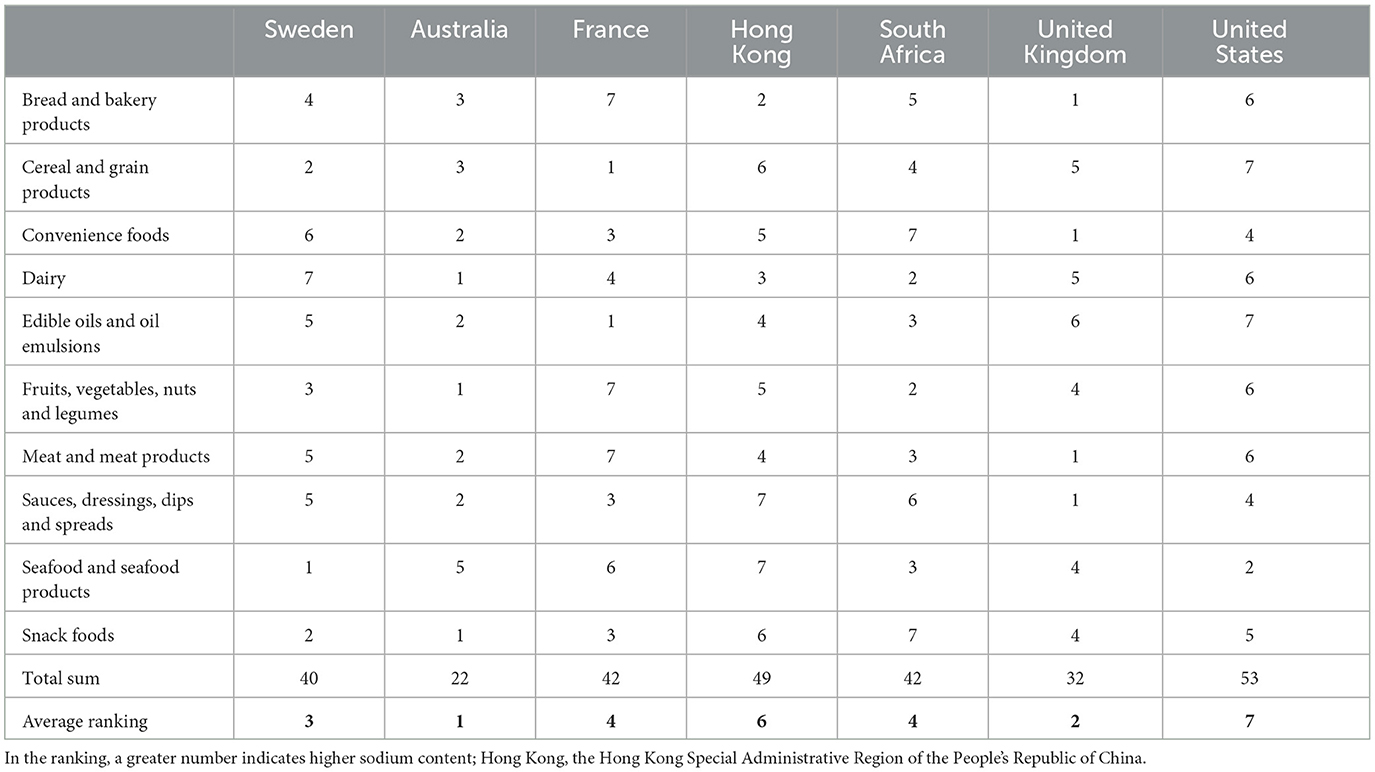
Table 2. Ranking of countries in each category based on the median values of sodium content.
3.3. Sodium content distributions
The Kruskal–Wallis test showed that there was a significant difference in sodium content between all countries in all food categories (p < 0.001). The distribution of sodium content in all food categories by country is displayed in Figure 2 and the following post-hoc pairwise comparison of means were significant.
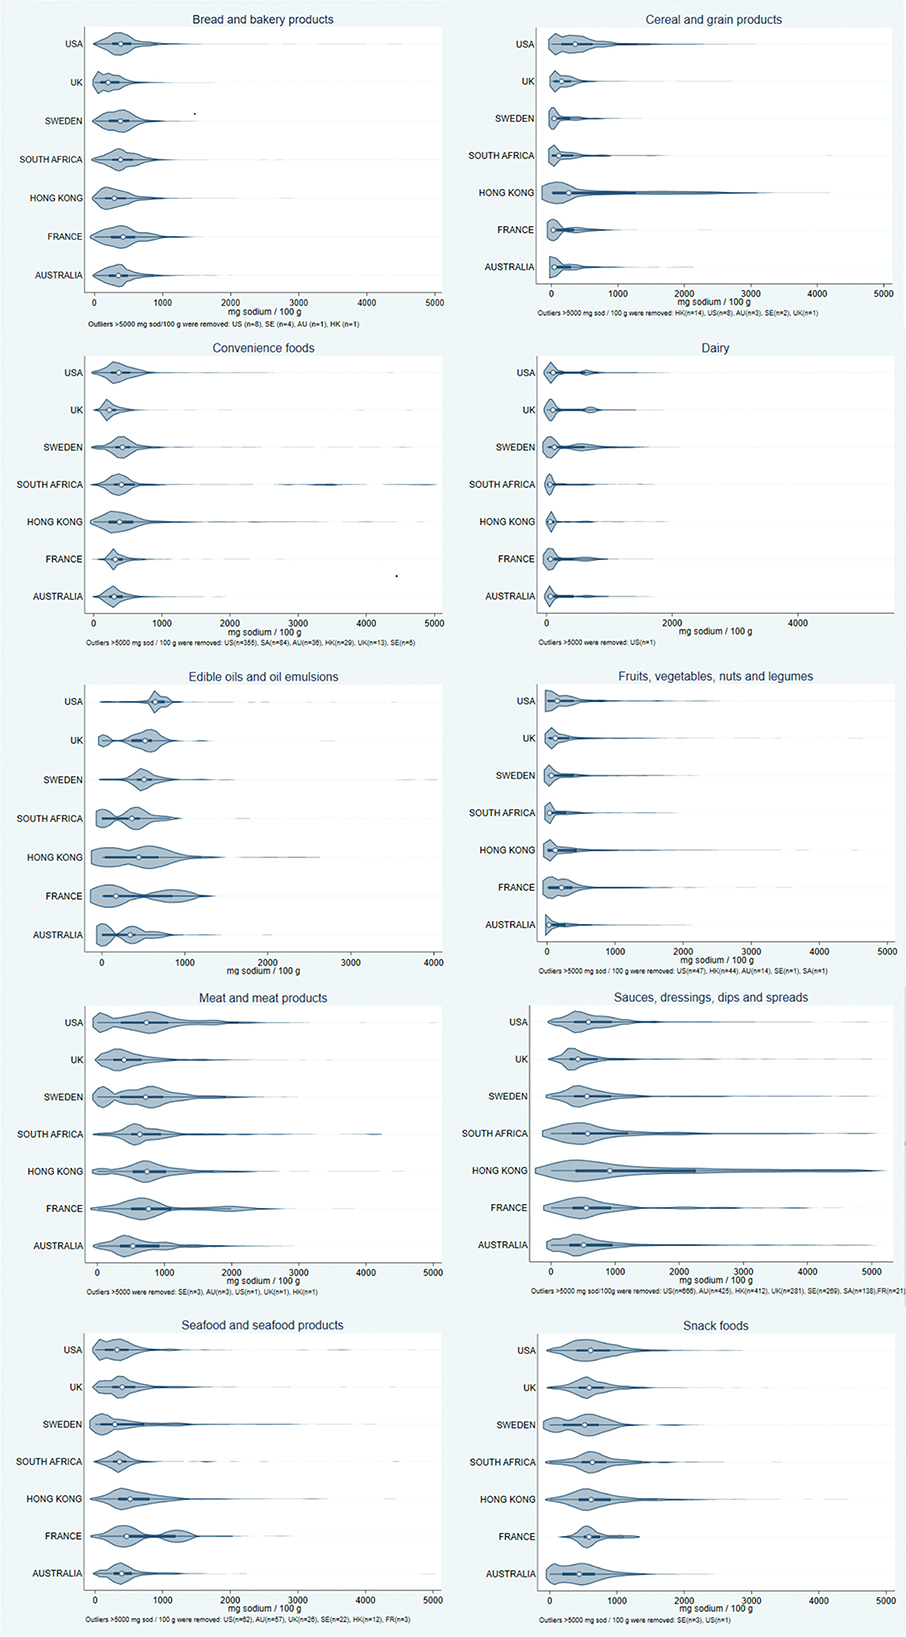
Figure 2. Violin plots showing the distribution of sodium content in food items by country in each food category. The categories containing most sodium were “meat and meat products,” “sauces, dressings, dips and spreads” and “snack foods.” Hong Kong, the Hong Kong Special Administrative Region of the People's Republic of China.
In the “bread and bakery products” category, Sweden had higher sodium content than Australia, Hong Kong and United Kingdom (p < 0.0001), but lower than France, South Africa and United States (p < 0.002). Most Swedish food items in this category had a sodium content below ~900 mg per 100 g.
Swedish processed food items in the “cereal and grain products” category had lower sodium content than Australia, South Africa, the United Kingdom, Hong Kong and the United States (p < 0.0002). A majority of the Swedish food items had a sodium content under ~500 mg per 100 g.
Sweden had higher sodium content in the “convenience foods” category than all countries (p < 0.001) except South Africa (p < 0.006). Most Swedish food items in this category had a sodium content of < 600 mg per 100 g.
In the “dairy” category, Sweden had higher sodium content than Hong Kong, Australia, South Africa and France, but lower than the United States (p < 0.001). Most Swedish food items in this category had a sodium content below 200 mg per 100 g. In the Swedish data, the largest peak in the distribution was below the median, with a second peak by the third quartile, similar to the United States, the United Kingdom and France.
Sweden had higher sodium content than the United Kingdom (p < 0.02) in the “edible oils” and dairy products' category. Most Swedish items had sodium contents under 1,000 mg per 100 g. Unlike the other countries, the Swedish and United States distributions lacked a peak at the lower (left) end.
Swedish food items in the “fruits, vegetables, nuts and legumes” category had a higher sodium content than Australia and South Africa, but lower than France, Hong Kong, the United Kingdom and the United States (p < 0.005). Most Swedish food items in that category had a sodium content of <300 mg per 100 g.
In the “meat and meat products” category, Sweden had higher sodium content than the United Kingdom and Australia, but lower than all other countries (p < 0.0001). Most Swedish food items in this category had sodium contents approximately under 1,500 mg per 100 g, with the largest peak of the data distribution between the median and the third quartile. A second peak was found by ~100 mg sodium per 100 g, similar to the United States.
Sweden had a lower sodium content in the “sauces, dressings, dips and spreads” category than the United States and Hong Kong, but higher than France, Australia and the United Kingdom (p < 0.001). Most Swedish items had a sodium content below 1,200 mg per 100 g.
Sodium content in Swedish food items in the “seafood and seafood products” category was lower than South Africa, the United Kingdom, Australia, France and Hong Kong (p < 0.02). A majority of the Swedish food items in this category had a sodium content of <1,000 mg per 100 g.
Lastly, in the “snack foods” category, the sodium content in Sweden was higher than in Australia (p < 0.0005) and lower than in France, Hong Kong, South Africa, the United Kingdom, and the United States (p < 0.0002). A majority of the Swedish “snack foods” had a sodium content <1,000 mg per 100 g, with the largest peak of data distribution between the median and third quartile, and a second peak by ~50 mg per 100 g similar to Australia.
4. Discussion
4.1. Key findings
To the knowledge of the authors, this is the first study to examine the sodium content of packaged food items in Sweden, in several food categories compared to other countries. The three categories in Swedish data with the highest sodium content were “meat and meat products,” “sauces, dressings, dips and spreads” and “snack foods.” Based on median sodium content, food items in Sweden had more sodium than all or most of the included countries in the “dairy” and “convenience foods” categories. Food items in Sweden were on the other hand lower in sodium content than all or most of the included countries in the “cereal and cereal products,” “seafood and seafood products” and “snack foods” categories. Overall, Sweden was ranked in third place, i.e., having the third lowest sodium content overall of the included countries. Contrary to the initial hypothesis, processed food items in Sweden were not saltier than other countries' processed food items. This is however not equal to Swedish food items having a low sodium content.
4.2. Interpretation
In the Swedish data, some products in the categories with the highest sodium contents had values high enough to reach the recommended daily upper limit of sodium intake in just one portion. This was especially found in the portions of ready-made food, for instance, a portion of lasagna. Based on the median values of sodium content in food items in Sweden, it would separately take either 330 g of bacon or ham, 630 g of bread or 570 g of ready-made meals to reach the maximum recommended sodium intake of 2,400 mg. These results are consistent with information from the Swedish Food Agency. On their website, it is stated that two breakfast sandwiches with either ham or cheese contains 2.5 g salt (1,000 mg sodium; 42% of RDI), and that a ready-made meal of meatballs, potatoes and gravy contains 4.5 g salt (1,900 mg sodium; 80% of RDI) (31). This means that the recommended daily upper intake limit of sodium is reached before the last meal of the day in an average Swedish diet. That should be an indication that sodium content in Swedish food is too high from a health perspective. Since a diet consists of multiple different food categories, a lowering of sodium content is necessary in not just one, but several categories of food items.
Swedish data had the second highest sodium content of the seven analyzed countries in the “convenience foods” category. In this category, food products such as ready-made meals are found, a sub-category of convenience foods of which consumption has rapidly increased in Sweden in recent years (23). With Sweden already being one of the top consuming countries of ultra-processed foods in Europe (22), it is alarming that the sodium content in this food category was among the highest of the seven included countries. High consumers of ready-made meals have been shown to generally have lower compliance with nutrition recommendations (23). Lack of time affects food intake and eating (32, 33) and acts as a barrier for healthy diet behavior (31). An easy solution for lack of time to prepare meals from scratch is to consume ready-made meals or other types of convenience foods (33). A group that to a large extent consumes convenience foods is the elderly, especially those in single households (34). The reasons for this range from being too frail to cook, lack of perceived joy in cooking, or simply because it is easier to prepare or tastes better than food provided by home care services (35). Additionally, it has been shown that lunches that can be bought in Sweden from restaurants, grocery stores and fast-food chains contain a large amount of sodium (36). This means that the risk of consuming high sodium content from convenience is applicable on other groups in society, not exclusively the vulnerable. For example, Nordic studies show that the frequency of eating outside the home is positively associated with higher income (37). With that said, eating out in Sweden is far more uncommon than in Australia (38) and the United Kingdom (39).
Sweden would benefit from adapting the WHO SHAKE (Surveillence, Harness industry, Adopt standards for labeling and marketing, Knowledge, Environment) Technical Package for Salt reduction (40). SHAKE is designed to assist nations to reduce the sodium intake in the population, by step-by-step interventions targeting both industry, politics and consumers. The SHAKE package lifts the focus on from the individual consumer to the entire society, promoting a sodium reduction in all steps from food manufacturing to consumption.
The current sodium-lowering initiatives in Sweden do not fully help consumers that lack knowledge about the potential health consequences of a high salt intake. Neither do they help those that have no choice but to consume ready-made meals (39). It is an inadequate solution for governmental agencies to refer to front-of-pack labeling, or recommending buying less ultra-processed food, to lower population dietary sodium intake. This could only work if everyone has sufficient money, time, and skills to cook, and the health literacy to gauge the healthiness of food products.
The main identified problem based on the results of this study is that the sodium contents of processed food in Sweden are overall too high. As Swedes already eat twice as much sodium as the recommendations from the WHO and Swedish Food Agency (31, 41), there is a need for new policies targeting the producers of processed food items, as well as health literacy in the population (42).
The problem of a high sodium intake due to low socioeconomic status, often correlated with lower health literacy, is often stressed in low- and middle-income country settings. As previously discussed, high sodium intake and health literacy might also affect people with higher income. Therefore, this should also be taken into account in high-income settings, such as Sweden, when evaluating or introducing new policies. Based on the results of this study, the Swedish government should consider adopting other countries' initiatives, for example by setting sodium reduction targets that could significantly lower CVD burden (43), and providing more resources to increase consumer knowledge about the elevated risk of severe health consequences from an excessive sodium intake (44).
4.3. Strengths and limitations
This study's greatest strength is the magnitude of the databases and the wide geographical coverage of the included countries.
The FoodSwitch databases used in this study only contain packaged food items. Hence, any assumptions about dietary sodium intake, based on the results of this study, would only apply to people whose diet consists of mainly processed and packaged food items, those who obtain most of their meals outside of the home, e.g., at restaurants, and not those who prepare their meals solely from fresh food items. As the consumption of freshly prepared food is decreasing, the data in this study would therefore, to a large extent, be expected to reflect the dietary sodium content in the population (23). The published WHO benchmarks for sodium content in food (29) are not applicable on the food categories analyzed in this study, as the WHO benchmarks are narrower. Additionally, it is not possible to apply the recommended maximum intake of sodium on individual food items or food categories, as a diet generally consists of several different food categories. It is therefore hard to compare the sodium content in each food category from this study to the total recommended intake of sodium.
For the Swedish data, generalisability of the results should be considered high regarding sodium content in packaged and processed food items. Data were collected from four different retail databases, giving a width between different price classes, producers and target populations, even if there is a risk that packaged food items sold outside of these retailers have been missed. It is also not possible to determine intake of dietary sodium in the respective food category based on these results. For example, people might only eat the food items with sodium content lower, or higher, than the median values.
The representativeness of the other countries processed foods selection differs between countries. For Example, the United States dataset is updated regularly (with the data used in this study extracted in 2021) and considered to be representative of over 80 % of processed food items in the United States (45). That can be compared with the French dataset where data were collected from one grocery food retailer at one point in time. The external validity of the results of the present study for neighboring countries in the same region, or for other regions, is unknown. Global generalizability of the results would be increased if data from more countries were available to analyse. Future research should examine how products from only the top global manufacturers differ in nutritional content between regions, to see how much the same food items, from the same manufacturer, differ between countries.
A limitation is that the FoodSwitch database only carry information on food items in a limited number of countries currently reporting packaged product content to the FoodSwitch database.
Contrary to our hypothesis, processed food items in Sweden did not stand out as excessively high in sodium content in comparison to other countries. However, “dairy” and “convenience foods” had a high sodium content, and were ranked high in sodium compared to the other countries in our study. With the rapidly increasing in-take of salty processed food items, it is likely that consumers in Sweden will continue to struggle to stay below the national recommended maximum daily intake of sodium. Our results can assist policy interventions to reduce dietary sodium consumption.
Data availability statement
The raw data supporting the conclusions of this article will be made available by the authors, without undue reservation.
Author contributions
Conceptualization and investigation: KK, KR, and JS. Methodology, software, validation, and visualization: KK and JS. Formal analysis, writing—original draft preparation, and project administration: KK. Resources: BN and JS. Data curation: JS. Writing, review, and editing: KK, JS, KR, ED, JW, and BN. All authors have read and agreed to the published version of the manuscript.
Funding
This study was supported by a donation from Anders Wiklöf. The funder had no role in the design and conduct of the study; collection, management, analysis, and interpretation of the data; preparation, review, or approval of the manuscript; or decision to submit the manuscript for publication.
Conflict of interest
JS reports stock ownership in Anagram kommunikation AB and Symptoms Europe AB, outside of the present study. The collection and categorization of Swedish data was conducted by the Department of Medical Sciences at Uppsala University in collaboration with the George Institute. The FS databases and mobile application was funded by the George Institute. FS has no commercial relationship with food manufacturers that affect the information in the databases or recommendation of products in the application.
The remaining authors declare that the research was conducted in the absence of any commercial or financial relationships that could be construed as a potential conflict of interest.
Publisher's note
All claims expressed in this article are solely those of the authors and do not necessarily represent those of their affiliated organizations, or those of the publisher, the editors and the reviewers. Any product that may be evaluated in this article, or claim that may be made by its manufacturer, is not guaranteed or endorsed by the publisher.
Supplementary material
The Supplementary Material for this article can be found online at: https://www.frontiersin.org/articles/10.3389/fpubh.2023.1182132/full#supplementary-material
References
1. He FJ, Li J, MacGregor GA. Effect of longer term modest salt reduction on blood pressure: cochrane systematic review and meta-analysis of randomised trials. BMJ. (2013) 346:f1325. doi: 10.1002/14651858.CD004937.pub2
2. Cogswell ME, Mugavero K, Bowman BA, Frieden TR. Dietary sodium and cardiovascular disease risk — measurement matters. N Engl J Med. (2016) 375:580–6. doi: 10.1056/NEJMsb1607161
3. Wang YJ, Yeh TL, Shih MC, Tu YK, Chien KL. Dietary sodium intake and risk of cardiovascular disease: a systematic review and dose-response meta-analysis. Nutrients. (2020) 12:1–14. doi: 10.3390/nu12102934
4. Qiao J, Lin X, Wu Y, Huang X, Pan X, Xu J, et al. Global burden of non-communicable diseases attributable to dietary risks in 1990–2019. J Hum Nutr Dietet. (2022) 35:202–13. doi: 10.1111/jhn.12904
5. Brådvik G, Andersson E, Ramdén V, Lindgren P, Steen Carlsson K. Kopplingen mellan levnadsvanor och hjärt-kärlsjukdom i Sverige. IHE Rapport 2021:5. Lund (2021).
6. Neal B, Wu Y, Feng X, Zhang R, Zhang Y, Shi J, et al. Effect of salt substitution on cardiovascular events and death. N Engl J Med. (2021) 385:1067–77. doi: 10.1056/NEJMoa2105675
7. Folkhälsomyndigheten. Förslag till åtgärder för ett stärkt, långsiktigt arbete för att främja hälsa relaterad till matvanor och fysisk aktivitet. Uppsala: Folkhälsomyndigheten (2017).
8. Sallis JF, Glanz K. Physical activity and food environments: solutions to the obesity epidemic. Milbank Q. (2009) 87:123–54. doi: 10.1111/j.1468-0009.2009.00550.x
9. Hulthén L, Aurell M, Klingberg S, Hallenberg E, Lorentzon M, Ohlsson C. Salt intake in young Swedish men. Public Health Nutr. (2010) 13:601–5. doi: 10.1017/S1368980009991431
10. Reducing Salt Intake (2011). Available online at: https://www.euro.who.int/en/health-topics/disease-prevention/nutrition/news/news/2011/10/reducing-salt-intake (accessed April 08, 2022).
11. Bolton KA, Webster J, Dunford EK, Jan S, Woodward M, Bolam B, et al. Sources of dietary sodium and implications for a statewide salt reduction initiative in Victoria, Australia. Br J Nutr. (2020) 123:1165–75. doi: 10.1017/S000711452000032X
12. Harnack LJ, Cogswell ME, Shikany JM, Gardner CD, Gillespie C, Loria CM, et al. Sources of sodium in US adults from 3 geographic regions. Circulation. (2017) 135:1775–83. doi: 10.1161/CIRCULATIONAHA.116.024446
13. Song Y, Li Y, Guo C, Wang Y, Huang L, Tan M, et al. Cross-sectional comparisons of sodium content in processed meat and fish products among five countries: potential for feasible targets and reformulation. BMJ Open. (2021) 11:e046412. doi: 10.1136/bmjopen-2020-046412
14. Nieto C, Tolentino-Mayo L, Medina C, Monterrubio-Flores E, Denova-Gutiérrez E, Barquera S. Sodium content of processed foods available in the mexican market. Nutrients. (2018) 10:2008. doi: 10.3390/nu10122008
15. Dunford EK, Poti JM, Xavier D, Webster JL, Taillie LS. Color-coded front-of-pack nutrition labels—an option for us packaged foods? Nutrients. (2017) 9:480. doi: 10.3390/nu9050480
16. Salt- råd. Available online at: https://www.livsmedelsverket.se/matvanor-halsa–miljo/kostrad/rad-om-bra-mat-hitta-ditt-satt/salt (accessed January 25, 2022).
18. Livsmedelsverket. Nyckelhålet. (2021). Available online at: https://www.livsmedelsverket.se/livsmedel-och-innehall/text-pa-forpackning-markning/nyckelhalet (accessed April 06, 2022).
19. Livsmedelsverket. Syna saltet - för hälsan. (2021). Available online at: https://www.livsmedelsverket.se/matvanor-halsa–miljo/kostrad/syna-saltet/syna-saltet—for-halsan (accessed April 14, 2022).
20. Livsmedelsverket, öhrvik VL. Andra länders insatser för att minska befolkningens intag av salt. Kartläggning av andra länders erfarenheter. Livsmedelsverkets rapportserie. Uppsala (2022).
21. Trieu K, Neal B, Hawkes C, Dunford E, Campbell N, Rodriguez-Fernandez R, et al. Salt reduction initiatives around the world – a systematic review of progress towards the global target. PLoS ONE. (2015) 10:e0130247. doi: 10.1371/journal.pone.0130247
22. Mertens E, Colizzi C, Peñalvo JL. Ultra-processed food consumption in adults across Europe. Eur J Nutr. (2022) 61:1521–39. doi: 10.1007/s00394-021-02733-7
23. Juul F, Hemmingsson E. Trends in consumption of ultra-processed foods and obesity in Sweden between 1960 and 2010. Public Health Nutr. (2015) 18:3096–107. doi: 10.1017/S1368980015000506
24. Alkerwi A, Crichton GE, Hébert JR. Consumption of ready-made meals and increased risk of obesity: findings from the Observation of Cardiovascular Risk Factors in Luxembourg (ORISCAV-LUX) study. Br J Nutr. (2015) 113:270–7. doi: 10.1017/S0007114514003468
25. Tedstone A, Duval D, Peacock E. Dietary health and CVD: implications for dietary policy in England. Proc Nutr Soc. (2020) 79:95–102. doi: 10.1017/S0029665119000600
26. Musicus AA, Kraak VI, Bleich SN. Policy progress in reducing sodium in the American diet, 2010–2019. Annu Rev Nutr. (2020) 40:407–35. doi: 10.1146/annurev-nutr-122319-040249
27. Caro JC, Ng SW, Taillie LS, Popkin BM. Designing a tax to discourage unhealthy food and beverage purchases: the case of Chile. Food Policy. (2017) 71:86–100. doi: 10.1016/j.foodpol.2017.08.001
28. Peters SAE, Dunford E, Ware LJ, Harris T, Walker A, Wicks M, et al. The sodium content of processed foods in South Africa during the introduction of mandatory sodium limits. Nutrients. (2017) 9:404. doi: 10.3390/nu9040404
29. World Health Organization. WHO Global Sodium Benchmarks for Different Food Categories. Geneva (2021).
30. Dunn OJ. Multiple comparisons using rank sums. Technometrics. (1964) 6:241–52. doi: 10.1080/00401706.1964.10490181
31. Livsmedelsverket. Hälften vore nog. (2021). Available online at: https://www.livsmedelsverket.se/matvanor-halsa–miljo/kostrad/syna-saltet/halften-vore-nog (accessed April 15, 2022).
32. Welch N, McNaughton SA, Hunter W, Hume C, Crawford D. Is the perception of time pressure a barrier to healthy eating and physical activity among women? Public Health Nutr. (2009) 12:888–95. doi: 10.1017/S1368980008003066
33. Jabs J, Devine CM. Time scarcity and food choices: an overview. Appetite. (2006) 47:196–204. doi: 10.1016/j.appet.2006.02.014
34. Hoffman R. Convenience foods and health in the elderly. Maturitas. (2016) 86:1–2. doi: 10.1016/j.maturitas.2015.12.002
35. Edfors E, Westergren A. Home-living elderly people's views on food and meals. J Aging Res. (2012) 2012:761291. doi: 10.1155/2012/761291
36. Livsmedelsverket, Julin BL. Så mycket salt innehåller lunchen. Salt och jod i lunchrätter från livsmedelsbutiker, lunch- och snabbmatsrestauranger. Livsmedelsverkets rapportserie. Uppsala (2022).
37. Lund TB, Kjærnes U, Holm L. Eating out in four Nordic countries: national patterns and social stratification. Appetite. (2017) 119:23–33. doi: 10.1016/j.appet.2017.06.017
38. Burns C, Jackson M, Gibbons C, Stoney RM. Foods prepared outside the home: association with selected nutrients and body mass index in adult Australians. Public Health Nutr. (2002) 5:441–8. doi: 10.1079/PHN2001316
39. Adams J, Goffe L, Brown T, Lake AA, Summerbell C, White M, et al. Frequency and socio-demographic correlates of eating meals out and take-away meals at home: cross-sectional analysis of the UK national diet and nutrition survey, waves 1-4 (2008-12). Int J Behav Nutr Phys Activity. (2015) 12:51. doi: 10.1186/s12966-015-0210-8
41. World Health Organization. Sodium Intake for Adults and Children. Guideline: Sodium Intake for Adults and Children. (2012). Available online at: http://www.ncbi.nlm.nih.gov/pubmed/23658998
42. Hyseni L, Elliot-Green A, Lloyd-Williams F, Kypridemos C, O'Flaherty M, McGill R, et al. Systematic review of dietary salt reduction policies: evidence for an effectiveness hierarchy? PLoS ONE. (2017) 12:e0177535. doi: 10.1371/journal.pone.0177535
43. Trieu K, Coyle DH, Afshin A, Neal B, Marklund M, Wu JHY. The estimated health impact of sodium reduction through food reformulation in Australia: a modeling study. PLOS Med. (2021) 18:e1003806. doi: 10.1371/journal.pmed.1003806
44. World Health Organization. Mapping Salt Reduction Initiatives in the WHO European Region. Copenhagen (2013).
45. Nielsen Consumer LLC. Label Insight. (2022). Available online at: https://nielseniq.com/global/en/landing-page/label-insight/ (accessed December 19, 2022).
Keywords: sodium, salt, processed food, packaged food, FoodSwitch, nutrition, Sweden
Citation: Karlsson K, Rådholm K, Dunford E, Wu JHY, Neal B and Sundström J (2023) Sodium content in processed food items in Sweden compared to other countries: a cross-sectional multinational study. Front. Public Health 11:1182132. doi: 10.3389/fpubh.2023.1182132
Received: 08 March 2023; Accepted: 17 May 2023;
Published: 08 June 2023.
Edited by:
George Pounis, Harokopio University, GreeceReviewed by:
Maria do Céu Gonçalves da Costa, University of Lisbon, PortugalRachael Mira McLean, University of Otago, New Zealand
Copyright © 2023 Karlsson, Rådholm, Dunford, Wu, Neal and Sundström. This is an open-access article distributed under the terms of the Creative Commons Attribution License (CC BY). The use, distribution or reproduction in other forums is permitted, provided the original author(s) and the copyright owner(s) are credited and that the original publication in this journal is cited, in accordance with accepted academic practice. No use, distribution or reproduction is permitted which does not comply with these terms.
*Correspondence: Karin Karlsson, a2FyaW4ua2FybHNzb25AdXUuc2U=; Johan Sundström, am9oYW4uc3VuZHN0cm9tQHV1LnNl