- 1Department of Chemical Engineering, University of Engineering and Technology, Lahore, Lahore, Punjab, Pakistan
- 2Department of Energy Systems Engineering, NFC Institute of Engineering and Technology, Multan, Pakistan
- 3Interdisciplinary Research Center for Hydrogen and Energy Storage (Tire II)-Research and Innovation, King Fahd University of Petroleum and Minerals (KFUPM), Dhahran, Saudi Arabia
- 4Department of Civil and Environmental Engineering, Hanyang University, Seoul, Republic of Korea
- 5Department of Environmental Engineering, Daegu University, Gyeongsan, Republic of Korea
- 6Department of Energy and Environmental Engineering,The Catholic University of Korea, Bucheon-si, Republic of Korea
Hydrogen production via chemical looping steam methane reforming (CL-SMR) is among the most promising current technologies. This work presents the development in gPROMS Model Builder 4.1.0® of a 1D model of an adiabatic packed bed reactor used for chemical looping reforming (CLR). The catalyst used for this process was 18 wt. % NiO with the support of Al2O3. A brief thermodynamic analysis using Chemical Equilibrium Application (CEA) was carried out to identify the optimum operating conditions. The model was simulated for 10 complete CL-SMR cycles. The effects of variations in temperature, pressure, gas mass velocity, nickel oxide concentration, reactor length, and particle diameter were studied to investigate the performance of the CL-SMR process under these variations. A parametric analysis was carried out for different ranges of conditions: temperatures from 600 to 1,000 K, pressure from 1 to 5 bar, gas mass velocity between 0.5 and 0.9 kg·m−2 s−1, nickel oxide concentration values between 0.1 and 1 mol·m−3, particle diameters between 0.7 and 1 mm, and fuel reactor (FR) lengths between 0.5 and 1.5 m. At the optimum temperature (950 K), pressure (1 bar), and steam-to-carbon molar ratio (3/1), with an increase in particle diameter from 0.7 to 1 mm, an 18% decrease in methane conversion and a 9.5% increase in hydrogen yield were observed. Similarly, with an increase in FR length from 0.5 m to 1.5 m, a delay in the temperature drop was observed.
1 Introduction
During the last couple of decades, global warming has emerged as one of the major problems confronting the Earth’s climate. According to an Intergovernmental Panel for Climate Change (IPCC) report, the temperature of the Earth has been rising drastically since 1850, with the last 4 decades (1980–2020) being considered the warmest (Intergovernmental panel of climate change IPCC, 2021). The main reason behind the rise in the temperature of the Earth is excessive emission of greenhouse gases (GHGs), such as N2O, H2O, CH4, CO2, SF6, and chlorofluorocarbons (CFCs), into the atmosphere. CO2 gas makes the highest contribution to GHGs, at 78% (Abbas et al., 2017). The emission of CO2 poses a high level of risk to the atmosphere due to its high efficiency in absorbing energy and its emission on a large scale (Rasheed et al., 2019). In 2021, 79% of total world energy was produced from fossil fuels, which emitted a total of 36.64 Gt of CO2, representing a 10.2% increase over CO2 emissions observed in 2018 (International Energy Agency IEA, 2022). Furthermore, it is expected that global energy demands will increase by up to 40% by 2040. In 2021, the total energy produced by Pakistan was 75.50 Mtoe, with CO2 emissions of 219.8 MT, which represents a 251.4% increase in CO2 emissions as compared to 1990. In comparison to 2021, it is estimated that by 2040 the consumption of natural gas for energy production will increase by up to 35% (Pakistan Energy demand forecast, 2021). With the rising energy demands, limited fossil fuel reserves, and environmental concerns, sustainable alternatives and environmentally friendly sources of energy are attracting attention and demanding greater research focus for the development of improved technology (International Energy Agency, 2017).
Hydrogen is recognized as one of the most suitable energy sources for clean energy production, as combustion of H2 is free of harmful pollutant emissions; due to this quality, researchers currently consider it to be the fuel of the future (Ma et al., 2016). Water vapor is the only byproduct produced along with energy production during combustion of H2. No harmful pollutants, such as COx, SOx, particulate matters, or soot, are produced during combustion of H2 (Sharma and Ghoshal, 2015). H2 can be used as an energy carrier for both industrial and domestic usage. Due to its high conversion efficiency, low pollution, and recyclability, H2 is considered to be a perfect energy source (Liu et al., 2020). The combustion of H2 produces more energy per unit mass than any other fuel, including gasoline, coal, and methane (Dutta, 2014).
The processes used for production of H2 are gasification, pyrolysis, reforming, and electrolysis (Luo et al., 2018). At present, nearly 96% of the world’s H2 production is fossil fuel-based, for example, from coal, crude oil, and natural gas. Among these, natural gas is the most prominent source used for H2 production (Omoniyi and Dupont, 2018; Stoppacher et al., 2022). There are numerous methods used for the manufacture of H2 from natural gas, e.g., partial oxidation (POx), steam methane reforming (SMR), and autothermal reforming (ATR). At present, approximately 75% of total H2 production across the world is SMR-based (Dutta, 2014). The SMR process occurs in two steps (see Appendix B) under mild pressure conditions of 20–35 atm and at an elevated temperature (between 800°C and 1,000°C). In the initial step (Appendix B, equation B1), CH4 is converted into H2; in the second step (equation B2), the water–gas shift (WGS) reaction takes place (Jin et al., 2023). The overall chemical reaction of the SMR process (Appendix B) is extremely endothermic and therefore requires an external heat source (Luo et al., 2018).
The main problem in the SMR process is the choice of oxygen transfer material (OTM), which can be tackled by maintaining appropriate specifications, such as high selectivity, high stability, and high reactivity with CH4, along with high resistance to carbon deposition (Pashchenko, 2018). In order from highest to lowest, the reactivity of OTMs with CH4 is as follows: NiO, CuO, Mn2O3, Fe2O3 (Luo et al., 2018). Metallic nickel (Ni) is most often used as a catalyst in the SMR process, and the most widely preferred OTM is also Ni-based oxide (LeValley et al., 2014). The SMR process is quite expensive, as losses in effectiveness occur with the passage of time, along with catalyst degradation (May et al., 1996).
In 2000, the chemical looping reforming (CLR) technique was introduced by Lyon and Cole (Lyon and Cole, 2000). The term chemical looping (CL) was given to this approach due to the transportation of oxygen as part of the process. The metal reduced during SMR reactions is subsequently oxidized for the beginning of the new CL cycle; see Figure 1.
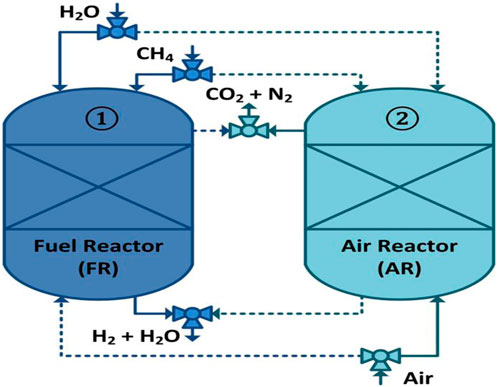
FIGURE 1. Schematic illustration of the CL-SMR process. Solid lines represent active streams, and dotted lines represent streams that are not active.
The chemical reaction equations for chemical looping–steam methane reforming (CL-SMR) are shown in Appendix B (B1 to B7 and B8 occur in a fuel reactor and an air reactor, respectively) (Luo et al., 2018). The main benefits of CL-SMR over SMR are as follows: 1) no external combustion is required; 2) steam and the catalyst are required in smaller quantities; 3) emission of sulfur pollutants is very low; and 4) there is zero formation of thermal NOx (Garcia-Labiano et al., 2009; Pröll et al., 2010; Liu et al., 2020). Therefore, chemical looping technology has recently attracted increasing attention, and a great deal of research has been carried out in the development of this technology.
2 Literature review
In the 1950s, Lewis et al. (1951) presented the basic idea of chemical looping to produce CO2 and syngas by using iron- and copper-based OTMs from carbonaceous fuel. Lewis and Gilliland (Lewis et al., 1954) also introduced the idea of using two interconnected fluidized bed reactors (FBRs) for the circulation of solid particles. The concept was the same as the chemical looping combustion (CLC) process. Later, Richter et al. (1983) recommended the principle of CLC, in which they considered the metal oxides CuO and NiO as OTMs in a formation of connected FBRs to increase the efficiency of a power plant. In 1987, Ishida et al. (1987) introduced the term CLC for the first time. They reduced the exergy losses that occurred during the conversion of fuel-based energy to thermal-based energy in conventional power plants by using natural gas.
The concept of chemical looping reforming (CLR) was originally proposed in 2001 by Mattisson and Lyngfelt (2001). CLR works on the same basic principles as chemical looping combustion (CLC), but instead of thermal-based energy, the end product is H2. Mattisson et al. (2004) recommended that the oxygen fraction in steam should not be more than 0.3 of the total oxygen in order to maintain a high temperature and promote conversion of CH4.
2.1 Progress in oxygen carriers
Zafar et al. (2006) tested NiO, CuO, Fe2O3, and Mn2O3 on two supports, SiO2 and MgAl2O4, in a laboratory-scale fluidized bed reactor (FBR). They discovered that MgAl2O4 showed higher reactivity levels than SiO2 during redox reactions. For H2 production from CH4, Rydén et al. (2008a); Rydén (2008) worked with atmospheric and pressurized CLR processes. Based on their findings, they concluded that the pressurized process achieved 5% higher efficiency due to a reduction in the energy requirements of H2 compression. Additionally, they tested Fe2O3/MgAl2O4 as an OTM with addition of an NiO layer. They discovered that, with a 1% addition of NiO on the OTM surface, the reactivity increased, and thus the selectivity of CH4 toward H2 and CO. Johansson et al. (2008) studied NiO as an OTM on two different supports, MgAl2O4 and NiAl2O3. They concluded that NiO/MgAl2O4 had a lower tendency toward carbon formation and a higher tendency toward CH4 conversion. Diego et al. (Lu et al., 2018) studied the behavior of NiO as an OTM on several supports, such as γ-Al2O3, θ-Al2O3, and α-Al2O3. They determined that the OTM impregnated on α-Al2O3 showed the highest reactivity during the reduction reaction, whereas it showed the lowest reactivity on γ-Al2O3. They also observed that, with an increase in the H2O-to-CH4 ratio and a decrease in temperature, the deposition of carbon during the reduction reaction occurred. de Diego et al. (2009) also studied the CLR working process with an Ni-based OTM on α-Al2O3 and γ-Al2O3 supports in a 900 W continuous reactor. They used different operating variables, such as different solid circulation rates, H2O-to-CH4 molar ratios from 0 to 0.5, and fuel reactor (FR) temperatures between 800°C and 900°C, to analyze the effects of these variables on CH4 conversion and product distribution. Rydén et al. (2006); Rydén et al. (2008b); Rydén et al. (2009) tested an Ni-based OTM on different supports, such as α-Al2O3, γ-Al2O3, MgAl2O4, and ZrO2-MgO, in 500 W CLR continuous reactors. They achieved the complete conversion of CH4 and high selectivity toward H2 and CO in all units. Pröll et al. (2010) tested an Ni-based OTM on NiAl2O4-MgO for the CLR process in a 140 kW pilot plant. They analyzed the results in a temperature range between 750°C and 900°C. All the aforementioned studies were conducted at atmospheric pressure. Ortiz et al. (2010) studied the performance of a pressurized CLR process (up to 10 bar) in 900 W units and found results similar to those obtained with OTMs at atmospheric pressure by de Diego et al. (2009). Zainab et al. (Ibrahim et al., 2018) studied the CL reforming of shale gas using NiO on Al2O3 and CaO/Al2O3 in a packed bed reactor (PBR) at 1 bar, 750°C, and with a steam-to-carbon molar ratio of 3. They observed that significant deactivation of catalyst (NiO on CaO/Al2O3) occurred after consecutive nine redox cycles. Before catalyst deterioration, fuel conversion was above 80%, which shows that steam reforming processes are highly favored by a high temperature.
2.2 Progress in CLR modeling
For the purposes of scale-up, design, and optimization of the CLR process, modeling and simulation of air and fuel-based reactors would appear to be beneficial. Halabi et al. (2008) developed a 1D model of an FBR for investigation of performance in terms of conversion of CH4, H2 yield, H2 purity, and reforming efficiency of autothermal reforming (ATR). They assumed that the process was adiabatic in nature. Monnerat et al. (2003) developed a model for AR to determine the effect of the quantity of O2 on the temperature of the reactor. They also developed a model of oxidation of an Ni catalyst for unsteady-state conditions. Hoang and Chan (2004) developed a 2D model of the reformer in order to simulate the conversion behavior of the reactant. Zhou et al. (2013) developed a 1D model of a PFR for the reduction and CLC processes, using NiO as a catalyst. They assumed isothermal and isobaric conditions. Adams and Barton (2009) developed a 2D heterogeneous model of PBR for the WGS reaction. The model established could be applied to both low- and high-temperature shift reactions and was also suitable for simulation of a catalyst-based process with known kinetic data. Grigorios et al. (Pantoleontos et al., 2012) developed a model to examine the dynamic behavior of an industrial heterogeneous catalytic packed bed reactor (PBR) for the SMR process. The model described the physicochemical processes that take place in both the gas and solid phases, accounting for diffusional limitations within the catalyst particles.
Ghouse and Adams (2013) developed a 2D heterogeneous model of SMR. They assumed perfect mixing of the species without any carbon deposition. In their work, the equations of energy and mass transfer in the solid and gas phases were considered. Zhou et al. (2015) developed a three-phase hydrodynamic model of CL reduction with NiO as the catalyst and CH4 as the fuel for the analysis of experimental data. They incorporated pressure change, energy balances, mass balances, and the effect of entrainment of oxygen carriers in the freeboard region, which improves overall fuel combustion efficiency and solid conversion. They also studied the effects of mass transfer, oxygen carrier entrainment, and bubble size on the performance of the CL reducer. They found that smaller bubbles are more desirable to increase fuel combustion efficiency. Morgado et al. (2017) developed an FBR model for comparison of CH4 conversion, H2 production, the drop in temperature, and length of reactor for CLR and GSR. This model employed perfect phenomenological closures for the turbulent and fast fluidization regimes and for the bubbling phenomenon. Simulations were carried out to examine the degree of OTM consumption, which is considered to be an important process variable. According to the authors, GSR is more suitable for pure H2 production with integrated CO2 capture and CLR for power generation. Diglio et al. (2016) presented work on the numerical analysis of an ATR in a PBR with NiO as the catalyst and CH4 as fuel. They theoretically quantified the challenges, such as the choice of the duration of the oxidation and reduction phases, the startup temperature, and the cycle design, through numerical simulation. They concluded that suitable choices of duration for the reduction and oxidation phases and of initial temperature are essential requirements for the performance of the CLR process. Singhal et al. (2017) proposed a multiscale model of a packed bed CLR. They presented a comparison of two reactive flows at two different scales: 1) a particle-resolved direct numerical simulation, and 2) a 1D packed bed model. According to their findings, in order to utilize the model to improve an industrial-scale model, the volume of gas generated by the SMR reaction, reactant diffusion within the particles, and clear reaction order in equilibrium conditions are required.
Chenlong et al. (2019) investigated the CLR process of acetic acid by using Fe-doped LaNiO3 perovskites with different Ni-to-Fe ratios. They found that Ni/Fe perovskites were more stable than LaNiO3 perovskites, although LaNiO3 showed more activity in gas production. Minbeom et al. (Lee et al., 2020) studied the effect of transition metals at B-sites (B = Fe, Ni, Mn) of LaCoO3 on CL-SMR. According to their findings, Fe showed more selective oxidation of methane to syngas, the highest H2 purity, and the greatest extent of steam regeneration. Dragomir et al. (Bukur et al., 2019) investigated the redox properties of two Ni-based oxygen carriers, namely, Al and Zr. During the CLR process for successive cycles, with the help of a thermogravimetric analyzer and an in situ magnetometer, they found that a high degree of redox activity was seen during cyclic study of CL-SMR using the Zr-supported oxygen carrier than using the Al-supported oxygen carrier, and that the degree of redox activity increased gradually with the number of cycles. On the other hand, they observed moderate crystalline growth during Al use, while there was a decrease in crystalline size during the use of Zr.
Mathematical modeling of various sub-models, such as AR (oxidation of catalyst), FR (SMR with reduction of catalyst), and the WGS reaction of the CL-SMR process, has been reported on in the literature. However, to the best of the authors’ knowledge, model-based study of CL-SMR with NiO as a catalyst in a PBR at low pressure and with different OTM particle diameters has not yet been considered. Therefore, in this work, we considered a 1D mathematical model of the CL-SMR process in a PBR with NiO as a catalyst at low pressure (1 bar). For the implementation of the model and to determine the effects of various operating conditions, parameters such as temperature, pressure, gas mass flow velocity, void fraction, and particle diameter were considered.
3 Methodology
In this section, a one-dimensional heterogenous model is considered in order to understand the behavior of the physicochemical processes involved in CL-SMR; the material balance and energy balance in the gaseous and solid phases are implemented along with the model assumptions. Subsequently, a thermodynamic analysis is considered in order to determine the optimum operational conditions. Finally, the implementation of model in gPROMS, along with boundary and initial conditions, is discussed.
In the implementation of the model, the following assumptions have been adopted, in consideration of work by Abbas et al. (2017):
a) The reactor is operating under adiabatic conditions, with no heat entering or leaving the system. The main purpose of assuming the system to be adiabatic is to study the behavior of the temperature within the reactor under different conditions.
b) This model is applicable for ideal behavior, because the gases used in the system are considered to be ideal gases and equation used for these gases is the ideal gas equation.
c) Temperature change in the catalyst is not considered, as the changes within the catalyst are negligible and to consider these would makes the model very complex and sensitive. Due to this sensitivity, it would be very difficult to study the model under different operating conditions.
d) In the reactor, the plug flow pattern of gases and the temperature and concentration gradients along the length of the reactor are considered. In comparison to the axial direction, negligible changes in temperature and concentration are observed in the radial direction.
The model equations consist of equations representing material and energy balance for the gaseous phase (Eqs. 1, 2) and the solid phase (Eqs. 3, 4), and the pressure drop (Eq. 5).
The supporting equations required for the calculation of the physical property terms used in mathematical model Eqs. 1–3 and Eq. 4 to Eq. 5 are provided in Supplementary Table SA; these include the dispersion coefficient (Supplementary Equation SA1), thermal conductivities (Supplementary Equations SA1, SA3), the mass transfer coefficient along with its supportive dimensionless numbers (Supplementary Equations SA1–SA7), and the heat transfer coefficient along with its supportive dimensionless number (Supplementary Equations SA8–SA11).
Additionally, the material balance for the chemical reactions (Supplementary Equations SB1–SB4) involves oxygen transfer material, as expressed by Eqs. 6, 7. It is important to mention that, in order to reduce the complexity of the model, only major chemical reactions are considered; minor or side reactions, such as methane decomposition, carbon gasification with steam, and dry methane reforming, have been neglected. With this assumption, the overall model-based results still represent the real process with error below 1% (Rasheed et al., 2019).
In Eqs. 6, 7, R1 to R4 represent the reaction rate of the chemical reaction Supplementary Equations SB1–SB4, respectively. The required reaction rate equations for R1 (Supplementary Equation SB1), R2 (Supplementary Equation SB2), R3 (Supplementary Equation SB3), and R4 (Supplementary Equation SB4) are provided in Supplementary Appendix SB.
3.1 Implementation of the model
For prediction of the behavior of the reactors (fuel and air) shown in Figure 1, the differential and algebraic equations, along with boundary and initial conditions, were implemented in gPROMS Model Builder 4.1.0®. The initial and boundary conditions used in solving model equations 12 to 18 are provided in Table 1. The first-order BFDM was used to solve Eqs. 12–18, A.1 to A.11 (Supplementary Appendix SA), and B.1 to B.14 (Supplementary Appendix SB).
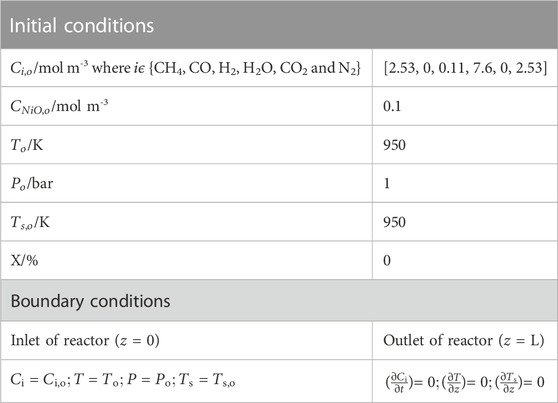
TABLE 1. Initial and boundary conditions required for modeling of Chemical Looping Steam methane reforming (CL-SMR).
From Supplementary Appendix SB, it can be seen that initially (at t = 0), there is no trace of gaseous stream present in the reactor, but a small amount of H2 has been considered, because with a zero value the rate of reaction of the reforming reactions (equations B.5 to B.7) becomes infinite due to the denominator term in the rate equation; therefore, a minute quantity of H2 has been fed into the reactor along with the reactant concentration in order to simulate the reactor model thoroughly, as listed in Table 2. Additionally, the parameters required to simulate the model in gPROMS are provided in Table 2.
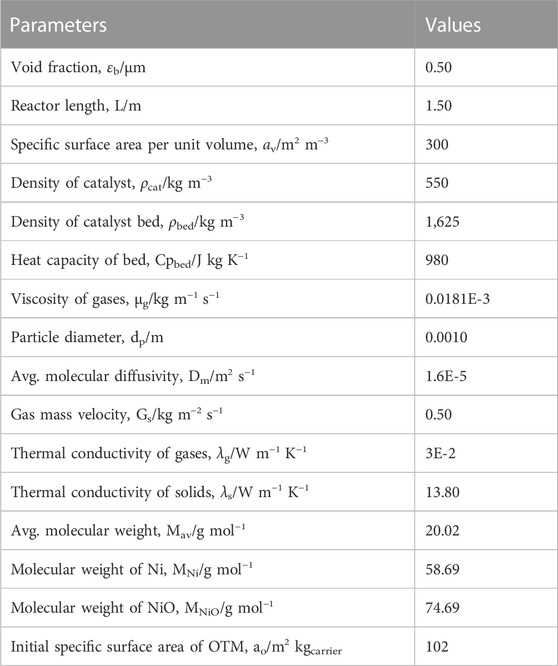
TABLE 2. Parameters used in the implementation of CL-SMR model (Abbas et al., 2017).
4 Thermodynamic analysis of CL-SMR
To determine the optimum operational conditions of the CL-SMR process, thermodynamic analysis needs to be carried out under equilibrium conditions. In this section, the Chemical Equilibrium Application (CEA) software is used to generate the results for the equilibrium conditions.
Minimization of Gibbs free energy is the basis of the CEA software (Rydén et al., 2009). The gases species H2, H2O, CO, CO2, CH4, O2, N2, Ni, and NiO were considered in implementation of the thermodynamic analysis in CEA. The stoichiometric molar balance of N2 was used for calculation of the equilibrium output of each component, which further assisted in the determination of the total product moles at equilibrium. The effects of pressure and temperature on XCH4, H2 purity, and H2 yield were examined under equilibrium conditions with the help of CEA and the built model (Eqs. 1–7; Supplementary Appendix SA, Supplementary Equations S1–S11; Supplementary Appendix SB, Supplementary Equations B1–B14). Eqs. 8–10 were used for calculation of the fraction of
The performance of CL-SMR for a steam-to-carbon (S/C) molar ratio of 3 and an NiO/C ratio of 1/1 was examined to determine the effect of temperature between 600 and 1,000 K and the effect of pressure between 1 and 5 bar under equilibrium conditions with the help of CEA.
4.1 Outputs of chemical equilibrium of CL-SMR
The effects of temperature and pressure on

FIGURE 2. Thermodynamic analysis of the CL-SMR process at 1 bar, S/C M ratio of 3, and NiO-to-C molar ratio of 1/1, indicating the effect of temperature on (A) XCH4, (B) H2 purity, and (C) H2 yield.

FIGURE 3. Thermodynamic analysis of the CL-SMR process at 950 K, S/C M ratio of 3, and NiO-to-C molar ratio of 1/1, indicating the effect of pressure on (A) XCH4, (B) H2-purity, and (C) H2-yield.
The results for
Figure 3 shows the effects of varying pressure between 1 and 5 bar. The operating conditions for the equilibrium study of CL-SMR of 950 K, an S/C M ratio of 3, and an NiO-to-C of 1/1 are maintained. It can be seen that with the rise in the operating pressure from 1 to 5 bar the values for CH4 conversion, H2 purity, and H2 yield decrease from 99.2% to 86.6%, 76.5% to 61.3%, and 32.6% to 27.5%, respectively. Therefore, it can be concluded that, under the conditions implemented, the most suitable operating pressure for the CL-SMR process is 1 bar. The average difference calculated were 7.7% for XCH4, 4.52% for H2 purity, and 0.85% for H2 yield.
As the CEA values are based on equilibrium conditions, the model values should not be higher than those generated using CEA. Comparing the results of both studies, CEA and model-based, it can be observed from Figures 2, 3 that the model-based study values did not exceed the equilibrium values of the CEA results, falling below them in all cases; this is acceptable and proves the correctness of the model.
5 Results and discussion
In this section, the developed models of the FR and AR are first validated with experimental results given in the literature. Subsequently, a cyclic study of the CL-SMR process is conducted and the behavior of the gases and OTM is observed for 10 cycles. Finally, sensitivity analyses are performed for the variables CNiO, Gs, and dp.
5.1 Validation of the model
This section describes the validation of the model of the CL-SMR process. Validation is performed in two steps: first, the FR model results are discussed and validated in connection with experimental results found in the literature. Subsequently, validation of the AR model is performed separately.
5.1.1 Fuel reactor
To authenticate the developed model of the fuel reactor (FR) considered in CL-SMR, the work of Pooya et al. (Azadi et al., 2011) is used. Pooya et al. considered 10% NiO as the OTM in an adiabatic packed bed reactor of length 60 cm and 10 cm internal diameter. The operational conditions of 973 K and 1 bar along, with 5% CH4 and 10% H2O in N2 feed gas, are considered for model validation. The mole fractions of gases in dry conditions obtained from experimental and model-based works are given in Figure 4. It is important to mention that during the experimental study (Azadi et al., 2011), a delay of 30 min was observed by Pooya et al. at beginning of the experiment. Essentially, this time delay was due to the induction period of gases in the reformer. However, for model validation, this experimental time delay has been neglected, as induction period was not considered, and values are adjusted accordingly.

FIGURE 4. Dry mole fraction of outlet gases,
In Figure 4, it can be seen that initially variation can be observed at the start of the model-based results, which is essentially due to the occurrence of reduction and SMR reactions. Once the reactions proceed, within less than 2 min, methane conversion approaches 100%, and the mole fraction of H2 increases from 0% to 77% and subsequently remains constant throughout the process. The average differences between model and experimental values for CH4, CO, H2, and CO2 are 0.9%, 0.7%, 2.7%, and 4.8%, respectively. Based on the trends, it can be determined that model-based results are in good accordance with the experimental values for the stable range of 11 min onward. However, due to the unavailability of experimental data for the time interval between 0 and 11 min, the dynamic response occurring in the experimental work cannot be compared.
5.1.2 Air reactor
The experimental work by Monnerat et al. (2003) used for the validation of the model in terms of OTM in the air reactor. An adiabatic packed bed reactor of length 230 mm and internal diameter 9 mm was used for oxidation of the catalyst. First, the temperature profiles from the model-based and experimental work are compared for operational pressure 1.5 bar and 10% O2 in feed gas; see Figure 5A. Subsequently, 10% O2 feed intake under temperature and pressure conditions of 773 K and 1.5 bar is considered; see Figure 5B.
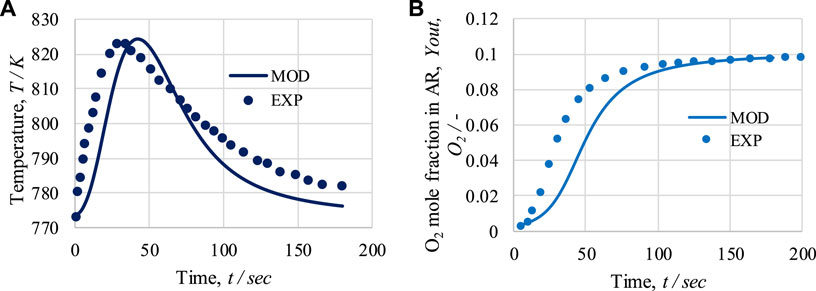
FIGURE 5. For the air reactor: (A) temperature profile at 1.5 bar and 10 mol% of O2 in feed; (B) O2 mole fraction at the outlet for 773 K, 1.5 bar, and 10 mol% of O2 in feed. Solid lines represent modeling (MOD) results; markers represent experimental (EXP) results.
As shown in Figure 5A, a rapid initial increase in temperature is observed due to the exothermic nature of the oxidation process; specifically, at the beginning of the process, all the Ni is available for oxidation. After 45 s, a decrease in temperature is observed due to the decrease in the Ni concentration. From the initial temperature of 773 K, a maximum temperature rise of 51 K is observed in the model-based work, whereas in the experimental study, a 51 K rise is observed. After 180 s of operation, the temperature reaches 776 K or 781 K in the model-based and experimental studies, respectively. The average temperature difference between the model and experimental results is 5.6 K. As shown in Figures 5A, B sudden initial rise in the amount of O2 at exit of the AR occurs until 70 s. After that, the slope in the curve representing the amount of O2 at exit of the AR decreases, becoming a horizontal straight line until 200 s. After 75 s of operation, the dry mole fraction of O2 at exit of the AR reaches 0.085 or 0.071 in the model-based and experimental results, respectively. The average difference in the O2 mole fraction between the model and experimental results is 0.012. Overall, based on the figure, it can be seen that the model results are in good agreement with the experimental work.
5.2 Cyclic study of the CL-SMR process
The optimum operating conditions have already been determined by the thermodynamic analysis using CEA for the cyclic study of the CL-SMR process, as shown in Figure 1. In the FR in CL-SMR, a feed consisting of CH4 gas, steam, and N2 is introduced at 950 K, at 1 bar, and with a steam-to-carbon (S/C) molar ratio of 3/1. As shown in Figure 6, it can be observed that with entrance of the feed into the fuel reactor (FR), an immediate decrease in temperature is observed, specifically, a drop of approximately 11 K within 10 s. This decrease in temperature is due to the dominance of the endothermic nature of the reduction reaction. Subsequently, between 10 and 50 s, a further drop in temperature of 5 K is observed; in this phase, the chemical reactions, which are exothermic in nature, show their dominance along with the reduction reactions. Within less than a minute (50 s), almost 95% of the NiO is converted into Ni, catalyzing the SMR reaction. Within another minute (specifically, between 50 and 110 s), the temperature further drops; specifically, it falls by more than 10 times (from 933 to 775 K). This drop is due to the dominance of the SMR reaction, which is highly endothermic in nature. Subsequently, a rise in the temperature of the process from 775 to 803 K is observed; this rise is due to the exothermic nature of the WGS reaction. After 190 s, an overall drop in NiO % conversion and temperature can be observed; these fall by approximately 99.5% and 146 K, respectively. The yellow dot in Figure 6 indicates the end of the fuel reactor cycle, and from here onward, the air reactor cycle begins.
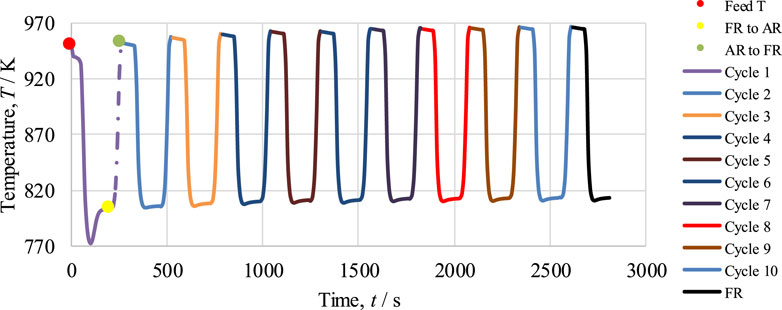
FIGURE 6. Cyclic study of the CL-SMR process for 10 cycles. The red dot indicates the start of the fuel reactor (FR) cycle; the yellow dot indicates the end of the FR cycle and start of the in reactor (AR) cycle; and the green dot indicates the end of the AR cycle.
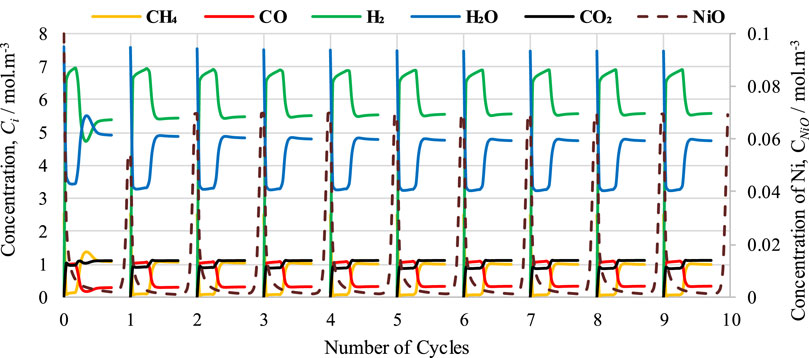
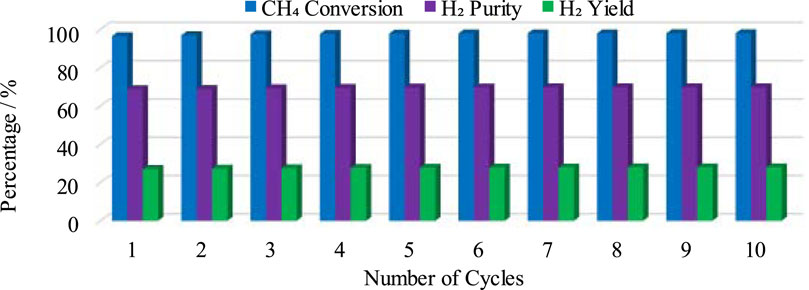
In the second part of CL-SMR, the reduced Ni is transferred into the air reactor (AR) for oxidation by injection of air (21% O2 and 79% N2) at 1 bar and 804 K. As soon as the feed has passed through the reactor, the temperature of the reactor increases from 804 to 952 K within 70 s. Subsequently, the temperature of the air reactor (AR) starts decreasing due to the decrease in the concentration of available Ni for oxidation. For reduction reaction and SMR reaction, a higher temperature is needed in the fuel reactor (FR), so the oxidation process stops when the temperature reaches 952 K. Subsequently, the feed is turned off for the AR and turned on for the FR. The green dot indicates the completion of the AR cycle, as well as the combined completion of the AR and FR cycles; see Figure 6. The FR and AR cycles together form a complete CL-SMR cycle. The CL-SMR process was studied for ten cycles. The behavior and concentrations of gases (CH4, CO, CO2, H2, H2O, and NiO) during these ten cycles are shown in Figure 7. Each cycle of CL-SMR took 280 s to complete (see Figure 6). In the initial two cycles of the CL-SMR process, these is some variation in the outlet concentrations of gases and OTM. After this point, the variation in the concentrations of gases disappears as the number of cycles increases and the process moves toward the steady state. Values for XCH4, H2 purity, and H2 yield for this ten-cycle study are presented in Figure 8. In every cycle, 97.5% CH4 conversion, 69% H2 purity, and an overall H2 yield of 27.5% were achieved.
5.2.1 Comparison of outlet concentrations and reaction rates during cycles 1 and 2
The outlet concentrations of gases during cycles 1 and 2 are shown in Figure 9. In the pre-breakthrough period, both the cycles show the same kind of variation in the outlet concentrations of gases. However, during the breakthrough period (i.e., from 70 s to 110 s), both the figures show differences in the variation in the outlet concentrations of gases, mainly for H2 and H2O. After 100 s, the concentrations of H2 and H2O during cycle 1 are 4.77 mol·m−3 and 5.49 mol·m−3, respectively, while during cycle 2, the concentrations of H2 and H2O are 5.56 mol·m−3 and 4.73 mol·m−3, respectively; this inconsistency is due to the difference in temperature drop between the cycles. In Figure 6, it can be seen that after 100 s of operation, the temperature drops to 772 K in cycle 1 and 804 K in cycle 2. This difference of 32 K is the main reason for the difference in the variation in the outlet concentration of gases, because the optimum temperature range for the SMR reaction is 900–1,100 K. As shown in Figures 9A, B, it can be observed that in the pre-breakthrough period, a drop of 2.44 mol·m−3 and 3.9 mol·m−3 (cycle 1) and 2.442 mol·m−3 and 4.3 mol·m−3 (cycle 2) occurs in the concentration of CH4 and H2O, respectively. In contrast, a rise of 6.59, 0.97, and 0.98 mol·m−3 (cycle 1) and 6.61, 1.03, and 0.92 mol·m−3 (cycle 2) can be observed in the concentration of H2, CO, and CO2, respectively.
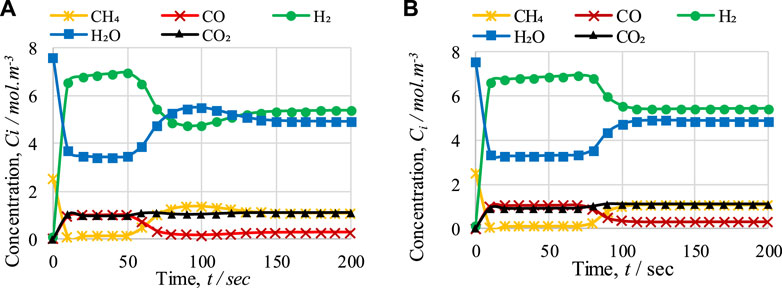
FIGURE 9. Comparison of FR outlet concentrations of gases with respect to time during (A) cycle 1 and (B) cycle 2 of CL-SMR.
Figure 10 shows the rate of reactions for cycle 1 and cycle 2. This graph indicates that the reduction reactions are so fast that they show variation in the reaction rate within the first 20 s of the process, and convert all the NiO into Ni. The drop and rise in the concentrations of gases during first the 20 s is due to the activation of reduction reactions; in these reactions, NiO reacts with CH4 to form H2, CO, and CO2. A decrease in CH4 concentration and increases in H2, CO, and CO2 concentration can be observed. Subsequently, until 60 s, the change in gas concentrations remains constant; at this point, the pre-breakthrough period ends and the breakthrough period begins. Unlike the pre-breakthrough period, during the breakthrough period the concentrations of CH4 and H2O increase, whereas the concentration of H2 decreases. This large change in concentration is due to the activation of the SMR reaction, which is highly endothermic. The SMR reaction is more dominant than the other two reactions (WGS and overall SMR) here. This change in reaction rate also indicates the reason for the change in concentrations of outlet gases from the FR.
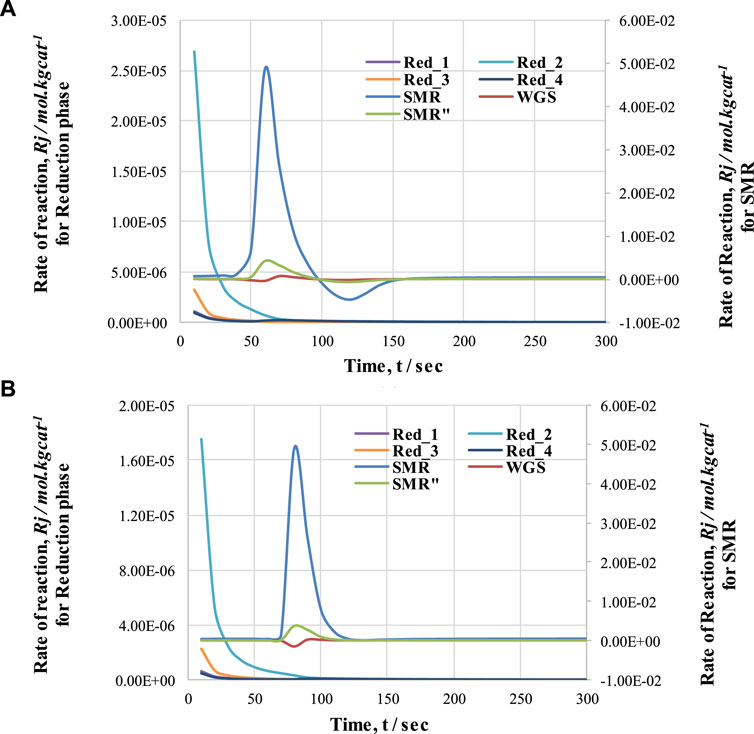
FIGURE 10. Comparison of rate of reactions (SMR and reduction) with respect to time during (A) cycle 1 and (B) cycle 2 of CL-SMR.
5.3 Sensitivity analysis
In this section, a sensitivity analysis is carried out by observing the impact of concentration of NiO (CNiO) and gas mass velocity (Gs) on the temperature profile of the CL-SMR process, as well as the impact of particle diameter (dP) and reactor length L on CH4 conversion, H2 purity, and H2 yield.
5.3.1 Effect of CNiO and Gs
The effects of NiO concentration (CNiO) and Gs on the temperature of the fuel reactor (FR) were studied; the results are presented in Figures 11A, B, respectively. In Figure 11A, it can be seen that with a rise in the NiO concentration, the duration of the pre-breakthrough period increases because of the greater amount of NiO available for reduction reactions, but the drop in temperature decreases, e.g., from 155 to 24 K for a change in NiO concentration in the FR from 0.1 to 1 mol·m−3. The reduction in the temperature drop is due to the smaller amount of CH4 available for the SMR reaction, which is highly endothermic in nature, as more CH4 is consumed during the reduction reactions because of the larger amount of NiO. In contrast, in Figure 11B, it can be seen that with an increase in the value of Gs from 0.5 to 0.9 kg m−2 s−1, the duration of the pre-breakthrough period decreases, as the reactants remain lower in the reactor at the higher value of Gs. With an increase in Gs, the drop in temperature increases from 150 to 190 K. This is because the availability of gas for the SMR reaction per unit area and time is enhanced with the increase in Gs, and so the temperature drop also increases. Similarly, at lower values of Gs, more CH4 is consumed before the breakthrough period in the reduction reaction and less CH4 is available for the SMR reaction, which reduces the temperature drop during the breakthrough period.
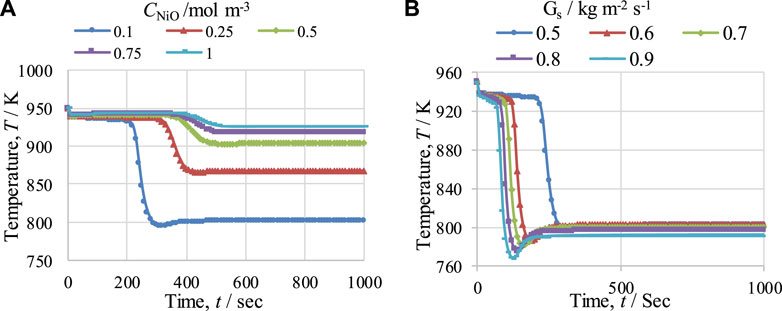
FIGURE 11. Temperature profiles for the fuel reactor (FR) at 950 K, at 1 bar, and with a steam-to-carbon molar ratio of 3, showing the effects of (A) NiO concentration (CNiO) and (B) gas mass flow velocity (Gs).
5.3.2 Effect of particle diameter
The effect of OTM particle diameter was studied to observe the overall performance of the CL-SMR process. The operating conditions of 950 K, 1 bar, and an S/C M ratio of 3 were maintained. The values of XCH4, H2 purity, and H2-yield, for particle diameters ranging from 0.7 to 1 mm, are presented in Figure 12. A decrease in XCH4 from 81% to 63% is observed as the diameter of the particles increases from 0.7 to 1 mm; see Figure 12A. Similarly, a minor decrease in H2 purity (see Figure 12B) from 71% to 69% is also observed with this increase in the OTM particle diameter. This is because, with an increase in the size of OTM particles, less surface area is available to the gases for reaction, and therefore reductions in CH4 conversion and H2 purity is detected. The size of the OTM particle is inversely proportional to CH4 conversion and H2 purity. On the other hand, H2 yield in the CL-SMR process increases from 15.5% to 25% (see Figure 12C) with the increase in particle diameter from 0.7 to 1 mm. This increase in H2 yield is due to more formation of H2 per unit mole of CH4 entering the reactor. However, in the reactor, the variation in XCH4, H2 purity, and H2-yield over time directly relates to the temperature variation.
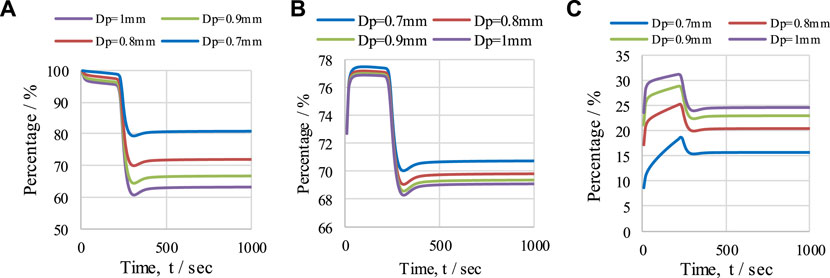
FIGURE 12. The effect of OTM particle diameter (0.7–1 mm) under operating conditions of 950 K, with S/C M ratio of 3, on (A) XCH4, (B) H2 purity, and (C) H2 yield. Effect of reactor length (L) on temperature (T) profile.
5.3.3 Effect of Reactor Length (L) on Temperature (T) profile
The effect of FR length on temperature variation in the reactor at pressure of 1 bar, a temperature of 950K, and with an S/C ratio of 3 over a given period of time is presented in Figure 13. The behavior of the temperature profile in the reactor was examined for three different lengths of reactor (namely, 0.5 m, 1 m, and 1.5 m). From the graph, it can be seen that with an increase in the length of the FR, a delay in the temperature drop is observed, while the temperature profiles were almost identical for all lengths of reactor. This delay in temperature drop is because of the time taken to consume the oxygen carrier during the reduction reaction in the reactor: as the length of the reactor increases, the length of the bed of OTM also increases. The maximum temperature drops for 0.5 m, 1 m, and 1.5 m length are 163 K, 157 K, and 152 K, respectively; similarly, the amounts of time taken to reach the steady state are 200 s, 300 s, and 400 s, respectively, as shown in the figure.
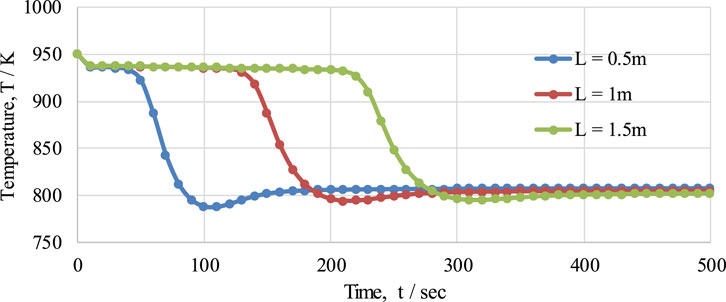
FIGURE 13. The effect of different fuel reactor lengths (0.5 m, 1 m, and 1.5 m) on the temperature profile of the fuel reactor in the CL-SMR process.
6 Conclusion and outlook
A one-dimensional simulation of a heterogenous catalytic CL-SMR process in an adiabatic PBR, at low pressure, was conducted in gPROMS Model Builder®. First, a thermodynamic analysis of the process was carried out, using CEA, to identify the optimum temperature (950 K) and pressure (1 bar) conditions for the CL-SMR process at an S/C M ratio of 3. Next, the effects of temperature and pressure on XCH4, H2 yield, and H2 purity in the CL-SMR process were studied at equilibrium conditions; the findings were compared with the results of the validated model. The effects of increasing temperature (from 600 to 1000 K) and pressure (from 1 to 5 bar) on XCH4, H2 yield, and H2 purity in the CL-SMR process were positive and negative, respectively. This adiabatic model of the CL-SMR process was run for 10 cycles. It was observed that during each cycle the changes in the values of XCH4, H2 purity, and H2 yield were negligible.
The effect of reaction rate, along with a comparison of the first two cycles of CL-SMR, were also presented. The behavior of temperature in the FR was examined for different values of Gs (0.5–0.9 kg m−2 s−1) and CNiO (0.1–1 mol m−3). It was concluded that, with an increase in the value of Gs, the delay in the temperature drop or the duration of pre-breakthrough period was decreased. An increase in the concentration of NiO was found to reduce the temperature drop in the FR. The effect of OTM particle diameter on CL-SMR performance was also studied. It was concluded that, with decrease in particle size from 1 to 0.7 mm, there was an increase in XCH4 and H2 purity, but a decrease in H2 yield. Finally, the effect of reactor length on the temperature variation profile within the fuel reactor was also studied, with three different lengths examined (0.5 m, 1 m, and 1.5 m). With an increase in the length of the FR, a delay in the temperature drop and activation of the SMR was observed, while the behavior of the temperature profile remained the same for each length. From this study, it can be concluded that the model developed here is effective and that the process runs at optimum temperature and pressure values for 10 cycles without any change in OTM concentration or products.
Data availability statement
The original contributions presented in the study are included in the article/Supplementary Material, further inquiries can be directed to the corresponding author.
Author contributions
HQ: Conceptualization, Investigation, Methodology, Writing–original draft. IC: Data curation, Formal Analysis, Investigation, Visualization, Writing–review and editing. MoA: Data curation, Software, Validation, Visualization, Writing–review and editing. MuA: Data curation, Methodology, Validation, Visualization, Writing–review and editing. IK: Data curation, Formal Analysis, Validation, Visualization, Writing–review and editing. E-JL: Project administration, Resources, Supervision, Writing–review and editing. KL: Funding acquisition, Project administration, Supervision, Writing–review and editing.
Funding
The authors declare that no financial support was received for the research, authorship, and/or publication of this article.
Acknowledgments
We are thankful to Dr. Zaheer Abbas at the University of Manchester, United Kingdom, for providing us with remote access to the license of gPROMS Model Builder 4.1.0®.
Conflict of interest
The authors declare that the research was conducted in the absence of any commercial or financial relationships that could be construed as a potential conflict of interest.
Publisher’s note
All claims expressed in this article are solely those of the authors and do not necessarily represent those of their affiliated organizations, or those of the publisher, the editors and the reviewers. Any product that may be evaluated in this article, or claim that may be made by its manufacturer, is not guaranteed or endorsed by the publisher.
Supplementary material
The Supplementary Material for this article can be found online at: https://www.frontiersin.org/articles/10.3389/fchem.2023.1295455/full#supplementary-material
References
Abbas, S. Z., Dupont, V., and Mahmud, T. (2017). Modelling of high purity H2 production via sorption enhanced chemical looping steam reforming of methane in a packed bed reactor. Fuel 202, 271–286. doi:10.1016/j.fuel.2017.03.072
Adams, T. A., and Barton, P. I. (2009). A dynamic two-dimensional heterogeneous model for water gas shift reactors. Int. J. Hydrogen Energy 34, 8877–8891. doi:10.1016/j.ijhydene.2009.08.045
Azadi, P., Otomo, J., Hatano, H., Oshima, Y., and Farnood, R. (2011). Interactions of supported nickel and nickel oxide catalysts with methane and steam at high temperatures. Chem. Eng. Sci. 66, 4196–4202. doi:10.1016/j.ces.2011.06.002
Bukur, D. B., Silvester, L., Fischer, N., Claeys, M., and Lemonidou, A. A. (2019). On the use of an in situ magnetometer to study redox and sintering properties of NiO based oxygen carrier materials for chemical looping steam methane reforming. Int. J. Hydrogen Energy 44, 18093–18102. doi:10.1016/j.ijhydene.2019.05.045
Chenlong, L., Sha, L., chen, D., Xiao, Y., Tianle, L., and Wang, W. (2019). Hydrogen-rich syngas production by chemical looping steam reforming of acetic acid as bio-oil model compound over Fe-doped LaNiO3 oxygen carriers, 17732–17741.Hydrogen energy
de Diego, L. F., Ortiz, M., García-Labiano, F., Adánez, J., Abad, A., and Gayán, P. (2009). Hydrogen production by chemical-looping reforming in a circulating fluidized bed reactor using Ni-based oxygen Carriers. J. Power Sources 192, 27–34. doi:10.1016/j.jpowsour.2008.11.038
Diglio, G., Bareschino, P., Mancusi, E., and Pepe, F. (2016). Simulation of hydrogen production through chemical looping reforming process in a packed-bed reactor. Chem. Eng. Res. Des. 105, 137–151. doi:10.1016/j.cherd.2015.11.013
Dueso, C., Ortiz, M., Abad, A., García-Labiano, F., Luis, F., Gayán, P., et al. (2012). Reduction and oxidation kinetics of nickel-based oxygen-carriers for chemical-looping combustion and chemical-looping reforming. Chem. Eng. J. 188, 142–154. doi:10.1016/j.cej.2012.01.124
Dutta, S. (2014). A review on production, storage of hydrogen and its utilization as an energy resource. J. Industrial Eng. Chem. 20, 1148–1156. doi:10.1016/j.jiec.2013.07.037
Edwards, M., and Richardson, J. (1968). Gas dispersion in packed beds. Chem. Eng. Sci. 23, 109–123. doi:10.1016/0009-2509(68)87056-3
Fan, J., Zhu, J., Jiang, L., Li, P., and Liu, H. (2016). Comparative exergy analysis of chemical looping combustion thermally coupled and conventional steam methane reforming for hydrogen production. J. Clean. Prod. 131, 247–258. doi:10.1016/j.jclepro.2016.05.040
Garcia-Labiano, F., de Diego, L. F., Gayan, P., Adanez, J., Abad, A., and Dueso, C. (2009). Effect of fuel gas composition in chemical-looping combustion with Ni-based oxygen carriers. 1. Fate of sulfur. Ind. Eng. Chem. Res. 48, 2499–2508. doi:10.1021/ie801332z
Ghouse, J. H., and Adams, T. A. (2013). A multi-scale dynamic two-dimensional heterogeneous model for catalytic steam methane reforming reactors. Int. J. Hydrogen Energy 38, 9984–9999. doi:10.1016/j.ijhydene.2013.05.170
Halabi, M., De Croon, M., Van der Schaaf, J., Cobden, P., and Schouten, J. (2008). Modeling and analysis of auto thermal reforming of methane to hydrogen in a fixed bed reformer. Chem. Eng. J. 137, 568–578. doi:10.1016/j.cej.2007.05.019
Handley, D., and Heggs, P. J. (1969). The effect of thermal conductivity of the packing material on transient heat transfer in a fixed bed. Int. J. Heat. Mass Transf. 12, 549–570. doi:10.1016/0017-9310(69)90038-6
Hoang, D. L., and Chan, S. H. (2004). Modeling of a catalytic autothermal methane reformer for fuel cell applications. Appl. Catal. A General 268, 207–216. doi:10.1016/j.apcata.2004.03.056
Ibrahim, Z., Dupont, V., and Mahmud, T. (2018). Steam reforming of shale gas in a packed bed reactor with and without chemical looping using nickel-based oxygen carrier. Int. J. hydrogen energy 43, 6904–6917. doi:10.1016/j.ijhydene.2018.02.083
Iliuta, I., Tahoces, R., Patience, G. S., Rifflart, S., and Luck, F. (2010). Chemical-looping combustion process: kinetics and mathematical modeling. AIChE J. 56, 1063–1079. doi:10.1002/aic.11967
Intergovernmental panel of climate change (IPCC) (2021). The physical science basis. Available at: https://www.ipcc.ch/report/ar6/wg1/downloads/report/IPCC_AR6_WGI_SPM.pdf.
International Energy Agency (2017). International energy outlook. Available at: https://www.eia.gov/outlooks/ieo/pdf/0484(2017).pdf.
International Energy Agency (IEA) (2022). World energy outlook. Available at: https://iea.blob.core.windows.net/assets/830fe099-5530-48f2-a7c1-11f35d510983/WorldEnergyOutlook2022.pdf.
Ishida, M., Zheng, D., and Akehata, T. (1987). Evaluation of a chemical-looping-combustion power-generation system by graphic exergy analysis. Energy 12, 147–154. doi:10.1016/0360-5442(87)90119-8
Jin, G., Li, K., Zhang, L., Luo, Y., Chen, D., and dong He, D. (2023). In situ observation of the promoting effect of H2S on the formation of efficient MoS2 catalyst for CH4/CO2 reforming. Sep. Purif. Technol. 308 (2023), 122883. doi:10.1016/j.seppur.2022.122883
Jin, H., and Ishida, M. (2002). Reactivity study on natural-gas-fueled chemical-looping combustion by a fixed-bed reactor. Industrial Eng. Chem. Res. 41, 4004–4007. doi:10.1021/ie020184l
Johansson, M., Mattisson, T., Lyngfelt, A., and Abad, A. (2008). Using continuous and pulse experiments to compare two promising nickel-based oxygen carriers for use in chemical-looping technologies. Fuel 87, 988–1001. doi:10.1016/j.fuel.2007.08.010
Lee, M., Lim, H. S., Kim, Y., and Lee, J. W. (2020). Enhancement of highly-concentrated hydrogen productivity in chemical looping steam methane reforming using Fe-substituted LaCoO3. Energy Convers. Manag. 207, 112507–118904. doi:10.1016/j.enconman.2020.112507
LeValley, T. L., Richard, A. R., and Fan, M. (2014). The progress in water gas shift and steam reforming hydrogen production technologies–a review. Int. J. hydrogen energy 39, 16983–17000. doi:10.1016/j.ijhydene.2014.08.041
Lewis, W. K., Gilliland, E. R., and Sweeney, W. P. (1951). Gasification of carbon metal oxides in a fluidized power bed. Chem. Eng. Prog. 89, 251–256.
Liu, L., Hong, D., Wang, N., and Guo, X. (2020). High purity H2 production from sorption enhanced bio-ethanol reforming via sol-gel-derived Ni–CaO–Al2O3 bi-functional materials. Int. J. Hydrogen Energy 45, 34449–34460. doi:10.1016/j.ijhydene.2020.02.158
Lu, C., Li, K., Zeng, C., Zhu, X., Wei, Y., Zheng, M., et al. (2018). Chemical looping reforming of methane using magnetite as oxygen carrier: structure evolution and reduction kinetics. Appl. Energy 211, 1–14. doi:10.1016/j.apenergy.2017.11.049
Luo, M., Yi, Y., Wang, S., Wang, Z., Du, M., Pan, J., et al. (2018). Review of hydrogen production using chemical-looping technology. Renew. Sustain. Energy Rev. 81, 3186–3214. doi:10.1016/j.rser.2017.07.007
Lyon, R. K., and Cole, J. A. (2000). Unmixed combustion: an alternative to fire. Combust. Flame 121, 249–261. doi:10.1016/s0010-2180(99)00136-4
Ma, H., Zeng, L., Tian, H., Li, D., Wang, X., Li, X., et al. (2016). Efficient hydrogen production from ethanol steam reforming over La-modified ordered mesoporous Ni-based catalysts. Appl. Catal. B Environ. 181, 321–331. doi:10.1016/j.apcatb.2015.08.019
Mattisson, T., Johansson, M., and Lyngfelt, A. (2006). The use of NiO as an oxygen carrier in chemical-looping combustion. Fuel 85, 736–747. doi:10.1016/j.fuel.2005.07.021
Mattisson, T., and Lyngfelt, A. (2001). Applications of chemical-looping combustion with capture of CO. Second nordic mini symposium on carbon dioxide capture and storage.
Mattisson, T., Zafar, Q., Lyngfelt, A., and Gevert, B. (2004). “Integrated hydrogen and power production from natural gas with CO2 capture”, In Proc 15th World Hydrogen Energy Conf (WHEC), Yokohama: Japan, 3485–3496.
May, L., Da Silveira, I. T., and Vianna, C. (1996). Criteria for the evaluation of damage and remaining life in reformer furnace tubes. Int. J. Press. vessels Pip. 66, 233–241. doi:10.1016/0308-0161(95)00098-4
Monnerat, B., Kiwi-Minsker, L., and Renken, A. (2003). Mathematical modelling of the unsteady-state oxidation of nickel gauze catalysts. Chem. Eng. Sci. 58, 4911–4919. doi:10.1016/j.ces.2002.11.006
Morgado, J. F., Cloete, S., Morud, J., Gurker, T., and Amini, S. (2017). Modelling study of two chemical looping reforming reactor configurations: looping vs. switching. Powder Technol. 316, 599–613. doi:10.1016/j.powtec.2016.11.059
Omoniyi, O. A., and Dupont, V. (2018). Chemical looping steam reforming of acetic acid in a packed bed reactor. Appl. Catal. B Environ. 226, 258–268. doi:10.1016/j.apcatb.2017.12.027
Ortiz, M., de Diego, L. F., Abad, A., García-Labiano, F., Gayán, P., and Adánez, J. (2010). Hydrogen production by auto-thermal chemical-looping reforming in a pressurized fluidized bed reactor using Ni-based oxygen carriers. Int. J. Hydrogen Energy 35, 151–160. doi:10.1016/j.ijhydene.2009.10.068
Pakistan Energy demand forecast (2021). Pakistan Energy demand forecast. IEP report – 1, 2021 https://www.pc.gov.pk/uploads/report/IEP_Report_FINAL.pdf.
Pantoleontos, G., Kikkinides, E. S., and Georgiadis, M. C. (2012). A heterogeneous dynamic model for the simulation and optimisation of the steam methane reforming reactor. Int. J. hydrogen energy 37, 16346–16358. doi:10.1016/j.ijhydene.2012.02.125
Pashchenko, D. (2018). Effect of the geometric dimensionality of computational domain on the results of CFD modelling of steam methane reforming. Int. J. hydrogen energy, 1–12.
Pröll, T., Nordenkampf, J. B., Kolbitsch, P., and Hermann, H. (2010). Syngas and a separate nitrogen/argon stream via chemical looping reforming–A 140 kW pilot plant study. Fuel 89, 1249–1256. doi:10.1016/j.fuel.2009.09.033
Rasheed, A. A., Jalil, A. A., Gambo, Y., Ibrahim, M., Hambali, H. U., and Shahul Hamid, M. Y. (2019). A review on catalyst development for dry reforming of methane to syngas: recent advances. Renew. Sustain. Energy Rev. 108, 175–193. doi:10.1016/j.rser.2019.03.054
Richter, H. J., and Knoche, K. F. (1983). “Reversibility of combustion process,” in Efficiency and costing, second law analysis of process. ACS symposium series. Editor R. A. Gaggioli (Washington DC: American Chemical Society), 235, 71–85.
Rydén, M. (2008). “Hydrogen production with fossil fuels with carbon dioxide capture, using chemical-looping technologies.” PhD Thesis. Göteborg. Sweden: Chalmers University of Technology.
Rydén, M., Lyngfelt, A., and Mattisson, T. (2006). Synthesis gas generation by chemical looping reforming in a continuously operating laboratory reactor. Fuel 85, 1631–1641. doi:10.1016/j.fuel.2006.02.004
Rydén, M., Lyngfelt, A., and Mattisson, T. (2008b). Chemical-looping combustion and chemical-looping reforming in a circulating fluidized-bed reactor using Ni based oxygen carriers. Energ Fuel 28, 2585–2597. doi:10.1021/ef800065m
Rydén, M., Lyngfelt, A., Mattisson, T., Chen, D., Holmen, A., and Bjørgum, E. (2008a). Novel oxygen-carrier materials for chemical-looping combustion and chemical-looping reforming; LaxSr1−xFeyCo1−yO3−δ perovskites and mixed-metal oxides of NiO, Fe2O3 and Mn3O4. Int. J. Greenh. Gas. Control 2, 21–36. doi:10.1016/s1750-5836(07)00107-7
Rydén, M., Lyngfelt, M. J. A., and Mattisson, T. (2009). NiO supported on Mg–ZrO2 as oxygen carrier for chemical-looping combustion and chemical-looping reforming. Energ Environ. Sci. 2, 970–981. doi:10.1039/b904370e
Sharma, S., and Ghoshal, S. K. (2015). Hydrogen the future transportation fuel: from production to applications. Renew. Sustain. energy Rev. 43, 1151–1158. doi:10.1016/j.rser.2014.11.093
Singhal, A., Cloete, S., and Amini, S. (2017). Multiscale modelling of packed bed chemical looping reforming. Energy Procedia 136, 349–355. doi:10.1016/j.egypro.2017.10.287
Stoppacher, B., Bock, S., Malli, K., Lammer, M., and Hacker, V. (2022). The influence of hydrogen sulfide contaminations on hydrogen production in chemical looping processes. Fuel 307 (2021), 121677. doi:10.1016/j.fuel.2021.121677
Xu, J., and Froment, G. F. (1989). Methane steam reforming, methanation and water-gas shift: I. Intrinsic kinetics. AIChE J. 35, 88–96. doi:10.1002/aic.690350109
Yagi, S., Kunii, D., and Wakao, N. (1960). Studies on axial effective thermal conductivities in packed beds. AIChE J. 6, 543–546. doi:10.1002/aic.690060407
Zafar, Q., Mattisson, T., and Gevert, B. (2006). Redox investigation of some oxides of transition-state metals Ni, Cu, Fe, and Mn supported on SiO2 and MgAl2O4. Fuel 20, 34–44. doi:10.1021/ef0501389
Zhang, Y., Zu, Y., dong He, D., Liang, J., Zhu, L., Mei, Y., et al. (2022). The tailored role of “defect” sites on γ-alumina: a key to yield an efficient methane dry reforming catalyst with superior nickel utilization”. Appl. Catal. B Environ. 315 (2022), 121539. doi:10.1016/j.apcatb.2022.121539
Zhou, Z., Han, L., and Bollas, G. M. (2013). Model-based analysis of bench-scale fixed bed units for chemical-looping combustion. Chem. Eng. J. 233, 331–348. doi:10.1016/j.cej.2013.08.025
Zhou, Z., Han, L., and Bollas, G. M. (2015). Model-assisted analysis of fluidized bed chemical-looping reactors. Chem. Eng. Sci. 134, 619–631. doi:10.1016/j.ces.2015.05.037
Nomenclature
Keywords: hydrogen, chemical looping, reforming, energy, gPROMS, methane reforming
Citation: Qayyum H, Cheema II, Abdullah M, Amin M, Khan IA, Lee E-J and Lee KH (2023) One-dimensional modeling of heterogeneous catalytic chemical looping steam methane reforming in an adiabatic packed bed reactor. Front. Chem. 11:1295455. doi: 10.3389/fchem.2023.1295455
Received: 16 September 2023; Accepted: 24 October 2023;
Published: 20 November 2023.
Edited by:
Dedong He, Kunming University of Science and Technology, ChinaReviewed by:
Dingkai Chen, Kunming University of Science and Technology, ChinaChenxi Cao, East China University of Science and Technology, China
Copyright © 2023 Qayyum, Cheema, Abdullah, Amin, Khan, Lee and Lee. This is an open-access article distributed under the terms of the Creative Commons Attribution License (CC BY). The use, distribution or reproduction in other forums is permitted, provided the original author(s) and the copyright owner(s) are credited and that the original publication in this journal is cited, in accordance with accepted academic practice. No use, distribution or reproduction is permitted which does not comply with these terms.
*Correspondence: Kang Hoon Lee, ZGlhc3lvbmc4NkBnbWFpbC5jb20=
 Haris Qayyum
 Izzat Iqbal Cheema1
 Mohsin Abdullah
 Muhammad Amin
 Kang Hoon Lee