 Abdul Rauf Khan
 Ifra Naeem1
 Fairouz Tchier
 Fikadu Tesgera Tolasa
- 1Department of Mathematics, Faculty of Sciences, Ghazi University, Dera Ghazi Khan, Pakistan
- 2Mathematics Department, College of Science, King Saud University, Riyad, Saudi Arabia
- 3Department of Mathematics, Dambidollo University, Oromia, Ethiopia
- 4Energy Engineering Division, Department of Engineering Science and Mathematics, Lulea University of Technology, Lulea, Sweden
Introduction: Pneumonia is the primary cause of mortality in preterm infants in developing nations; yet, early detection and treatment can significantly reduce mortality rates. Pharmaceutical researchers are diligently striving to identify avariety of drugs that might effectively cure pneumonia.
Method: We are motivated to examine the quantitative structureproperty relationships (QSPR) of anti-pneumonia pharmaceuticals. We employed K-Banhatti topological descriptors and analyzed the findings to achieve this. For estimation of physicochemical properties of pneumonia treatment drugs we utilized linear, quadratic, cubic, and biquadratic regression analyses.
Results and Conclusion: The drugs comprise linezolid, ceftabiprole, and clarithromycin, among others. Topological descriptors enable the exploration of the complexity, connectivity, and other essential attributes of molecules. The quantitative structure-property relationship (QSPR) analysis of pharmaceuticals for illness treatment employing K-Banhatti topological descriptors is an economical approach utilised by pharmaceutical researchers. We performed a QSPR analysis on 20 anti-pneumonia drugs to ascertain the most precise predictions for five properties: enthalpy, flash point, molecular weight, molar volume, and molar refractivity, employing five K-Banhatti indices. To do this, we used linear, quadratic, cubic, and biquadratic regression analyses to find links between molecules and the physical and chemical properties of drugs used to treat pneumonia. Employing molecular descriptors and regression models to investigate chemical patterns is a cost-effective and theoretical methodology.
1 Introduction
Pneumonia is an infectious disease and is frequently induced by bacterial, viral, or fungal infections that specifically affect the lungs, leading to inflammation of the alveoli (Scotta et al., 2019). Common bacterial agents include Streptococcus pneumoniae and Haemophilus influenzae, while viral agents may include the influenza virus, respiratory syncytial virus (RSV), and coronaviruses (Marangu and Zar, 2019). Pneumonia transmission occurs via inhalation of airborne droplets from coughs or sneezes, direct contact with infected individuals, or by touching contaminated objects and then contacting the face.
Each year, around two million children under 5 years old succumb to pneumonia in developing countries, primarily due to infections caused by streptococcus or the influenza virus (Singh and Aneja, 2011; Leung et al., 2018). Pneumonia ranks among the primary causes of mortality and morbidity in children globally. Pneumonia is a sudden respiratory infection caused by various organisms, impacting management strategies in the developing world (Shann, 1995). Lungs exhibit swelling of the airway sacs and pleural effusion, which occurs when the lung is infiltrated with fluid. Pneumonia impacts 10 to 15 percent of children with respiratory issues. Underdeveloped and rising nations are predisposed to elevated pneumonia rates due to factors such as overcrowding, pollution, unsanitary environmental conditions, and restricted access to healthcare (Wojsyk-Banaszak and Breeborowicz, 2013; Wardlaw et al., 2006).
Pneumonia in toddlers under the age of two is especially perilous. The lack of adequate immunizations and limited access to healthcare services in several impoverished communities in developing and underdeveloped nations results in undetected pneumonia, thereby exacerbating respiratory conditions (Rudan et al., 2004). Over the past 10 years, the number of cases and severity of pneumonia in children, as well as their death rates, have gone down significantly. This is because the economy is better, care is better, more effective treatment and prevention strategies are used, and more vaccinations are made available, especially the combination vaccines against pneumococcal disease (PCV) and hepatitis B. Survival rates have markedly improved since the 20th century due to advancements in immunisations and pharmaceuticals (Madhi et al., 2008; Scelfo et al., 2021). Moreover, increasing evidence associates childhood pneumonia and lower respiratory tract infections (LRTIs) with diminished lung capacity in early childhood and an escalation of long-term, latent respiratory conditions in both children and adults, such as asthma and chronic bronchitis (Munywoki et al., 2013). The illness can be classified based on its origin, such as community-acquired or hospital-acquired pneumonia (Venditti et al., 2009).
Pneumonia is treatable with various medications. Potentially appropriate medications include beta-lactams such as penicillin and amoxicillin in combination with a macrolide, or fluoroquinolone antibiotics like Levaquin (Garau, 2005). Macrolide antibiotics, including tetracycline, azithromycin, and clarithromycin, may serve as initial treatment options (Alvarez-Elcoro and Enzler, 1999; Sood, 1999). Adverse events associated with ceftobiprole in patients indicated that the medication demonstrated an acceptable safety profile (Liapikou et al., 2015).
Despite the discovery of antibiotics, the prevalence of pneumonia has likely remained relatively stable over the past century; however, the overall mortality rate has significantly decreased. Determining the responsible pathogen may present challenges. Diagnosis may be confirmed through blood tests, sputum culture, and chest X-rays (Parveen and Sathik, 2011). Symptoms and a physical examination are commonly employed to establish a diagnosis. Potential symptoms include (Harari et al., 1991): Expectoration of greenish or yellow mucus, or potentially bloody mucus, may occur. Productive cough with phlegm production, Dyspnoea, Fever and anorexia. Figure 1 shows the pneumonia infection.
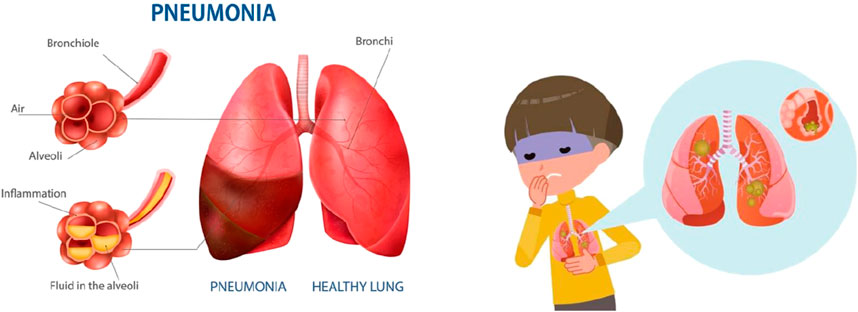
Figure 1. Pneumonia in children.
According to the chemical theory of graphs, atoms are represented as vertices of a graph, and the bonds that bind them together are described as edges (Khan et al., 2024a). A graph
A topological descriptor is a distinctive number that characterizes the intrinsic structure of the molecular graph. In QSPR and QSAR, scientists use numerical parameters from a chemical graph network. Its uses are increasing in medication design. Wiener pioneered the concept of topological descriptors with the distance base topological descriptor (Hayat, 2017). Husin et al. (2015) discuss Zagreb polynomials and topological indices for a synthesized molecule composed of branched units known as monomers. In Vijay et al. (2023), the study focused on the vertex version of the distance-based topological indices, the entropy of the topological indices and their numerical analysis of aluminophosphates. Fathi et al. (2024) examined topological indices based on valency, induced by quantitative structural relationships, to predict the structural properties of Ni tetrathiafulvalene tetrathionate (NiTTFtt) in a 2D sheet configuration.
A molecular structure’s topological index gives numerical values that are useful for property prediction. Topological descriptors are useful tools for researchers who want to figure out the different topological properties of drugs (Hakami et al., 2024), networks (Chu et al., 2023; Khan et al., 2024c), and materials (Imran et al., 2023; Khan et al., 2023b). Numerous researchers have investigated different topological descriptors of material-related networks in Hakami et al. (2025), Khan et al. (2024d), Khan et al. (2024e) and the estimation of physical and chemical properties of various drugs in Husin et al. (2024). Nadeem et al. put forward the QSPR idea on babesiosis drugs (Awan et al., 2025) and antimalarial compounds modeling results depict the clear picture (Awan et al., 2024) said disease efficiently. Fozia made a great contribution to cardiac (Bashir Farooq et al., 2022) drugs and blood cancer (Nasir et al., 2022) and Sobia done QSPR application of infertility Drugs (Sultana, 2023) modeling is done.
2 Material and methodology
The current study examines the following anti-pneumonia drugs: Linezolid
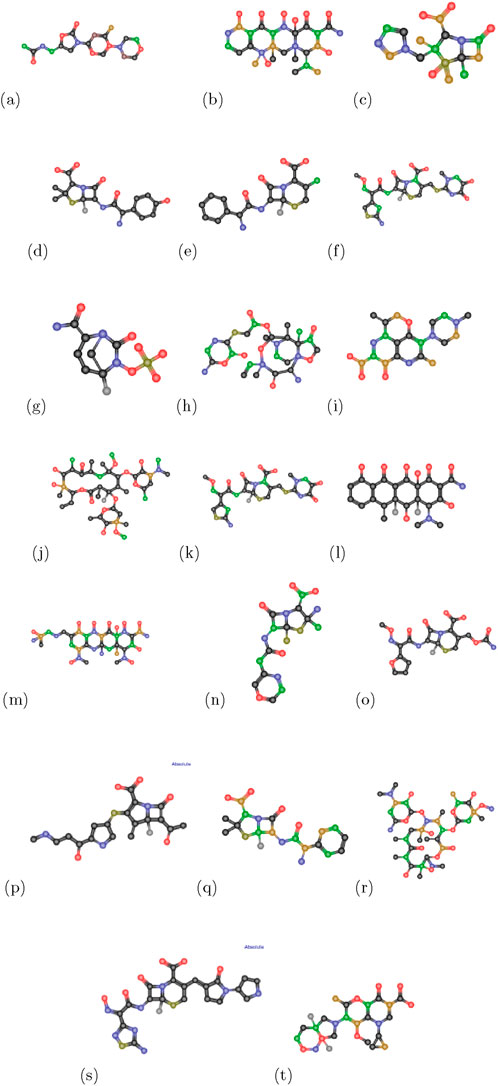
Figure 2. Chemical structures of anti-pneumonia drugs (a) linezolid (b) tetracycline (c) tazobactam (d) amoxicillin (e) cefaclor (f) ceftriaxone (g) avibactam (h) lefamulin (i) levaquine (j) clarithromycin (k) cefpodoxime (l) doxycycline (m) omadacycline (n) penicillin (o) cefuroxime (p) carbapenem (q) unasyn (r) erythromycin (s) ceftabiprole (t) moxifloxacin.
The graph’s greatest and lowest degree can be expressed by
The first
The second
The first Hyper
The second Hyper
The
3 Results
In this study, we compute topological descriptor values using two-dimensional graphs of pneumonia treatment drugs. We used various methods, including edge dividing, vertex degree evaluation, and edge degree methodology, to calculate the
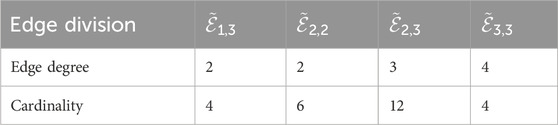
Table 1. Edge division and edge degree of Linezolid.
3.1
The following linezolid results were obtained by utilizing Equations 1–5; Table 1.
• First
• Second
• First Hyper
• Second Hyper
• Harmonic
3.2
The following Unasyn results were obtained by utilizing Equations 1–5; Table 2.
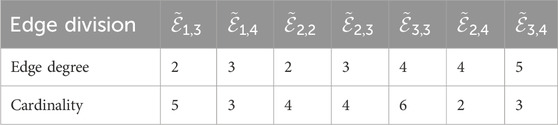
Table 2. Edge division and edge degree of Unasyn.
3.3
The following Cefuroxime results were obtained by utilizing Equations 1–5; Table 3
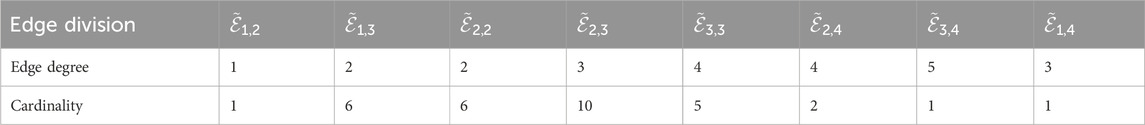
Table 3. Edge division and edge degree of Cefuroxime.
3.4
The following Avibactam results were obtained by utilizing Equations 1–5; Table 4.
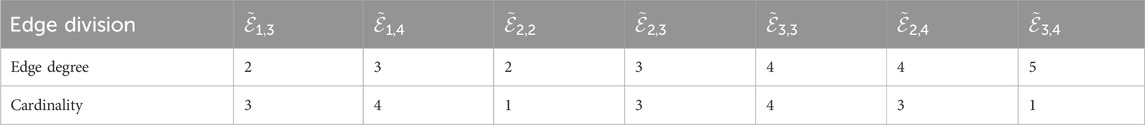
Table 4. Edge division and edge degree of Avibactam.
Remark 1. Other
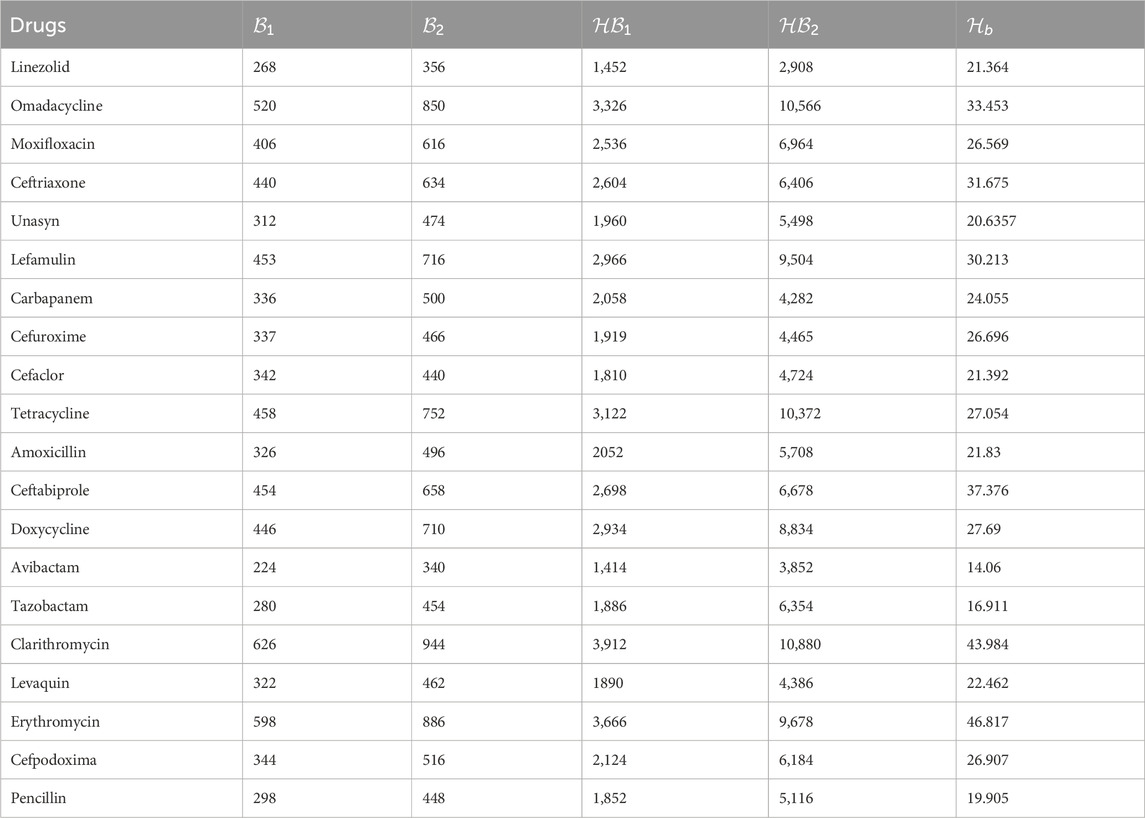
Table 5. Computational values of
4 Quantitative structure-property relation analysis of anti-pneumonia drugs
The QSPR analysis and Topological descriptor exhibit a significant association, indicating a strong connection between the disease’s physical and chemical attributes. To forecast the relationship between a molecule’s structure and its behaviour or characteristics,
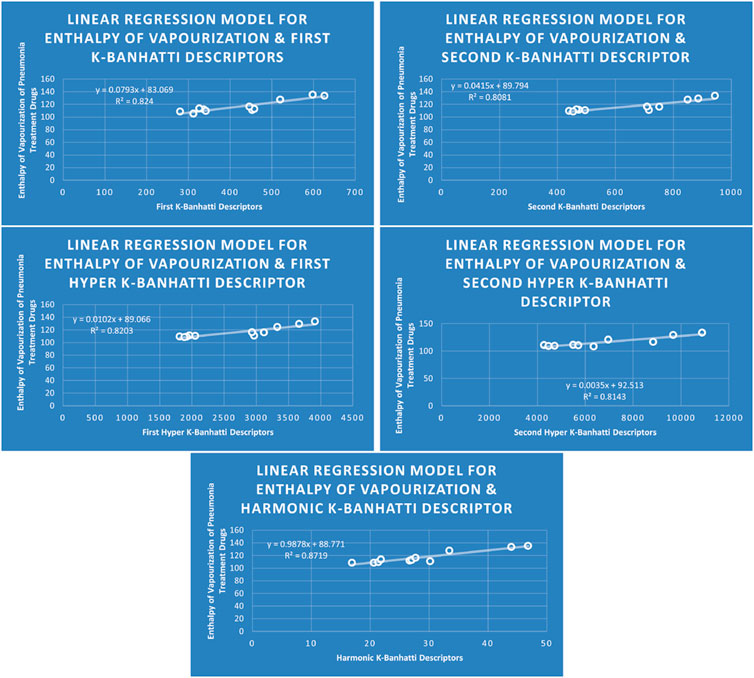
Figure 3.
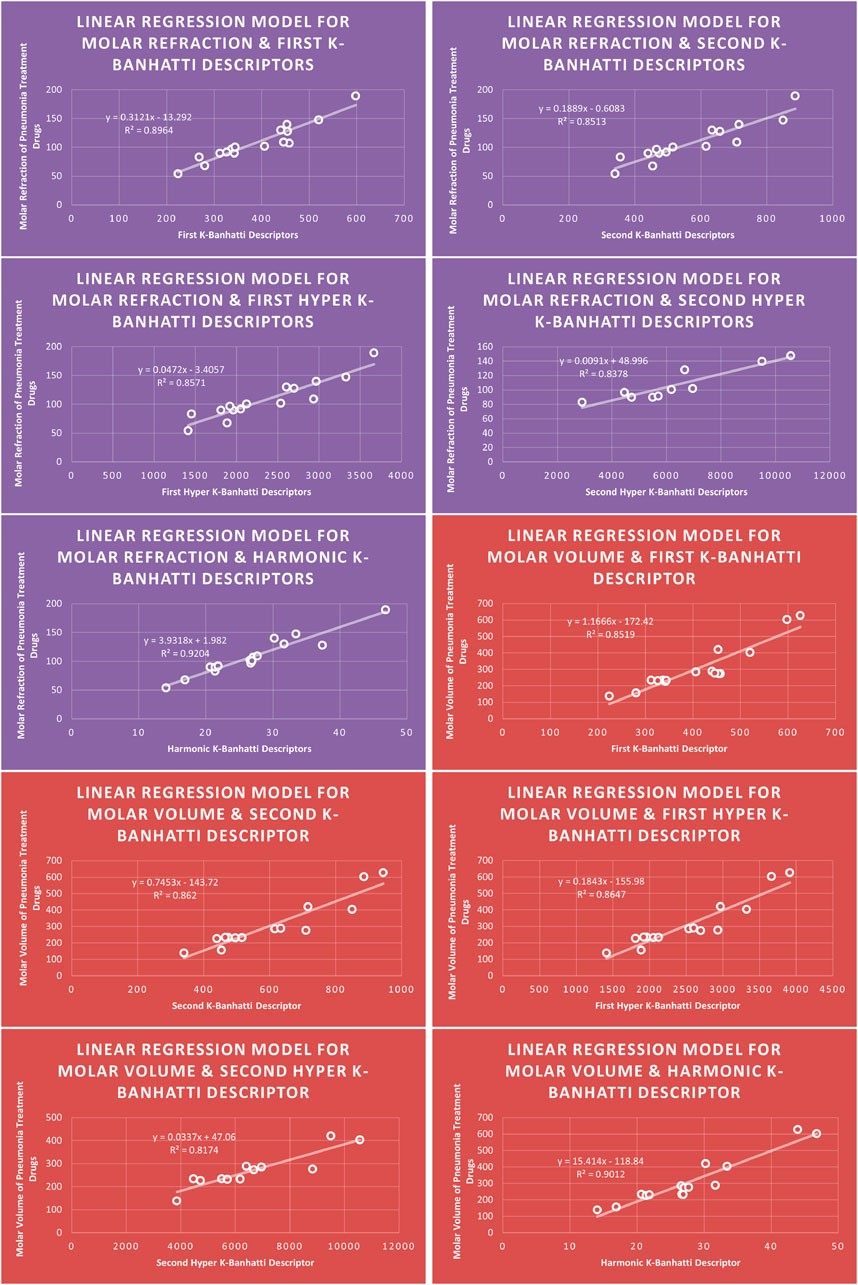
Figure 4.
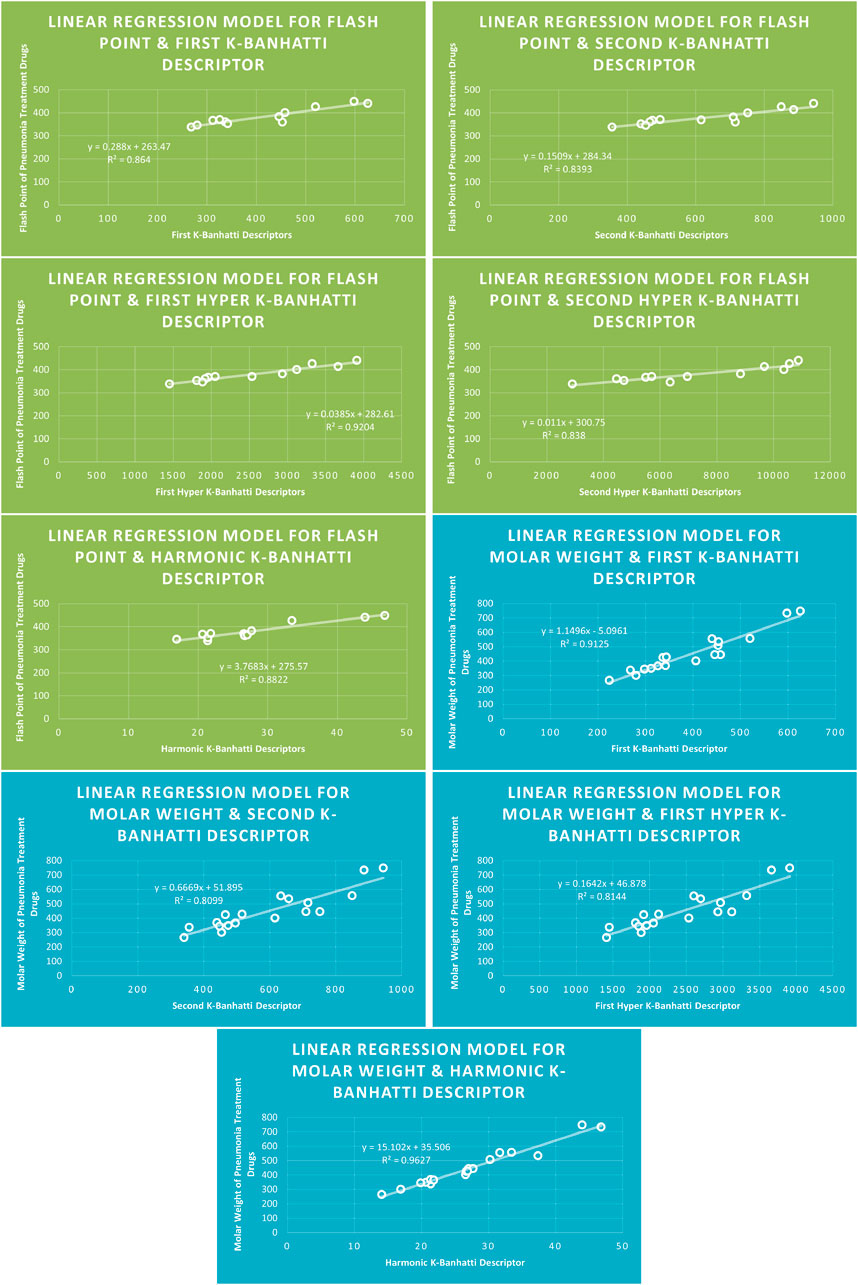
Figure 5. LR models of flash point and molar weight for pneumonia treatment drugs.
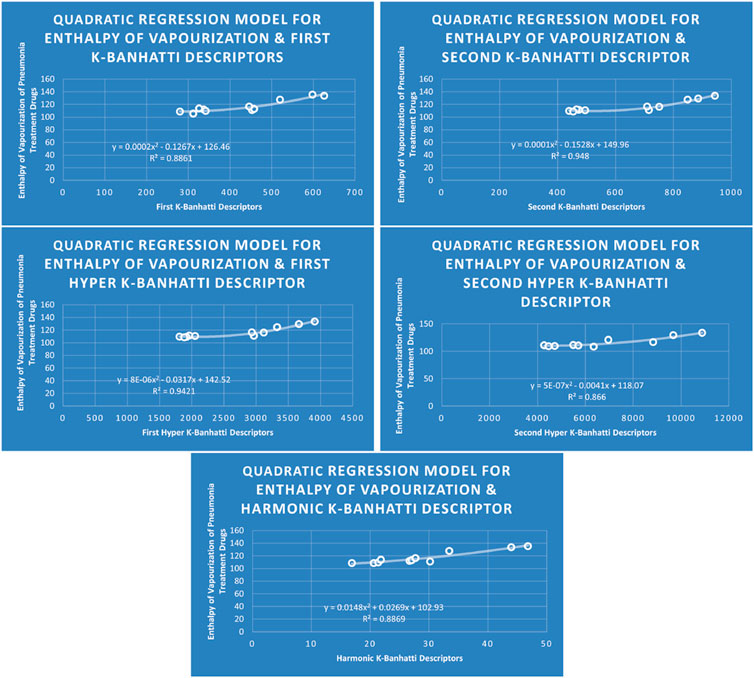
Figure 6.
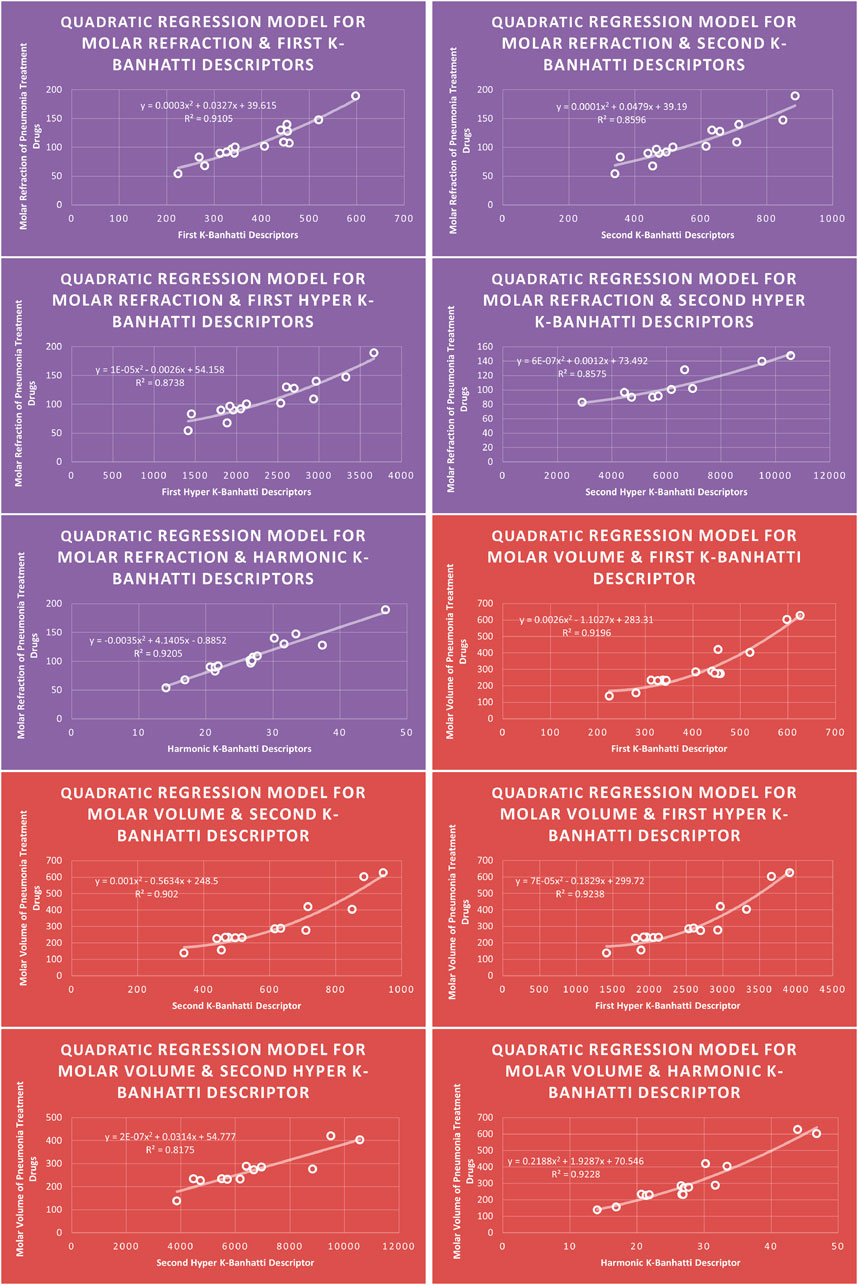
Figure 7. QR models of molar refraction and molar volume for pneumonia treatment drugs.
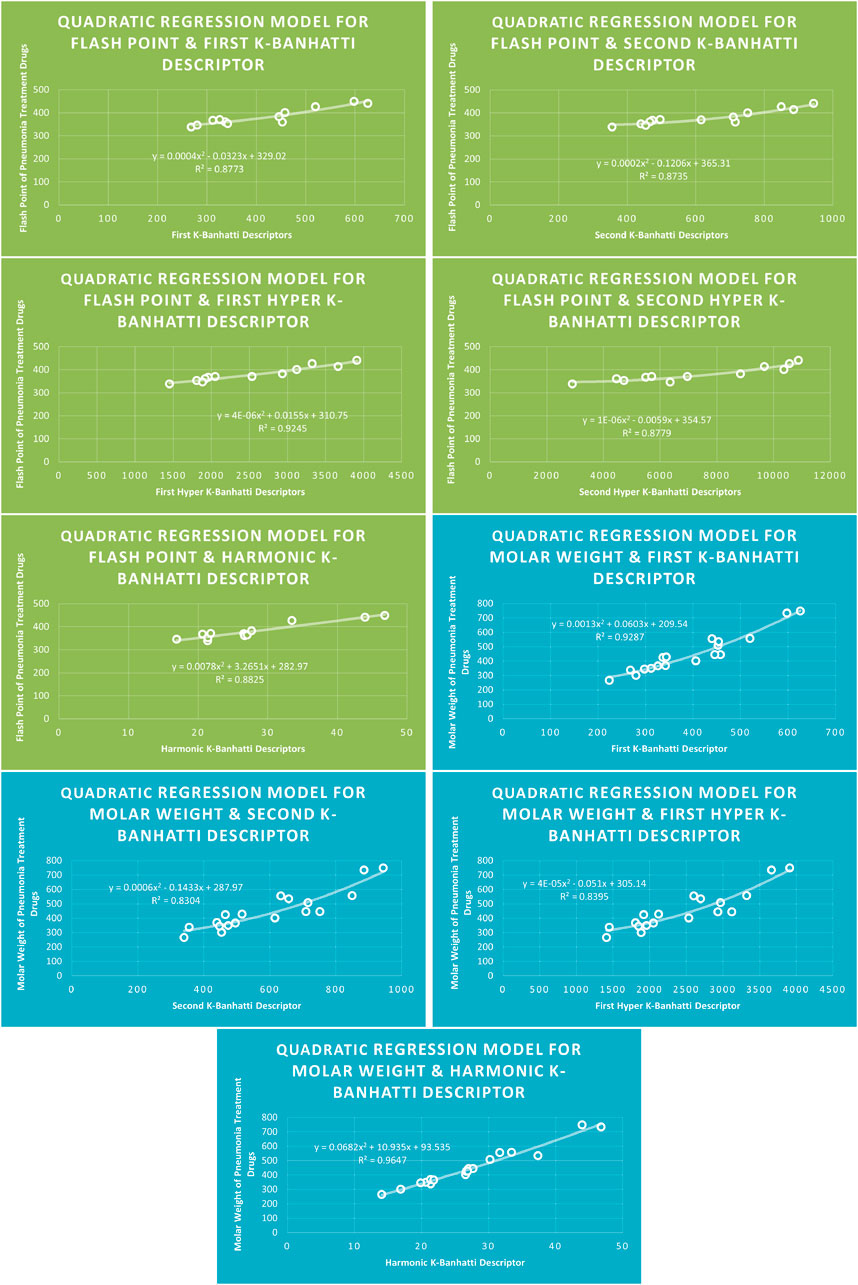
Figure 8. QR models of flash point and molar weight for pneumonia treatment drugs.

Figure 9. CR models of enthalpy of vapourization for pneumonia treatment drugs.
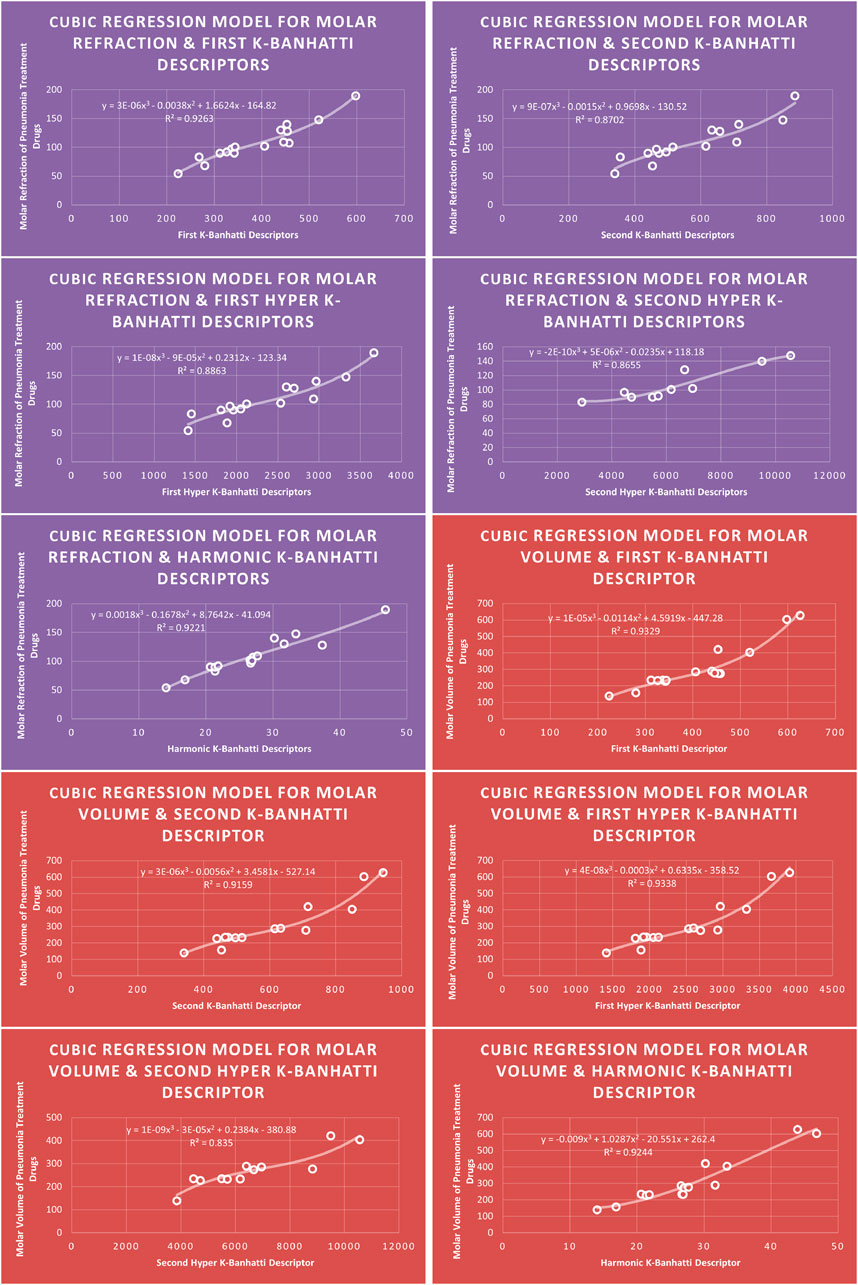
Figure 10. CR models of molar refraction and molar volume for pneumonia treatment drugs.
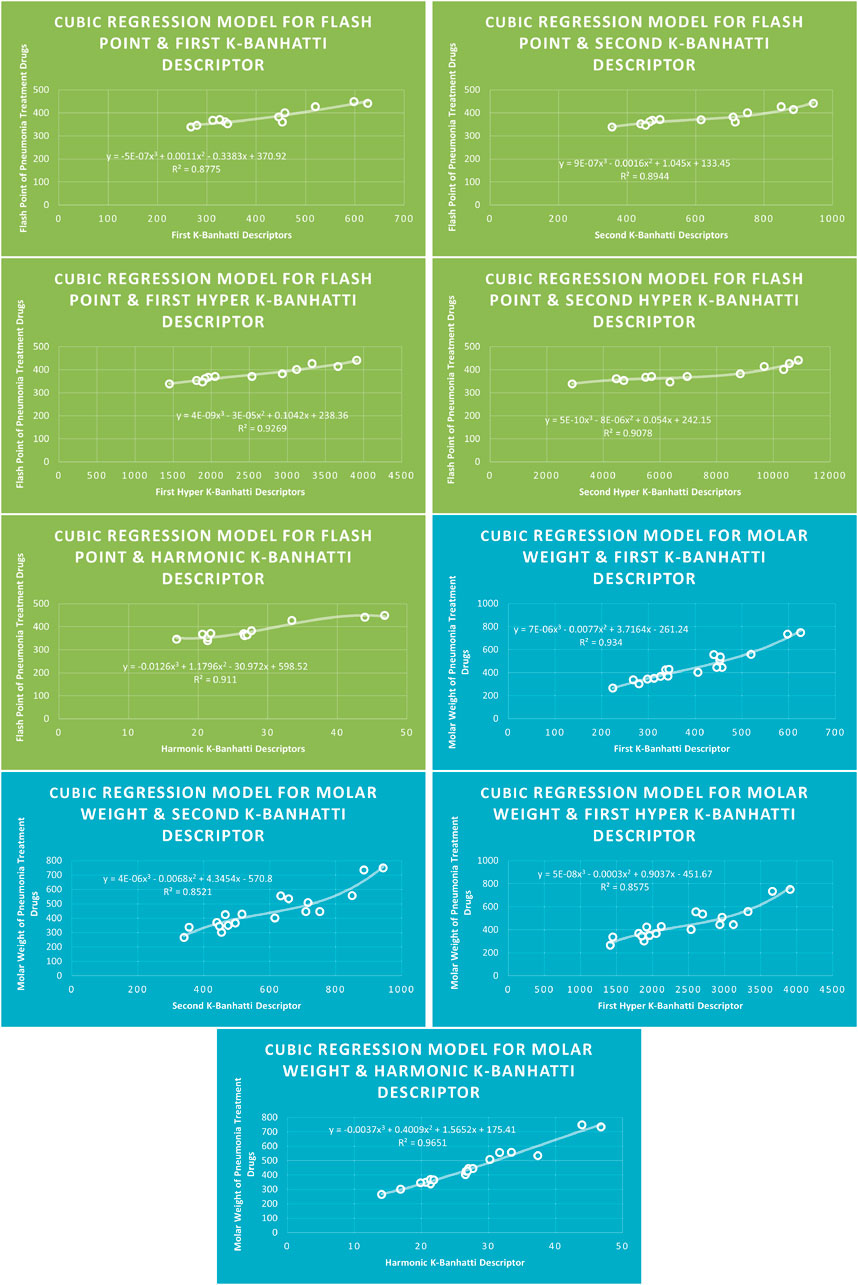
Figure 11. CR models of flash point and molar weight for pneumonia treatment drugs.
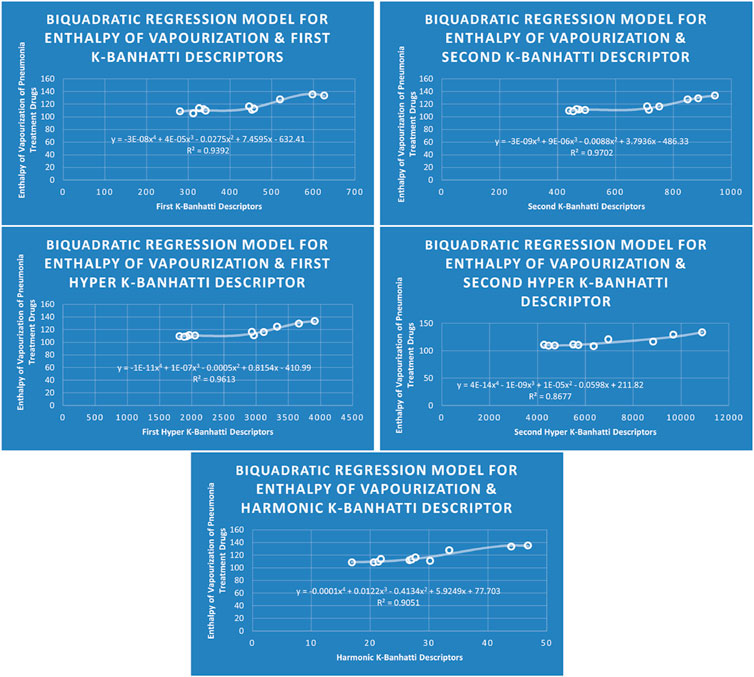
Figure 12.
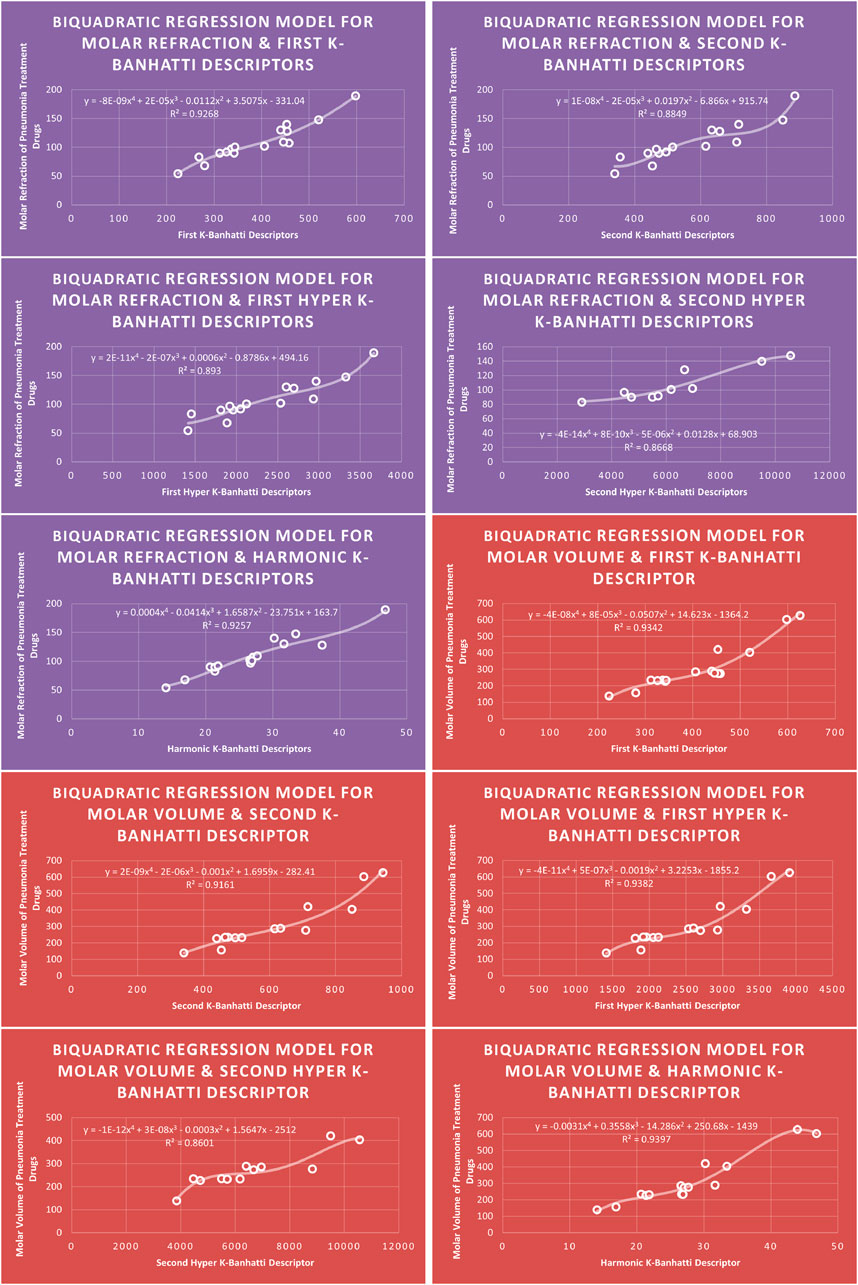
Figure 13.
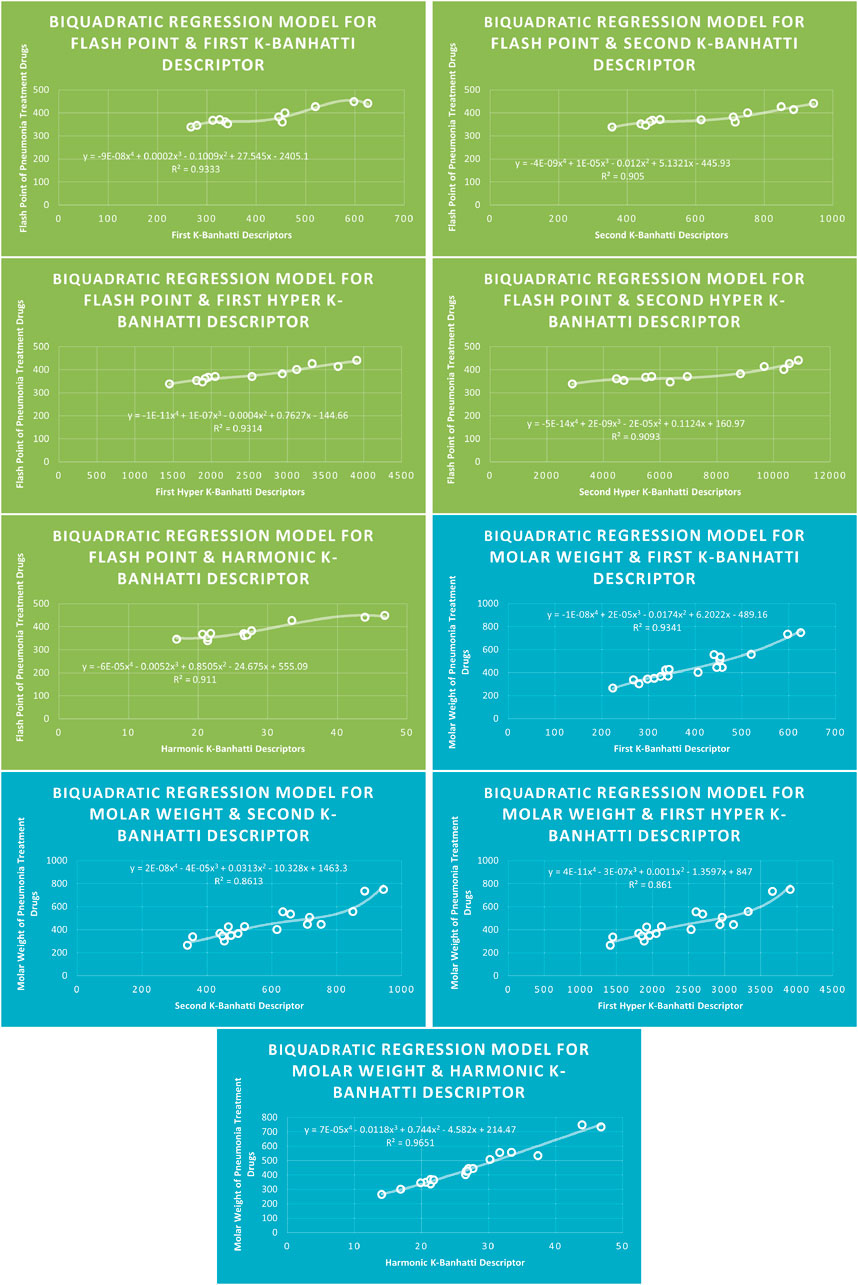
Figure 14.
4.1 Linear regression analysis
The correlation between some
While
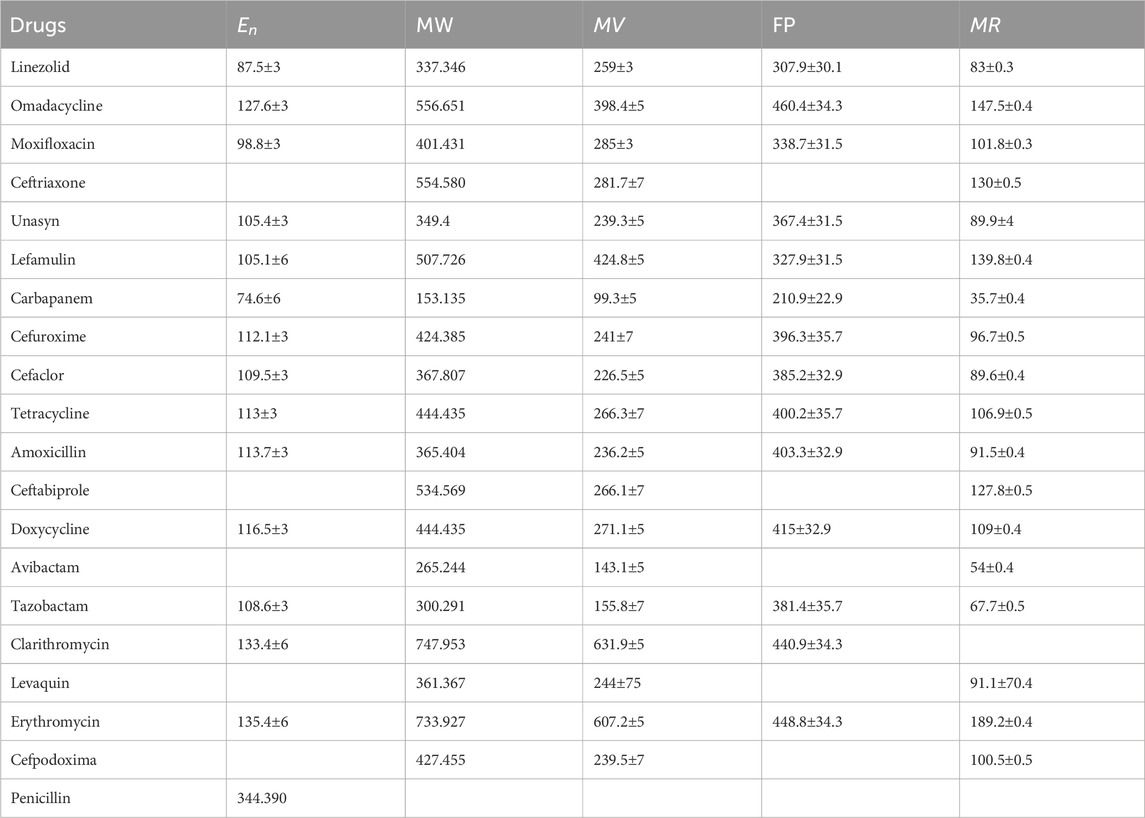
Table 6. Physicochemical properties of anti-pneumonia drugs.
4.2 Quadratic regression analysis
The correlation between some
While
4.3 Cubic regression analysis
The correlation between some
While
4.4 Biquadratic regression analysis
The correlation between some
While
4.5 Mathematical models for linear regression
This subsection provides mathematical models obtained after incorporating QSPR analysis.
• First
• Second
• First Hyper
• Second Hyper
• Harmonic
4.6 Mathematical models for quadratic regression
This subsection provides mathematical models obtained after incorporating QSPR analysis.
• First
• Second
• First Hyper
• Second Hyper
• Harmonic
4.7 Mathematical models for cubic regression
This subsection provides mathematical models obtained after incorporating QSPR analysis.
• First
• Second
• First Hyper
• Second Hyper
• Harmonic
4.8 Mathematical models for biquadratic regression
This subsection provides mathematical models obtained after incorporating
• First
• Second
• First Hyper
• Second Hyper
• Harmonic
5 Discussions
The correlation evaluation specifies the proportion of the connection and offers additional details regarding the association of parameters. Squaring the correlation coefficient yields the correlation of determination
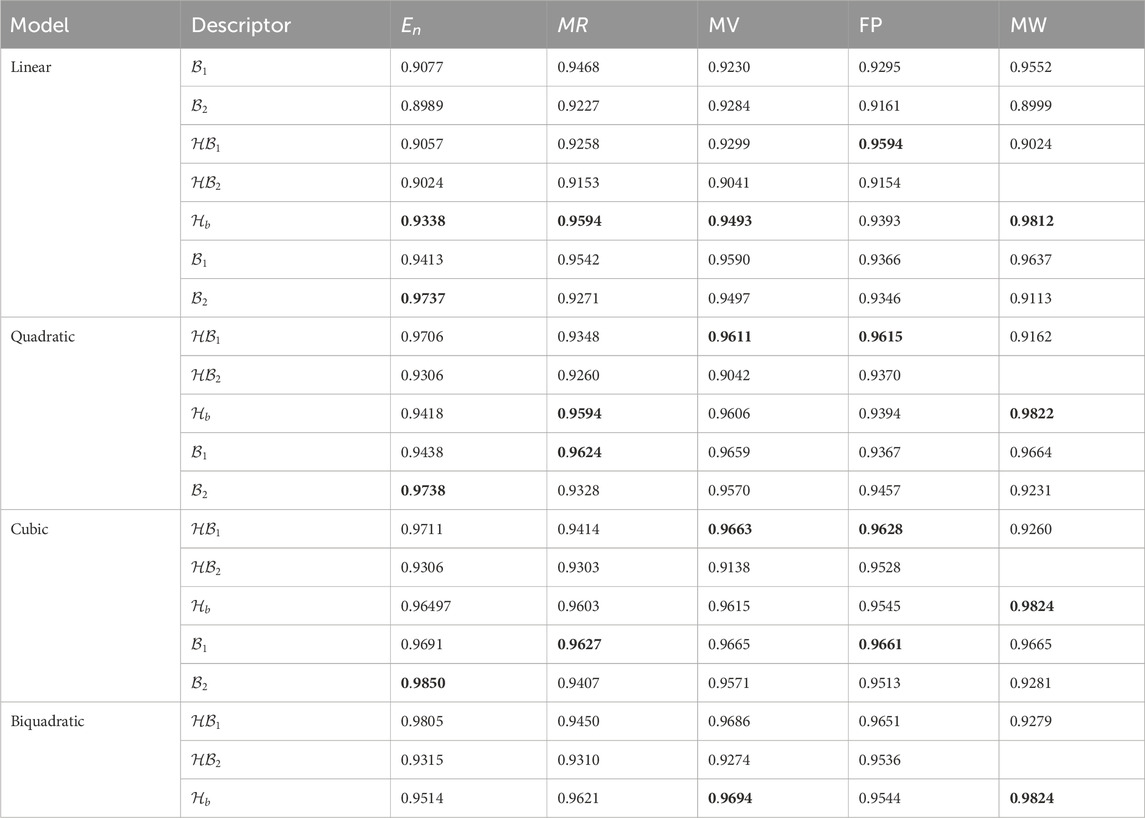
Table 7. Correlation coefficient (
6 Concluding remarks
This research employs
• Best approximated result for Linear, Quadratic, Cubic, and Biquadratic regression for Enthalpy of vaporization
• Best approximated result for Linear, Quadratic, Cubic, and Biquadratic regression for Flash point
• Best approximated result for Linear, Quadratic, Cubic, and Biquadratic regression for Molar refraction
• Best approximated result for Linear, Quadratic, Cubic, and Biquadratic regression for Molar volume
• Best approximated result for Linear, Quadratic, Cubic, and Biquadratic regression for Molar weight
For this study, the cubic and Biquadratic regressions give more reliable results as compared to linear and quadratic. From these models and Table 7, we have oder of reliability:
Data availability statement
The original contributions presented in the study are included in the article/supplementary material, further inquiries can be directed to the corresponding authors.
Author contributions
AK: Conceptualization, Formal Analysis, Investigation, Methodology, Software, Supervision, Validation, Visualization, Writing – original draft, Writing – review and editing. IN: Data curation, Formal Analysis, Investigation, Methodology, Software, Validation, Visualization, Writing – original draft. FT: Conceptualization, Data curation, Formal Analysis, Investigation, Methodology, Software, Validation, Visualization, Writing – review and editing. FT: Conceptualization, Data curation, Formal Analysis, Funding acquisition, Investigation, Methodology, Software, Validation, Visualization, Writing – original draft, Writing – review and editing. SH: Conceptualization, Data curation, Formal Analysis, Investigation, Methodology, Software, Validation, Visualization, Writing – review and editing.
Funding
The author(s) declare that financial support was received for the research and/or publication of this article. Researchers Supporting Project number (RSP2025R401), King Saud University, Riyadh, Saudi Arabia.
Conflict of interest
The authors declare that the research was conducted in the absence of any commercial or financial relationships that could be construed as a potential conflict of interest.
Generative AI statement
The author(s) declare that no Generative AI was used in the creation of this manuscript.
Publisher’s note
All claims expressed in this article are solely those of the authors and do not necessarily represent those of their affiliated organizations, or those of the publisher, the editors and the reviewers. Any product that may be evaluated in this article, or claim that may be made by its manufacturer, is not guaranteed or endorsed by the publisher.
References
Almalki, N., and Tabassum, H. (2024). On K-banhatti, revan indices and entropy measures of MgO (111) nanosheets via linear regression. Mathematics 12 (4), 561. doi:10.3390/math12040561
Alvarez-Elcoro, S., and Enzler, M. J. (1999). The macrolides: erythromycin, clarithromycin, and azithromycin. Mayo Clin. Proc. 74 (6), 613–634. doi:10.4065/74.6.613
Anjum, M. S., and Safdar, M. U. (2019). K Banhatti and K hyper-Banhatti indices of nanotubes. Eng. Appl. Sci. Lett. 2(1), 19–37. doi:10.30538/psrp-easl2019.0013
Awan, N. U. H., Ghaffar, A., Tawfiq, F. M., Mustafa, G., and Bilal, M. (2024). QSPR analysis for physiochemical properties of new potential antimalarial compounds involving topological indices. Int. J. Quantum Chem. 124 (11), e27391. doi:10.1002/qua.27391
Awan, N. U. H., Ghani, M. U., Bibi, S., Kirmani, S. A. K., and Abdalla, M. E. M. (2025). A paradigmatic approach to the topological measure of babesiosis drugs and estimating physical properties via QSPR analysis. Heliyon 11 (1), e41615. doi:10.1016/j.heliyon.2024.e41615
Bashir Farooq, F., Awan, N. U. H., Parveen, S., Idrees, N., Kanwal, S., and Abdelhaleem, T. A. (2022). Topological indices of novel drugs used in autoimmune disease vitiligo treatment and its QSPR modeling. J. Chem. 2022 (1), 6045066. doi:10.1155/2022/6045066
Chu, Y. M., Khan, A. R., Ghani, M. U., Ghaffar, A., and Inc, M. (2023). Computation of zagreb polynomials and zagreb indices for benzenoid triangular and hourglass system. Polycycl. Aromat. Compd. 43 (5), 4386–4395. doi:10.1080/10406638.2022.2090970
Dehmer, M. M., Barbarini, N. N., Varmuza, K. K., and Graber, A. A. (2010). Novel topological descriptors for analyzing biological networks. BMC Struct. Biol. 10, 18–17. doi:10.1186/1472-6807-10-18
Fathi, A., Vijay, J. S., Husin, M. N., and Augustine, T. (2024). Valency-based molecular descriptor on structural property relationship of Ni tetrathiafulvalene tetrathionate. Malays. J. Fundam. Appl. Sci. 20 (6), 1398–1409. doi:10.11113/mjfas.v20n6.3831
Galvez, J., Villar, V., Galvez-Llompart, M., and Amigo, J. (2011). Chemistry explained by topology: an alternative approach. Comb. Chem. and High Throughput Screen. 14 (4), 279–283. doi:10.2174/138620711795222464
Garau, J. (2005). Role of beta-lactam agents in the treatment of community-acquired pneumonia. Eur. J. Clin. Microbiol. Infect. Dis. 24, 83–99. doi:10.1007/s10096-005-1287-9
Ghani, M. U., Sultan, F., Tag El Din, E. S. M., Khan, A. R., Liu, J. B., and Cancan, M. (2022). A paradigmatic approach to find the valency-based K-banhatti and redefined Zagreb entropy for niobium oxide and a metal–organic framework. Molecules 27 (20), 6975. doi:10.3390/molecules27206975
Hakami, K. H., Khan, A. R., and Bhatti, S. A. (2025). Computation of differential, integral operators and quantitative structure–property analysis of boron α-icosahedral nanosheet. J. Math. 2025 (1), 5607620. doi:10.1155/jom/5607620
Hakami, K. H., Khan, A. R., and Zia, I. (2024). Bicubic regression analysis a novel approach for estimation of physicochemical properties of skin cancer drugs through degree based entropy. Heliyon 10 (20), e39084. doi:10.1016/j.heliyon.2024.e39084
Harari, M., Spooner, V., Meisner, S., Carney, M., Shann, F., and De Campo, J. (1991). Clinical signs of pneumonia in children. Lancet 338 (8772), 928–930. doi:10.1016/0140-6736(91)91785-s
Hayat, S. (2017). Computing distance-based topological descriptors of complex chemical networks: new theoretical techniques. Chem. Phys. Lett. 688, 51–58. doi:10.1016/j.cplett.2017.09.055
Husin, M. N., Hasni, R., and Arif, N. E. (2015). Zagreb polynomials of some nanostar dendrimers. J. Comput. Theor. Nanosci. 12 (11), 4297–4300. doi:10.1166/jctn.2015.4354
Husin, M. N., Khan, A. R., Awan, N. U. H., Campena, F. J. H., Tchier, F., and Hussain, S. (2024). Multicriteria decision making attributes and estimation of physicochemical properties of kidney cancer drugs via topological descriptors. Plos one 19 (5), e0302276. doi:10.1371/journal.pone.0302276
Imran, M., Khan, A. R., Husin, M. N., Tchier, F., Ghani, M. U., and Hussain, S. (2023). Computation of entropy measures for metal-organic frameworks. Molecules 28 (12), 4726. doi:10.3390/molecules28124726
Khan, A. R., Awan, N. U. H., Ghani, M. U., Eldin, S. M., Karamti, H., Jawhari, A. H., et al. (2023a). Fundamental aspects of skin cancer drugs via degree-based chemical bonding topological descriptors. Molecules 28 (9), 3684. doi:10.3390/molecules28093684
Khan, A. R., Awan, N. U. H., Tchier, F., Alahmari, S. D., Khalel, A. F., and Hussain, S. (2025). An estimation of physiochemical properties of bladder cancer drugs via degree-based chemical bonding topological descriptors. J. Biomol. Struct. Dyn. 43 (4), 1665–1673. doi:10.1080/07391102.2023.2292792
Khan, A. R., Bhatti, S. A., Imran, M., Tawfiq, F. M., Cancan, M., and Hussain, S. (2024e). Computation of differential and integral operators using M-polynomials of gold crystal. Heliyon 10 (14), e34419. doi:10.1016/j.heliyon.2024.e34419
Khan, A. R., Bhatti, S. A., Tawfiq, F., Siddiqui, M. K., Hussain, S., and Ali, M. A. (2024d). On degree-based operators and topological descriptors of molecular graphs and their applications to QSPR analysis of carbon derivatives. Sci. Rep. 14 (1), 21543. doi:10.1038/s41598-024-72621-7
Khan, A. R., Ghani, M. U., Ghaffar, A., Asif, H. M., and Inc, M. (2023b). Characterization of temperature indices of silicates. Silicon 15 (15), 6533–6539. doi:10.1007/s12633-023-02298-6
Khan, A. R., Mutlib, A., Campeña, F. J. H., Tchier, F., Karim, M., and Hussain, S. (2024b). Investigation of reduced reverse degree based polynomials and indices of gold crystals. Phys. Scr. 99 (7), 075259.doi:10.1088/1402-4896/ad5648
Khan, A. R., Ullah, Z., Imran, M., Malik, S. A., Alamoudi, L. M., and Cancan, M. (2024c). Molecular temperature descriptors as a novel approach for QSPR analysis of Borophene nanosheets. PloS one 19 (6), e0302157. doi:10.1371/journal.pone.0302157
Khan, A. R., Zia, A., Campeña, F. J. H., Siddiqui, M. K., Tchier, F., and Hussain, S. (2024a). Investigations of entropy double and strong double graph of silicon carbide. Silicon, 16 4187–4197. doi:10.1007/s12633-024-02975-0
Leung, A. K., Wong, A. H., and Hon, K. L. (2018). Community-acquired pneumonia in children. Recent Pat. Inflamm. and allergy drug Discov. 12 (2), 136–144. doi:10.2174/1872213x12666180621163821
Liapikou, A., Cillóniz, C., and Torres, A. (2015). Ceftobiprole for the treatment of pneumonia: a European perspective. Drug Des. Dev. Ther. 9, 4565–4572. doi:10.2147/dddt.s56616
Madhi, S. A., Levine, O. S., Hajjeh, R., Mansoor, O. D., and Cherian, T. (2008). Vaccines to prevent pneumonia and improve child survival. Bull. world Health Organ. 86, 365–372. doi:10.2471/blt.07.044503
Mahboob, A., Muhiuddin, G., Siddique, I., and Alam, S. M. (2022). A view of Banhatti and Revan indices in chemical graphs. J. Math. 2022 (1), 5680712. doi:10.1155/2022/5680712
Marangu, D., and Zar, H. J. (2019). Childhood pneumonia in low-and-middle-income countries: an update. Paediatr. Respir. Rev. 32, 3–9. doi:10.1016/j.prrv.2019.06.001
Munywoki, P. K., Ohuma, E. O., Ngama, M., Bauni, E., Scott, J. A. G., and Nokes, D. J. (2013). Severe lower respiratory tract infection in early infancy and pneumonia hospitalizations among children, Kenya. Emerg. Infect. Dis. 19 (2), 223–229. doi:10.3201/eid1902.120940
Nasir, S., Farooq, F. B., and Parveen, S. (2022). Topological indices of novel drugs used in blood cancer treatment and its QSPR modeling. AIMS Math. 7 (7), 11829–11850. doi:10.3934/math.2022660
Parveen, N., and Sathik, M. M. (2011). Detection of pneumonia in chest X-ray images. J. X-ray Sci. Technol. 19 (4), 423–428. doi:10.3233/xst-2011-030400304
Rudan, I., Tomaskovic, L., Boschi-Pinto, C., and Campbell, H. (2004). Global estimate of the incidence of clinical pneumonia among children under five years of age. Bull. World Health Organ. 82 (12), 895–903.
Scelfo, C., Menzella, F., Fontana, M., Ghidoni, G., Galeone, C., and Facciolongo, N. C. (2021). Pneumonia and invasive pneumococcal diseases: the role of pneumococcal conjugate vaccine in the era of multi-drug resistance. Vaccines 9 (5), 420. doi:10.3390/vaccines9050420
Scotta, M. C., Marostica, P. J., and Stein, R. T. (2019). “Pneumonia in children,” in Kendig’s disorders of the respiratory tract in children (Elsevier), 427–438.
Shann, F. (1995). The management of pneumonia in children in developing countries. Clin. Infect. Dis. 21 (Suppl. 3), S218–S225. doi:10.1093/clind/21.supplement_3.s218
Singh, V., and Aneja, S. (2011). Pneumonia–management in the developing world. Paediatr. Respir. Rev. 12 (1), 52–59. doi:10.1016/j.prrv.2010.09.011
Sood, S. K. (1999). Macrolides: clarithromycin and azithromycin. Semin. Pediatr. Infect. Dis. (Vol. 10, No. 1, pp. 23–30). doi:10.1016/s1045-1870(99)80006-5
Sultana, S. (2023). Chemical application of topological indices in infertility treatment drugs and QSPR analysis. Int. J. Anal. Chem. 2023 (1), 1–11. doi:10.1155/2023/6928167
Venditti, M., Falcone, M., Corrao, S., Licata, G., and Serra, P. (2009). Outcomes of patients hospitalized with community-acquired, health care–associated, and hospital-acquired pneumonia. Ann. Intern. Med. 150 (1), 19–26. doi:10.7326/0003-4819-150-1-200901060-00005
Vijay, J. S., Roy, S., Beromeo, B. C., Husin, M. N., Augustine, T., Gobithaasan, R. U., et al. (2023). Topological properties and entropy calculations of aluminophosphates. Mathematics 11 (11), 2443. doi:10.3390/math11112443
Wardlaw, T., Salama, P., Johansson, E. W., and Mason, E. (2006). Pneumonia: the leading killer of children. Lancet 368 (9541), 1048–1050. doi:10.1016/s0140-6736(06)69334-3
Keywords: molecular structure, anti-pneumonia drugs, physicochemical properties, topological descriptors, K-Banhatti descriptors, regression models, QSPR testing, chemical graph theory
Citation: Khan AR, Naeem I, Tchier F, Tolasa FT and Hussain S (2025) Mathematical modeling and estimation of physicochemical characteristics of pneumonia treatment drugs through a novel approach K-Banhatti topological descriptors. Front. Chem. 13:1564809. doi: 10.3389/fchem.2025.1564809
Received: 22 January 2025; Accepted: 10 March 2025;
Published: 02 May 2025.
Edited by:
Rachelle J. Bienstock, RJB Computational Modeling LLC, United StatesReviewed by:
Joseph Clement, VIT University, IndiaNadeem Ul Hassan Awan, Gazi University, Türkiye
Mohamad Nazri Husin, University of Malaysia Terengganu, Malaysia
Copyright © 2025 Khan, Naeem, Tchier, Tolasa and Hussain. This is an open-access article distributed under the terms of the Creative Commons Attribution License (CC BY). The use, distribution or reproduction in other forums is permitted, provided the original author(s) and the copyright owner(s) are credited and that the original publication in this journal is cited, in accordance with accepted academic practice. No use, distribution or reproduction is permitted which does not comply with these terms.
*Correspondence: Abdul Rauf Khan, a2hhbmt0c0BnbWFpbC5jb20=; Fikadu Tesgera Tolasa, ZmlrYWR1QGRhZHUuZWR1LmV0