Abstract
Introduction:
Tricyclic anti-depressant (TCA) drugs are widely used to treat depression, but traditional methods for evaluating their physicochemical properties can be time-consuming and costly. This study examines how topological indices can help to predict the properties of TCA drugs, with a special focus on the role of the hydrogen representation.
Methods:
Two molecular configurations were analyzed: one with only explicit hydrogen and the other including all hydrogen atoms. To assess predictive performance, linear regression (LR) and support vector regression (SVR) models were employed.
Results:
The results showed that adding all hydrogen atoms showed strong correlations, especially for polarizability, molar refractivity, and molar volume. Among the models employed, SVR provided more accurate results. Additionally, hydrogen representation had a stronger impact on SVR's predictions.
Discussion:
These findings highlight the potential of using machine learning techniques in quantitative structure-property relationship (QSPR) models for more efficient and reliable predictions of drug properties.
1 Introduction
Mental health disorders are a group of psychiatric conditions that can severely impact an individual’s ability to function in everyday environment, resulting in difficulties with daily activities, social connections, and behavioral stability (Ejima et al., 2024). Conditions such as anxiety, addiction, depression, and bipolar disorder are common, with depression being a particularly pressing public health concern that demands effective treatment options (Kessler et al., 2007). TCAs rank among the most commonly prescribed medications for depression, with over 25 million prescriptions written annually in the United States. However, despite their effectiveness, TCAs are frequently linked in overdose incidents, with studies showing that they contribute to nearly 25% of overdose-related hospital admissions at a major medical center (Marshall and Forker, 1982; Vandel et al., 1997). According to the 2023 NSDUH Report, 22.8% of adults (58.7 million) experienced any mental illness (AMI) in the past year, and 4.5 million adolescents reported a major depressive episode, with 20% also experiencing substance use disorders. Suicide remains a major worry, with 5.0% of adults having serious thoughts about it, 1.4% making plans, and 0.6% attempting suicide (Health and Services, 2023). These concerning statistics highlight the critical importance of prioritising mental health rehabilitation and preservation. While laboratory-based drug development has played a key role in advancing treatments for mental health, it is often resource intensive (Insel et al., 2013). Computational modeling and predictive techniques offer promising alternatives that are both cost-effective and resourceful. These approaches not only enhance traditional drug discovery but also provide accessible and effective therapy for those with neuropsychiatric disorders.
The process of drug design and discovery is a complex, time-consuming, and costly. To optimize this process, researchers have increasingly turned to predictive modeling techniques, particularly in resource-limited scenarios or during medical emergencies. One such approach is QSPR modeling, which predict a drug’s physicochemical properties based on its molecular structure and descriptors, commonly referred to as topological indices. Chemical graph theory applies the principles of graph theory to chemistry by representing molecules as graphs, where vertices correspond to atoms and edges to chemical bonds (Thapar et al., 2022). Topological indices, numerical descriptors derived from these graphs, capture critical structural information (Gutman and Polansky, 2012; Gutman, 2006). These indices serve as essential tools in QSPR modeling, as they establish mathematical relationships between molecular structures and biological or physicochemical properties, particularly in pharmaceutical research (Abubakar et al., 2024a). One of the earliest and most well-known topological indices is the Wiener Index, introduced in 1947, originally designed to predict the physical properties of paraffin compounds (Wiener, 1947). In recent years, topological indices have gained widespread popularity in QSPR studies, offering a cost-effective and time-saving alternative to experimental methods. By enabling researchers to predict key drug properties, identify influential structural features, and optimize drug candidates, these indices play a crucial role in accelerating drug development and reducing reliance on expensive laboratory experiments (Parveen et al., 2022; Zaman et al., 2023).
The use of topological indices in pharmaceutical research has significantly increased in recent years, particularly in QSPR studies. But, most QSPR modeling studies primarily focused on classical graph-based topological indices and simple regression models to establish relationships between topological indices and the physical properties of compounds. A topological index that exhibits a strong linear correlation with a physical property is regarded as an effective descriptor for predicting that property (Zaman et al., 2024; Das et al., 2024; Arockiaraj et al., 2024; Huang et al., 2024; Hasani and Ghods, 2024). However, when the relationship between topological indices and physical properties is non-linear, more advanced approaches like machine learning, are employed to capture complex patterns and improve predictive accuracy (Fernández-Blanco et al., 2013; Madugula et al., 2021; Abubakar et al., 2024b). Zabidi et al. (2021) applied machine learning to predict HOMO and LUMO, minimizing the need for computationally expensive DFT calculations. Degree-based topological indices were employed in QSPR analysis to establish correlations with these properties and identified Linear Regression with Moment Balaban Indices as the most accurate model. Costa et al. (2020) proposed explored a novel method for QSAR and QSPR modeling through Molecular Graph Theory, emphasizing molecular fragment contributions. By combining Molecular Graph Theory, SMILES notation, and connection table data, they established an efficient method for fragment identification. Machine learning techniques produced accurate predictive models, and the study introduced Charming QSAR and QSPR, a Python tool designed for property estimation in chemical compounds. Abubakar et al. (2024a) analyzed neighborhood degree-based topological indices for QSPR modeling of anti-tuberculosis drugs, employing Support Vector Regression (SVR) and comparing it to linear regression. The results demonstrated that SVR as a better predictive tool, enhancing the understanding of the non-linear relationship. Author A and others applied QSPR modeling with neighborhood sum degree topological indices to predict antibacterial drug properties. SVR outperformed linear regression, benefiting from feature selection and hyper-parameter tuning. Marshall and Forker (1982) investigated an ensemble learning approach for the analysis of mental disorder drugs. Using neighborhood degree-based indices derived from SMILES notations, the study identified optimal indices for predicting key physicochemical properties. Their findings showed the role of ensemble learning in better prediction accuracy, particularly for small datasets.
Additionally, it is important to note that none of the cited studies considered hydrogen atoms in their topological representations, which may neglect to important contribution to molecular properties. Furthermore, the all prior work relied on degree-based topological indices, which capture only local atomic environments. In our earlier study, the predictive power of topological indices for drug properties was explored using regression models along with distance-based indices. However, the influence of hydrogen configuration was not considered (Kour et al., 2024). In contrast, our present study demonstrated a novel comparison of explicit hydrogen and all hydrogen structures, using distance based indices that effectively capture molecular branching and spatial arrangement. Benchmarking LR and SVR, we observed that SVR provided superior accuracy for non-linear relationships, while LR performed well in strongly linear cases. This novel approach refines QSAR modeling, demonstrating how molecular representation influences predictive accuracy and optimizing regression techniques. The primary objective of this work is to understand the impact of hydrogen configuration on the prediction of six physicochemical properties using two regression techniques. This work aims to evaluate how different molecular representations impact prediction accuracy across multiple properties.
The major contributions in this study are:
A comparative assessment of SVR and LR in handling linear and non-linear relationships.
A detailed evaluation of six physicochemical properties using both molecular representations.
The demonstration of how distance-based topological indices, combined with SVR, can enhance property prediction and serve as practical tool to accelerate early stage drug discovery.
2 Methodology and data collection
2.1 Drugs analysis
This study focuses on fifteen TCA drugs which have different molecular structure and clinical importance. Table 1 list their chemical structures and therapeutic uses, highlighting their role in treating depression and anxiety.
TABLE 1
| Drugs | Abbreviation | Chemical structures | Therapeutic uses |
|---|---|---|---|
| Alprazolam | ALP | C17 H13 Cl N4 | Used to treat generalized anxiety disorder, panic disorder, and off-label for insomnia, premenstrual syndrome, and depression in adults |
| Amitriptyline | AMT | C20 H23 N | Used for major depressive disorder, neuro-pathic pain, chronic tension-type headache, migraine prophylaxis in adults, and nocturnal enuresis in children aged when other treatments fail |
| Amoxapine | AMX | C17 H16 Cl N3 O | For relieving depression symptoms in neurotic, reactive, endogenous, and psychotic depression, as well as depression associated with anxiety or agitation |
| Buspirone | BSP | C21 H31 N5 O2 | Used to manage anxiety disorders or provide short-term relief from anxiety symptoms |
| Clomipramine | CLM | C19 H23 Cl N2 | Used for obsessive-compulsive disorder, related conditions, and off-label for depression, chronic pain, narcolepsy, and autism |
| Desipramine | DSP | C18 H22 N2 | Relieves symptoms of depressive syndromes, particularly endogenous depression, and manages chronic peripheral neuropathic pain, anxiety disorders, and ADHD (second or third-line treatment) |
| Desvenlafaxine | DVF | C16 H25 N O2 | To treat major depressive disorder in adults and is also prescribed off-label for hot flashes in menopausal women |
| Diazepam | DZM | C16 H13 Cl N2 O | Used to treat anxiety, muscle spasms, acute alcohol withdrawal, spasticity, and as an adjunct for epilepsy, with indications for short-term anxiety relief, pre-surgical sedation in adults, and specific seizure episodes in children |
| Fluoxetine | FLX | C17 H18 F3 N O | Used for major depressive disorder, obsessive-compulsive disorder, bulimia nervosa, acute panic disorder, PMDD, and in combination with olanzapine for Bipolar I Disorder-related and treatment-resistant depression |
| Imipramine | IMP | C19 H24 N2 | Used to relieve depression symptoms and reduce enuresis in children 6+, with off-label uses for panic disorders, ADHD, bulimia nervosa, bipolar depression, PTSD, and neuropathic pain |
| Lorazepam | LRZ | C15 H10 Cl2 N2 O2 | Used for anxiety relief, sedation, and status epilepticus, with off-label uses for alcohol withdrawal, muscle spasms, insomnia, panic disorder, and more |
| Nortriptyline | NTP | C19 H21 N | Used to relieve symptoms of major depressive disorder (MDD) and off-label for chronic pain, myofascial pain, neuralgia, and irritable bowel syndrome |
| Oxazepam | OZP | C15 H11 Cl N2 O2 | Used to manage anxiety disorders, provide short-term anxiety relief, and treat alcohol withdrawal symptoms |
| Protriptyline | PTP | C19 H21 N | Used for the treatment of major depression |
| Trimipramine | TMP | C20 H26 N2 | Used to treat depression, including cases accompanied by anxiety, agitation, or sleep disturbances |
TCA drugs with their chemical structure and therapeutic uses.
Two molecular representations, one including explicit hydrogen only and the other including all the hydrogen, were analyzed to understand the influence of hydrogen on the properties of drugs. Figure 1 presents an example of Fluoxetine, showing its two different configurations-one with explicit hydrogen and other with all hydrogen. The hydrogen atoms are highlighted in red color. Six physicochemical properties listed in Table 2, were obtained from PubChem (2025) and ChemSpider (2025). These properties help us understand the thermodynamic and structural characteristics of these compounds in further computational analyses.
FIGURE 1

Two configurations of a molecule (Example: Fluoxetine).
TABLE 2
| Drugs | Boiling point (BP) | Enthalpy (E) | Flash point (FP) | Molar refractivity (MR) | Polarizability (P) | Molar volume (MV) |
|---|---|---|---|---|---|---|
| Alprazolam | 509 | 77.9 | 261.6 | 88.2 | 35 | 225.6 |
| Amitriptyline | 398.2 | 64.9 | 174 | 91.5 | 36.3 | 257.8 |
| Amoxapine | 469.9 | 73.2 | 238 | 86.8 | 34.4 | 228.2 |
| Buspirone | 613.9 | 91.1 | 325.1 | 106.8 | 42.4 | 310.7 |
| Clomipramine | 434.2 | 69 | 216.4 | 93.8 | 37.2 | 281.2 |
| Desipramine | 407.4 | 65.9 | 160.5 | 84.2 | 33.4 | 254.3 |
| Desvenlafaxine | 403.8 | 69.1 | 193.2 | 77.8 | 30.9 | 236.1 |
| Diazepam | 497.4 | 76.5 | 254.6 | 80.9 | 32.1 | 225.9 |
| Fluoxetine | 395.1 | 64.5 | 192.8 | 79.9 | 31.7 | 266.7 |
| Imipramine | 403.1 | 65.4 | 179.7 | 88.9 | 35.3 | 269.2 |
| Lorazepam | 543.6 | 86.5 | 282.6 | 81 | 32.1 | 211.2 |
| Nortriptyline | 403.4 | 65.5 | 194.9 | 86.8 | 34.4 | 242.9 |
| Oxazepam | 516.6 | 83 | 266.2 | 76.4 | 30.3 | 201.9 |
| Protriptyline | 407.7 | 66 | 198.3 | 84.8 | 33.6 | 256.5 |
| Trimipramine | 411.8 | 66.4 | 183.3 | 93.5 | 37.1 | 286.1 |
Physicochemical properties of the TCA drugs.
2.2 Topological indices
The study explores the relationship between molecular properties and atomic arrangements using distance-based topological indices which are presented in Table 3. Similarly, calculations were performed for fifteen TCA drugs, analyzed with explicit hydrogen and with all the hydrogen. The results, presented in Tables 4, 5, provide numerical values that represent structural connectivity and molecular topology. These indices were selected due to their ability to capture spatial and str curtal complexity of the molecules. They effectively encode connectivity and branching patterns that influence molecular behavior.
TABLE 3
| Topological index | Notation | Formula |
|---|---|---|
| Wiener Index Wiener (1947) | W(G) | |
| Hyper-Wiener Index Randić (1993) | WW(G) | |
| Harary Index Plavšić et al. (1993) | H(G) | |
| Detour Index Lukovits (1996) | D(G) | |
| Detour Harary Index Fang et al. (2018) | DH(G) |
TCA drugs with their chemical structure and therapeutic uses.
TABLE 4
| Drugs | W | WW | H | D | DH |
|---|---|---|---|---|---|
| Alprazolam | 926 | 2770 | 81.4698 | 2845 | 24.1903 |
| Amitriptyline | 882 | 2780 | 70.7087 | 2581 | 26.2091 |
| Amoxapine | 1075 | 3398 | 85.8329 | 3291 | 25.4936 |
| Buspirone | 2514 | 13028 | 102.7360 | 3764 | 57.3198 |
| Clomipramine | 995 | 3194 | 78.0429 | 2861 | 28.6732 |
| Desipramine | 882 | 2780 | 70.7087 | 2581 | 26.2091 |
| Desvenlafaxine | 897 | 2846 | 71.6540 | 1329 | 46.9409 |
| Diazepam | 726 | 2077 | 69.4905 | 1901 | 24.9069 |
| Fluoxetine | 1292 | 4946 | 77.8563 | 1772 | 54.1895 |
| Imipramine | 882 | 2780 | 70.7087 | 2581 | 26.2091 |
| Lorazepam | 1034 | 3076 | 86.5452 | 2601 | 33.9740 |
| Nortriptyline | 882 | 2780 | 70.7087 | 2581 | 26.2091 |
| Oxazepam | 928 | 2731 | 80.6476 | 2362 | 30.8960 |
| Protriptyline | 882 | 2780 | 70.7087 | 2581 | 26.2091 |
| Trimipramine | 979 | 3081 | 78.4611 | 2808 | 30.3429 |
Topological indices of the drugs with explicit hydrogen.
TABLE 5
| Drugs | W | WW | H | D | DH |
|---|---|---|---|---|---|
| Alprazolam | 2936 | 10289 | 168.8604 | 7858 | 68.2119 |
| Amitriptyline | 5252 | 20371 | 239.9619 | 12117 | 126.6943 |
| Amoxapine | 3564 | 12697 | 193.5572 | 9689 | 78.4991 |
| Buspirone | 12709 | 69193 | 366.6186 | 18125 | 244.3614 |
| Clomipramine | 5462 | 21023 | 250.8310 | 12557 | 134.2503 |
| Desipramine | 4538 | 16736 | 226.4617 | 10943 | 114.0553 |
| Desvenlafaxine | 4836 | 17076 | 248.9564 | 7008 | 179.4176 |
| Diazepam | 2497 | 8380 | 154.1603 | 5741 | 71.3523 |
| Fluoxetine | 4433 | 17760 | 198.7027 | 6065 | 148.3364 |
| Imipramine | 5462 | 21023 | 250.8310 | 12557 | 134.2503 |
| Lorazepam | 2142 | 7027 | 139.4702 | 5038 | 62.4229 |
| Nortriptyline | 4346 | 16147 | 216.0927 | 10521 | 106.9993 |
| Oxazepam | 2142 | 7027 | 139.4702 | 5038 | 62.4229 |
| Protriptyline | 4267 | 15583 | 218.2697 | 10307 | 111.5984 |
| Trimipramine | 6278 | 24110 | 279.5762 | 14063 | 156.9178 |
Topological indices of the drugs with all the hydrogen.
Where, be the distance between the vertices and and be the length of the longest path between the vertices and .
The formulas for the topological indices remain the same for all the drugs, but they are calculated in two different ways according to the representation of hydrogen, one with only explicit hydrogen and other with all hydrogen. For preprocessing, all drug structure were standardized and convert into graph-based representations. These calculations are performed using Python and its libraries. RDKit is used to handle the molecular structures, NetworkX helps in creating the adjacency and distance matrices, and NumPy takes care of the numerical operations. The input for the molecular structures is provided in SMILES format—a simple text representation of molecules. First, molecules from PubChem are converted into graphs using RDKit. For explicit hydrogen calculation, the skeletal form of the molecule with Chem. MolFromSmiles (smiles) is used. And, for all hydrogen, we add explicit hydrogen atoms with Chem. AddHs(mol) which consider all the hydrogen present in a molecule.
2.3 Regression model
2.3.1 QSPR model
QSPR is a computational model which is used to predict the physical, chemical, or biological properties of molecules based on their molecular structure. QSPR models establish a mathematical relationship between molecular descriptor (topological index) and a target property (Todeschini and Consonni, 2009).
The formulation of QSPR is represented in Equation 1.where, represents the target property which is a dependent variable, represents the topological index, and is the mathematical function.
2.3.2 Linear regression
Linear regression is a method used to establish the relationship between a dependent variable and an independent variable by fitting a straight line (Zaid, 2015).
The equation is represented in Equation 2.where is the dependent variable, are the independent variables, are the regression coefficients, is the intercept term, and represents the random error.
The following LR model in Equation 3 is employed to construct a QSPR model.where, represents target property (dependent variable), represents topological index (independent variable), represents intercept or constant of regression, and represents regression coefficient.
2.3.3 SVR theory
Support Vector Machines (SVM), introduced by Vapnik and others in 1995, are based on the structural risk minimization principle and statistical learning theory (Vapnik, 2013). SVM has been successfully applied to a wide range of classification and regression problems (Cai et al., 2003b; Cai et al., 2003a; Cortes and Vapnik, 1995; Smola and Schölkopf, 2004; Rao and Gopalakrishna, 2009). When used for regression, they are called support vector regression. Traditionally, QSPR models have relied on LR to predict compound properties because it is simple and interpretable. However, LR struggles with non-linear data and is sensitive to unusual data points. SVR addresses these limitations by effectively capturing non-linear patterns and showing more accurate and reliable predictions. These advantages make SVR a strong tool for combining with topological indices in QSPR studies (Awad and Khanna, 2015; Ardeshir et al., 2021; Baştanlar and Özuysal, 2013; Yang et al., 2005).
SVR focuses on developing a predictive model between given input features and their target values. Given a training dataset , where each input represents a feature vector with dimension and represents the corresponding target value, the goal is to determine a function that can accurately map the approximate value of to .
SVR creates a function that is linear in a transformed feature space but can model complex, non-linear relationships in the original input space. This is done by applying a non-linear transformation to map the input data into a higher-dimensional space where linear regression can be performed effectively.
The regression function is defined in Equation 4.
where:
is the weight vector that defines the orientation of the regression hyperplane in the feature space,
denotes a feature mapping function that projects the input into a higher-dimensional space,
serves as a bias term, shifting the hyperplane’s position accordingly.
The major goal of the SVR model is to find the weight vector and bias that minimize a combination of two components: a regularization term, which controls model complexity, and a loss function, which measures the prediction error. The SVR optimization minimizes the objective function Equation 5 subject to constraints Equations 6-8.subject to:
where:
The term serves as a regularization factor, aiding in managing the model’s complexity.,
The parameter functions as a regularization parameter, regulating the balance between model complexity and the allowance for deviations beyond ,
The value defines the epsilon-insensitive zone (epsilon-tube) where errors within this range are not penalized in the loss function,
The slack variables and quantify the extent to which training samples fall outside the epsilon-tube, allowing the model to handle data points that do not fit perfectly within the margin.
In this study, radical basis function (RBF) has been implemented. The RBF kernel is a kernel that maps data to a higher dimensional space and is defined in Equation 9.where, is a parameter, which is equal to ( is the free parameter).
2.4 Performance evaluation
2.4.1 Coefficient of determination
In regression analysis, the most commonly used statistic to assess model performance is the coefficient of determination . It indicates how much of the variation in the response variable is explained by the model. The value of ranges from 0 to 1, where a higher signifies a better model fit (Cameron and Windmeijer, 1997).
The formula for calculating R-squared is defined in Equation 10.where, represents the actual value of the dependent variable, represents the predicted value from the regression models, and represents the mean of actual values.
2.4.2 Root mean squared error
The Root Mean Squared Error (RMSE) in the dataset is determined by taking the square root of the mean squared differences between the observed values and predicted values (Awad and Khanna, 2015; Sharma, 2005), given in Equation 11.where, is the number of the observations, is the actual value, and is the predicted value.
3 Results and discussion
In this study, a QSPR analysis of fifteen TCA drugs has been performed, to understand their physicochemical properties, which play an important role in examining their efficacy, stability, and thermodynamic behavior. The focus is on the correlations between molecular topological indices and physicochemical properties, and the impact of hydrogen atoms. SVR and LR models with explicit hydrogen and all-hydrogen were used to predict the properties based on topological indices and compared their performances to find the more accurate model.
3.1 Heatmap analysis
The heatmap analysis, as shown in Figures 2, 3, compares the correlation between topological indices and physicochemical properties under two different molecular representations: explicit hydrogen and all hydrogen. The color intensity shows the strength of these relationships, darker colors mean a stronger correlation, while lighter colors mean a weaker one.
FIGURE 2

Correlation heatmap for TCA drugs with explicit hydrogen.
FIGURE 3

Correlation heatmap for TCA drugs with all the hydrogen.
Figure 2, represents the dataset with explicit hydrogen only, shows a varied correlation pattern. The Harary Index has a strong correlation with Boiling Point (0.8180) and Flash Point (0.8021), but its correlation with Molar Refractivity (0.5291), Polarizability (0.5287), and Molar Volume (0.2315) is weaker. The Wiener and Hyper-Wiener indices show moderate relationships, especially with Molar Refractivity (0.6867) and Polarizability (0.6881). The Detour Harary Index has mostly weak correlations, as indicated by the lighter shades in the heatmap.
In contrast, Figure 3, where all hydrogen atoms are included, the correlation pattern appears more consistent. The Detour Index showed strong correlations for Molar Refractivity (0.9250), Polarizability (0.9253), and Molar Volume (0.8657). The Harary Index, which had strong correlations in Figure 1, now has much weaker correlations to Boiling Point (−0.0166) and Flash Point (−0.0793). The Detour Harary Index, which mostly has weak correlations, performs better with Molar Volume (0.8426) in this dataset.
3.2 SVR hyper-parameter tuning
The predictive model was developed using the SVR with the RBF kernel. The model was trained in Python using the scikit-learn library. The dataset was split into 80% training and 20% testing for better accuracy and validation. Hyper-parameter tuning was done to find the best values of the epsilon and cost (C) parameters, with epsilon ranging from 0.1 to 0.5 and C values set at 10, 50, 100, 500. The gamma parameter was adjusted to either “scale” or “auto” based on the requirement to achieve optimal results. To make the model more effective, 5-fold cross-validation was employed, where multiple SVR models were trained with different parameter settings. The best SVR model was trained using the optimal parameters and evaluated on the test dataset. The hyper-parameter tuning process was done separately for each physicochemical property, testing five different topological indices. The best index for each property was chosen based on the highest test value. This tuning process helped identify the best SVR models, leading to more accurate predictions and a stronger QSPR analysis. The final results, displayed in Table 6, show the best hyper-parameter values.
TABLE 6
| Property | With explicit hydrogen | With all hydrogen | ||||
|---|---|---|---|---|---|---|
| C | Gamma | C | Gamma | |||
| Boiling Point | 50 | 0.1 | Auto | 500 | 0.5 | Scale |
| Enthalpy | 10 | 0.5 | Auto | 100 | 0.1 | Scale |
| Flash Point | 50 | 0.5 | Auto | 500 | 0.2 | Scale |
| Molar Refractivity | 10 | 0.5 | Auto | 10 | 0.5 | Auto |
| Polarizability | 10 | 0.5 | Auto | 500 | 0.5 | Auto |
| Molar Volume | 50 | 0.5 | Auto | 50 | 0.1 | Scale |
Hyper-parameter tuning.
3.3 Performance comparison: LR vs. SVR
In Tables 7, 8, and RMSE values for LR and SVR models are presented for comparison. A higher indicates better accuracy and lower RMSE indicates few errors. Figures 4, 5 use bar graphs to visually compare these results. The findings suggest that SVR generally performs better, especially in all hydrogen model. However, LR showed better results for molar refractivity and polarizability, where it achieved much higher values despite SVR having slightly lower RMSEs but poor scores.
TABLE 7
| Model | Property | Best TI | RMSE | |
|---|---|---|---|---|
| SVR | Boiling Point | Harary Index | 0.9681 | 8.8991 |
| Enthalpy | Harary Index | 0.9853 | 0.7121 | |
| Flash Point | Harary Index | 0.9441 | 8.4131 | |
| Molar Refractivity | Detour Index | 0.1 | 2.9608 | |
| Polarizability | Detour Index | 0.1 | 0.8141 | |
| Molar Volume | Harary Index | 0.6308 | 10.8922 | |
| LR | Boiling Point | Harary Index | 0.6692 | 37.3973 |
| Enthalpy | Harary Index | 0.6223 | 5.1795 | |
| Flash Point | Harary Index | 0.6433 | 27.3783 | |
| Molar Refractivity | Detour Index | 0.6303 | 4.5457 | |
| Polarizability | Detour Index | 0.6253 | 1.8190 | |
| Molar Volume | Hyper-Wiener Index | 0.3662 | 22.9301 |
Comparison for configuration with explicit hydrogen only.
TABLE 8
| Model | Property | Best TI | RMSE | |
|---|---|---|---|---|
| SVR | Boiling Point | Detour Harary Index | 0.9861 | 5.8774 |
| Enthalpy | Detour Harary Index | 0.9754 | 0.9197 | |
| Flash Point | Detour Harary Index | 0.9469 | 8.1953 | |
| Molar Refractivity | Harary Index | 0.1 | 2.7451 | |
| Polarizability | Harary Index | 0.1 | 0.8444 | |
| Molar Volume | Detour Harary Index | 0.8659 | 6.5639 | |
| LR | Boiling Point | Hyper-Wiener Index | 0.1432 | 60.1869 |
| Enthalpy | Hyper-Wiener Index | 0.0938 | 8.0226 | |
| Flash Point | Hyper-Wiener Index | 0.1019 | 43.4411 | |
| Molar Refractivity | Detour Index | 0.8557 | 2.8399 | |
| Polarizability | Detour Index | 0.8562 | 1.1269 | |
| Molar Volume | Harary Index | 0.8219 | 12.1539 |
Comparison for configuration with all hydrogen.
FIGURE 4

Comparison of values.
FIGURE 5
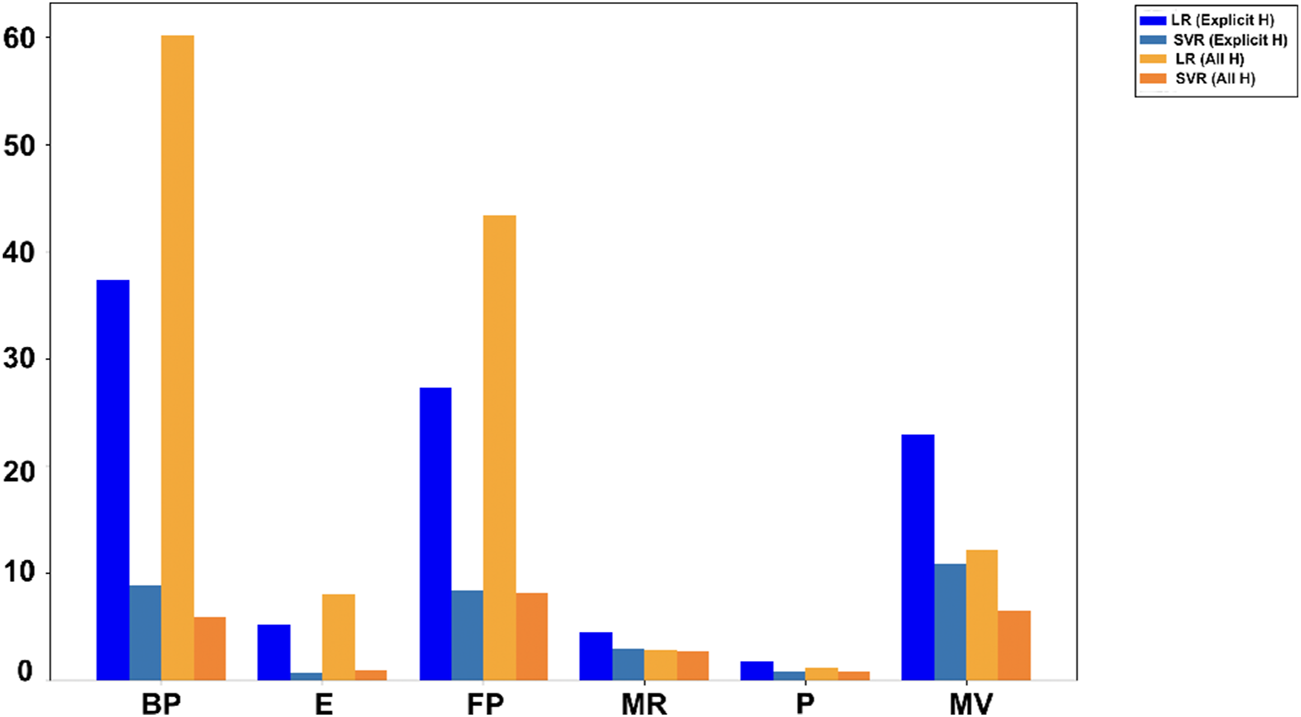
Comparison of RMSE values.
3.4 Comparison of actual vs. predicted values
It is observed from the earlier results that SVR is better than LR in term of prediction. In this section, comparison of actual values of drug properties, along with the predicted values from the SVR model and LR model, using both the explicit hydrogen and all-hydrogen are presented. Overall, the predicted values follow the actual trends closely, demonstrating the strong predictive capability of SVR for most cases.
For boiling point (Figure 6), the all-hydrogen model with SVR closely matches actual values, especially for Amoxapine, Buspirone, Desipramine, Desvenlafaxine, and Diazepam, where the explicit hydrogen model shows large errors. For Clomipramine and Oxazepam, both explicit hydrogen and all hydrogen models with SVR perform equally. In the case of Nortriptyline, both SVR and LR work well but only with the explicit hydrogen model.
FIGURE 6

Actual vs. predicted values for boiling point.
For enthalpy (Figure 7), SVR with both explicit hydrogen and all hydrogen predicts accurately for most drugs, except Alprazolam, Clomipramine, Fluxoetine, and Lorazepam. However, for Buspirone, SVR with all hydrogen and LR with explicit hydrogen both models work similarly.
FIGURE 7

Actual vs. predicted values for enthalpy.
For flash point (Figure 8), the all-hydrogen model with SVR performs best for most drugs, but the explicit hydrogen model is just as effective for Amoxapine and Oxazepam. The explicit hydrogen model with LR also performed well for few drugs like Buspirone, Desvenlafaxine and Nortriptyline.
FIGURE 8

Actual vs. predicted values for flash point.
For molar refractivity (Figure 9), SVR with both explicit hydrogen and all hydrogen model performed well for most of the drugs, except Alprazolam, Buspirone and Imipramine. However, LR with all-hydrogen also showed good accuracy for Amitriptyline, Amoxapine, Fluoxetine, Oxazepam, while for Nortriptyline, LR worked well with both models.
FIGURE 9

Actual vs. predicted values for molar refractivity.
For polarizability (Figure 10), the all-hydrogen model provides good accuracy with SVR and LR, while the explicit hydrogen did not perform well with most of the drugs. However, for Amoxapine and Nortriptyline, the explicit hydrogen model still works well.
FIGURE 10

Actual vs. predicted values for polarizability.
For molar volume (Figure 11), SVR with both explicit and all-hydrogen models performs well, but the explicit hydrogen model is more accurate. LR with the all-hydrogen model also shows good performance for a few drugs.
FIGURE 11

Actual vs. predicted values for molar volume.
These results show that molecular representation plays a key role in prediction accuracy. Both models perform well, but SVR with all-hydrogen model consistently provides more precise and accurate predictions, making it a better option for predicting drug properties. LR shows moderate performance, with occasional improvements when paired with explicit hydrogen models. This study underscores how including hydrogen in molecular structures enhances prediction accuracy.
It is evident that the SVR model generally outperformed the LR model, achieving higher and RMSE lower values, especially in capturing non-linear relationships through its use of kernel functions. This allows SVR to capture complex patterns in understanding the properties of the drugs. However, for certain properties, the LR model performs comparably or even better, suggesting linear correlations in those specific cases. SVR works well with small datasets, reducing the chance of overfitting while still giving strong predictions. Overall, because most of the data is non-linear and the drug structures vary, SVR is the better choice for predicting the physicochemical properties of the TCA drugs. However, LR can still be useful for properties that show a more linear relationship.
The findings of this study carry significant practical implications and offer a clear path for improving predictive modeling in drug discovery. It demonstrated the value of using machine learning techniques with chemically informative indices. Accurate prediction of properties is essential in the early stages of pharmaceutical development, where reliable estimation can guide compound selection. Such a framework can significantly reduce the need of time and cost experiment. Moreover, the ability to predict multiple molecular properties with high accuracy supports faster decision making in structure-activity relationship analysis. Overall, the proposed methodology offers a data-driven tool for better drug discovery pipeline by streamlining the evaluation of molecular drugs based on their predicted properties.
4 Conclusion
While SVR outperformed LR in most cases, LR also demonstrated strong performance for certain properties like molar refractivity and polarizability, making it valuable for understanding linear relationships between topological indices and specific molecular properties. These findings highlight the advantages of combining machine learning with topological indices for better drug property predictions and can guide future research and development of anti-depressant compounds. This study aims to predict the physicochemical properties of TCA drugs using a QSPR model that combines distance-based topological indices, SVR, and a traditional LR model. Two molecular configurations were analyzed: one with explicit hydrogen only and the other including all hydrogen. The results showed that including all hydrogen atoms led to stronger correlations, especially for properties like polarizability, molar refractivity, and molar volume. SVR outperformed LR in most of the cases, showing higher values and lower RMSE. This highlights that SVR is better at making predictions, notably when dealing with small-sized datasets. Hyper-parameter tuning played a key role in improving accuracy, making SVR a strong choice for predicting TCA drug properties.
In conclusion, adding all hydrogen atoms and using SVR has shown to be an effective approach for predicting the physicochemical properties of TCA drugs. It also helps in understanding the relationship between distance-based topological indices and molecular properties. While SVR outperformed LR in most cases, LR still worked well for some properties, such as molar refractivity and polarizability. This makes LR useful for understanding simple linear relationships between topological indices and specific molecular properties. These findings highlight the advantages of combining machine learning with topological indices for better drug property predictions and can guide future research and development of anti-depressants compounds. Future work could explore additional molecular configurations and different modeling techniques could to predictions more precise.
Statements
Data availability statement
All molecular structures, their properties, and their topological indices used in this study are provided as part of the main manuscript. Scripts and software for data analysis are available at the following repository: https://github.com/simran2410/tca_data.git. All necessary files and metadata are included to ensure reproducibility of the study.
Author contributions
SK: Conceptualization, Formal Analysis, Methodology, Software, Validation, Writing – original draft. JRS: Conceptualization, Supervision, Visualization, Writing – review and editing.
Funding
The author(s) declare that no financial support was received for the research and/or publication of this article.
Acknowledgments
The authors would like to take this opportunity to thank the management of Vellore Institute of Technology (VIT), Vellore, Tamil Nadu, India, for providing the necessary facilities and encouragement to carry out this work.
Conflict of interest
The authors declare that the research was conducted in the absence of any commercial or financial relationships that could be construed as a potential conflict of interest.
Generative AI statement
The author(s) declare that no Generative AI was used in the creation of this manuscript.
Publisher’s note
All claims expressed in this article are solely those of the authors and do not necessarily represent those of their affiliated organizations, or those of the publisher, the editors and the reviewers. Any product that may be evaluated in this article, or claim that may be made by its manufacturer, is not guaranteed or endorsed by the publisher.
References
1
Abubakar M. S. Aremu K. O. Aphane M. Amusa L. B. (2024a). A qspr analysis of physical properties of antituberculosis drugs using neighbourhood degree-based topological indices and support vector regression. Heliyon10, e28260. 10.1016/j.heliyon.2024.e28260
2
Abubakar M. S. Ejima O. Sanusi R. A. Ibrahim A. H. Aremu K. O. (2024b). Predicting antibacterial drugs properties using graph topological indices and machine learning. IEEE Access12, 181420–181435. 10.1109/access.2024.3503760
3
Ardeshir N. Sanford C. Hsu D. J. (2021). Support vector machines and linear regression coincide with very high-dimensional features. Adv. Neural Inf. Process. Syst.34, 4907–4918.
4
Arockiaraj M. Greeni A. B. Kalaam A. A. Aziz T. Alharbi M. (2024). Mathematical modeling for prediction of physicochemical characteristics of cardiovascular drugs via modified reverse degree topological indices. Eur. Phys. J. E47, 53. 10.1140/epje/s10189-024-00446-3
5
Awad M. Khanna R. (2015). Efficient learning machines: theories, concepts, and applications for engineers and system designers. Springer nature.
6
Baştanlar Y. Özuysal M. (2013). “Introduction to machine learning,” in miRNomics: MicroRNA biology and computational analysis, 105–128.
7
Cai C. Han L. Ji Z. L. Chen X. Chen Y. Z. (2003a). Svm-prot: web-based support vector machine software for functional classification of a protein from its primary sequence. Nucleic acids Res.31, 3692–3697. 10.1093/nar/gkg600
8
Cai C.-z. Wang W.-L. Chen Y.-z. (2003b). Support vector machine classification of physical and biological datasets. Int. J. Mod. Phys. C14, 575–585. 10.1142/s0129183103004759
9
Cameron A. C. Windmeijer F. A. (1997). An r-squared measure of goodness of fit for some common nonlinear regression models. J. Econ.77, 329–342. 10.1016/s0304-4076(96)01818-0
10
ChemSpider (2025). ChemSpider database.
11
Cortes C. Vapnik V. (1995). Support-vector networks. Mach. Learn.20, 273–297. 10.1007/bf00994018
12
Costa P. C. Evangelista J. S. Leal I. Miranda P. C. (2020). Chemical graph theory for property modeling in qsar and qspr—charming qsar and qspr. Mathematics9, 60. 10.3390/math9010060
13
Das S. Rai S. Kumar V. (2024). On topological indices of molnupiravir and its qspr modelling with some other antiviral drugs to treat covid-19 patients. J. Math. Chem.62, 2581–2624. 10.1007/s10910-023-01518-z
14
Ejima O. Abubakar M. Pawa S. S. Ibrahim A. Aremu K. (2024). Ensemble learning and graph topological indices for predicting physical properties of mental disorder drugs. Phys. Scr.99, 106009. 10.1088/1402-4896/ad79a4
15
Fang W. Liu W.-H. Liu J.-B. Chen F.-Y. Hong Z.-M. Xia Z.-J. (2018). Maximum detour-harary index for some graph classes. Symmetry10, 608. 10.3390/sym10110608
16
Fernández-Blanco E. Aguiar-Pulido V. Munteanu C. R. Dorado J. (2013). Random forest classification based on star graph topological indices for antioxidant proteins. J. Theor. Biol.317, 331–337. 10.1016/j.jtbi.2012.10.006
17
Gutman I. (2006). Chemical graph theory—the mathematical connection. Adv. Quantum Chem.51, 125–138. 10.1016/s0065-3276(06)51003-2
18
Gutman I. Polansky O. E. (2012). Mathematical concepts in organic chemistry. Springer Science and Business Media.
19
Hasani M. Ghods M. (2024). Predicting the physicochemical properties of drugs for the treatment of Parkinson’s disease using topological indices and matlab programming. Mol. Phys.122, e2270082. 10.1080/00268976.2023.2270082
20
Health and Services, H. (2023). Samhsa releases annual national survey on drug use and health.
21
Huang L. Jahanbani A. Zuo X. (2024). Investigation molecular structure of anticancer drug with topological indices. Comput. Biol. Med.179, 108806. 10.1016/j.compbiomed.2024.108806
22
Insel T. R. Voon V. Nye J. S. Brown V. J. Altevogt B. Bullmore E. et al (2013). Innovative solutions to novel drug development in mental health. Neurosci. and Biobehav. Rev.37, 2438–2444. 10.1016/j.neubiorev.2013.03.022
23
Kessler R. C. Angermeyer M. Anthony J. C. De Graaf R. Demyttenaere K. Gasquet I. et al (2007). Lifetime prevalence and age-of-onset distributions of mental disorders in the world health organization’s world mental health survey initiative. World psychiatry6, 168–176.
24
Kour S. J. R. S. (2024). Machine learning regression models for predicting anti-cancer drug properties: insights from topological indices in qspr analysis. Contemp. Math., 6515–6526. 10.37256/cm.5420245826
25
Lukovits I. (1996). The detour index. Croat. Chem. acta69, 873–882.
26
Madugula S. S. John L. Nagamani S. Gaur A. S. Poroikov V. V. Sastry G. N. (2021). Molecular descriptor analysis of approved drugs using unsupervised learning for drug repurposing. Comput. Biol. Med.138, 104856. 10.1016/j.compbiomed.2021.104856
27
Marshall J. B. Forker A. D. (1982). Cardiovascular effects of tricyclic antidepressant drugs: therapeutic usage, overdose, and management of complications. Am. heart J.103, 401–414. 10.1016/0002-8703(82)90281-2
28
Parveen S. Hassan Awan N. U. Mohammed M. Farooq F. B. Iqbal N. (2022). Topological indices of novel drugs used in diabetes treatment and their qspr modeling. J. Math.2022, 5209329. 10.1155/2022/5209329
29
Plavšić D. Nikolić S. Trinajstić N. Mihalić Z. (1993). On the harary index for the characterization of chemical graphs. J. Math. Chem.12, 235–250. 10.1007/bf01164638
30
PubChem (2025). PubChem database.
31
Randić M. (1993). Novel molecular descriptor for structure—property studies. Chem. Phys. Lett.211, 478–483. 10.1016/0009-2614(93)87094-j
32
Rao B. V. Gopalakrishna S. (2009). Hardgrove grindability index prediction using support vector regression. Int. J. Mineral Process.91, 55–59. 10.1016/j.minpro.2008.12.003
33
Sharma A. K. (2005). Text book of correlations and regression. New Delhi: Discovery Publishing House.
34
Smola A. J. Schölkopf B. (2004). A tutorial on support vector regression. Statistics Comput.14, 199–222. 10.1023/b:stco.0000035301.49549.88
35
Thapar A. Eyre O. Patel V. Brent D. (2022). Depression in young people. Lancet400, 617–631. 10.1016/s0140-6736(22)01012-1
36
Todeschini R. Consonni V. (2009). Molecular descriptors for chemoinformatics: volume I: alphabetical listing/volume II: appendices, references. John Wiley and Sons.
37
Vandel P. Bonin B. Leveque E. Sechter D. Bizouard P. (1997). Tricyclic antidepressant-induced extrapyramidal side effects. Eur. Neuropsychopharmacol.7, 207–212. 10.1016/s0924-977x(97)00405-7
38
Vapnik V. (2013). The nature of statistical learning theory. Springer science and business media.
39
Wiener H. (1947). Structural determination of paraffin boiling points. J. Am. Chem. Soc.69, 17–20. 10.1021/ja01193a005
40
Yang S. Lu W. Chen N. Hu Q. (2005). Support vector regression based qspr for the prediction of some physicochemical properties of alkyl benzenes. J. Mol. Struct. THEOCHEM719, 119–127. 10.1016/j.theochem.2004.10.060
41
Zabidi Z. M. Alias A. N. Zakaria N. A. Mahmud Z. S. Ali R. Yaakob M. K. et al (2021). Machine learning predictor models in the electronic properties of alkanes based on degree-topology indices. Int. J. Emerg. Technol. Adv. Eng.11, 1–14. 10.46338/ijetae1121_01
42
Zaid M. (2015). Correlation and regression analysis, the statistical, economic and social research and training centre for islamic countries (sesric). Available online at: http://www.oicstatcom.org/file/TEXTBOOK-CORRELATION-AND-REGRESSION-ANALYSIS-EGYPTEN.pdf (Accessed August 28, 2020).
43
Zaman S. Ahmed W. Sakeena A. Rasool K. B. Ashebo M. A. (2023). Mathematical modeling and topological graph description of dominating david derived networks based on edge partitions. Sci. Rep.13, 15159. 10.1038/s41598-023-42340-6
44
Zaman S. Yaqoob H. S. A. Ullah A. Sheikh M. (2024). Qspr analysis of some novel drugs used in blood cancer treatment via degree based topological indices and regression models. Polycycl. Aromat. Compd.44, 2458–2474. 10.1080/10406638.2023.2217990
Summary
Keywords
tricyclic anti-depressant drugs, topological indices, QSPR, linear regression, support vector regression
Citation
Kour S and Ravi Sankar J (2025) Hydrogen-centric machine learning approach for analyzing properties of tricyclic anti-depressant drugs. Front. Chem. 13:1603948. doi: 10.3389/fchem.2025.1603948
Received
01 April 2025
Accepted
15 May 2025
Published
03 June 2025
Volume
13 - 2025
Edited by
Dejan Milenković, University of Kragujevac, Serbia
Reviewed by
Rahul Pinjari, Swami Ramanand Teerth Marathwada University, India
Dapeng Wang, Chinese Academy of Sciences (CAS), China
Updates
Copyright
© 2025 Kour and Ravi Sankar.
This is an open-access article distributed under the terms of the Creative Commons Attribution License (CC BY). The use, distribution or reproduction in other forums is permitted, provided the original author(s) and the copyright owner(s) are credited and that the original publication in this journal is cited, in accordance with accepted academic practice. No use, distribution or reproduction is permitted which does not comply with these terms.
*Correspondence: J. Ravi Sankar, ravisankar.j@vit.ac.in
Disclaimer
All claims expressed in this article are solely those of the authors and do not necessarily represent those of their affiliated organizations, or those of the publisher, the editors and the reviewers. Any product that may be evaluated in this article or claim that may be made by its manufacturer is not guaranteed or endorsed by the publisher.