Abstract
A method for determining citrate content in specialty paper using headspace gas chromatography (HS-GC) is proposed. This method is based on the reaction between sodium citrate and potassium permanganate under acidic conditions, which generates CO2. The CO2 is detected by a thermal conductivity detector and the sodium citrate content is calculated using a standard curve. Optimization of the method was conducted by investigating various parameters, including gas chromatography conditions, equilibrium time, equilibrium temperature, and injection volume. The method’s accuracy and precision were assessed through method validation. The results demonstrated that the relative standard deviation (RSD) was ≤3.00%, and the recovery rate ranged from 91% to 102%, indicating good reliability and accuracy. This method is simple, rapid, and precise, making it an effective approach for the determination of citrate content in specialty paper.
1 Introduction
Specialty paper refers to paper enhanced with various additives to impart specific functions (Li et al., 2021). It is widely used in fields such as medicine (Liu et al., 2020), batteries (Stamatelos et al., 2023), tobacco (Gao et al., 2015), food packaging (Shan, 2021), and automotive electronics (Qijie et al., 2013). Cigarette paper, a type of specialty paper, benefits from the addition of combustion promoters (Jo et al., 2024). These additives not only improve the ash condensation ability and enhance ash retention (Zheng et al., 2021), but also regulate the combustion rate to improve cigarette quality (Li et al., 2010). Most importantly, combustion promoters can reduce the distinct odor and spiciness of cigarettes while lowering CO content (Yamamoto et al., 1990). However, the concentration of combustion promoters must be carefully controlled (Zhao et al., 2013). Excessive amounts may cause a mismatch between the combustion rates of the cigarette paper and tobacco, negatively affecting smoking quality. Since citrate is the most commonly used combustion promoter in cigarette paper (Resnik et al., 1977), rapid detection of its content is important.
Common methods for detecting citrate include redox titration (Meija et al., 2017), Ion chromatography (IC) (Jackson, 2000), inductively coupled plasma mass spectrometry (ICP-MS) (Wilschefski and Baxter, 2019; Veillon and Margoshes, 1968), and atomic absorption spectrometry (AAS) (Welz and Sperling, 2008). Redox titration involves using potassium permanganate for a color reaction to determine citrate content based on the consumption of the permanganate (Dybko et al., 1995). This method is complex and subject to significant operator variability in determining the endpoint. IC is an efficient chromatographic technique (Rybakova, 2023) that separates substances based on their mobility in ion exchange columns, followed by automatic detection (Jackson, 2000). It is widely used for anion and cation analysis. ICP-MS atomizes the sample, dissociates it with argon plasma, and detects it with a mass spectrometer (Wilschefski and Baxter, 2019). While this method reduces subjective error, it requires extensive sample pretreatment, which is time-consuming and may introduce residual effects on the results. The principle of AAS is based on the absorption of characteristic radiation emitted by the source, specific to the element being analyzed, by gaseous ground-state atoms of that element in the vapor phase. The concentration of the element in the sample is determined from the extent of this radiation attenuation (Welz and Sperling, 2008). While AAS is one of the most commonly used analytical techniques (Ferreira et al., 2018), it is generally applicable to the detection of metallic elements. Consequently, the citrate concentration can only be inferred indirectly from the measured Na+ concentration, a process which involves a more complex procedure.
Headspace gas chromatography (HS-GC) is an effective method for determining volatile components in complex matrix samples (Dai et al., 2021; Dai et al., 2019; Zhang et al., 2015) When the liquid or solid analyte reaches equilibrium in a sealed headspace vial, the top gas is extracted for analysis by gas chromatography (Lim and Shin, 2016). This approach minimizes interference from other complex components that may affect results when sampling directly from liquid or solid samples (Zhu and Chai, 2005). HS-GC is simple, rapid, and accurate, making it widely used in food processing, medical, chemical, and other industries (Chai and Zhu, 2000).
This paper presents a headspace gas chromatography method for measuring CO2 in headspace vials, using cigarette paper as an example. The method is based on the reaction between sodium citrate and potassium permanganate, which generates CO2 under acidic conditions. The content of sodium citrate in cigarette paper is then determined by measuring the CO2. The key focus of this study is the optimization of various parameters, including gas chromatography conditions, equilibrium time, equilibrium temperature, and injection volume. The accuracy and precision of the method were also evaluated.
2 Materials and methods
2.1 Materials
All chemicals used in the experiment—sodium citrate, sulfuric acid, and potassium permanganate—were of analytical grade. Deionized water was prepared in the laboratory.A 0.1 mol/L potassium permanganate (KMnO4) solution was prepared by accurately weighing 1.58 g of solid KMnO4 powder using an electronic balance. The powder was dissolved in a minimal volume of distilled water and transferred via glass rod into a 100 mL volumetric flask. The beaker was subsequently rinsed multiple times with small portions of distilled water, with each rinsate transferred to the flask using the glass rod. The solution was then diluted to the mark with distilled water and thoroughly mixed. A 20% dilute sulfuric acid solution was prepared by measuring 80 mL of distilled water into a 250 mL beaker. This beaker was placed in a 1,000 mL beaker containing an appropriate amount of water (acting as a cooling bath). Concentrated sulfuric acid (w/% = 95%–98%, 20 mL) was added cautiously in small aliquots to the distilled water with continuous stirring using a glass rod. The sodium citrate standard stock solution (1.94 × 10⁻³ mol/L) was prepared by accurately weighing 0.05 g of sodium citrate on an electronic balance. The solid was dissolved in distilled water and quantitatively transferred to a 100 mL volumetric flask, followed by dilution to the mark.
2.2 Apparatus and operations
The headspace gas chromatography system consists of an automatic headspace sampler (DANI HS 86.50 PLUS, Italy) and a gas chromatography system with a thermal conductivity detector (TCD) (Agilent GC 8860, United States) Headspace conditions included 20 min of equilibration at 80°C with vigorous shaking. The quantitative ring temperature is 90°C, and the transmission line temperature is 100°C. The pressurized pressure is 0.73 bar, the carrier gas pressure is 0.68 bar, the carrier gas balance time in the headspace sample bottle is 0.2 min, the pipeline inflation time is 0.2 min, and the pipeline balance time is 0.2 min. The quantitative ring volume is 3.0 mL, and the volume of each headspace sample bottle is 20.0 mL. The gas chromatography operating conditions are as follows: carrier gas is nitrogen with a flow rate of 2 mL/min, column flow rate is 15.06 mL/min, injection port temperature is 250°C, column box temperature is 95°C, and the DB-5 capillary column specifications are 30 m × 0.32 mm × 0.25 μm. The detection time is 3 min, with a split ratio of 0.1:1.
2.3 Sample preparation
To prepare the cigarette paper leaching solution, Cigarette paper (2 g) was accurately weighed using an electronic analytical balance, cut into 2 cm × 2 cm fragments, and transferred into a conical flask. Then, 100 mL of distilled water was added, and the flask was placed on an oscillator. The mixture was shaken at 130 r/min for 90 min. A small amount of 20% dilute sulfuric acid was added in increments until no bubbles were produced. Following this, 50 mL of 20% dilute sulfuric acid was added, and the supernatant was filtered into a reagent bottle for later use.
2.4 Experimental methods
1 mL of potassium permanganate solution was transferred into a headspace bottle using a pipette, and the bottle was sealed with an aluminum cap fitted with a polytetrafluoroethylene silicone rubber gasket. Then, 0.5 mL of cigarette paper leaching solution was injected into the headspace bottle using a syringe. The mixture was shaken thoroughly to ensure the leaching solution reacted with the potassium permanganate under acidic conditions. The headspace bottle was then placed into the headspace sampler for HS-GC detection. The schematic as shown in Figure 1.
FIGURE 1

Reactive principle sketch.
3 Results and discussion
3.1 Experimental principles
This method determines the content of sodium citrate by measuring the CO2 generated from the reaction of sodium citrate (chemical structure formula as shown in Figure 2) and potassium permanganate under acidic conditions. The specific reaction is shown in Equation 1:
FIGURE 2

The chemical structural formula of sodium citrate.
During the headspace gas chromatography analysis, a portion of pressurized N2 gas is injected into a closed headspace bottle, and the gas phase is released into the atmosphere through the sample ring. The connection of the sample ring is then switched, allowing the headspace sample to be injected into the GC system for measurement (Dai et al., 2017).
Pipettes were used to transfer 1, 2, 4, 6, and 8 mL of the standard stock solution into 10 mL volumetric flasks, which were then diluted to the mark with distilled water to obtain standard solutions at concentrations of 0.19 × 10⁻³, 0.39 × 10⁻³, 0.77 × 10⁻³, 1.16 × 10⁻³, 1.55 × 10⁻³, and 1.94 × 10⁻³ mol/L. A standard curve was constructed by measuring the standard solutions, as shown in Figure 3. The standard curve reveals a strong linear relationship between the GC signal value of CO2 detected by HS-GC and the sodium citrate concentration. Based on this, the sodium citrate content in cigarette paper can be determined by measuring the CO2 signal value in the headspace bottle using the HS-GC method.
FIGURE 3

The relationship between the content of sodium citrate and GC signal value.
3.2 Optimization of gas chromatography measurement conditions
Figure 4 shows the chromatogram of the sample detected using HS-GC. When N2 is used as the carrier gas, the gas chromatograph detects O2, CO2, and H2O. As seen in the figure, their peaks are well separated under the current gas chromatography conditions (RSD < 4.00%).
FIGURE 4

Chromatogram of a sample from HS-GC testing.
3.3 Optimization of headspace equilibrium conditions
A higher equilibrium temperature leads to a shorter equilibrium time, faster reaction rate, and increased experimental efficiency (Chen et al., 2020; Zhu et al., 2024). However, in the experiment, shortening the test cycle is not the only consideration, and it is also necessary to ensure the complete reaction in the headspace bottle and the safety of the headspace bottle reaction. Therefore, it is particularly important to find the appropriate equilibrium time and equilibrium temperature (Zhu et al., 2025). Figure 5 shows the effect of equilibrium time and equilibrium temperature on GC signal value. It can be seen from the figure that when the equilibrium temperature is 60°C and 70°C, the time required for the reaction to reach equilibrium is longer, which is 40 and 60 min, respectively. When the equilibrium temperature is 80°C, the reaction reaches equilibrium at 20 min. At the same time, in order to prevent the water peak from being too high, resulting in leakage of the headspace bottle, the temperature should not be too high. Therefore, in this experiment, 80°C and 20 min were selected as the equilibrium temperature and equilibrium time.
FIGURE 5
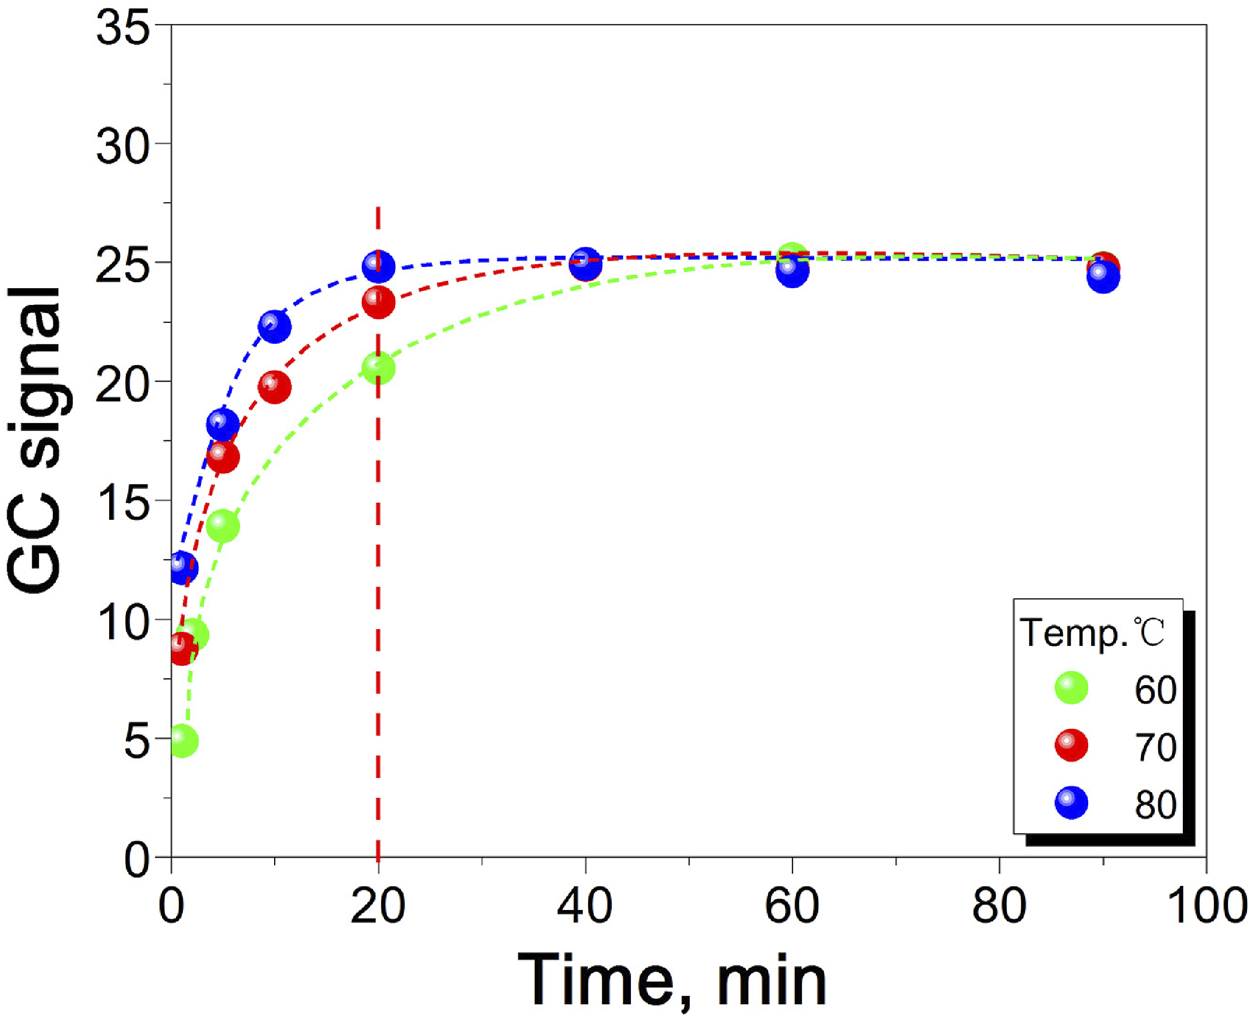
The relationship between equilibrium time, equilibrium temperature and GC signal value.
3.4 Optimization of sample injection volume
Increasing the sample injection volume enhances the sensitivity of headspace analysis (Zhang et al., 2014), but excessive injection volume can lead to several issues. First, a larger injection volume increases the time required for the reaction to reach equilibrium, extending the experimental cycle and conflicting with the principles of green chemistry. Second, an overly large injection volume can cause excessive pressure in the headspace bottle during the reaction, risking leakage or even cracking. Therefore, it is crucial to select an appropriate injection volume. Figure 6 illustrates the effect of injection volume on the GC signal value in headspace gas chromatography. The linear relationship remains strong up to a 0.5 mL injection volume, beyond which it begins to deteriorate. Considering the need to avoid excessive injection volume, 0.5 mL was chosen for this experiment.
FIGURE 6

The effect of injection volume on GC signal value.
3.5 Method evaluate
3.5.1 Method calibration
Take 1 mL of 0.1 mol/L potassium permanganate solution and add it to a headspace bottle. Then, add 1 mL of 20% dilute sulfuric acid into the same bottle. After sealing the bottle with the cap, inject 0.5 mL of the standard solution with a gradient concentration using a syringe. The headspace bottle is then shaken and placed in the HS-GC for measurement to obtain the standard curve. The results show a strong linear relationship between the GC signal value of CO2 and the concentration of sodium citrate. The linear relationship can be expressed as Equation 2:
The limit of quantitation (LOQ) of this method for the detection of sodium citrate content can be calculated by Equation 3:
In the formula, a, s and Δa represent the intercept, slope, and standard deviation of the intercept from Equation 2, respectively. The quantitative limit of this method for detecting sodium citrate in cigarette paper can be calculated using Equation 3, yielding a value of 0.18 × 10⁻³ mol/L.
3.5.2 Precision and validation evaluation
Precision is a key parameter for evaluating the uncertainty of experimental results and is essential for ensuring accuracy. In this experiment, three different cigarette paper samples underwent five sets of repeated tests under the optimized conditions, as shown in Table 1. The relative standard deviation (RSD%) for all three sample groups was ≤3.00%, indicating that the method demonstrates good precision.
TABLE 1
| Replica no. | GC signal | ||
|---|---|---|---|
| Sample 1 | Sample 2 | Sample 3 | |
| 1 | 34.87 | 30.23 | 24.81 |
| 2 | 34.92 | 29.48 | 24.85 |
| 3 | 33.72 | 30.67 | 24.81 |
| 4 | 34.66 | 28.41 | 25.63 |
| 5 | 34.94 | 29.17 | 25.44 |
| Average | 34.62 | 29.59 | 25.11 |
| RSD (%) | 1.56 | 3.00 | 1.58 |
Repeatability of the method.
To verify the accuracy of the method, a recovery experiment was conducted. Standard solutions of 0.39, 0.77, 1.16, 1.55, and 1.94 × 10⁻³ mol/L were added to five samples. The concentration of sodium citrate was calculated based on the GC signal value measured under optimized conditions, and the concentration of sodium citrate in the sample without the standard was subtracted. The recovery rate was determined by the ratio of the calculated concentration a to the initial concentration b. The results in Table 2 show that the recovery rate of sodium citrate ranges from 91% to 102%, indicating that the method has good accuracy.
TABLE 2
| Sample ID | The content of sodium citrate (10−3 mol/L) | RSD (%) | ||
|---|---|---|---|---|
| Added (a) | Measured (b) | Recovery (%) | ||
| 1 | 0.39 | 0.43 | 91 | 3.06 |
| 2 | 0.77 | 0.81 | 96 | 2.98 |
| 3 | 1.16 | 1.13 | 103 | 2.37 |
| 4 | 1.55 | 1.56 | 99 | 3.61 |
| 5 | 1.94 | 1.90 | 102 | 3.07 |
Method validation.
To assess the reliability of the reaction system, the prepared potassium permanganate (KMnO4) solution was placed in the bottom compartment of a headspace vial. Using a syringe, 0.5 mL of sodium citrate solution (containing excess acid) was injected into the vial, followed by vortex mixing. The vial was then equilibrated at 80°C for durations of 1, 5, 10, 20, and 60 min prior to HS-GC analysis. Triplicate experiments were performed for each time point. As shown in Table 3, all relative standard deviations (RSD) were below 5%, demonstrating that the reaction solution exhibits excellent stability throughout the analytical cycle.
TABLE 3
| Equilibrium time (min) | GC signal | RSD (%) | ||
|---|---|---|---|---|
| Sample 1 | Sample 2 | Sample 3 | ||
| 1 | 11.77 | 11.99 | 12.72 | 4.09 |
| 5 | 17.54 | 18.17 | 18.11 | 1.94 |
| 10 | 19.89 | 21.45 | 22.29 | 2.80 |
| 20 | 24.81 | 24.85 | 25.63 | 1.84 |
| 60 | 24.76 | 25.41 | 24.93 | 1.35 |
Stability test of reaction solution.
4 Conclusion
This study presents a rapid quantitative method for determining citrate content in specialty papers based on headspace gas chromatography (HS-GC). By innovatively leveraging the quantitative generation of CO2 from citrate under acidic potassium permanganate (KMnO4) conditions, this work achieves for the first time highly selective indirect detection of the target analyte within complex paper-based matrices. Optimization studies identified 80°C and 20 min as the optimal equilibrium temperature and time, respectively, with a 0.5 mL headspace injection volume proving most suitable. The method demonstrates superior precision (RSD ≤3.00%) and accuracy (standard addition recovery rate: 91%–102%), significantly outperforming conventional techniques. Crucially, by directly detecting gaseous CO2, this approach effectively circumvents interference from pulp matrices. Combined with its solvent-free green pretreatment workflow, it offers the specialty paper industry—particularly for combustion regulator control in cigarette paper—an efficient, economical, and reliable quality control solution. Furthermore, its operational simplicity, rapid analysis, high precision, and accuracy not only provide key technical support for optimizing paper functional performance (e.g., combustion modulation, CO reduction) but also establish a novel approach for detecting anionic additives in paper-based materials (Li et al., 2023).
Statements
Data availability statement
The original contributions presented in the study are included in the article/supplementary material, further inquiries can be directed to the corresponding authors.
Author contributions
QH: Writing – original draft, Conceptualization. BY: Writing – review and editing, Investigation. XL: Writing – review and editing, Methodology. HZ: Data curation, Writing – original draft. ZY: Methodology, Writing – review and editing. YZ: Validation, Writing – review and editing. CG: Visualization, Data curation, Writing – review and editing. WC: Writing – review and editing, Supervision. YL: Writing – review and editing, Validation. JX: Writing – review and editing, Resources, Project administration. YD: Supervision, Writing – review and editing, Validation, Funding acquisition.
Funding
The author(s) declare that financial support was received for the research and/or publication of this article. The authors declare that this study received funding from China Tobacco Yunnan Industrial Co., Ltd. The funder was not involved in the study design, collection, analysis, interpretation of data, the writing of this article.
Acknowledgments
Thanks to Yunnan Tobacco Industrial Co., Ltd., for providing paper sample testing. The authors acknowledge the financial support from the Major Special Projects of China Tobacco Yunnan Industrial Co., Ltd. (Project No. 2023CL03).
Conflict of interest
Authors BY, XL, ZY, YZ, and JX were employed by China Tobacco Yunnan Industrial Co. Ltd.
The remaining authors declare that the research was conducted in the absence of any commercial or financial relationships that could be construed as a potential conflict of interest.
Generative AI statement
The author(s) declare that no Generative AI was used in the creation of this manuscript.
Publisher’s note
All claims expressed in this article are solely those of the authors and do not necessarily represent those of their affiliated organizations, or those of the publisher, the editors and the reviewers. Any product that may be evaluated in this article, or claim that may be made by its manufacturer, is not guaranteed or endorsed by the publisher.
References
1
Chai X. Zhu J. (2000). Applications of headspace gas chromatography in the pulp and paper industry. Transw. Res. Netw., 1–14.
2
Chen J. Xie J. Zhang Z. Wang F. Hu J. Li H. (2020). Rapid and accurate determination of carboxyl groups in carbon materials by headspace gas chromatography. J. Chromatogr. A1621, 461062. 10.1016/j.chroma.2020.461062
3
Dai Y. Wang H. Xie J. Zhan J.-B. Yu Z.-H. Chai X.-S. (2021). Simultaneous determination of amphiphobicities of material surface by A dual-indicator headspace gas chromatography. J. Chromatogr. A1649, 462230. 10.1016/j.chroma.2021.462230
4
Dai Y. Yu Z.-H. Zhan J.-B. Chai X.-S. Zhang S.-X. Xie W.-Q. et al (2017). A pressure-affected headspace-gas chromatography method for determining calcium carbonate content in paper sample. J. Chromatogr. A1507, 32–36. 10.1016/j.chroma.2017.05.052
5
Dai Y. Yu Z.-H. Zhan J.-B. Yue B.-S. Xie J. Wang H. et al (2019). Determination of starch gelatinization temperatures by an automated headspace gas chromatography. J. Chromatogr. A1602, 419–424. 10.1016/j.chroma.2019.05.054
6
Dybko A. Maciejewski J. Brzozka Z. Wroblewski W. Romaniuk R. S. (1995). Application of optical fibres in oxidation-reduction titrations. Sensors Actuators B Chem.29 (1-3), 374–377. 10.1016/0925-4005(95)01710-0
7
Ferreira S. L. C. Bezerra M. A. Santos A. S. dos Santos W. N. L. Novaes C. G. de Oliveira O. M. C. et al (2018). Atomic absorption spectrometry – a multi element technique. TrAC Trends Anal. Chem.100, 1–6. 10.1016/j.trac.2017.12.012
8
Gao W. Chen K. Yang R. Yang F. (2015). Process for coating of reconstituted tobacco sheet with citrates. J. Anal. Appl. Pyrolysis114, 138–142. 10.1016/j.jaap.2015.05.013
9
Jackson P. E. (2000). Ion chromatography in environmental analysis. Encycl. Anal. Chem.2779–2801, 1–23.
10
Jo H. M. Lee J. Y. Kim T. Y. (2024). Application of surface-modified carboxymethylated nanofibrillated cellulose as a strength enhancer for specialty paper. BioResources19 (3), 5586–5598. 10.15376/biores.19.3.5586-5598
11
Li A. Xu D. Luo L. Zhou Y. Yan W. Leng X. et al (2021). Overview of nanocellulose as additives in paper processing and paper products. Nanotechnol. Rev.10 (1), 264–281. 10.1515/ntrev-2021-0023
12
Li C. Tian S. You J. Liu J. Li E. x. Wang C. et al (2023). Qualitative determination of volatile substances in different flavored cigarette paper by using headspace-gas chromatography-ion mobility spectrometry (HS-GC-IMS) combined with chemometrics. Heliyon9 (1), e12146. 10.1016/j.heliyon.2022.e12146
13
Li H. Liu Y. Li D. Cai B. Chen Y. Cheng Z. (2010). Effect of combustion improver on combustion behavior of cigarette paper by simultaneous TG/DSC detection. Chin. J. Chem.28 (8), 1322–1326. 10.1002/cjoc.201090227
14
Lim H.-H. Shin H.-S. (2016). Determination of volatile organic compounds including alcohols in refill fluids and cartridges of electronic cigarettes by headspace solid-phase micro extraction and gas chromatography–mass spectrometry. Anal. Bioanal. Chem.409 (5), 1247–1256. 10.1007/s00216-016-0049-0
15
Liu K. Wang H. Liu H. Nie S. Du H. Si C. (2020). COVID-19: challenges and perspectives for the pulp and paper industry worldwide. Bioresources15 (3), 4638–4641. 10.15376/biores.15.3.4638-4641
16
Meija J. Michałowska-Kaczmarczyk A. M. Michałowski T. (2017). Redox titration challenge. Anal. Bioanal. Chem.409 (1), 11–13. 10.1007/s00216-016-0020-0
17
Qijie C. Fushan C. Yongxiang Y. (2013). Fluorescent semiconductor nanocrystals, A promising fluorescent anti-counterfeiting material for specialty paper. Bioresources8 (1), 6–7.
18
Resnik F. Houck W. Geiszler W. (1977). Factors affecting static burning rate. Magnesium4, 1–5.
19
Rybakova E. V. (2023). Origins and formation of ion chromatography. J. Anal. Chem.78 (8), 1105–1114. 10.1134/s1061934823080130
20
Shan N. (2021). Research on color management of printing images on Bazhong specialty paper packaging. J. Opt.50 (4), 637–643. 10.1007/s12596-021-00729-4
21
Stamatelos I. Rentzsch M. Liu C. Bauer F. Barwe S. Robert M. (2023). Electrocatalytic functionalized specialty paper as low‐cost porous transport layer material in CO2‐electrolysis. ChemCatChem16 (2). 10.1002/cctc.202300980
22
Veillon C. Margoshes M. (1968). An evaluation of the induction-coupled, radio-frequency plasma torch for atomic emission and atomic absorption spectrometry. Spectrochim. Acta Part B At. Spectrosc.23 (8), 503–512. 10.1016/0584-8547(68)80030-8
23
Welz B. Sperling M. (2008). Atomic absorption spectrometry. John Wiley and Sons.
24
Wilschefski S. C. Baxter M. R. (2019). Inductively coupled plasma mass spectrometry: introduction to analytical aspects. Clin. Biochem. Rev.40 (3), 115–133. 10.33176/aacb-19-00024
25
Yamamoto T. Umemura S. Kaneko H. (1990). Effect of exogenous potassium on the reduction in Tar, nicotine and carbon monoxide deliveries in the mainstream smoke of cigarettes. Contributions Tob. and Nicotine Res.14, 379–385. 10.2478/cttr-2013-0613
26
Zhang C.-Y. Chai X.-S. Barnes D. G. (2015). A novel solvent-assisted vapor absorption based headspace analysis technique for the determination of diffusion and solid–air partition coefficients of methanol in paper materials. Fluid Phase Equilibria399, 74–79. 10.1016/j.fluid.2015.04.028
27
Zhang C.-Y. Hu H.-C. Chai X.-S. Pan L. Xiao X.-M. (2014). Determination of maximal amount of minor gases adsorbed in a shale sample by headspace gas chromatography. J. Chromatogr. A1328, 80–84. 10.1016/j.chroma.2013.12.075
28
Zhao D. Chen K. Yang F. Feng G. Sun Y. Dai Y. (2013). Thermal degradation kinetics and heat properties of cellulosic cigarette paper: influence of potassium carboxylate as combustion improver. Cellulose20 (6), 3205–3217. 10.1007/s10570-013-0024-2
29
Zheng H. Zhan J. Yu Z. Li G. Wang T. Zhang Y. et al (2021). Study on ash gray and ash condensation index evaluation during combustion of medium cigarettes. J. Phys. Conf. Ser.2044 (1), 012017. 10.1088/1742-6596/2044/1/012017
30
Zhu H. He Q. Zhang T. Wang H. Li H. Yu K. et al (2024). Determination of specific surface area of biomass activated carbon vial headspace gas chromatography technique. J. Chromatogr. A1734, 465289. 10.1016/j.chroma.2024.465289
31
Zhu H. Zheng H. Zhang T. He Q. Li H. Yang T. et al (2025). Determination of carbonation rate of precipitated calcium carbonate in carbonation process based on headspace gas chromatography. J. Chromatogr. A1741, 465616. 10.1016/j.chroma.2024.465616
32
Zhu J. Y. Chai X. S. (2005). Some recent developments in headspace gas chromatography. Curr. Anal. Chem.1 (1), 79–83. 10.2174/1573411052948488
Summary
Keywords
citrate, specialty paper, headspace, GC, combustion promoters
Citation
He Q, Yue B, Liu X, Zhu H, Yu Z, Zhang Y, Gao C, Chen W, Luo Y, Xie J and Dai Y (2025) Determination of citrate content in specialty paper based on headspace gas chromatography. Front. Chem. 13:1643516. doi: 10.3389/fchem.2025.1643516
Received
09 June 2025
Accepted
24 June 2025
Published
04 July 2025
Volume
13 - 2025
Edited by
Shuangquan Yao, Guangxi University, China
Reviewed by
Antonella Ilenia Alfano, University of Naples Federico II, Italy
Sreenivas Pippalla, Hikma Pharmaceuticals USA Inc., United States
Updates
Copyright
© 2025 He, Yue, Liu, Zhu, Yu, Zhang, Gao, Chen, Luo, Xie and Dai.
This is an open-access article distributed under the terms of the Creative Commons Attribution License (CC BY). The use, distribution or reproduction in other forums is permitted, provided the original author(s) and the copyright owner(s) are credited and that the original publication in this journal is cited, in accordance with accepted academic practice. No use, distribution or reproduction is permitted which does not comply with these terms.
*Correspondence: Jiao Xie, xiejiao0215@qq.com; Yi Dai, daiyi2020@gzmu.edu.cn
Disclaimer
All claims expressed in this article are solely those of the authors and do not necessarily represent those of their affiliated organizations, or those of the publisher, the editors and the reviewers. Any product that may be evaluated in this article or claim that may be made by its manufacturer is not guaranteed or endorsed by the publisher.