 Xiping Chen
 Leika Du2
 Qinghua Zhang
 Jiankun Hu
- 1Marine Science and Technology College, Zhejiang Ocean University, Zhoushan, Zhejiang, China
- 2Zhejiang Feijing New Material Science & Technology Co., Ltd., Zhoushan, Zhejiang, China
- 3Donghai Laboratory, Zhoushan, Zhejiang, China
- 4College of Chemical and Biological Engineering, Zhejiang University, Hangzhou, Zhejiang, China
Introduction: Silicone-based low-surface-energy antifouling coatings are environmentally friendly, but their widespread application is hindered by the inherent challenge of achieving a balance between mechanical durability and antifouling efficacy.
Methods: This study developed a novel multifunctional anchoring material, N,N’-bis(12-hydroxystearoyl)-1,3-phenylenediamine (A), via a condensation reaction. Silicone antifouling coatings were then synergistically modified with A, molybdenum disulfide (MoS2), and polytetrafluoroethylene (PTFE), followed by room-temperature crosslinking to form a composite coating.
Results: The incorporation of 1% A significantly enhanced the coating’s performance: surface roughness was reduced by 33% (from 1.12 μm to 0.75 μm), the water contact angle increased from 118.2° to 122.7°, and tensile strength was improved by 85% (from 1.08 MPa to 2.00 MPa). The elastic modulus increased by 130%, while underwater friction decreased by 64% (from 2.41 ± 0.09 N to 0.87 ± 0.04 N). The coating demonstrated exceptional durability, with an average surface roughness (Sa) remaining below 2.65 μm after 2000 abrasion cycles. Furthermore, it exhibited outstanding self-cleaning efficiency (>97.1 ± 0.87%) and antibacterial rates (>94.5 ± 1.78%). Marine field tests confirmed effective antifouling performance for over 90 days during peak fouling season.
Discussion: The synergistic effect of A, MoS2, and PTFE successfully overcame the key limitations of traditional low-surface-energy coatings—poor mechanical strength and weak wear resistance. This work provides a breakthrough in designing high-performance, durable antifouling coatings with strong potential for practical applications, particularly in underwater cleaning robotics.

1 Introduction
The shipping industry serves as a critical enabler of global trade and economic integration (Zhou et al., 2023). However, marine biofouling poses significant challenges, including hull structural degradation, elevated fuel consumption, and the introduction of invasive species into non-native ecosystems (Iswadi et al., 2022; Thach and Van Hung, 2024). To address these issues, various antifouling strategies have been explored, such as electrochemical treatments (Deng et al., 2025), ultrasonic cleaning (Zhong et al., 2022), mechanical removal (Chen et al., 2023), and antifouling coatings (Deng et al., 2021; Xu et al., 2025; Yang et al., 2025). Among these, antifouling coatings are widely regarded as one of the most economically viable solutions (Zang et al., 2024).
Zwitterionic polymer antifouling coatings and biomimetic antifouling coatings have emerged as prominent research focuses (Dai et al., 2024; Liu et al., 2024; Murali et al., 2024; Roeven et al., 2021)). However, their commercialization remains challenging due to high production costs and complex fabrication processes (Chen et al., 2021; Muadtrap et al., 2025). In contrast, silicone-based low-surface-energy coatings, characterized by mature preparation techniques, long-term antifouling efficacy, and eco-friendly advantages, are considered a key development direction in marine antifouling technologies (He et al., 2023).
Furthermore, regulatory requirements for pre-port hull cleaning in countries such as Australia and New Zealand have imposed additional demands on antifouling coatings (Xavier et al., 2025). To meet underwater cleaning standards, it is essential to develop coatings that combine low surface energy with wear resistance. However, existing low-surface-energy coatings often suffer from insufficient mechanical strength, leading to coating damage during cleaning processes and compromised antifouling performance, thereby limiting their application in intelligent cleaning systems (Chu et al., 2024).
To overcome this technical hurdle, numerous research efforts have been undertaken. For instance, Liu et al. incorporated lignin into superhydrophobic coatings, demonstrating remarkable wear resistance with water contact angles maintained above 150° after 30 sand abrasion cycles (Liu et al., 2022). Zhang et al. achieved significant improv-ments in coating durability by introducing PDMS, enabling the material to maintain excellent integrity even after 200 friction cycles (Zhang et al., 2025). Similarly, Xiang et al. enhanced the flexibility of textile-based coatings by incorporating nano-ZnO/PVSQ composites, resulting in an 18% increase in fracture elongation (Feng et al., 2024). Further advancing this field, Sun et al. developed hydrophobic Al2O3/SiO2/PDMS composite coatings, which exhibited a remarkable 250% improv-ment in fracture elongation (Sun et al., 2022). Wang et al. developed carbon nanotube-reinforced PTFE coatings exhibiting exceptional hydrophobicity (154.1° ± 2° contact angle) that retained their superhydrophobic properties even after 500 abrasion cycles under 50 g/cm2 pressure (Wang et al., 2017). In another approach, Liao et al. significantly enhanced the tribological performance of polyetheretherketone (PEEK) by introducing graphite/PTFE composites, achieving an 80% reduction in friction coefficient and an order of magnitude decrease in wear rate under 10 N loading conditions (Liao et al., 2022). However, these modifications failed to simultaneously optimize wear resistance, flexibility, and fouling resistance while introducing particle agglomeration issues. Guru et al. demonstrated that incorporating 3% molybdenum disulfide (MoS2) could effectively improve both tribological and antifouling properties of PTFE coatings, though the dispersion challenges of MoS2 remained unresolved (Guru et al., 2024). To improve filler dispersion, Yamada et al. employed 12-hydroxystearic acid (12-HSA) as a dispersant for carbon powder, while Meng et al. achieved superior dispersion of cobalt nanoparticles in octane using 12-HSA compared to stearic acid (SA) and oleic acid (OA) (Lu et al., 2005; Meng et al., 2013; Yamada et al., 2015). Although 12-HSA can mitigate particle agglomeration through hydroxyl-alkyl chain synergy, its gelation effect adversely affects coating viscosity and storage stability (Fameau and Rogers, 2020). To date, a universally effective solution to these challenges remains elusive.
This study synthesized a multifunctional anchoring material, N,N′-Bis(12-hydroxystearoyl)-1,3-phenylenediamine (A), via condensation reactions. The structure of A was characterized by FT-IR and 1H NMR. Subsequently, A was blended with MoS2 and PTFE, then dispersed into the silicone resin system. Room-temperature crosslinking produced a novel, mechanically robust antifouling coating. The results showed that adding 1% A reduced surface roughness by 33% (from 1.12 μm to 0.75 μm), increased the contact angle from 118.2° to 122.7°, enhanced tensile strength by 85% (from 1.08 MPa to 2.00 MPa), and improved elastic modulus by 130%. Additionally, underwater friction decreased by 64% (from 2.41 N to 0.87 N), and after 2,000 abrasion cycles, the average surface roughness (Sa) remained below 2.65 μm. All coatings exhibited >97.1 ± 0.87% self-cleaning efficiency and >94.5 ± 1.78% antibacterial rates. Field tests demonstrated over 90 days of antifouling efficacy during peak biofouling seasons. The synergistic interaction of A, MoS2, and PTFE addressed the key limitations of traditional low-surface-energy coatings—insufficient strength and poor wear resistance. This work provides a breakthrough for antifouling applications and new insights into coating design for underwater cleaning robotics.
2 Experimental section
2.1 Materials
12-Hydroxystearic acid (12-HSA, ≥98%, Shanghai Titan Scientific), m-phenylenediamine (PDA, ≥99%, Aladdin), molybdenum disulfide (MoS2, ≥99.5%, Aladdin), polytetrafluoroethylene powder (PTFE, ≥99%, Aladdin), and hydrogen-terminated silicone oil (821, viscosity 50 Pa·s, Quzhou Haina) were used as primary materials. Other chemicals included xylene (Xy, analytical grade), azobisisobutyronitrile (AIBN, analytical grade), dibutyltin dilaurate (DBTDL, catalyst grade), Polydimethylsiloxane (PDMS, 50 mPa·s) and copper (II) chloride dihydrate (CuCl2·2H2O, reagent grade), all sourced from Aladdin.
2.2 Preparation of N,N′-Bis(12-hydroxystearoyl)-1,3-phenylenediamine (A)
Under an anhydrous argon atmosphere, 12-hydroxystearic acid (12-HSA, 150.27 g) was melted at 130 °C m-Phenylenediamine (PDA, 34.05 g) was then added dropwise to the molten 12-HSA over 6 h under continuous stirring. The reaction mixture was maintained at 130 °C until the amount of condensed water reached 95%–98% of the theoretical value (calculated for complete amidation), affording N,N′-Bis(12-hydroxystearoyl)-1,3-phenylenediamine (A) as a pale yellow waxy solid. It is used after recrystallization of ethanol twice. The synthetic pathway is depicted in Scheme 1. Table 1 is the formulation and composition of coatings with varying A, MoS2 (M), and PTFE (F) contents.

Scheme 1. Synthesis of N,N′-Bis(12-hydroxystearoyl)-1,3-phenylenediamine (A).

Table 1. Coating composition design matrix.
Subsequently, A, MoS2, and PTFE were mixed with hydrogen-terminated silicone oil (821), PDMS, and xylene solvent according to the proportions specified in Table 1. The mixture was ground for 1 h under condensate water cooling and argon protection, filtered, and then the crosslinking agent DBTDL was added. The resulting mixture was cured at room temperature for 48 h to ultimately form the composite coating.
A: N,N′-Bis(12-hydroxystearoyl)-1,3-phenylenediamine, a synthesized anchoring material en-hancing mechanical and antifouling properties.
821: Hydrogen-terminated silicone oil (viscosity 50 Pa s), used as the base resin for crosslink-ing.
PDMS: Polydimethylsiloxane (50 mPa s), added at 10 wt% to regulate coating rheology.
Xy: Xylene, an organic solvent for uniform dispersion of components.
Subscripts (X, Y, Z) denote variable weight percentages of A, PTFE, and MoS2, respectively, as detailed in the experimental design.
2.3 Coating swelling ratio
The gravimetric method was used to monitor the in situ dissolution of each coating. Each slide was weighed before and after coating to determine the initial dry weight (Wdry) of each sample. Three slides were used for each coating to obtain the mean and deviation. The coated slides were immersed in artifical seawater (ASW, prepared according to ASTM D 1141) containers that were changed every other day and weighed after a certain period of time (Wwet). Both Wdry and Wwet needed to be adjusted by subtracting the initial weight of the slides (W0).
The swelling behavior of coatings was quantitatively evaluated using a gravimetric method. Prior to testing, glass slides were precisely weighed (W0) using an analytical balance (±0.1 mg). After coating application, the initial dry weight was determined by subtracting W0 from the coated slide weight. For statistical reliability, triplicate samples were prepared for each coating formulation.The swelling ratio (Q) was calculated as
providing a quantitative measure of the coating’s water absorption characteristics.
The coated slides were immersed in ASW contained in sealed vessels. The ASW was renewed every 48 h to maintain consistent ionic strength. At predetermined intervals, samples were carefully removed, surface-dried with lint-free tissue, and immediately weighed to obtain the wet weight.
2.4 Coating surface morphology
The soaked slides were subjected to 2000 cycles of abrasion under a reciprocating friction and abrasion tester (220 N load, steel wool), and the coated surfaces before and after the abrasion were observed through high-depth microscopy VHX-6000.
2.5 Surface wettability
Static water contact angles were measured using a Kruss DSA100 goniometer (25 °C ± 0.5 °C, 50% ± 5% RH) following ASTM D 7334 standards. A precision microsyringe deposited 2 μL deionized water droplets (Milli-Q, 18.2 MΩ cm) vertically onto the cured coating surface. Droplet profiles were captured at 1,000 fps using an integrated high-speed camera, with the instrument software applying Young–Laplace fitting to determine contact angles. Five measurements were taken at different surface locations and averaged to ensure statistical significance (reported as mean ± standard deviation).
2.6 Underwater friction and wear testing
The coating solution was applied onto glass slide substrates and allowed to cure for 48 h. The cured samples were then immersed in artificial seawater for 24 h prior to testing. The coefficient of friction was measured using a tribometer equipped with an underwater testing chamber under a 310 N normal load.
The coating was uniformly applied onto standard glass slides and cured for 48 h. Wear resistance was evaluated using a reciprocating friction tester, where the coated samples underwent 2,000 abrasion cycles at a frequency of 60 cycles per minute (1 Hz) under a 220 N normal load, with Grade #0000 steel wool as the abrasive counterpart.
In this study, the mechanical stability of the coatings was evaluated by examining the correlation between the coefficient of friction and wear rate (Yan et al., 2016; Zhao and Zou, 2019).
Δm: mass difference before and after wear (mg, accuracy ±0.1 mg); ρ: coating density; Fn: load (N); S: sliding distance (cm).
2.7 Mechanical property tests
The coating solution was uniformly cast into polytetrafluoroethylene (PTFE) molds (50 × 10 × 1 mm3) and cured at room temperature for 48 h. After demolding, the resulting specimens were precisely cut into standard Type V dumbbell-shaped tensile bars compliant with ASTM D 638. Tensile properties were characterized using a universal testing machine (Instron 5,966 series) at a crosshead speed of 5 mm/min under ambient conditions (23 °C ± 2 °C, 50% ± 5% RH). The tensile strength and elastic modulus were calculated from the stress-strain curves, with five replicates tested for statistical reliability.
2.8 Self-cleaning tests
The self-cleaning property was assessed using copper (II) chloride dihydrate (CuCl2·2H2O) particles as model inorganic foulants. The particles were deposited on coated surfaces and subsequently removed with deionized water droplets to evaluate cleaning efficiency.
2.9 Antimicrobial performance test
Antimicrobial performance against Escherichia coli and Staphylococcus aureus was examined via plate counting. Coated samples were sterilized, immersed in bacterial suspension (108 CFU/mL), and incubated at 37 °C for 5 h. Surface-adhered bacteria were collected by ultrasonic agitation, serially diluted, plated on LB agar, and quantified using ImageJ software.
2.10 Anti-fouling test for shallow sea mounted panels
The antifouling capacity test is carried out in accordance with the national marine antifouling coatings shallow sea experimental standard. Each coating was apply on the substrate, 300 × 250 × 3 mm3, at the bottom was epoxy zinc rich primer, and the finish coating was our experimental antifouling paint as prepared for testing. Three sets of parallel samples were prepared for each coating to test their antifouling capability at different depths in the ocean. After coating, the four corners of samples were fixed on the hanger with stainless steel bolts. After the installation completed, the hanger was placed on the experimental floating raft in the testing sea area. The experimental sea area is located in the offshore of Louman’s sheltered bay, Zhoushan, subtropical sea, the velocity of seawater is lower than 5 m/s, the azimuth is 30 o 01′N, 122 o 06′E, the test depth: 0.3–2.0 m, the testing lasted for 90 days, the main fouling organism attached to the board are algae and silt.
3 Results and discussion
3.1 Structural spectral analysis of A
As shown in Figure 1, the 1H NMR spectrum of the synthesized compound A revealed characteristic proton signals at:7.20–7.40 ppm (multiplet, 4H, aromatic protons), 4.40 ppm (doublet, 2H, benzylic CH adjacent to amide group), 2.20 ppm (triplet, 2H, α-carbonyl CH2), 1.20–1.60 ppm (multiplet, 31H, methylene protons), 0.88 ppm (triplet, 3H, terminal methyl group). The hydroxyl proton signal was not detected, likely due to hydrogen bonding-induced peak broadening. All observed chemical shifts and splitting patterns were consistent with the expected structure of A.

Figure 1. 1H NMR spectrum of A with expansions. Proton designations in the structure (a–c) correspond to: aromatic (a), benzylic (b), and α-carbonyl methylene (c) environments. Expanded views are provided for regions b and c.
As shown in Figure 2, FTIR spectroscopy confirmed the formation of amide bonds with characteristic absorption bands at:3,307 cm-1 (N-H stretching vibration), 2,849–2,921 cm-1 (C-H stretching of aliphatic chains), 1,645 cm-1 (C=O stretching of amide I band), 1,551 cm-1 (amide II band, coupling of N-H bending and C-N stretching), 720 cm-1 (aromatic C-H out-of-plane bending).The combined NMR and FTIR data conclusively demonstrated the successful amidation reaction between m-phenylenediamine and 12-hydroxystearic acid to form the target compound A.

Figure 2. FTIR spectroscopic analysis of A.
3.2 Dissolution rate of coatings
To investigate the influence of A, M (MoS2), and F (PTFE) on coating hydrophilicity, we measured the water swelling ratio of various formulations (Figure 3). Three experimental series were examined: AXM3F3 Series (constant M/F at 3 wt%, varying A):When A content was 0, 0.5%, 1%, 1.5%, and 2%, the swelling ratios were 1.24%, 0.78%, 0.57%, 0.54%, and 0.52% respectively, demonstrating that hydrophobic A can effectively reduce the coating’s water absorption. A1M3FY Series (constant A/M at 1/3 wt%, varying F):With F content at 0%, 1%, 2%, 3%, and 4%, the swelling ratios were 0.65%, 0.64%, 0.70%, 0.57%, and 0.71% respectively, indicating F has negligible effect on water absorption within experimental error. A1MZF3 Series (constant A/F at 1/3 wt%, varying M):When M content was 0%, 1%, 2%, 3%, and 4%, the swelling ratios were 0.20%, 0.33%, 0.40%, 0.57%, and 0.85% respectively, MoS2 increased from 0% to 4%, increasing the water absorption swelling rate by 325%. This may be attributed to microporosity formation in MoS2’s layered structure enhancing water absorption. Collectively, the introduction of A, F, and M components demonstrated limited influence on the coating’s water absorption properties, with the fundamental surface characteristics remaining largely unaffected.

Figure 3. The rate of water absorption and swelling varies with the content of the substance.
3.3 Characterization of coating surface topography
As shown in Figures 4, 5, the surface morphology of gradient composition coatings was systematically characterized using ultra-depth three-dimensional microscopy to investigate the effects of component variations on surface topology. All coatings demonstrated excellent smoothness at both macro- and micro-scales, with average surface roughness (Sa) values below 5 μm across all samples. AXM3F3 Series (constant M/F at 3 wt%, varying A):With A content at 0, 0.5%, 1%, 1.5%, and 2%, the Sa values were 1.12, 0.95, 0.75, 0.46, and 0.02 μm respectively, showing a significant reduction in surface roughness with increasing amide content. A1M3FY Series (constant A/M at 1/3 wt%, varying F):When F content was 0%, 1%, 2%, 3%, and 4%, the Sa values measured 0.04, 0.57, 0.63, 0.75, and 0.52 μm respectively, exhibiting a general increasing trend with higher F loading. A1MzF3 Series (constant A/F at 1/3 wt%, varying M):With M content at 0%, 1%, 2%, 3%, and 4%, the Sa values were 0.01, 0.32, 0.59, 0.75, and 1.34 μm respectively, demonstrating a clear positive correlation between MoS2 content and surface roughness.

Figure 4. 3D surface topography of coatings characterized by high-depth microscopy.

Figure 5. Dependence of surface roughness (Sa) on the composition of A, MoS2 (M), and PTFE (F) in silicone coatings.
The results demonstrate that the incorporation of the amide component (A) significantly enhances the coating’s wear resistance, while increasing the content of MoS2 (M) and PTFE (F) moderately elevates surface roughness. This phenomenon may be attributed to slight phase separation between PTFE/MoS2 and the silicone matrix, leading to increased surface heterogeneity.
As shown in Figure 5, both A1M3F4 and A1M4F3 coatings demonstrated good wear resistance after 2000 abrasion cycles. For the A1M3F4 coating, the average surface roughness (Sa) measured after 500, 1,000, 1,500, and 2000 abrasion cycles was 0.52, 0.61, 0.8, 2.06, and 2.39 μm, respectively, with corresponding contact angles of 125.3°, 118°, 115°, 109°, and 103°. In comparison, the A1M4F3 coating exhibited Sa values of 0.02, 0.73, 1.05, 2.29, and 2.31 μm under the same cycling conditions. The water contact angles for this coating were 122.4°, 123°, 118°, 111°, and 109°, respectively.
High-depth microscopy analysis revealed that after 2,000 wear cycles, although the surface morphology underwent noticeable changes, the average roughness (Sa) remained below 2.65 μm—a relatively low value—further confirming that the amide modification effectively improves the coating’s wear resistance while maintaining surface integrity.
3.4 Surface wettability
As illustrated in Figure 6, comprehensive water contact angle measurements were conducted to evaluate the surface wettability of the composite coatings under varying component ratios: In the AXM3F3 series (with both M and F contents fixed at 3%), when the A content was 0%, 0.5%, 1%, 1.5%, and 2% respectively, the surface contact angles were 118.2°, 121.8°, 122.7°, 123.9°, and 115.9° respectively. The contact angle showed an initial increase followed by a decrease. The maximum contact angle was achieved when the A content was 1.5%. The possible reason is that A acts both as a dispersant and a lubricant. At higher concentrations (2%), its surface migration characteristics become more pronounced, thereby reducing the surface contact angle of the coating. In the A1M3FY series (with A content at 1% and M content at 3%), when the F content was 0%, 1%, 2%, 3%, and 4% respectively, the surface contact angles were 119.8°, 121.8°, 122.4°, 122.7°, and 125.3° respectively. The contact angle gradually increased with increasing F content, which is consistent with other reported studies. In the A1MZF3 series (with A content at 1% and F content at 3%), when the M content was 0%, 1%, 2%, 3%, and 4% respectively, the surface contact angles were 118.2°, 119.8°, 122.3°, 122.7°, and 122.4° respectively. The contact angle generally showed an increasing trend with increasing M content. It should be noted that when the M content exceeded 2%, the change in contact angle became almost negligible. From the data, it can be observed that all samples exhibited water contact angles (WCA) greater than 115°, demonstrating excellent hydrophobicity, which contributes to improved antifouling performance.

Figure 6. Water contact angle measurements of multicomponent coatings.
3.5 Underwater friction and wear testing
As shown in Figure 7, the dynamic friction coefficients of the coatings under seawater conditions were measured using a tribometer equipped with an underwater testing module. The detailed results are as follows:
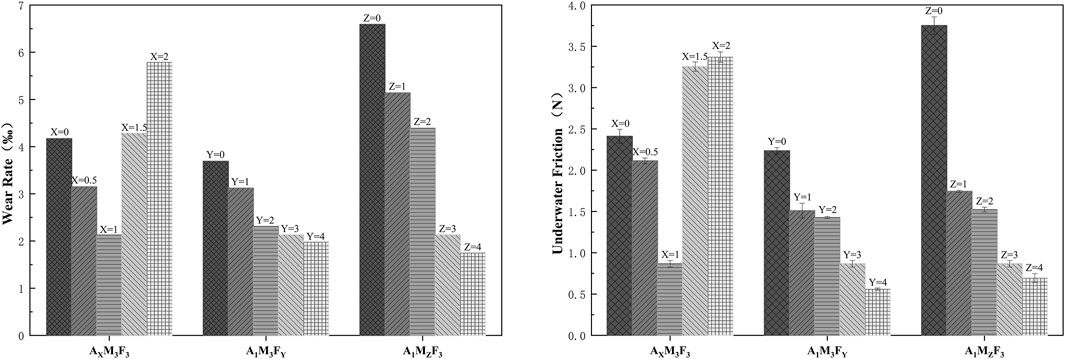
Figure 7. Quantitative Analysis of wear rate and underwater friction behavior in coatings.
In the AXM3F3 series (with both M and F contents fixed at 3%), when the A content was 0%, 0.5%, 1%, 1.5%, and 2% respectively, the underwater friction forces were 2.41 N, 2.11 N, 0.87 N, 3.25 N, and 3.37 N respectively. The underwater friction force initially decreased and then increased with increasing A content. The possible reason is that an appropriate amount of amide can reduce surface roughness and act as a lubricant, while excessive amide may precipitate on the surface and consequently increase friction. In the A1M3FY series (with A content at 1% and M content at 3%), when the F content was 0%, 1%, 2%, 3%, and 4% respectively, the underwater friction forces were 2.24 N, 1.51 N, 1.43 N, 0.87 N, and 0.56 N respectively. The underwater friction force gradually decreased with increasing F content, demonstrating that F is effective in reducing friction. In the A1MzF3 series (with A content at 1% and F content at 3%), when the M content was 0%, 1%, 2%, 3%, and 4% respectively, the underwater friction forces were 3.75 N, 1.74 N, 1.52 N, 0.87 N, and 0.69 N respectively. The underwater friction force showed a decreasing trend with increasing M content, which may be attributed to the layered crystal structure of MoS2 that facilitates interlayer sliding and consequently reduces the friction coefficient when incorporated into the coating.
In our study system, the underwater friction force initially decreased and then increased with increasing A content, reaching its minimum value when the A content was 1%. Both M and F showed consistent trends, with the underwater friction force gradually decreasing as their contents increased.
According to Figure 7, the wear rate of the coating exhibits a positive yet nonlinear correlation with underwater friction. This nonlinearity arises from two competing mechanisms: (1) higher friction forces directly promote surface wear, whereas (2) the coating’s mechanical strength (reaching 2.23 MPa tensile strength at 1.5 wt% additive A) effectively resists wear progression.
When the PTFE content was 4 wt% (A1M3F4), compared with A1M3F3, the friction force drops to 0.56 N (a 35.4% reduction), but the wear rate decreased only marginally (7.0%) due to its lower mechanical strength (the elastic modulus declined by 12.5%). The interplay between mechanical properties and frictional behavior resulted in a piecewise linear trend in the wear rate-friction force relationship.
3.6 Mechanical properties testing
As shown in Figure 8, the mechanical properties of all samples, including tensile strength and elongation at break, were evaluated through stress-strain curve measurements. The detailed results are presented as follows:

Figure 8. Mechanical performance optimization in A/M/F composite coatings.
AXM3F3 Series (M and F fixed at 3 wt%, varying A), when the A content was 0%, 0.5%, 1%, 1.5%, and 2%, the tensile strengths were 1.08 MPa, 1.89 MPa, 2.00 MPa, 2.23 MPa, and 1.79 MPa, respectively. Even with only 0.5% A, the tensile strength increased by 75%, and the elastic modulus improved by 109%. At 1.5% A, the strength reached its maximum value (2.23 MPa), representing a 106% increase in tensile strength and a 115% increase in elastic modulus. These results demonstrate that the addition of A effectively enhances the mechanical properties of the coating. A1M3FY Series (A fixed at 1 wt%, M fixed at 3 wt%, varying F), when the F content was 0%, 1%, 2%, 3%, and 4%, the tensile strengths were 1.27 MPa, 1.48 MPa, 2.25 MPa, 2.00 MPa, and 2.33 MPa, respectively. At 1% F, the tensile strength increased by only 17%, with almost no change in elastic modulus. However, when the F content exceeded 2%, the tensile strength showed significant improvement, ranging from 57% to 83%, while the elastic modulus increased by 23%–36%. A1MzF3 Series (A fixed at 1 wt%, F fixed at 3 wt%, varying M), when the M content was 0%, 1%, 2%, 3%, and 4%, the tensile strengths were 1.91 MPa, 2.02 MPa, 1.91 MPa, 2.00 MPa, and 2.47 MPa, respectively. As the M content increased, the changes in tensile strength and elastic modulus were not significant, indicating that M does not substantially alter the mechanical properties of the material.
The synergistic mechanism among A, MoS2, and PTFE was crucial for achieving the coating’s exceptional wear resistance. Perhaps the amide group in A formed intermolecular hydrogen bonds with the resin matrix, MoS2, and cross-linking agents, effectively improving stress transfer efficiency and enhancing mechanical properties—resulting in an 85% increase in tensile strength. Meanwhile, the layered structure of MoS2 provided interlayer lubrication, significantly reducing frictional resistance, while PTFE’s low surface energy inhibited fouling adhesion, and its self-lubricating effect further minimized frictional losses. Their combined action reduced the underwater friction coefficient by 64% compared to the control sample. Additionally, the long alkyl chains in A improved the dispersion of MoS2 and PTFE through non-polar interactions, preventing agglomeration and enhancing distribution uniformity. This reduced stress concentration and resulted in a more homogeneous coating surface, with a 33% reduction in surface roughness. This ternary synergistic strategy successfully balanced mechanical durability (remaining intact after 2,000 friction cycles) and low-surface-energy characteristics (contact angles all exceeding 118°), providing a novel solution to the long-standing challenge of reconciling mechanical performance with low surface energy in traditional antifouling coatings.
3.7 Self-cleaning performance test
As shown in Figure 9, the self-cleaning efficiency of the coatings was systematically evaluated, with the following detailed results:
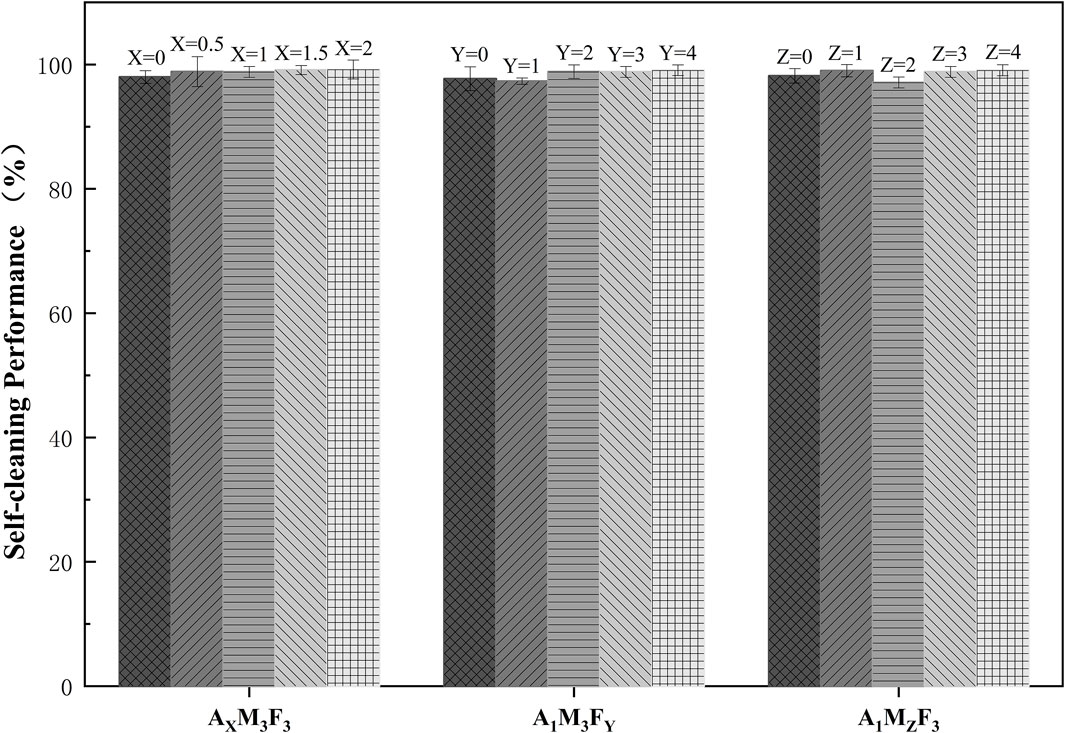
Figure 9. Self-cleaning performance of A/M/F composite coatings.
In the AXM3F3 series (with both M and F contents fixed at 3 wt%), when the A content was 0%, 0.5%, 1%, 1.5%, and 2% respectively, the self-cleaning efficiencies were 97.99%, 98.86%, 98.82%, 99.12%, and 99.21% respectively. The self-cleaning efficiency showed a slight increase with increasing A content. This may be attributed to the amide component reducing surface roughness and consequently decreasing pollutant adsorption, leading to a mild improvement in self-cleaning performance. In the A1M3FY series (with A content fixed at 1 wt% and M content at 3 wt%), when the F content was 0%, 1%, 2%, 3%, and 4% respectively, the self-cleaning efficiencies were 97.72%, 97.32%, 98.87%, 98.82%, and 99.08% respectively. The self-cleaning performance generally improved with increasing F content. In the A1MZF3 series (with A content fixed at 1 wt% and F content at 3 wt%), when the M content was 0%, 1%, 2%, 3%, and 4% respectively, the self-cleaning efficiencies were 98.18%, 99.02%, 97.12%, 98.82%, and 99.08% respectively. The self-cleaning efficiency exhibited irregular variations with increasing M content, suggesting that the influence of M on self-cleaning performance may be complex. From the experimental data, it can be concluded that all samples demonstrated excellent self-cleaning efficiency (>97.1 ± 0.87%), indicating good antifouling potential of the coatings.
3.8 Testing of antimicrobial properties of coatings
As shown in Figures 10, 11, the antibacterial properties of the coatings were systematically evaluated against Gram-negative E. coli (E. coli) and Staphylococcus aureus (S. aureus) using the plate counting method. The detailed results are presented below.

Figure 10. E. coli bacterial inhibition rate and bacterial inhibition experiments in real life graphs.

Figure 11. S. aureus bacterial inhibition rate and bacterial inhibition experiments in real life graphs.
3.8.1 Anti-E. coli
In the AXM3F3 series (with both M and F contents fixed at 3 wt%), when the A content was 0%, 0.5%, 1%, 1.5%, and 2% respectively, the antibacterial rates against E. coli were 89.63%, 94.62%, 97.44%, 94.51%, and 96.33% respectively. The antibacterial rate showed wave-like variations but demonstrated an overall increasing trend with increasing A content. Notably, the addition of just 0.5% A improved the antibacterial rate by more than 5 percentage points. This enhancement may be attributed to A’s ability to reduce surface roughness, thereby inhibiting bacterial adhesion. In the A1M3FY series (with A content fixed at 1 wt% and M content at 3 wt%), when the F content was 0%, 1%, 2%, 3%, and 4% respectively, the antibacterial rates against E. coli were 91.24%, 95.83%, 96.04%, 96.36%, and 96.00% respectively. The antibacterial rate initially increased and then stabilized with increasing F content, showing no significant improvement when F content exceeded 1%. This suggests that low F content is sufficient to achieve optimal antibacterial effects. In the A1MZF3 series (with A content fixed at 1 wt% and F content at 3 wt%), when the M content was 0%, 1%, 2%, 3%, and 4% respectively, the antibacterial rates against E. coli were 97.15%, 98.26%, 97.25%, 97.44%, and 97.44% respectively. The antibacterial rate remained essentially unchanged with increasing MoS2 content, indicating that MoS2 does not significantly affect the coating’s antibacterial properties.
3.8.2 Anti-S. aureusv
In the AXM3F3 series (with both M and F contents fixed at 3 wt%), when the A content was 0%, 0.5%, 1%, 1.5%, and 2% respectively, the antibacterial rates against S. aureus were 98.99%, 96.86%, 98.12%, 98.02%, and 98.81% respectively. The antibacterial rate showed a slight decreasing trend with increasing A content. This contrasting trend compared to E. coli may be attributed to differences in metabolic pathways and cell wall structures between these two bacterial species. Overall, A’s effect on the coating’s anti-S. aureus performance appears relatively limited. In the A1M3FY series (with A content fixed at 1 wt% and M content at 3 wt%), when the F content was 0%, 1%, 2%, 3%, and 4% respectively, the antibacterial rates against S. aureus were 97.72%, 98.32%, 98.86%, 98.11%, and 98.08% respectively. The antibacterial rate remained consistently high without significant variation as F content increased. In the A1MZF3 series (with A content fixed at 1 wt% and F content at 3 wt%), when the M content was 0%, 1%, 2%, 3%, and 4% respectively, the antibacterial rates against S. aureus were 94.18%, 98.02%, 95.12%, 98.12%, and 97.08% respectively. While the antibacterial rate showed irregular variations with increasing MoS2 content, all values demonstrated improvement compared to the baseline (0% M), suggesting that MoS2 incorporation does contribute to enhanced antibacterial performance.
3.9 Antifouling tests on shallow planks
As shown in Figure 12, real-world antifouling performance was evaluated through 3-month shallow sea panel tests conducted during peak marine organism growth season. The detailed results are presented below:

Figure 12. Marine field test of coatings in Zhoushan Sea.
In the AXM3F3 series (with both M and F contents fixed at 3 wt%), when the A content was 0%, 0.5%, 1%, 1.5%, and 2% respectively, the fouling organism attachment on the coatings significantly decreased with increasing A content. This improvement may be attributed to A’s dual functionality as both dispersant and lubricant - as its concentration increased, both dispersion capability and surface smoothness were enhanced, thereby improving antifouling performance. In the A1MZF3 series (with A fixed at 1 wt% and F at 3 wt%) and A1M3FY series (with A fixed at 1 wt% and M at 3 wt%), variations in M and F content showed no improvement in antifouling performance, with some samples even demonstrating reduced performance. This indicates that M and F do not significantly influence antifouling properties.
4 Summary
Through condensation reaction, we successfully synthesized a multifunctional anchoring material A incorporating long alkyl chains, polar amide groups, and benzene rings. This material was then blended with MoS2 and PTFE into a silicone resin system, followed by room-temperature crosslinking curing to prepare a novel antifouling coating. Under the synergistic effects of A, MoS2 and PTFE: Surface roughness was reduced below 2 μm, tensile strength exceeded 1.6 MPa for most coatings, reaching up to 2.47 Mpa. Average roughness remained below 2.65 μm after 2000 abrasion cycles, self-cleaning efficiency exceeded 97% and antibacterial rate surpassed 95%. The coatings maintained effective antifouling performance for over 90 days during peak marine organism growth season. Component A played a dominant role in mechanical property enhancement, while M and F were more effective in reducing underwater friction. The synergistic interaction among A, MoS2 and PTFE resulted in coatings with exceptional mechanical properties that not only meet the requirements for underwater cleaning applications but also provide new solutions for designing high-performance antifouling coatings.
Data availability statement
The original contributions presented in the study are included in the article/supplementary material, further inquiries can be directed to the corresponding author.
Author contributions
XC: Writing – original draft. LD: Writing – review and editing. JC: Writing – review and editing. HX: Writing – review and editing. QZ: Writing – review and editing. JH: Writing – review and editing.
Funding
The author(s) declare that financial support was received for the research and/or publication of this article. This work was supported by the Key Research and Development Program of Zhejiang Province (Grant No.2024SSYS0089) and Science Foundation of Donghai Laboratory (L25QH001).
Conflict of interest
Author LD was employed by Zhejiang Feijing New Material Science & Technology Co., Ltd.
The remaining authors declare that the research was conducted in the absence of any commercial or financial relationships that could be construed as a potential conflict of interest.
Generative AI statement
The author(s) declare that no Generative AI was used in the creation of this manuscript.
Any alternative text (alt text) provided alongside figures in this article has been generated by Frontiers with the support of artificial intelligence and reasonable efforts have been made to ensure accuracy, including review by the authors wherever possible. If you identify any issues, please contact us.
Publisher’s note
All claims expressed in this article are solely those of the authors and do not necessarily represent those of their affiliated organizations, or those of the publisher, the editors and the reviewers. Any product that may be evaluated in this article, or claim that may be made by its manufacturer, is not guaranteed or endorsed by the publisher.
References
Chen, L., Duan, Y., Cui, M., Huang, R., Su, R., Qi, W., et al. (2021). Biomimetic surface coatings for marine antifouling: natural antifoulants, synthetic polymers and surface microtopography. Sci. Total Environ. 766, 144469. doi:10.1016/j.scitotenv.2020.144469
Chen, J., Zhao, J., Lin, F., Zheng, X., Jian, R., Lin, Y., et al. (2023). Polymerized tung oil toughened urushiol-based benzoxazine copper polymer coatings with excellent antifouling performances. Prog. Org. Coatings 177, 107411. doi:10.1016/j.porgcoat.2023.107411
Chu, H., Liu, Z., Ji, T., Yang, C., and Xu, N. (2024). Recent advances in the preparation of superhydrophobic coatings based on low-surface-energy modifiers: diversified properties and potential applications. Appl. Therm. Eng. 251, 123591. doi:10.1016/j.applthermaleng.2024.123591
Dai, Z., Lei, M., Ding, S., Zhou, Q., Ji, B., Wang, M., et al. (2024). Durable superhydrophobic surface in wearable sensors: from nature to application. Adv. Mater. 4 (2), 20230046. doi:10.1002/EXP.20230046
Deng, Y., Song, G.-L., Zheng, D., and Zhang, Y. (2021). Fabrication and synergistic antibacterial and antifouling effect of an organic/inorganic hybrid coating embedded with nanocomposite Ag@TA-SiO particles. Colloids Surfaces A Physicochem. Eng. Aspects 613, 126085. doi:10.1016/j.colsurfa.2020.126085
Deng, P., Wang, P., Hu, J., Zheng, G., Yang, J., and Liu, D. (2025). Design and experimental study of a joint protection system for electrolytic seawater antifouling and impressed current cathodic protection. Constr. Build. Mater. 482, 141633. doi:10.1016/j.conbuildmat.2025.141633
Fameau, A.-L., and Rogers, M. A. (2020). The curious case of 12-hydroxystearic acid — the dr. Jekyll and Mr. Hyde of molecular gelators. Curr. Opin. Colloid & Interface Sci. 45, 68–82. doi:10.1016/j.cocis.2019.12.006
Feng, X., Guo, X., Chen, K., Qian, S., Sun, J., Jian, Y., et al. (2024). Breathable, self-healable, durable superhydrophobic and UV-blocking cotton fabrics. Chem. Eng. J. 492, 152420. doi:10.1016/j.cej.2024.152420
Guru, S. R., Panda, S., Kumar, P., and Sarangi, M. (2024). A study on tribological performances of PEEK and PTFE based composites with MoS2reinforcements. Polym. Compos. 45 (8), 7329–7345. doi:10.1002/pc.28268
He, Z., Wang, N., Yang, X., Mu, L., Wang, Z., Su, J., et al. (2023). Antifouling induced by surface wettability of poly(dimethyl siloxane) and its nanocomposites. Nanotechnol. Rev. 12 (1), 20220552. doi:10.1515/ntrev-2022-0552
Iswadi, A., Porter, J. S., Bell, M. C., Garniati, L., Harris, R. E., and Priyotomo, G. (2022). Establishing an agenda for biofouling research for the development of the marine renewable energy industry in Indonesia. J. Mar. Sci. Eng. 10 (3), 384. doi:10.3390/jmse10030384
Liao, Y., Cao, L., Wang, Q., Li, S., Lin, Z., Li, W., et al. (2022). Enhanced tribological properties of PEEK-based composite coatings reinforced by PTFE and graphite. J. Appl. Polym. Sci. 139 (13), 51878. doi:10.1002/app.51878
Liu, X., Gao, C., Fu, C., Xi, Y., Fatehi, P., Zhao, J. R., et al. (2022). Preparation and performance of lignin-based multifunctional superhydrophobic coating. Molecules 27 (4), 1440. doi:10.3390/molecules27041440
Liu, Y., He, X., Yuan, C., Cao, P., and Bai, X. (2024). Antifouling applications and fabrications of biomimetic micro-structured surfaces: a review. J. Adv. Res. 59, 201–221. doi:10.1016/j.jare.2023.08.019
Lu, S., Pugh, R. J., and Forssberg, E. (2005). “Dispersion of particles in liquids,”, 10. Amsterdam: Elsevier, 517–558. Chapter. doi:10.1016/S1383-7303(05)80011-0Stud. Interface Sci.
Meng, H., Zhao, F., Zhang, Z., and Qiu, T. (2013). Dispersive action of octane for cobalt nano-particles. Int. J. Refract. Metals Hard Mater. 36, 254–259. doi:10.1016/j.ijrmhm.2012.09.007
Muadtrap, M., Thiramanas, R., and Crespy, D. (2025). Amphiphilic materials for advanced antifouling and anticorrosion coatings. Prog. Org. Coatings 207, 109391. doi:10.1016/j.porgcoat.2025.109391
Murali, S., Agirre, A., Arrizabalaga, J., Rafaniello, I., Schäfer, T., and Tomovska, R. (2024). Zwitterionic stabilized water-borne polymer colloids for antifouling coatings. React. Funct. Polym. 196, 105843. doi:10.1016/j.reactfunctpolym.2024.105843
Roeven, E., Scheres, L., Smulders, M. M. J., and Zuilhof, H. (2021). Zwitterionic dendrimer – Polymer hybrid copolymers for self-assembling antifouling coatings. Eur. Polym. J. 156, 110578. doi:10.1016/j.eurpolymj.2021.110578
Sun, X., Xie, J., Zhang, J., Sang, M., Li, Y., Lyu, P., et al. (2022). Hydrophobic Al2O3/SiO2/PDMS composite coatings for anti-corrosion application of 304 stainless-steel. J. Inorg. Organomet. Polym. Mater. 32 (11), 4237–4249. doi:10.1007/s10904-022-02423-9
Thach, N. D., and Van Hung, P. (2024). Development of UV reactor controller in ballast water treatment system to minimize the biological threat on marine environment. J. Sea Res. 198, 102465. doi:10.1016/j.seares.2023.102465
Wang, K., Xiong, P., Xu, X., Wang, K., Li, Y., and Zheng, Y. (2017). Chemically robust carbon nanotube – PTFE superhydrophobic thin films with enhanced ability of wear resistance. Prog. Nat. Sci. Mater. Int. 27 (3), 396–399. doi:10.1016/j.pnsc.2017.04.004
Xavier, F. C., Araujo, F. C., Batista, D., Messano, L. V. d., Mizrah, D., Calado, L., et al. (2025). Managing the risk of marine bioinvasion via biofouling: trends in methods of assessment, policy, and legislation. Ocean. Coast. Res. 73, e25021. doi:10.1590/2675-2824073.24092
Xu, H., He, G., Ni, C., Li, X., Jiang, X., and Yu, L. (2025). Repel-kill-release: a self-polishing antifouling coating with synergistic effects of fluorescent antifouling and contact bacteriostasis. Appl. Surf. Sci. 709, 163861. doi:10.1016/j.apsusc.2025.163861
Yamada, T., Hanada, Y., Takeda, K., Kamiyoshi, N., and Yamazaki, M. (2015). “Dispersion control of liquid toner by dispersant and analysis of adsorption structure,” in NIP & digital fabrication conference (England, United Kingdom: Royal Society Chemistry), 259–263. doi:10.1039/C5CY01845E
Yan, J., He, Z., Wang, Y., Qiu, J., and Wang, Y. (2016). Microstructure and wear resistance of plasma-sprayed molybdenum coating reinforced by MoSi2 particles. J. Therm. Spray Technol. 25 (7), 1322–1329. doi:10.1007/s11666-016-0440-6
Yang, H., Liu, Y., Chen, H., and Li, H. (2025). Controlled release of newly synthesized NH2-ZIF-8@BITEP from epoxy resin-based coating for enhanced antifouling and anti-corrosion performance. Prog. Org. Coatings 208, 109472. doi:10.1016/j.porgcoat.2025.109472
Zang, X., Ni, Y., Wang, Q., Cheng, Y., Huang, J., Cao, X., et al. (2024). Non-toxic evolution: advances in multifunctional antifouling coatings. Mater. Today 75, 210–243. doi:10.1016/j.mattod.2024.03.018
Zhang, X., Zhang, J., Huang, Y., Liu, X., Shang, B., Liu, X., et al. (2025). Fluorine-free, breathable, durable and thermal self-healable superhydrophobic cotton fabrics. Industrial Crops Prod. 228, 120861. doi:10.1016/j.indcrop.2025.120861
Zhao, Y., and Zou, M. (2019). Experimental investigation of the wear mechanisms of thin PDA/PTFE coatings. Prog. Org. Coatings 137, 105341. doi:10.1016/j.porgcoat.2019.105341
Zhong, X., Dong, J., Liu, M., Meng, R., Li, S., and Pan, X. (2022). Experimental study on ship fouling cleaning by ultrasonic-enhanced submerged cavitation jet: a preliminary study. Ocean. Eng. 258, 111844. doi:10.1016/j.oceaneng.2022.111844
Keywords: silicone, low-surface-energy, antifouling, underwater cleaning, A/MoS2/PTFE
Citation: Chen X, Du L, Chen J, Xu H, Zhang Q and Hu J (2025) A wear-resistant coating with combined mechanical and antifouling properties for potential underwater cleaning applications. Front. Chem. 13:1666881. doi: 10.3389/fchem.2025.1666881
Received: 16 July 2025; Accepted: 26 August 2025;
Published: 16 September 2025.
Edited by:
Wei Zhao, National University of Singapore, SingaporeReviewed by:
Shuhua Tu, Zhejiang University of Technology, ChinaZiqiang Liu, Zhejiang University, China
Dongzhi Chen, Wuhan Textile University, China
Copyright © 2025 Chen, Du, Chen, Xu, Zhang and Hu. This is an open-access article distributed under the terms of the Creative Commons Attribution License (CC BY). The use, distribution or reproduction in other forums is permitted, provided the original author(s) and the copyright owner(s) are credited and that the original publication in this journal is cited, in accordance with accepted academic practice. No use, distribution or reproduction is permitted which does not comply with these terms.
*Correspondence: Jiankun Hu, MzA3NzkwMjUwQHFxLmNvbQ==