 A. Joy Prisca
 B. Jaganathan
- Department of Mathematics, School of Advanced Sciences, Vellore Institute of Technology, Chennai, India
Introduction: The increasing incidence and high mortality rate of necrotizing fasciitis (NF), a rapidly progressing infection of the fascia and subcutaneous tissue, highlights the urgent need for effective drug evaluation strategies. Traditional clinical trials for NF antibiotics are costly and time-consuming, necessitating the development of computational approaches that can reliably capture drug behavior.
Methods: The study employs degree-based topological indices to represent molecular structures of NF antibiotics and develops QSPR models to predict their physicochemical properties. Calculating topological indices, performing regression analyses to identify significant indices, and using these indices in multi-criteria decision-making techniques to rank the antibiotics.
Results: This study demonstrates the potential of degree-based TIs combined with regression and multi-criteria decision-making techniques to predict and rank the physicochemical properties of antibiotics used to treat necrotizing fasciitis (NF).
Discussion: This integrated approach demonstrates the utility of topological indices in predicting drug properties, prioritizing candidates, and supporting the rational design and repurposing of NF therapeutics.
1 Introduction
Necrotizing fasciitis (NF) is an uncommon bacterial infection of the skin and underlying tissues that has a high risk of death and disability (Tantirat et al., 2020). The disease was first discovered in 1783 in France and occurred sporadically throughout the 19th and 20th centuries (Misiakos et al., 2014). In the period following COVID, there has been a notable increase in the fatality rate of streptococcal necrotizing fasciitis, with an increase in the mortality rate of approximately 13%–18% (da Costa Senior et al., 2024). The literature shows that the average mortality rate varies between 25% and 73%. Additionally, the prevalence of invasive NF has increased in Europe, Japan (Choudhary et al., 2024), and Thailand. The incidence of NF is approximately fifteen cases per hundred thousand individuals worldwide. Furthermore, NF can severely impair the quality of life of patients, especially those with limb loss. Thus, research is of paramount importance because of the high death rate, rising number of cases, high expense of treating NF, and the noticeable drop in the quality of life after treatment (R Vignesh et al., 2024).
Infections acquired through cuts, scrapes, burns, insect bites, piercing bruises, intravenous medication use, surgical cuts, sores that come into contact with fresh or salt water, and consumption of contaminated oysters can potentially develop into NF (Yu et al., 2022). There are case studies in which other infections, such as chicken pox, monkey pox, and viral infections, complicated NF (Lovis et al., 2023; Moshfegh et al., 2025; Zhang et al., 2023). Even people in good health can develop type 1 NF, which is brought on by a polymicrobial infection. Furthermore, obligatory airborne organisms and fungi were identified as the causative factors of NF. This provides more rapid answers to the overburdened healthcare situation and medicinal requirements, thus significantly reducing the time required (Kulkarni et al., 2023).
NF remains a severe clinical burden because of its rapid progression, high case fatality rate, and the frequent involvement of multidrug-resistant pathogens. Although broad-spectrum agents such as piperacillin, vancomycin, and imipenem are the mainstay of therapy, their clinical efficacy is often hampered by diagnostic delays, inadequate penetration of drugs into necrotic tissue, and resistance mechanisms in organisms such as Staphylococcus aureus and Pseudomonas aeruginosa. Traditional laboratory-based evaluations of antibiotic effectiveness are costly, labor-intensive, and unsuitable for urgent therapeutic decision-making, highlighting the importance of computational methods. Among these, quantitative structure–property relationship (QSPR) modeling is widely recognized as a powerful approach in drug research. By linking molecular descriptors to physicochemical and pharmacokinetic attributes, QSPR facilitates the prediction of drug performance, reduces the reliance on experimental screening, accelerates discovery pipelines, and deepens the understanding of structure–property relationships that are essential for rational drug design and repurposing. Topological indices (TIs) are essential in QSPR investigations. TIs help anticipate a compound’s potential for therapeutic use by using mathematical correlations to associate its chemical composition with its biological activity. TIs are mathematical illustrations that reflect the geometric and topological properties of molecular structures and provide vital information regarding pharmacological interactions (Anuradha and Jaganatha, 2024; Pattabiraman and Cancan, 2023; Anuradha et al., 2024; Harshavardhan et al., 2025). TIs provide crucial information about the stereochemistry of substances by focusing on their spatial structure, symmetry, and molecular connectivity (Suresh et al., 2024). Recently, TIs have been used in cancer medicine repurposing strategies (Yousaf and Shahzadi, 2024).
In this study, various valency-based TIs were calculated, and a large dataset was built and validated to create reliable QSPR models. The workflow of the process is shown in Figure 1.
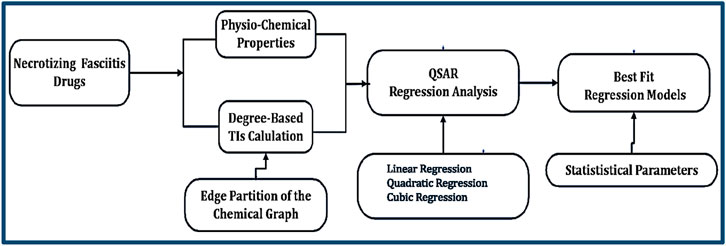
Figure 1. Process of identifying the best-fit regression model.
By analyzing a large dataset that links TIs to the physicochemical characteristics of NF medicines, reliable QSPR models were created in this study. Several medications with possible antibiotic qualities were highlighted by the strong prediction ability of the processes. Linear, quadratic, and cubic regression models were used to assist research workers in understanding the structural design of antibiotic NF drugs and support the ability to work with molecular structures.
Drug discovery requires balancing multiple molecular features, namely, solubility, lipophilicity (logP), molecular weight, topological polar surface area (TPSA), bioavailability, and toxicity, which often conflict because high binding affinity may coincide with poor pharmacokinetics. Multi-criteria decision-making (MCDM) methods, including the technique for order of preference by similarity to ideal solution (TOPSIS) and multi-objective optimization on the basis of ratio analysis (MOORA), resolve this complexity by normalizing diverse descriptors, applying criterion-specific weights, and producing composite rankings. When integrated with regression-based QSPR modeling, these approaches enable systematic prioritization of neem phytochemicals, improving efficiency in lead identification and guiding rational drug optimization (Anuradha and Jaganathan, 2025; Kanwal et al., 2023).
2 Materials and methods
2.1 Antibiotics for necrotizing fasciitis
Necrotizing fasciitis, sometimes referred to as flesh-eating sickness, is caused by a bacterial infection that damages the fascia, the tissue beneath the skin. Comprehensive debridement (surgical removal of necrotizing tissue) and empiric antibiotics are essential treatments that may prevent aggressive progression without causing death. Antibiotics with a wide spectrum should be prescribed to patients as soon as NF is diagnosed. Antibiotics are empirically used depending on the microbial categorization of the NF. Soft tissue reconstruction is a feasible choice after all the afflicted tissues have been debrided. Comprehensive treatment of NF involves careful administration of antibiotics.
Antibiotics such as piperacillin, vancomycin, imipenem, and daptomycin remain central to NF therapy because of their broad-spectrum activity against Gram-positive and Gram-negative bacteria, toxin suppression, and efficacy against resistant strains. Clindamycin is often used as an adjunct to inhibit toxin production, whereas ertapenem and gentamicin serve as alternatives for penicillin-allergic patients or for those with Gram-negative infections. The early use of these drugs reduces mortality, tissue necrosis, and the need for surgical interventions, especially in vulnerable populations. Given NF’s rapid progression, high fatality, and multidrug resistance, degree-based topological indices (TIs) with QSPR regression provide a cost-effective strategy to predict drug properties. Coupled with MCDM, this framework supports rational antibiotic prioritization and optimizes therapeutic decisions (Bisgaard and Bulger, 2024; Jain et al., 2023).
In this study, several valency-based TIs were used to investigate the antibiotics used for treating NF. The spatial configurations of the atoms within the molecules were studied using topological analysis and stereochemistry. The chemical structures were drawn using KingDraw with molecular data obtained from PubChem and ChemSpider (Figure 2).
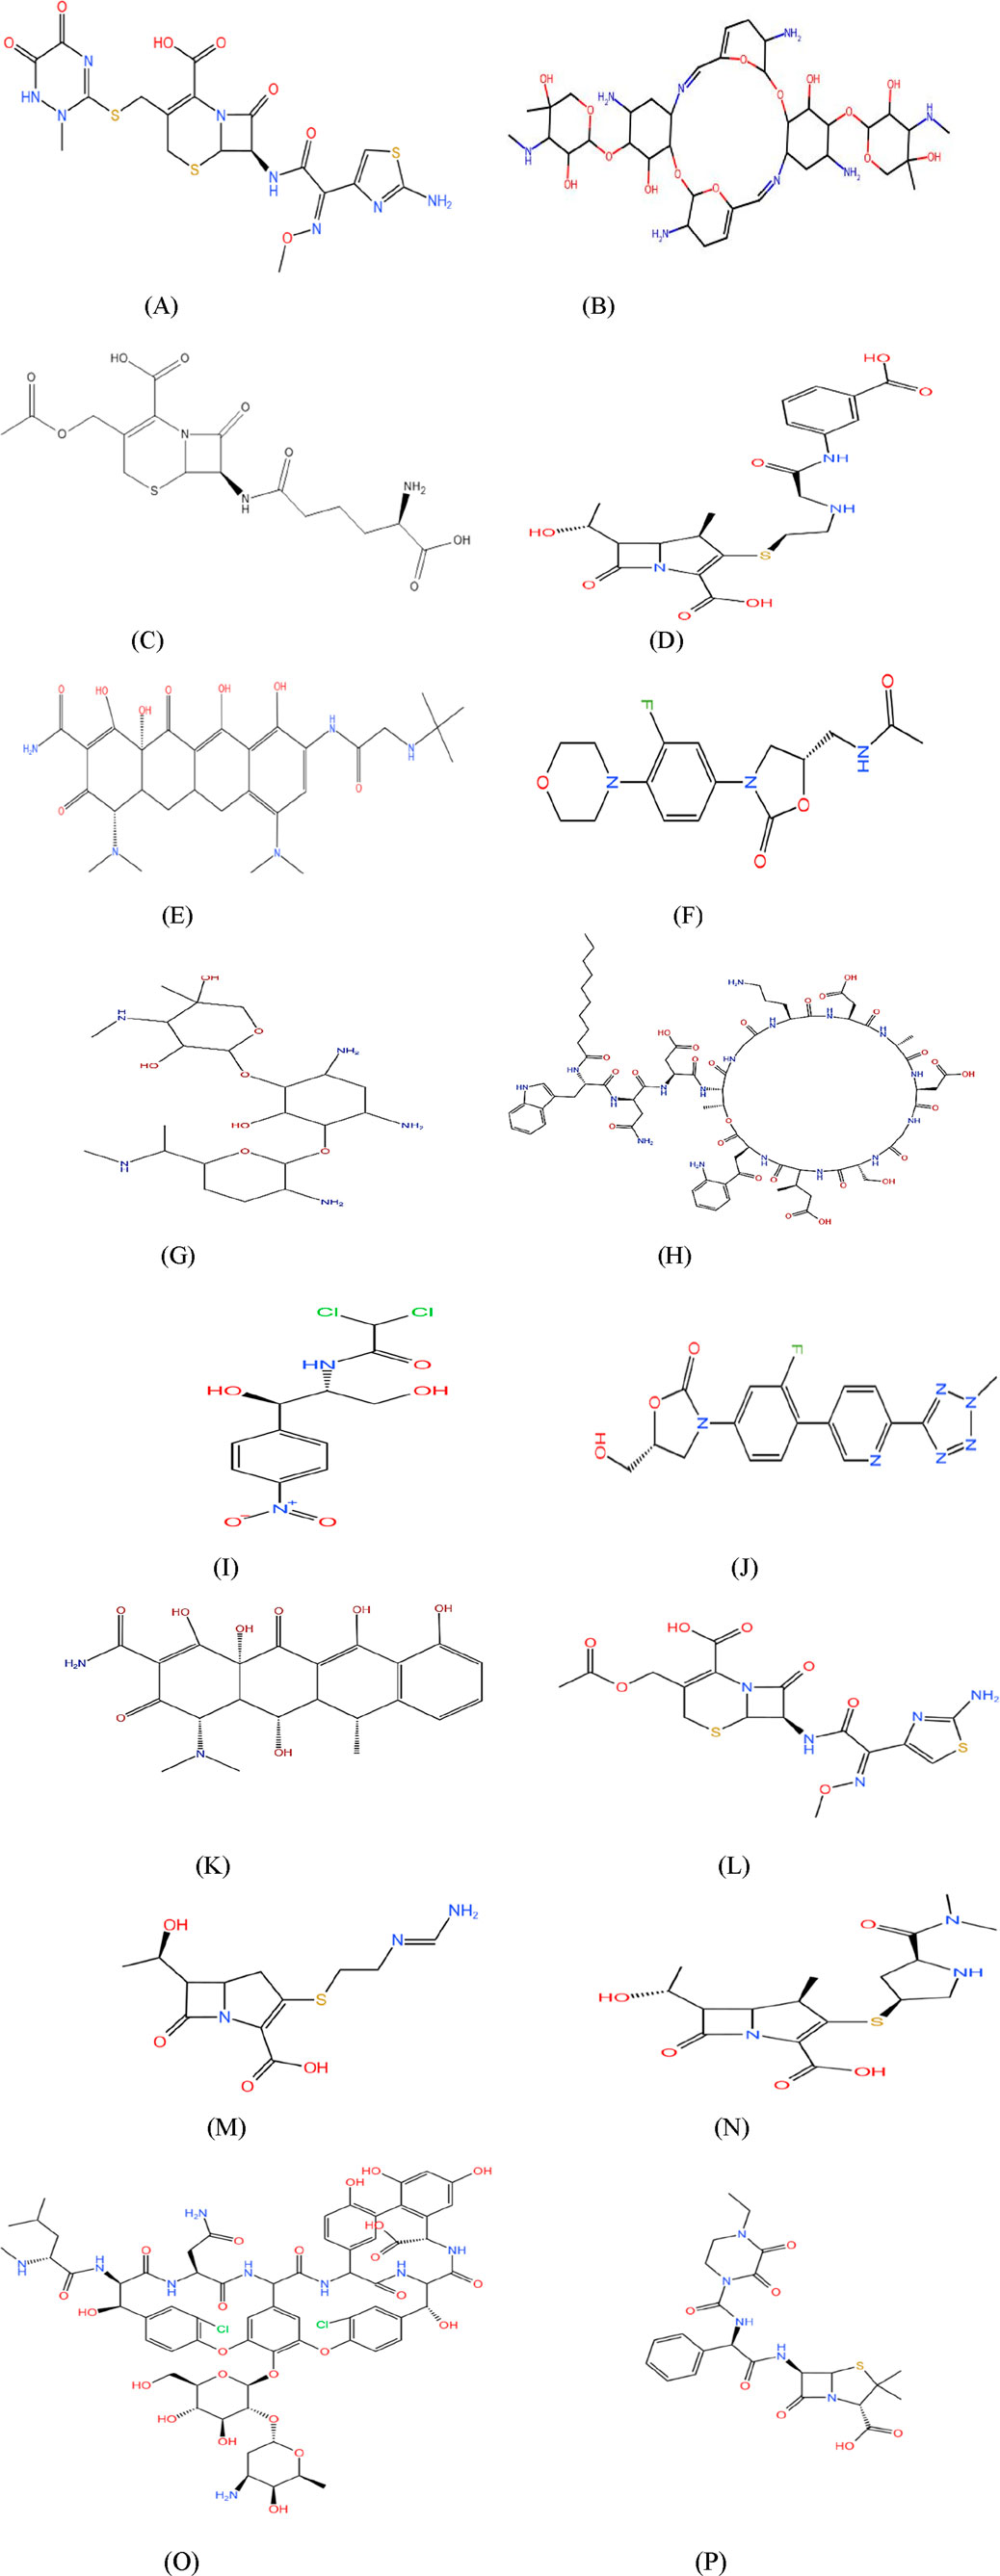
Figure 2.. Molecular structure of NF drugs: (A) ceftriaxone, (B) aminoglycoside 66-40C, (C) cephalosporin, (D) ertapenem, (E) tigecycline, (F) linezolid, (G) gentamicin, (H) daptomycin, (I) chloramphenicol, (J) tedizolid, (K) doxycycline, (L) cefotaxime, (M) imipenem, (N) meropenem, (O) vancomycin, and (P) piperacillin.
2.2 Topological indices (degree-based)
A molecular descriptor derived from the topology of a chemical compound is called a TI (Anuradha and Jaganathan, 2025). The relationship among a molecule’s structure, chemical reactivity, and physical properties can be calculated using the logical and mathematical techniques of graph theory (Anuradha and Jaganathan, 2023; Joy Prisca and Jaganathan, 2025). Degree-based topological indices (TIs), such as Randić, Zagreb, ABC, and discrete Adriatic indices, were selected for their established utility in QSPR studies. The Randić index captures molecular branching, the Zagreb indices characterize stability and connectivity, and the ABC index effectively models thermodynamic and physicochemical properties. Discrete Adriatic indices provide additional sensitivity to the structural complexity. Recent studies have confirmed their predictive reliability for modeling alkaloids and quinolone antibiotics (Kirana et al., 2024; Pulakos et al., 2000). Together, these indices form a computationally efficient and theoretically robust framework for investigating the physicochemical properties of drugs used to treat NF. Degree-based TIs have certain benefits over other indices, such as those based on distance, entropy, or temperature. These advantages include ease of calculation, direct connection to the local connectivity of atoms, and strong associations with chemical and physical properties (Mahboob et al., 2024). These descriptors provide the relationship between the natural physical characteristics of atoms and their positions in a chemical graph structure as a polynomial or number (Baby et al., 2023; Zhao et al., 2021). Every atom and bond between them are conceptualized as the vertices and edges of the mathematical graph. The degree of any vertex is the quantity of (edges) bonds that are incident on it (atoms). This degree represents the valence of any atom. Many chemical structures have been analyzed using degree-based indices (Murugan et al., 2023; Tharmalingam et al., 2023; Yang et al., 2023).
Throughout this article,
Many physicochemical characteristics are needed for drug-likeness prediction, especially the ADMET (absorption, digestion, metabolism, excretion, and toxicity) properties governed by Lipinski’s rule of five (Abdullah et al., 2023). Molecular mass, octanol–water partition coefficient, molar refractivity, enthalpy of vaporization, and polarizability are a few examples of physicochemical properties in the list. Many of these properties can be predicted by TIs, and a few are narrated for better understanding. Degree-based topological indices were selected for studying antibiotics for NF because they directly quantify atomic connectivity and branching, which strongly influence the physicochemical descriptors summarized in Tables 1, 2. Properties such as molecular weight, TPSA, polar surface area, polarizability, molar refractivity, and complexity are inherently related to how atoms are arranged and bonded within the molecular graph (Shanmukha et al., 2020). These indices offer a computationally efficient way to capture these structural features, enabling reliable QSPR modeling and regression analysis to predict and rationalize the drug properties critical for NF therapy. For example, the first and second Zagreb indices are applied in the study of the complexity and molecular chirality of chemical compounds (Saidi et al., 2020). In a study of the heat of formation in octanes and heptanes, the augmented Zagreb index was a suitable predictive index. The heat of formation, stability, and strain energy of alkanes and cycloalkanes are all highly correlated with the ABC index. The Randić index and its derivative, the sum-connectivity index, correlate well with the π-electronic energies of benzenoid hydrocarbons. Hence, TIs are widely used to investigate the properties of drug molecular structures (Adnan Mr et al., 2022; Kirmani et al., 2021; Mondal et al., 2021; Pratheeba and Aarthi, 2025). Among the few degree-based indices chosen, which exhibit good correlation with experimental results, the prediction can be validated using correlation and regression models (Balasubramaniyan and Chidambaram, 2023; Huang et al., 2023; Kansal et al., 2023; Shi et al., 2025; Zaman et al., 2025). The TIs used in the study for the physicochemical prediction are listed along with their notation and formulation.
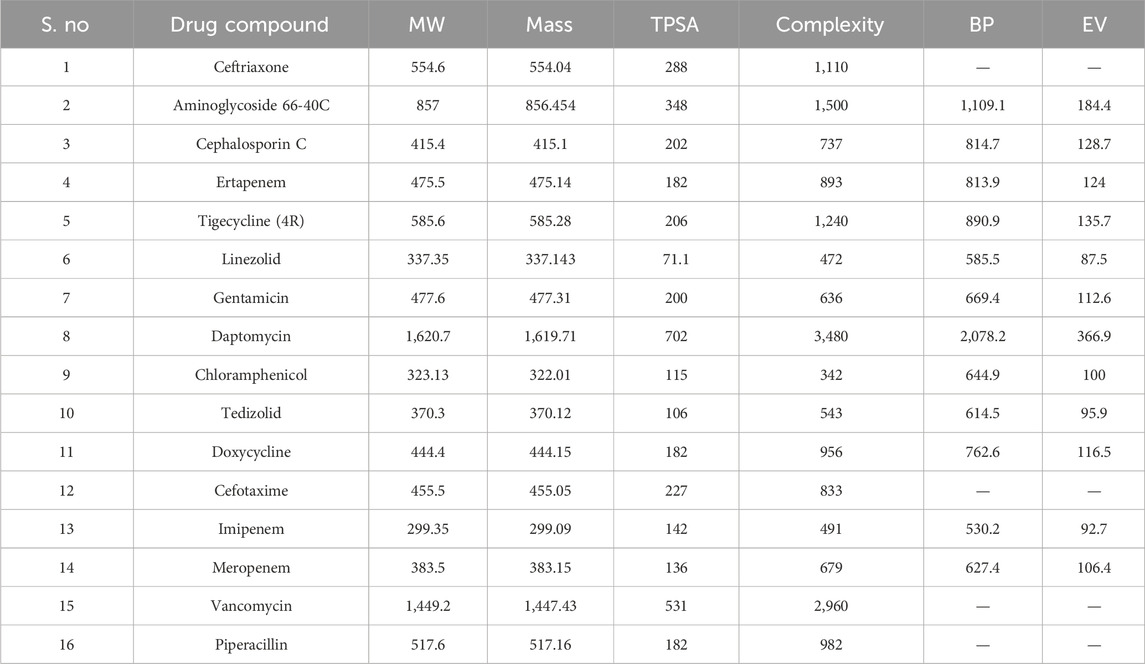
Table 1. Physiochemical properties of NF medications.
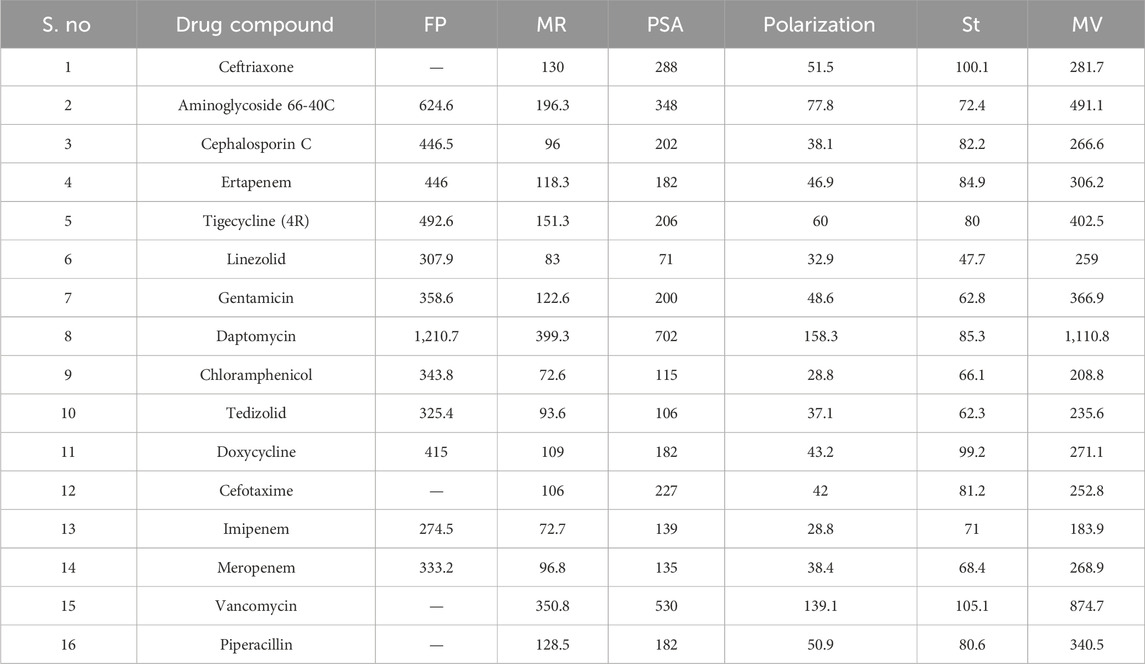
Table 2. Physiochemical properties of NF medications.
The sum connectivity index (SC) is formulated as follows:
The atom-bond connectivity (ABC) index is formulated based on the connectivity between the atoms proposed by Estrada et al., as follows:
The first Zagreb index (M1) and the second Zagreb index (SZ) are among the elementary indices established by Trinajstic and Gutman, which is defined, respectively, as
The second modified Zagreb index (M2) is defined as
The following is the formulation of the topological descriptors,
A topological index known as the geometric arithmetic index (GA) was developed with the following formulation:
The Randic index (Büyükköse and Cangul, 2022; Cruz et al., 2022) is formulated as
The hyper Zagreb index (HZ) was defined for any simple connected graph, as follows:
The Sombor index (SO) is a recently proposed molecular structure descriptor based on vertex degrees. It is defined as follows (Amin et al., 2021; Cruz et al., 2021; Gutman and Redžepović, 2022):
2.3 Bond additive topological indices
A degree-based (bond-additive) descriptor
Here,
The inverse sum indeg index is defined by (exhibiting a good correlation with heat capacity)
The misbalance indeg index is defined by (exhibiting a good correlation with enthalpy of vaporization)
The misbalance Rodeg index is defined by (exhibiting a good correlation with standard enthalpy of vaporization)
The misbalance Deg index is defined by (exhibiting a good correlation with standard enthalpy of vaporization)
The misbalance Hadeg index is defined by (exhibiting a good correlation with standard enthalpy of vaporization)
The min–max Rodeg index is defined by (exhibiting a good correlation with enthalpy)
The max–min Rodeg index is defined by (exhibiting a good correlation with density)
The max–min Deg index is defined by (exhibiting a good correlation with relative retention time)
The max–min Sdeg index is defined by (exhibiting a good correlation with relative retention time)
The symmetric division Deg index is defined by (exhibiting a good correlation with TSA)
The physicochemical properties of the molecular structures considered in this study were obtained from ChemSpider and PubChem, as mentioned in Tables 1, 2.
The edge partition technique was used to calculate the aforementioned valency-based indices. The edge partitions of the NF medications mentioned in Figure 2 are presented in Table 3.
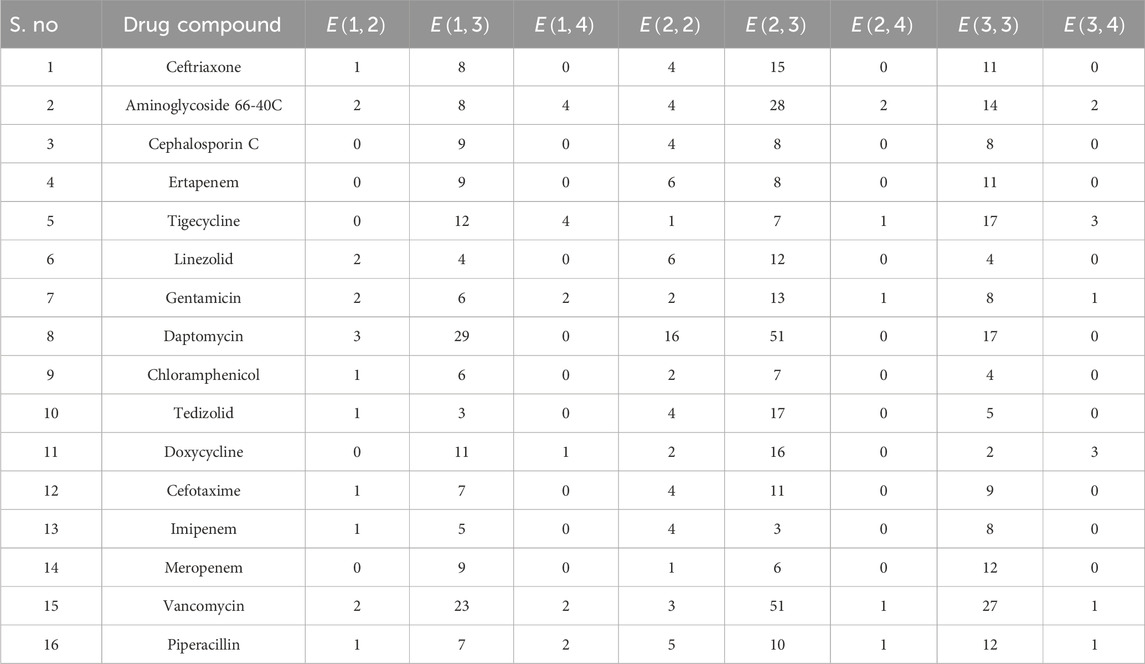
Table 3. Edge partition of the NF antibiotics.
Tables 4–6 show the predictions made using the aforementioned edge partition and degree-based indices of the compounds used for NF treatment.
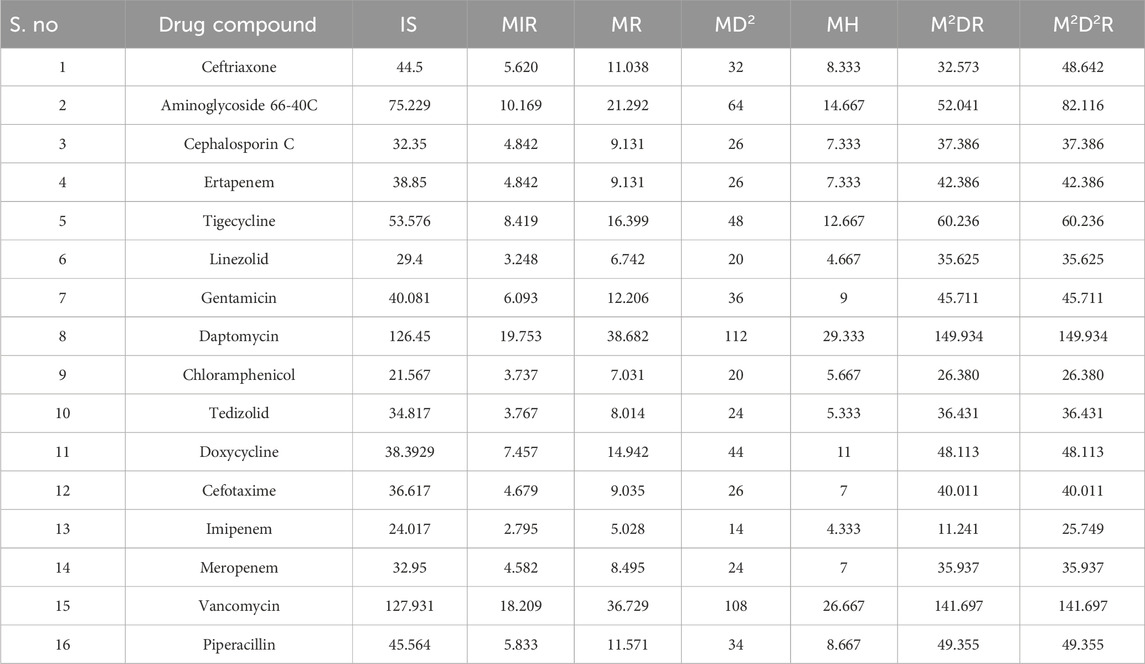
Table 4. Degree-based Adriatic TIs of NF medications.
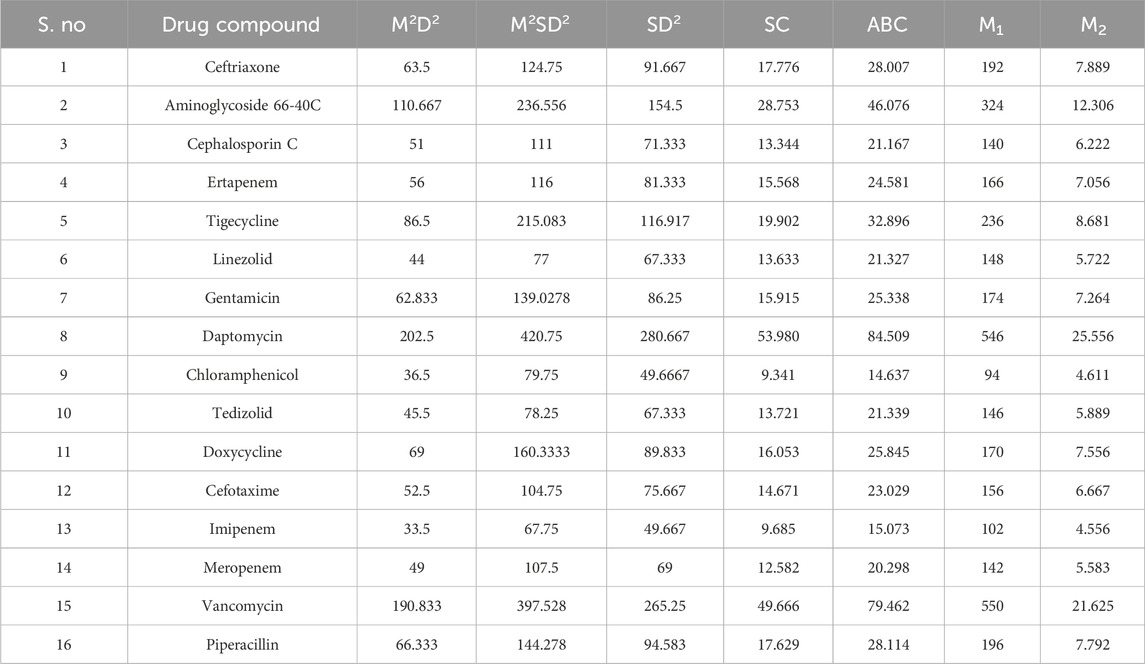
Table 5. Degree-based TIs of NF medications.
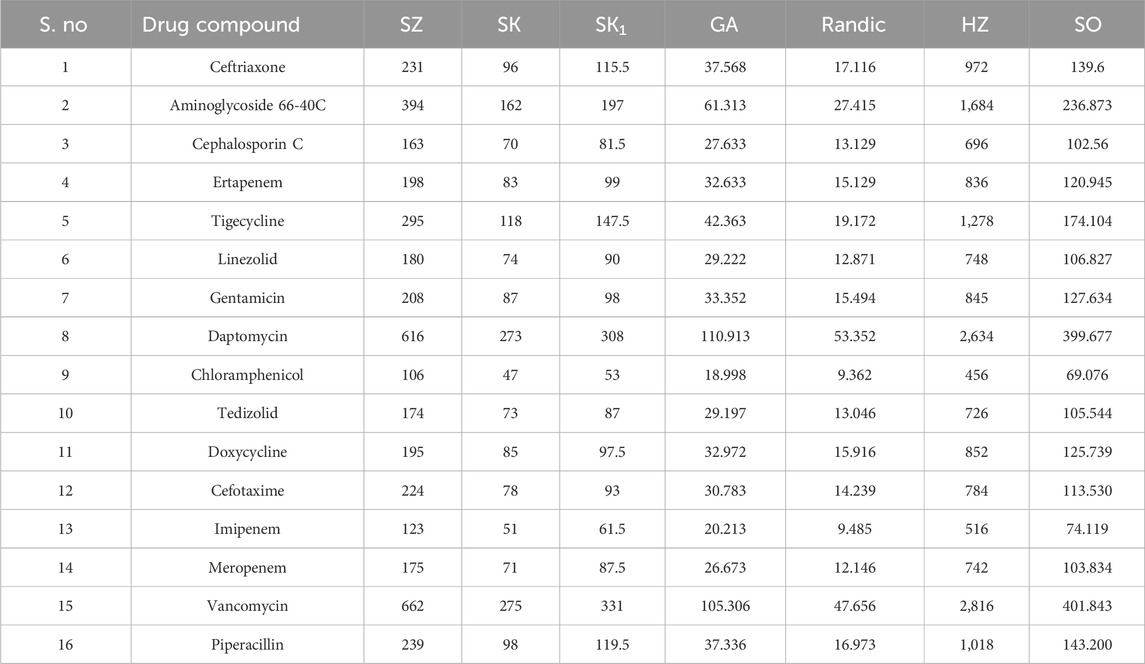
Table 6. Degree-based TIs of NF medications.
2.4 Regression models
Quantifying the relation between any chemical compound’s properties and corresponding TIs is an essential element of QSPR investigation (Shanmukha et al., 2020). Regression analysis and modeling are used as tools in QSPR investigations to accurately predict or estimate the properties of any compound using TIs (Gnanaraj et al., 2023; Shabbir, 2022). A statistical method called regression analysis is used to simulate a dependent variable and several independent variables jointly to evaluate the association between them (Yu et al., 2024). It is widely used in various fields of science and engineering to comprehend how distinct factors modulate the dependent variable and generate predictions. The fundamental concept is to find the line or curve that best captures the association between the variables. The dependent variable, or the attribute that is being investigated to explain or predict, is a response variable. Independent variables, often referred to as predictor variables or explanatory factors, are anticipated to have an impact on the dependent variable. There are various regression models, namely, linear regression, multi-linear regression, logarithmic regression, and curvilinear regression to mention a few. A QSPR model can be built when the desired correlation coefficient (r)
a.
b. Lowest
There is no universal cutoff (unlike R2 values) because the RMSE depends on the scale of the data. Research workers often judge RMSE <10% of the mean value of the physicochemical properties as excellent predictive accuracy and 10%–20% of the mean as acceptable for complex biological/chemical data. F-statistics were used to evaluate the quality of the model fit (Kirmani et al., 2021; Zaman et al., 2024). In the regression model, any trait with a p-value larger than 0.05 and a correlation greater than 0.6 was deemed significant (Jabeen et al., 2024). Because correlation values play an important role in the modeling, they are listed in Tables 7–9.
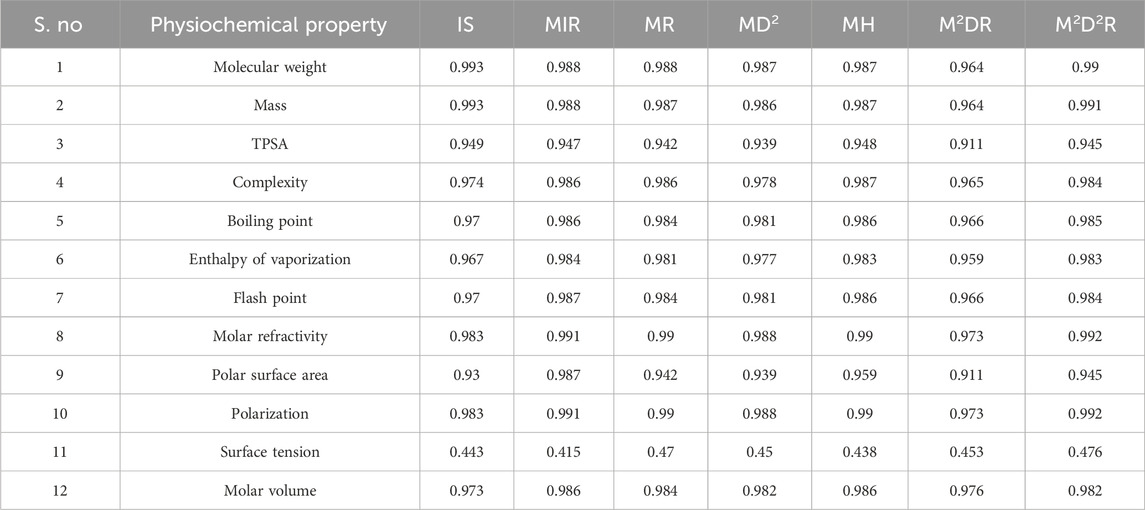
Table 7. Correlation values of degree-based TIs and NF medications.
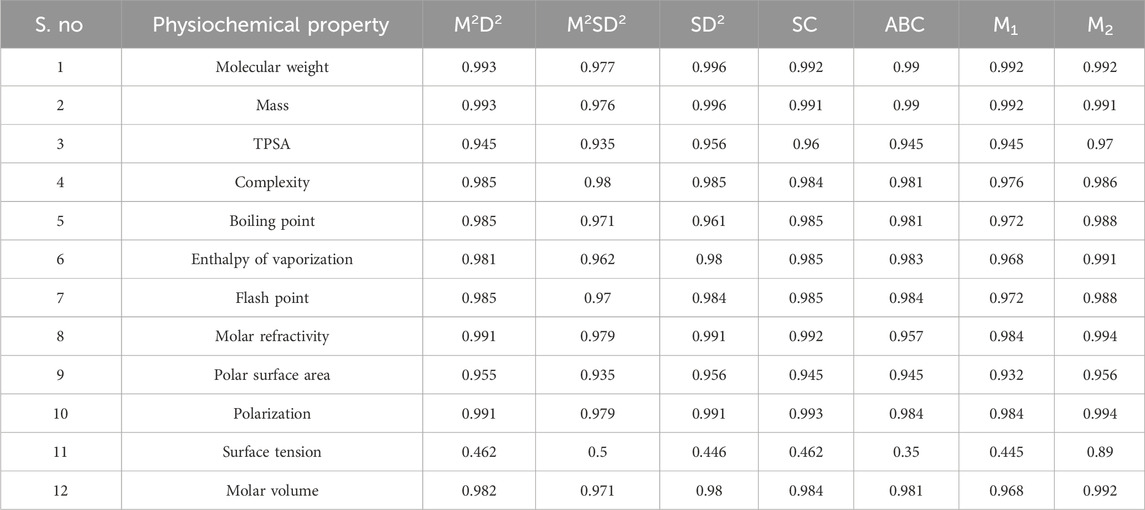
Table 8. Correlation values of degree-based TIs and NF medications.
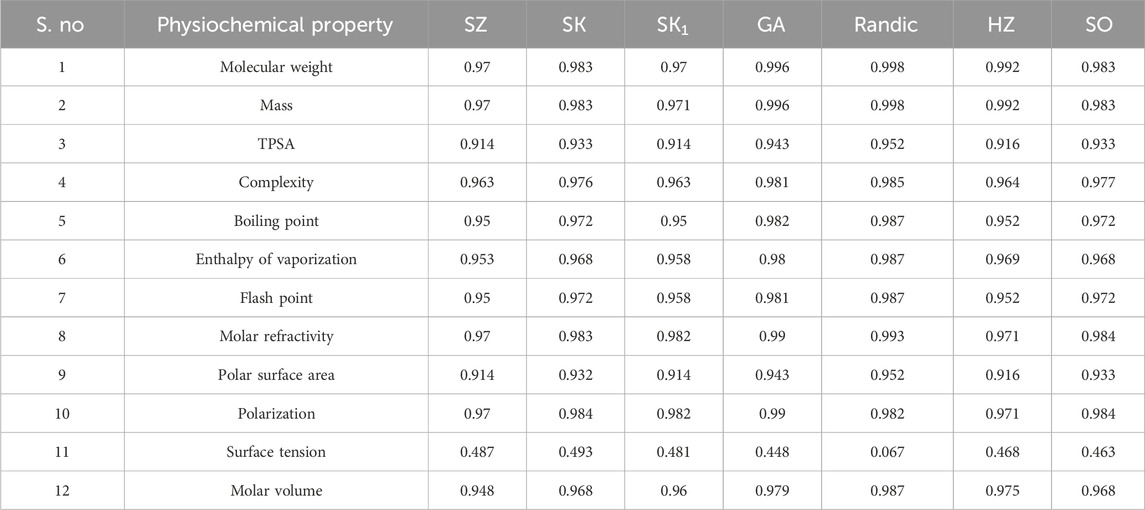
Table 9. Correlation values of degree-based TIs and NF medications.
From the above table, it is evident that the relationship between the properties and indices shows a very good correlation. Hence, linear, quadratic, and cubic regression models were generated to enable better prediction.
2.5 Linear regression analysis
The linear regression model can confirm the association because good correlation values are obtained. The TIs obtained for the molecular structures of the NF medications were regarded as independent variables, and the physicochemical attributes were designated as dependent variables. The linear regression models are given by the following equations:
where
2.6 Quadratic regression model
Quadratic regression is a strong statistical method for modeling associations that take the form of a parabolic curve between a dependent variable and one or more independent variables. This captures the curving trends and more intricate data patterns by fitting a second-degree polynomial to the data points. By exploring the underlying patterns in their datasets, investigators and analysts can enhance forecast accuracy, gain a deeper understanding of data trends, and make better decisions. The model is defined by the following equation:
where
2.7 Cubic regression
Cubic regression is a nonlinear statistical approach in which the dependent property (e.g., solubility and logP) is modeled as a cubic function of the molecular descriptors. Unlike linear or quadratic models, cubic regression can capture more complex, non-monotonic relationships between structural features and physicochemical properties, improving the predictive accuracy when higher-order interactions exist. The model is defined by the following equation:
where
2.8 Multi-attribute decision analysis of drugs
Drug design requires optimization across multiple, often contradictory, molecular features, such as ensuring solubility without sacrificing permeability, achieving a strong binding affinity with minimal toxicity, and balancing molecular weight with acceptable bioavailability. Assessing these criteria in isolation frequently creates trade-offs that complicate the lead selection process. Degree-based TIs provide a compact mathematical representation of molecular connectivity and demonstrate strong correlations with physicochemical descriptors, including polarity, lipophilicity, and mass. When incorporated into QSPR models, TIs allow predictive evaluation of pharmacokinetic and pharmacodynamic behavior. MCDM methods, such as TOPSIS and MOORA, integrate these descriptors into composite rankings, facilitating rational prioritization of NF antibiotics (Hezer et al., 2021; Feng et al., 2022).
2.9 TOPSIS ranking
The modified TOPSIS approach is based on identifying ideal and anti-ideal solutions, which are then used to calculate the distances among the different options and the ideal solution. This approach addresses qualitative and quantitative factors, and ranks the options based on their proximity to the ideal solution (Chakraborty, 2022; Madanchian and Taherdoost, 2023). The various steps involved in the process are presented in Figure 3.

Figure 3. Workflow process of the TOPSIS method.
The generic MADM problem aims to access and rank alternatives based on certain attributes (
To represent the relative significance of the attribute’s weights,
The MADM problem is represented by
This problem is solved using the modified TOPSIS method. The process is enumerated in the following stages.
Stage 1: calculate the normalized performance ratings
The normalized ratings
Stage 2: integrate weight with the ratings. The weight and ratings are combined to form the weighted normalized decision matrix
Stage 3: identify the positive and negative ideal solutions
Stage 4: obtain the weighted Euclidean distance.
Stage 5: obtain the overall performance score
The performance score
2.10 MOORA ranking
MOORA, developed by Brauers and Zavadskas, is a widely used MCDM approach. It is computationally efficient, conceptually simple, and particularly effective in addressing scenarios that involve multiple conflicting criteria. Its ability to integrate diverse molecular descriptors makes it highly suitable for drug design, where trade-offs among solubility, bioavailability, and toxicity are prevalent. MOORA is robust against normalization bias, ensuring consistent and reliable results when applied to drug-like property datasets. These features make it a valuable tool for QSPR studies and rational compound prioritization. The performance index
Here,
3 Results
A substantial set of 252 equations was created for each of the three regression models. This set was generated using 21 degree-based indices related to each of the 12 studied physicochemical properties. Finally, 756 equations were generated for the models, and their corresponding intercepts and constants were calculated.
Among all the models, the best predictive models were chosen using the factors essential for comprehension, as mentioned in Section 2.4.
The models exhibited strong correlations and reproducibility. Hence, the analysis indicates strong associations between TIs and NF drugs. This firmly supports the validity of our models. Consequently, the p-values for each parameter in the regression models were investigated. The best-fit regression models based on the aforementioned statistical parameters for the linear and quadratic QSPR models filtered from the large dataset are presented, and the rest of the regression equations are given in the Supplementary Information. Best-fit regression plots were calculated using Microsoft Excel software. The best predictions of the linear regression models and their statistical parameters are listed in Table 10.
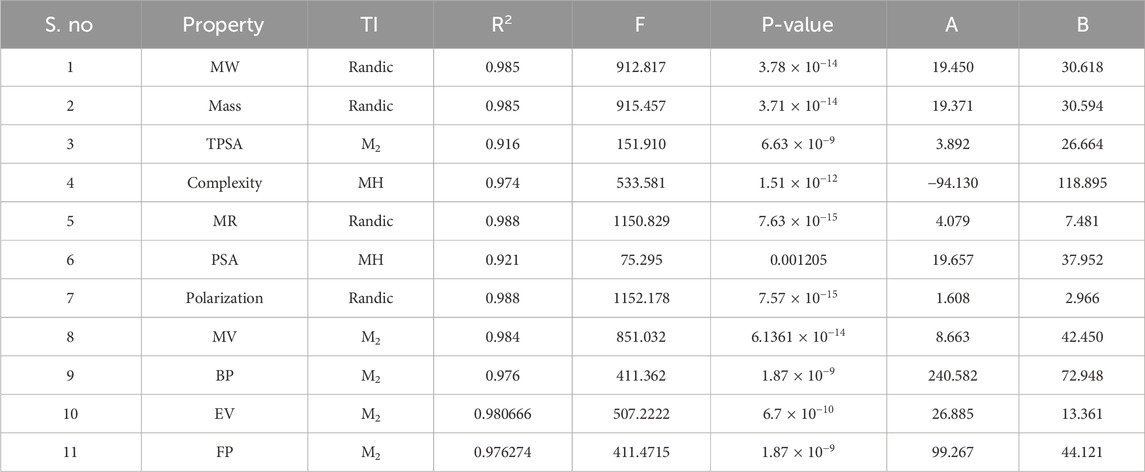
Table 10. Statistical parameters of the linear regression model.
Table 11 displays the visualization of the predicted and actual values (provided in Supplementary Information) from the best linear regression model (the scripting notations in the equations were replaced with x and y in the figures for convenient readability) using Python.
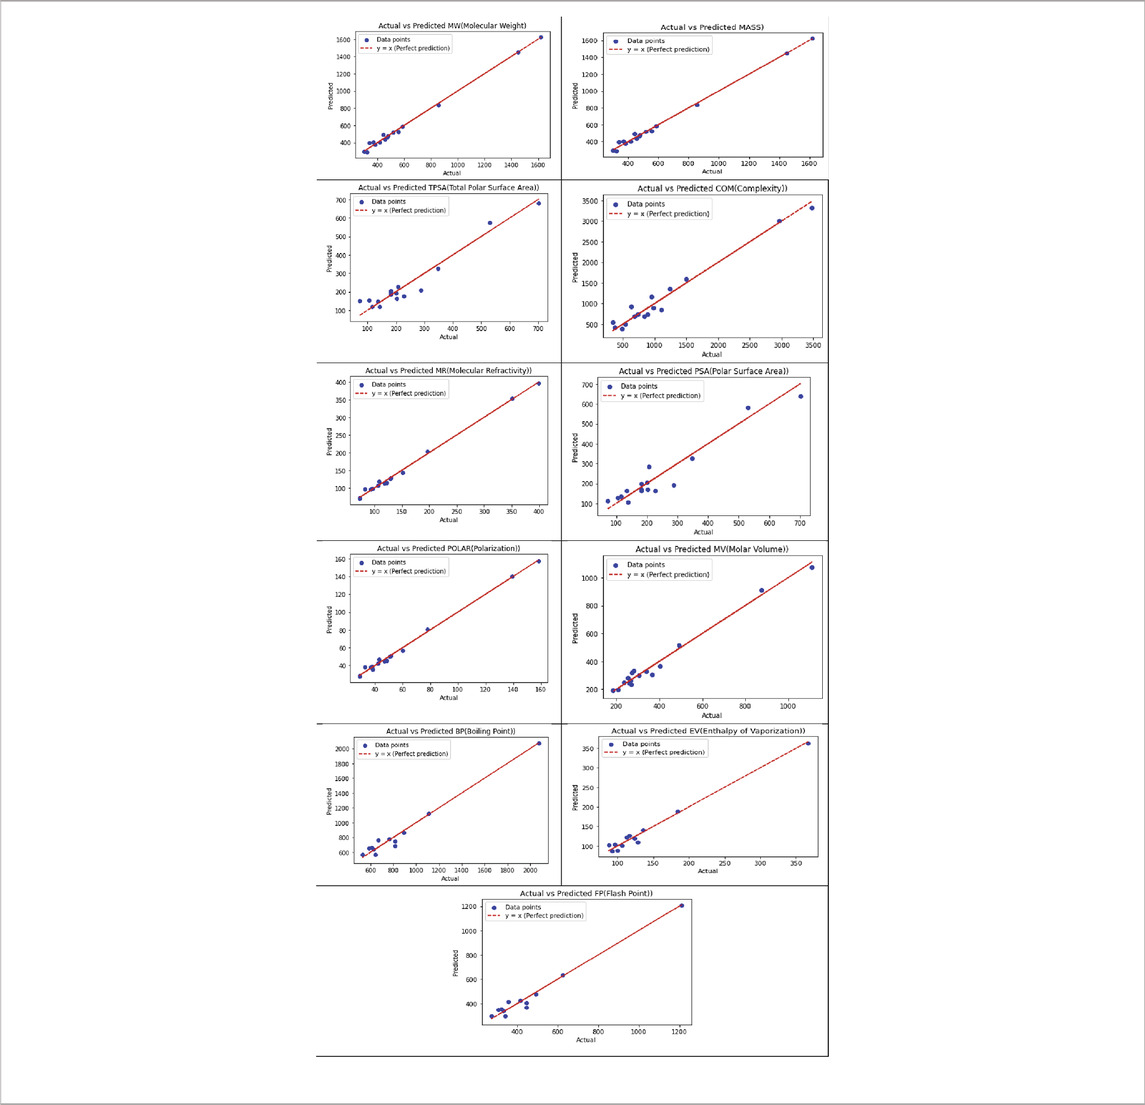
Table 11. Best-fit linear regression of the predicted and actual values for NF medications.
Of the 252 equations, six properties yielded the best-fit quadratic regression models, which are summarized in Table 12.
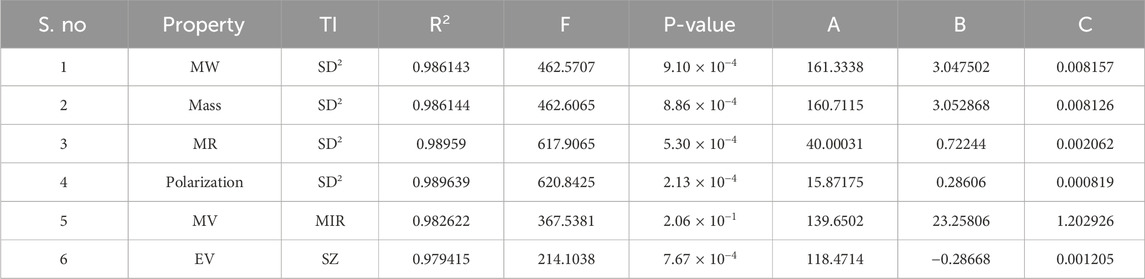
Table 12. Statistical parameters of the quadratic regression model.
Table 13 illustrates the predicted and actual values (provided in supplementary information) from the best quadratic regression model derived from this analysis using Python.
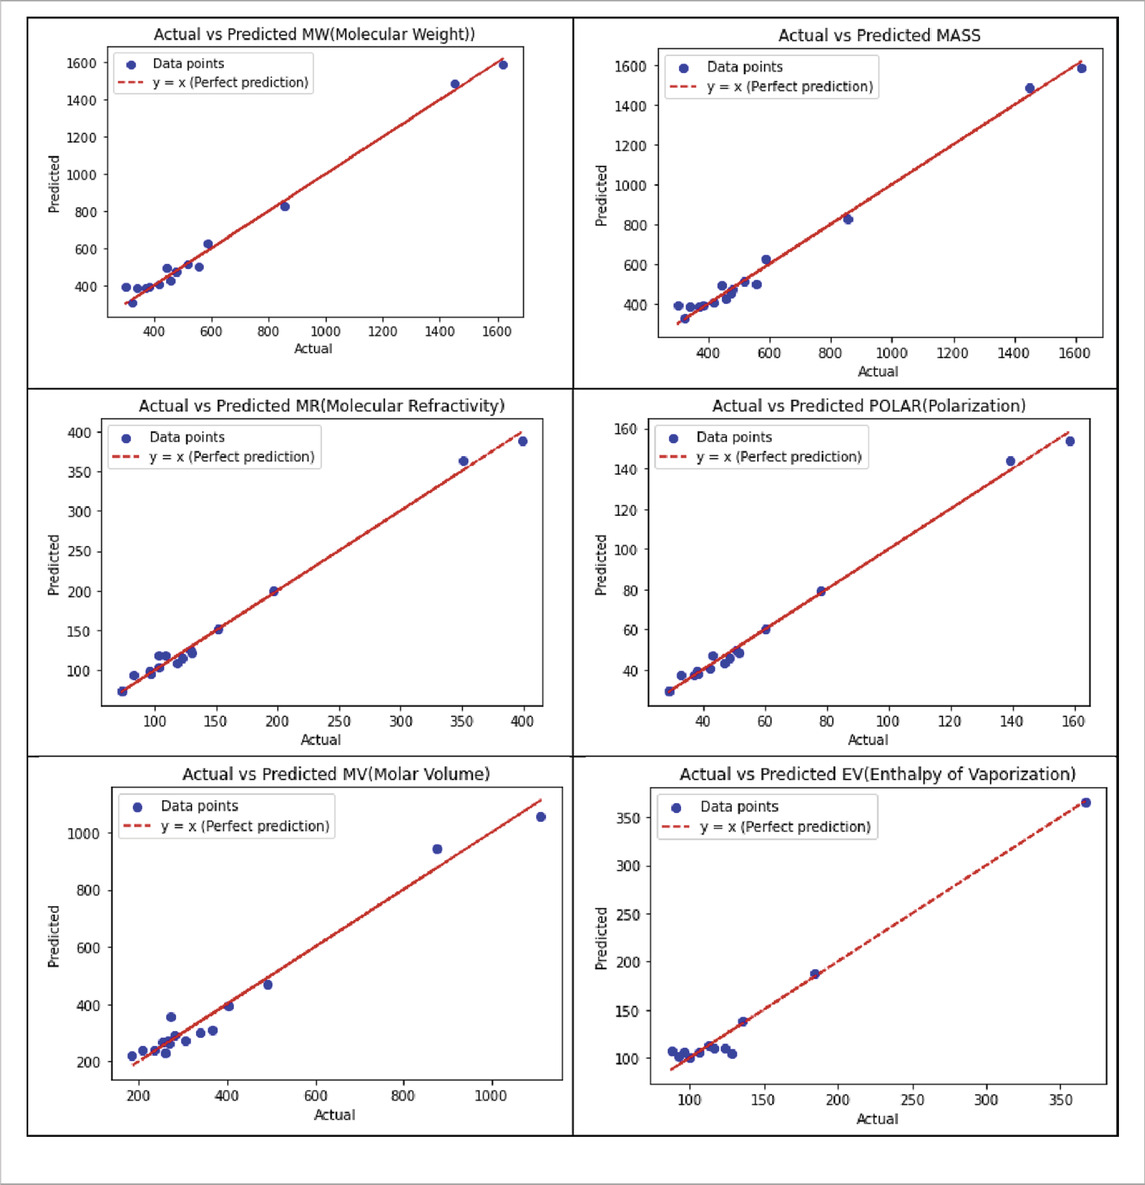
Table 13. Best-fit quadratic regression of the predicted and actual values for NF medications.
Of the 252 equations, four properties yielded the best-fit cubic regression models of the predicted and actual values, as summarized in Table 14 using python.
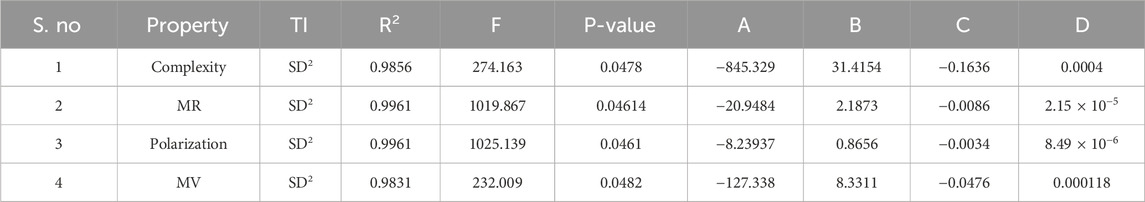
Table 14. Statistical parameters of the cubic regression model.
Table 15 illustrates the predicted and actual values from the best cubic regression model derived from this analysis using Python.
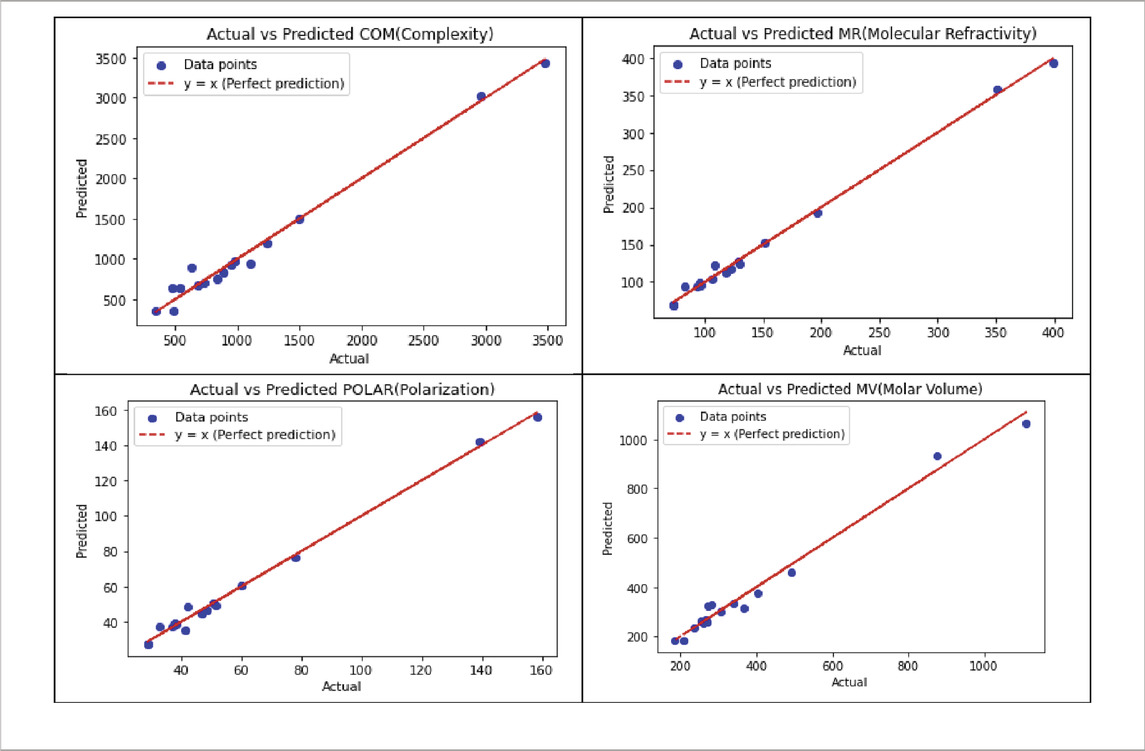
Table 15. Best-fit cubic regression of the predicted and actual values for NF medications.
3.1 TOPSIS ranking of antibiotics for NF
Among the 21 valency-based indices used in this study, six indices produced the best-fit regression models. These TI values were considered for ranking the NF antibiotics. The attributes and alternates used for ranking are displayed in Table 16.
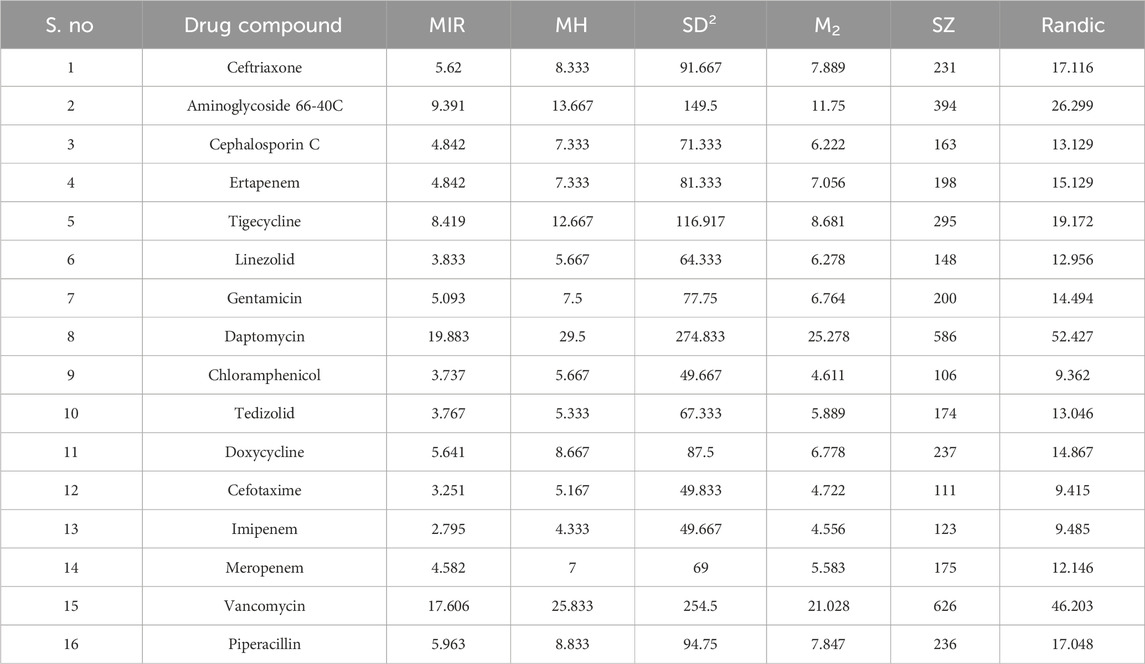
Table 16. TIs (attributes) utilized for ranking of NF medications (alternates).
The weights in this modified TOPSIS model indicate the proportion of a drug structure that must be considered. The drug structure has a wide range of influences on the chemical and physical characteristics. Hence, the weights were allocated according to the analytical hierarchy process. The relative importance of each pair of items is acquired from the results of the best-fit criteria. The weight allocation satisfying the condition
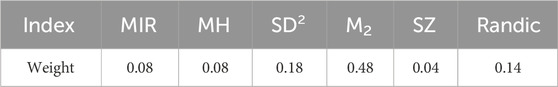
Table 17. Weights assigned for TIs.
The weighted normalized matrix calculated according to the procedure explained in stage 2 is presented in Table 18.
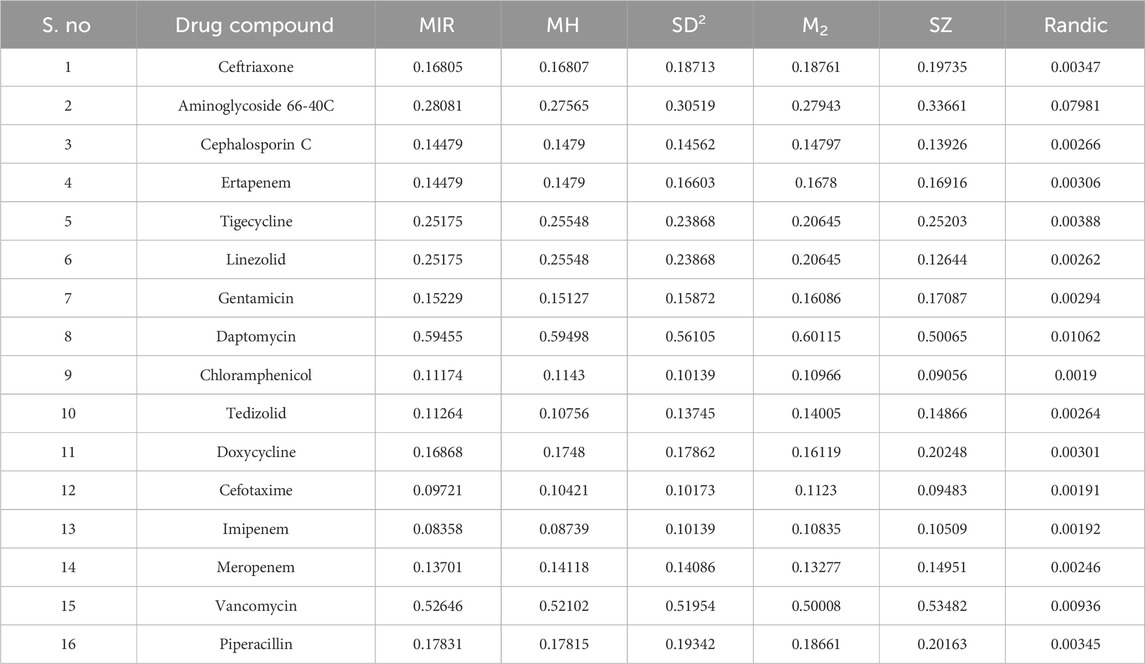
Table 18. Normalized matrix of NF medications.
The positive and negative ideal solutions calculated in stage 3 are listed in Table 19.
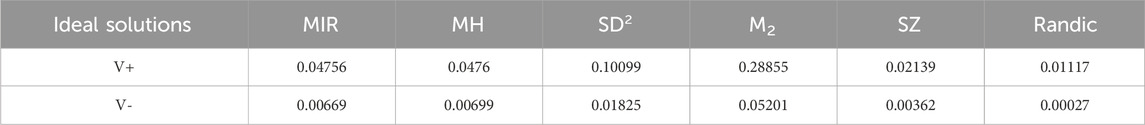
Table 19. Positive and negative ideal solutions of NF medications.
The weighted normalized matrix of the attributes and alternates of NF antibiotics is presented in Table 20.
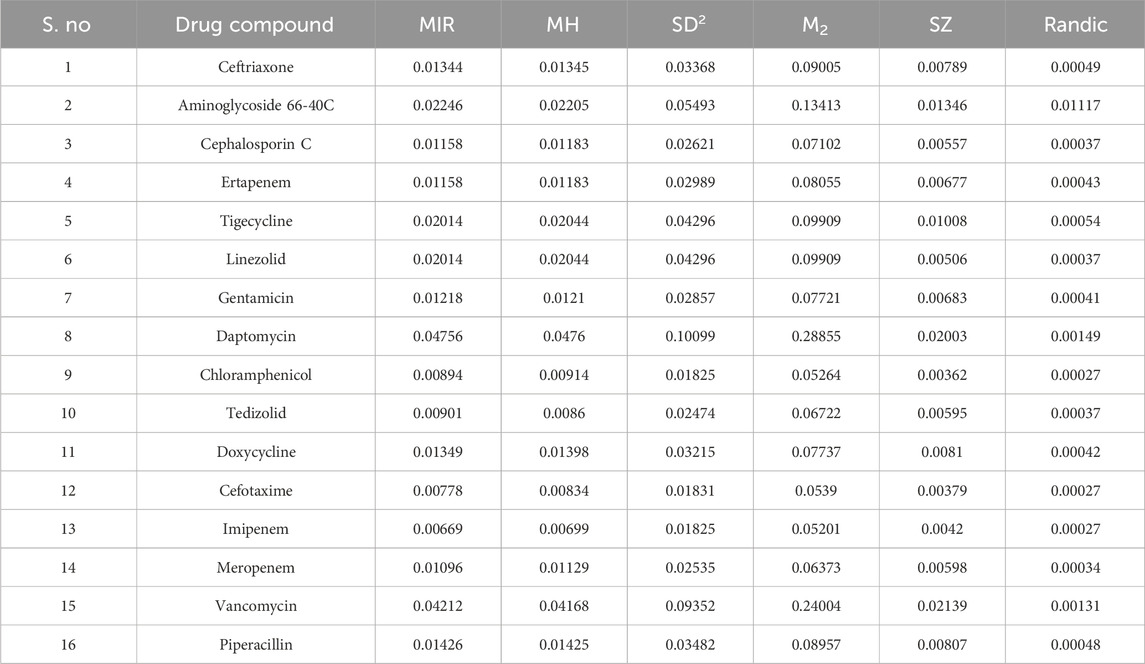
Table 20. Weighted normalized matrix of NF antibiotics.
The weighted Euclidean distance and performance scores of the NF antibiotics and their corresponding rankings calculated as the final stage of TOPSIS and MOORA are listed in Tables 21, 22, respectively.
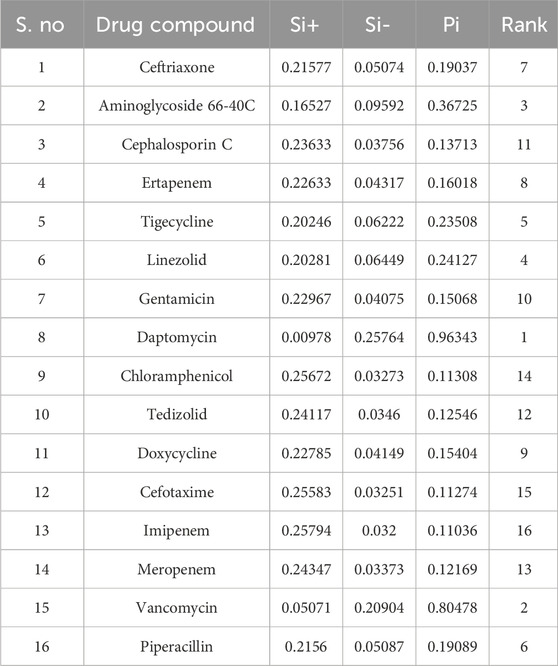
Table 21. Ranking of NF antibiotics by the TOPSIS method.
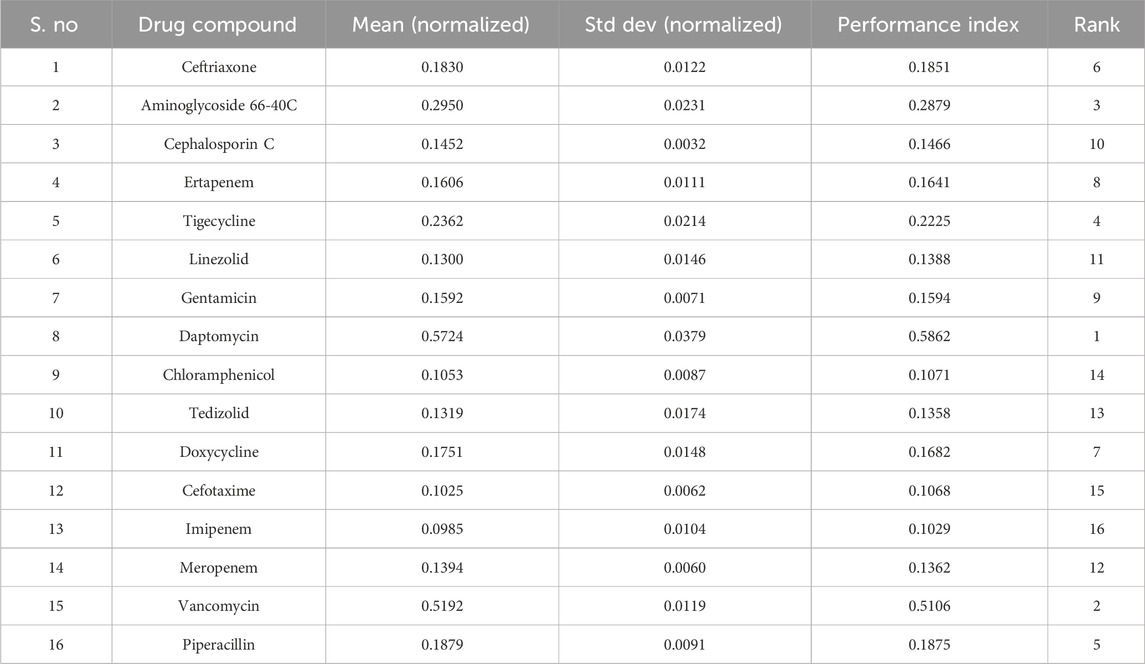
Table 22. Ranking of NF antibiotics using MOORA.
The rank correlation coefficients between TOPSIS and MOORA rankings of NF antibiotics by Spearman’s rank correlation (ρ) = 0.912, which is very high and statistically significant, showing a strong positive correlation between the two ranking methods. This confirms that although minor differences exist in mid-tier drugs, TOPSIS and MOORA are largely consistent in identifying the top and bottom performers.
4 Discussion
The molecular modeling framework utilized in this study uses complex simulations and regression analyses to predict the antibiotic behavior. Using 21 TIs correlated with 12 physicochemical properties, 504 equations were generated, of which 17 best-fit models were proven to be reliable for pharmacological repurposing. These results demonstrate that six indices—M2, Randić, SD2, MIR, SZ, and MH—consistently provided the strongest predictive power, with M2 emerging as the most effective index across multiple models. The weighted integration of these indices within a modified TOPSIS framework enabled the accurate ranking of NF antibiotics, supporting precise forecasting of drug properties. This ranking approach can guide pharmaceutical companies in prioritizing promising candidates for NF therapy, thereby reducing the costs and risks of clinical trials. Overall, this study establishes a robust quantitative methodology for linking molecular configurations to physicochemical properties, thus offering systematic applications in drug design and repurposing. A comparative analysis of the TOPSIS and MOORA methods revealed a strong consistency in identifying the best- and worst-performing antibiotics for NF.
The comparative ranking is visualized in Figure 4.
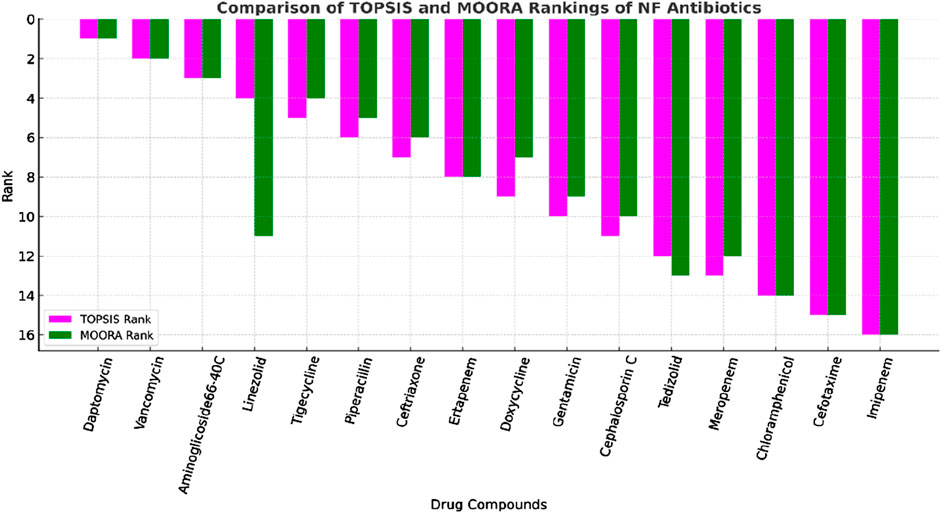
Figure 4. Ranking analysis of NF antibiotics based on TOPSIS and MOORA.
Daptomycin ranked first in both methods, confirming its superior performance, whereas vancomycin consistently ranked second, reflecting its strong structural and physicochemical profile. Aminoglycoside 66-40C was also ranked third by both, supported by MIR, MH, and S
5 Limitations and future work
Although the present analysis highlights the predictive strength of six degree-based topological indices (TIs) for modeling the physicochemical properties of antibiotics used to treat NF, certain limitations should be acknowledged. Out of the 21 indices considered, only a subset yielded statistically significant correlations, suggesting that several descriptors may lack discriminative ability for the dataset. This selective outcome also indicates the potential risk of overfitting, especially because the regression models were derived from a relatively small number of drugs. Furthermore, the scope of the study was limited to degree-based indices, excluding distance-, entropy-, and spectral-based descriptors that could capture the complementary structural features of the networks. The QSPR models were statistically validated but not tested against independent external datasets, which may restrict the generalizability of these findings. Similarly, the MCDM-based ranking depends on the selected criteria and weighting schemes, which introduce subjectivity into prioritization. Future studies should expand the dataset to include a broader range of antibiotics, integrate hybrid or machine learning-based models, and employ external validation to strengthen the predictive reliability. Incorporating diverse topological descriptors may also enhance the robustness of the drug-ranking frameworks.
6 Conclusion
In this study, we demonstrate the potential of degree-based TIs combined with regression and multi-criteria decision-making techniques to predict and rank the physicochemical properties of antibiotics used to treat NF. Among the 21 indices analyzed, six (M2, Randić, SD2, MIR, SZ, and MH) consistently produced the best-fit QSPR models, with M2 being the strongest predictor. The weighted integration of these indices within a modified TOPSIS framework, supported by MOORA validation, provided robust and consistent antibiotic rankings. These findings highlight a systematic, quantitative approach for drug repurposing and prioritization, offering valuable insights into rational NF therapy development.
Data availability statement
The original contributions presented in the study are included in the article/Supplementary Material, further inquiries can be directed to the corresponding author.
Author contributions
AJP: Conceptualization, Formal analysis, Investigation, Methodology, Resources, Validation, Visualization, Writing – original draft, Writing – review and editing. BJ: Writing – review and editing, Conceptualization, Investigation, Supervision, Validation.
Funding
The author(s) declare that financial support was received for the research and/or publication of this article. The article publication charges was covered by Vellore Institute of Technology, Chennai, India.
Conflict of interest
The authors declare that the research was conducted in the absence of any commercial or financial relationships that could be construed as a potential conflict of interest.
Generative AI statement
The author(s) declare that no Generative AI was used in the creation of this manuscript.
Any alternative text (alt text) provided alongside figures in this article has been generated by Frontiers with the support of artificial intelligence and reasonable efforts have been made to ensure accuracy, including review by the authors wherever possible. If you identify any issues, please contact us.
Publisher’s note
All claims expressed in this article are solely those of the authors and do not necessarily represent those of their affiliated organizations, or those of the publisher, the editors and the reviewers. Any product that may be evaluated in this article, or claim that may be made by its manufacturer, is not guaranteed or endorsed by the publisher.
Supplementary material
The Supplementary Material for this article can be found online at: https://www.frontiersin.org/articles/10.3389/fchem.2025.1668093/full#supplementary-material
References
Abdullah, A., Biswas, P., Sahabuddin, M., Mubasharah, A., Khan, D. A., Hossain, A., et al. (2023). Molecular dynamics simulation and pharmacoinformatic integrated analysis of bioactive phytochemicals from Azadirachta indica (neem) to treat diabetes mellitus. J. Chem. 2023, 1–19. doi:10.1155/2023/4170703
Adnan, Mr, Bokhary, S. A. U. H., Abbas, G., and Iqbal, T. (2022). Degree-based topological indices and QSPR analysis of antituberculosis drugs. J. Chem. 2022, 1–17. doi:10.1155/2022/5748626
Amin, S., Rehman Virk, A. U., Rehman, M. A., and Shah, N. A. (2021). Analysis of dendrimer generation by sombor indices. J. Chem. 2021, 1–11. doi:10.1155/2021/9930645
Anuradha, D. S., and Jaganatha, B. (2024). Physiochemical properties of benzophenone and curcumin-conjugated PAMAM dendrimers using topological indices. Polycycl. Aromat. Compd. 44, 3419–3441. doi:10.1080/10406638.2023.2234542
Anuradha, D. S., and Jaganathan, B. (2023). Topological properties of boron triangular sheet for robotic finger flex motion through indices, 2946. doi:10.1063/5.0178070
Anuradha, D. S., and Jaganathan, B. (2025). Predictive modelling and ranking: azadirachta indica compounds through indices and multi-criteria decision-making techniques. Front. Chem. 13, 1580267. doi:10.3389/fchem.2025.1580267
Anuradha, D. S., Julietraja, K., Jaganathan, B., and Alsinai, A. (2024). Curcumin-conjugated PAMAM dendrimers of two generations: comparative analysis of physiochemical properties using adriatic topological indices. ACS Omega 9, 14558–14579. doi:10.1021/acsomega.4c00686
Baby, A., Julietraja, K., and Xavier, D. A. (2023). On molecular structural characterization of cyclen cored dendrimers. Polycycl. Aromat. Compd. 0, 707–729. doi:10.1080/10406638.2023.2179641
Balasubramaniyan, D., and Chidambaram, N. (2023). On some neighbourhood degree-based topological indices with QSPR analysis of asthma drugs. Eur. Phys. J. Plus 138, 823. doi:10.1140/epjp/s13360-023-04439-7
Bisgaard, E. K., and Bulger, E. M. (2024). Current diagnosis and management of necrotizing soft tissue infections: what you need to know. J. Trauma Acute Care Surg. 97, 678–686. doi:10.1097/TA.0000000000004351
Büyükköse, Ş., and Cangul, I. N. (2022). Some notes on Randi´c index. Bol. Soc. Parana. Mat. 40, 1–7. doi:10.5269/bspm.47213
Chakraborty, S. (2022). TOPSIS and modified TOPSIS: a comparative analysis. Decis. Anal. J. 2, 100021. doi:10.1016/j.dajour.2021.100021
Choudhary, O. P., Rana, R., Ali, A. B., and Sharma, V. (2024). Emergence of STSS in Japan: an assessment of the threat and containment strategies. New Microbes New Infect. 60-61, 101449–101461. doi:10.1016/j.nmni.2024.101449
Costa, P. C. S., Evangelista, J. S., Leal, I., and Miranda, P. C. M. L. (2021). Chemical graph theory for property modeling in qsar and Qspr—charming QSAR & QSPR. Mathematics 9, 60–19. doi:10.3390/math9010060
Cruz, R., Gutman, I., and Rada, J. (2021). Sombor index of chemical graphs. Appl. Math. Comput. 399, 126018. doi:10.1016/j.amc.2021.126018
Cruz, R., Monsalve, J., and Rada, J. (2022). Randić energy of digraphs. Heliyon 8, e11874. doi:10.1016/j.heliyon.2022.e11874
da Costa Senior, O., Van de Casteele, E., Van Hemelen, G., Nadjmi, N., and Vercruysse, H. (2024). Facing a new reality: significant increase in necrotizing fasciitis in the post-COVID era? J. Stomatol. Oral Maxillofac. Surg. 126, 102145. doi:10.1016/j.jormas.2024.102145
Feng, J., Yan, Y., Huang, M., Du, Y., Lu, Z., and Li, B. (2022). A study on the multi-attribute decision theory and methods. Procedia. Comput. Sci. 544–551. doi:10.1016/j.procs.2022.11.210
Gnanaraj, L. R. M., Ganesan, D., and Siddiqui, M. K. (2023). Topological indices and QSPR analysis of NSAID drugs. Polycycl. Aromat. Compd. 43, 9479–9495. doi:10.1080/10406638.2022.2164315
Gutman, I., and Redžepović, I. (2022). Sombor energy and Hückel rule. Discrete Math. Lett. 9, 67–71. doi:10.47443/dml.2021.s211
Harshavardhan, K. S., Anuradha, D. S., and Jaganathan, B. (2025). Double bond indices and their application: QSAR of polycyclic aromatic hydrocarbons. Util. Math. 122, 3–27. doi:10.61091/um122-01
Hezer, S., Gelmez, E., and Özceylan, E. (2021). Comparative analysis of TOPSIS, VIKOR and COPRAS methods for the COVID-19 regional safety assessment. J. Infect. Public Health 14, 775–786. doi:10.1016/j.jiph.2021.03.003
Huang, L., Wang, Y., Pattabiraman, K., Danesh, P., Siddiqui, M. K., and Cancan, M. (2023). Topological indices and QSPR modeling of new antiviral drugs for cancer treatment. Polycycl. Aromat. Compd. 43, 8147–8170. doi:10.1080/10406638.2022.2145320
Jabeen, A., Ahmad, S., and Zaman, S. (2024). The study of regression model based on CoM-polynomial in blood cancer drug properties. Partial Differ. Equations Appl. Math. 9, 100648. doi:10.1016/j.padiff.2024.100648
Jain, N., Lansiaux, E., and Reinis, A. (2023). Group A streptococcal (GAS) infections amongst children in Europe: taming the rising tide. New Microbes New Infect. 51, 101071. doi:10.1016/j.nmni.2022.101071
Joy, P. A., and Jaganathan, B. (2025). Internal functionalized drug delivery dendrimers: theoretical analysis by descriptors. Lett. Appl. NanoBioScience 14. doi:10.33263/LIANBS142.065
Kansal, N., Garg, P., and Singh, O. (2023). Temperature-based topological indices and QSPR analysis of COVID-19 drugs. Polycycl. Aromat. Compd. 43, 4148–4169. doi:10.1080/10406638.2022.2086271
Kanwal, S., Farooq, Y., Siddiqui, M. K., Idrees, N., Razzaque, A., and Petros, F. B. (2023). Study the behavior of drug structures via chemical invariants using TOPSIS and SAW. Comput. Math. Methods Med. 2023, 4262299. doi:10.1155/2023/4262299
Kirana, B., Shanmukha, M. C., and Usha, A. (2024). A QSPR analysis and curvilinear regression for various degree-based topological indices of quinolone antibiotics. doi:10.21203/rs.3.rs-3887676/v1
Kirmani, S. A. K., Ali, P., and Azam, F. (2021). Topological indices and QSPR/QSAR analysis of some antiviral drugs being investigated for the treatment of COVID-19 patients. Int. J. Quantum Chem. 121, e26594–22. doi:10.1002/qua.26594
Kulkarni, V. S., Alagarsamy, V., Solomon, V. R., Jose, P. A., and Murugesan, S. (2023). Drug repurposing: an effective tool in modern drug discovery. Russ. J. Bioorg Chem. 49, 157–166. doi:10.1134/S1068162023020139
Lovis, J., Krebs, T., Grünert, J., and Häcker, F. M. (2023). Necrotizing fasciitis after varicella infection in children: a case series. J. Pediatr. Surg. Case Rep. 98, 102725. doi:10.1016/j.epsc.2023.102725
Madanchian, M., and Taherdoost, H. (2023). A comprehensive guide to the TOPSIS method for multi-criteria decision making. Sustain. Soc. Dev. 1. doi:10.54517/ssd.v1i1.2220
Mahboob, A., Rasheed, M. W., Dhiaa, A. M., Hanif, I., and Amin, L. (2024). On quantitative structure-property relationship (QSPR) analysis of physicochemical properties and anti-hepatitis prescription drugs using a linear regression model. Heliyon 10, e25908. doi:10.1016/j.heliyon.2024.e25908
Misiakos, E. P., Bagias, G., Patapis, P., Sotiropoulos, D., Kanavidis, P., and Machairas, A. (2014). Current concepts in the management of necrotizing fasciitis. Front. Surg. 1, 36. doi:10.3389/fsurg.2014.00036
Mondal, S., Dey, A., De, N., and Pal, A. (2021). QSPR analysis of some novel neighbourhood degree-based topological descriptors. Complex Intelligent Syst. 7, 977–996. doi:10.1007/s40747-020-00262-0
Moshfegh, F., Hosseinzade, Z., Salehi, S. H., Javanbakht, M., Manafi Anari, A., and Sobouti, B. (2025). Rapidly progressing necrotizing fasciitis with chickenpox infection: a case series. J. Pediatr. Surg. Case Rep. 112, 102925. doi:10.1016/j.epsc.2024.102925
Murugan, G., Julietraja, K., and Alsinai, A. (2023). Computation of neighborhood M-Polynomial of cycloparaphenylene and its variants. ACS Omega 8, 49165–49174. doi:10.1021/acsomega.3c07294
Pattabiraman, K., and Cancan, M. (2023). QSPR modeling with topological indices of some potential drugs against cancer. Polycycl. Aromat. Compd. 1–28. doi:10.1080/10406638.2023.2189270
Pratheeba, A., and Aarthi, P. (2025). Degree-based topological indices for QSPR/QSAR modelling of cardiovascular antihypertensive agents using statistical regression techniques. Bionanoscience 15, 505. doi:10.1007/s12668-025-02088-x
Pulakos, E. D., Arad, S., Donovan, M. A., and Plamondon, K. E. (2000). Adaptability in the workplace: development of a taxonomy of adaptive performance. J. Appl. Psychol. 85, 612–624. doi:10.1037/0021-9010.85.4.612
Saidi, N. H. A. M., Husin, M. N., and Ismail, N. B. (2020). On the Zagreb indices of the line graphs of polyphenylene dendrimers. J. Discrete Math. Sci. Cryptogr. 23, 1239–1252. doi:10.1080/09720529.2020.1822041
Shabbir, A. (2022). Computing and comparative analysis of topological invariants of symmetrical carbon nanotube Y junctions. Arabian J. Chem. 15, 103509. doi:10.1016/j.arabjc.2021.103509
Shanmukha, M. C., Basavarajappa, N. S., Shilpa, K. C., and Usha, A. (2020). Degree-based topological indices on anticancer drugs with QSPR analysis. Heliyon 6, e04235. doi:10.1016/j.heliyon.2020.e04235
Shi, X., Kosari, S., Ghods, M., and Kheirkhahan, N. (2025). Innovative approaches in QSPR modelling using topological indices for the development of cancer treatments. PLoS One 20, e0317507. doi:10.1371/journal.pone.0317507
Suresh, M., Tolasa, F. T., and Bonyah, E. (2024). QSPR/QSAR study of antiviral drugs modeled as multigraphs by using TI’s and MLR method to treat COVID-19 disease. Sci. Rep. 14, 13150. doi:10.1038/s41598-024-63007-w
Tantirat, P., Rattanathumsakul, T., Praekunatham, H., Pachanee, K., and Suphanchaimat, R. (2020). Epidemiological situation of necrotizing fasciitis and factors in Thailand and factors associated with its morbidity and mortality, 2014–2018. Risk Manag. Healthc. Policy 13, 1613–1624. doi:10.2147/RMHP.S263974
Tharmalingam, G., Ponnusamy, K., Govindhan, M., and Konsalraj, J. (2023). On certain degree based and bond additive molecular descriptors of hexabenzocorenene. Biointerface Res. Appl. Chem. 13, 1–14. doi:10.33263/BRIAC135.495
Vignesh, R., Walwekar, A., Shettar, V., and Walwekar, R. (2024). A prospective study of demographic, clinical profile, treatment of necrotizing fasciitis, and its consequences. Natl. J. Physiol. Pharm. Pharmacol. 14, 1. doi:10.5455/njppp.2024.14.03137202404042024
Vukicevic, D., and Gasperov, M. (2010). Bond additive modeling 1. Adriatic indices. Croat. Chem. Acta 83, 243–260. Available online at: https://api.semanticscholar.org/CorpusID:35024968.
Yang, J., Konsalraj, J., and Raja S, A. A. (2023). Neighbourhood sum degree-based indices and entropy measures for certain family of graphene molecules. Molecules 28, 168. doi:10.3390/molecules28010168
Yousaf, S., and Shahzadi, K. (2024). Utilizing topological indices in QSPR modeling to identify non-cancer medications with potential anti-cancer properties: a promising strategy for drug repurposing. Front. Chem. 12, 1410882. doi:10.3389/fchem.2024.1410882
Yu, X., Guo, Z., Zhang, M., Fu, Q., and Zhou, J. (2022). Clinical analysis of diagnosis and treatment of necrotizing fasciitis. Eur. J. Inflamm. 20, 1721727X221141822. doi:10.1177/1721727X221141822
Yu, G., Siddiqui, M. K., Hussain, M., Hussain, N., Saddique, Z., and Petros, F. B. (2024). On topological indices and entropy measures of beryllonitrene network via logarithmic regression model. Sci. Rep. 14, 7187. doi:10.1038/s41598-024-57601-1
Zaman, S., Yaqoob, H. S. A., Ullah, A., and Sheikh, M. (2024). QSPR analysis of some novel drugs used in blood cancer treatment via degree based topological indices and regression models. Polycycl. Aromat. Compd. 44, 2458–2474. doi:10.1080/10406638.2023.2217990
Zaman, S., Majeed, M. U., Ahmed, W., and Saleem, M. T. (2025). On neighborhood eccentricity-based topological indices with QSPR analysis of PAHs drugs. Meas. (Mahwah N J) 23, 199–212. doi:10.1080/15366367.2024.2329950
Zhang, C. S., Chicoine, N., Thede, K., Frink, I., Singh, K., and Bochan, M. (2023). A case report of necrotizing fasciitis caused by Haemophilus influenzae co-infection in the setting of COVID-19 pneumonia. Int. J. Surg. Case Rep. 106, 108264. doi:10.1016/j.ijscr.2023.108264
Keywords: degree-based indices, necrotizing fasciitis, regression analysis, quantitative structure–property relationship, multi-criteria decision-making, technique for order of preference by similarity to ideal solution, multi-objective optimization on the basis of ratio analysis
Citation: Joy Prisca A and Jaganathan B (2025) Quantitative structure–property relationship modeling and ranking of necrotizing fasciitis drugs via degree-based topological indices. Front. Chem. 13:1668093. doi: 10.3389/fchem.2025.1668093
Received: 17 July 2025; Accepted: 22 September 2025;
Published: 28 October 2025.
Edited by:
Renjith Thomas, Mahatma Gandhi University, IndiaReviewed by:
Muhammad Kamran Siddiqui, COMSATS University Islamabad, PakistanNadeem Ul Hassan Awan, Gazi University, Türkiye
Copyright © 2025 Joy Prisca and Jaganathan. This is an open-access article distributed under the terms of the Creative Commons Attribution License (CC BY). The use, distribution or reproduction in other forums is permitted, provided the original author(s) and the copyright owner(s) are credited and that the original publication in this journal is cited, in accordance with accepted academic practice. No use, distribution or reproduction is permitted which does not comply with these terms.
*Correspondence: B. Jaganathan, amFnYW5hdGhhbi5iQHZpdC5hYy5pbg==