 GeZhiChen Li
- School of Information Science and Engineering, Shandong Normal University, Jinan, China
Introduction: Accurate monitoring of oxide compositions is critical for ensuring cement quality and performance in industrial production. Conventional analytical techniques for this purpose are often time-consuming, costly, and lack real-time capability. While Near-infrared (NIR) spectroscopy offers a rapid and non-destructive alternative, traditional chemometric models struggle to capture the highly nonlinear, high-dimensional spectral characteristics and exhibit limited interpretability.
Methods: To address these challenges, this paper proposes an interpretable TabNet-based multi-output regression method for predicting multiple oxide concentrations from NIR spectra. The proposed method integrates sparse feature selection with adaptive information aggregation, enabling it to dynamically prioritize the most informative spectral regions during processing. This architecture facilitates both automatic wavelength selection and accurate oxide content prediction.
Results: Extensive experiments on two cement datasets demonstrate that the proposed TabNet model consistently outperformed established baseline models in predictive accuracy. A key advantage of the TabNet framework is its enhanced interpretability, achieved by generating sequential attention masks that highlight chemically meaningful wavebands associated with each oxide component.
Discussion: This framework provides a scalable and insightful solution for spectral-based analysis, not only for cement quality monitoring but also for other materials science applications. The code is available at https:// github.com/Andrew-Leopard/CementOxidePredictor.
1 Introduction
Cement is a cornerstone of the global construction industry, and its manufacturing quality largely depends on the precise control of raw meal composition (Sambataro et al., 2024; Yang et al., 2022). The concentrations of key oxides (SiO2, Al2O3, Fe2O3, CaCO3) play a decisive role in governing clinkering reactions, mineral formation, and overall product stability (Castillo et al., 2025). Rapid and accurate prediction of these oxides is essential for improving dosing accuracy, energy efficiency, and cement quality stability (Hu et al., 2025). Traditional oxide quantification techniques, such as X-ray fluorescence and wet chemical analysis, provide high accuracy but are time-consuming, labor-intensive, and costly, making them unsuitable for real-time quality control in large-scale cement production (Polavaram and Garg, 2021). Near-infrared (NIR) spectroscopy has emerged as a promising analytical tool for cement raw meal analysis because it is reagent-free, non-invasive, and capable of providing rapid measurements (Casson et al., 2020; Haruna et al., 2023). However, modeling the complex spectral-chemical relationship remains a challenge due to the high dimensionality and redundancy of NIR data, coupled with nonlinear interactions among variables.
Recent advances in machine learning (ML) have greatly improved the analysis of high-dimensional spectral data, enabling robust predictions of material properties (Huang et al., 2021; Wu et al., 2024). Such as partial least squares regression (PLSR) and Random Forest, have been widely used for NIR spectral modeling (Alessandra and Tormod, 2019; Mishra et al., 2021). A key limitation of these methods is their dependence on manual preprocessing and dimensionality reduction, which restricts their capacity to model the intricate nonlinearities in cement spectral data (Zhang Y et al., 2024). Hybrid approaches have attempted to improve predictive accuracy through feature-level spectral fusion and wavelength selection (Acquarelli et al., 2017; Ma et al., 2025). For example, Haruna et al. used NIR with multivariate calibration for rapid phenolic analysis in peanuts, and later integrated LIBS and NIRS to improve oxide quantification in cement (Haruna, et al., 2023). Despite these efforts, the existing methods remain reliant on handcrafted feature engineering and lack interpretability (Lee and Kim, 2016). Deep learning enables automatic feature extraction and relationship modeling, offering a promising solution for hyperspectral data analysis (Qu et al., 2021). However, most deep learning models require large amounts of training data, which are difficult to obtain in industrial cement production. At present, there is a lack of deep learning-based predictive frameworks specifically designed for oxide analysis in cement raw meal.
To tackle the above challenges, this paper propose a novel multi-output regression model inspired by the TabNet for accurate oxide content estimation (Arik and Pfister, 2021). TabNet is a deep learning architecture specifically designed for structured tabular data, combining the interpretability of decision trees with the representation power of neural networks. Compared with conventional deep learning approaches such as convolutional neural networks (CNNs) or recurrent neural networks (RNNs), which are typically designed for image or sequential data, TabNet offers several unique advantages that make it particularly suitable for NIR spectral analysis. Specifically, the method combines feature and attentive transformers with sparsemax activation and multiple decision steps, for effective modeling of nonlinear patterns in complex spectral data. The TabNet integrates feature learning, selection, and interpretation in a unified framework, making it particularly suitable for high-dimensional spectral data. This paper conduct a series of experiments to evaluate method performance, analyze feature attribution patterns, and explore inter-regional spectral dependencies. Extensive experiments on two real-world datasets from Qufu and Linyi demonstrate that TabNet significantly outperforms traditional models in both RMSE and R2 across all oxides. The method achieves an average R2 of 0.922 and RMSE of 0.097 on the Qufu dataset, and interpretable attention maps that align with known molecular vibration bands. In the future, this method can be broadly applied to other inorganic materials, geological analyses, and real-time industrial process monitoring. The main contributions of this work are as follows:
1. This paper develop a novel TabNet-based regression method that leverages shared representations to capture correlations among multiple oxides. This architecture achieves superior predictive accuracy while demonstrating remarkable generalization capability across different production regions, establishing a new paradigm for multi-output spectral analysis.
2. This paper develop an end-to-end analytical system that automatically processes raw high-dimensional NIR spectra without manual intervention. The framework seamlessly integrates wavelength selection and concentration prediction within a unified architecture, effectively eliminating the dependency on conventional feature engineering.
3. This paper establish an interpretable spectral-oxide correlation paradigm through a sparse attention mechanism to identify key spectral bands associated with oxide-specific molecular vibrations, providing intuitive interpretability of the spectral feature information.
2 Materials and methods
2.1 Overview
Cement quality is critically determined by the concentration of major oxides in raw meal, including SiO2, Al2O3, Fe2O3, and CaCO3. To predict cement oxide contents from spectral data, this paper propose a TabNet-based regression method that integrates feature learning, selection, and interpretation within a unified framework. The overall architecture is shown in Figure 1, which mainly includes three parts: input data, feature selection and aggregation information. The model first transforms the input spectral data using a feature transformer and batch normalization. At each decision step, an attentive transformer generates sparse feature masks to dynamically select the most relevant wavelengths. These masked features are processed to produce partial predictions, which are aggregated across steps to form the final output.
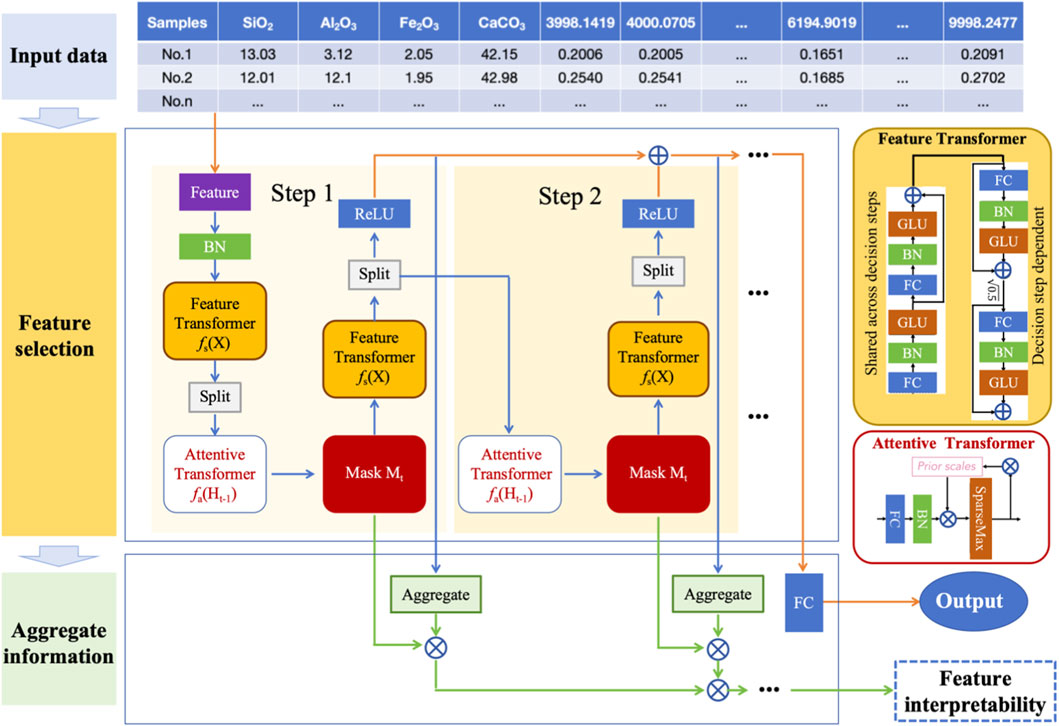
Figure 1. Overall architecture of the TabNet-based regression method for multi-oxide prediction.
Importantly, the accumulated attention masks enable direct interpretation of feature importance, linking spectral bands to specific oxides. This approach ensures both high accuracy and strong interpretability for multivariate spectral prediction tasks. The body of TabNet comprises a shared feature transformer, a decision step block with a unique attention mask, and a sparsemax function to generate interpretable feature selection masks. Its end-to-end differentiable architecture integrates both feature learning and prediction, eliminating the need for manual feature engineering. The following sections will provide a detailed introduction to each component of the proposed method and its corresponding function.
2.2 Method details
Given the high-dimensional NIR spectral data
The feature selection module primarily comprises two components: the Feature Transformer and the Attentive Transformer. The model processes the input features through a sequence of decision steps
This mechanism forces the model to select only a few relevant spectral bands at each decision step. Then, the masked input is processed by a shared feature transformer to produce an intermediate decision vector
where,
The detailed structure of the Feature Transformer module is illustrated in the yellow block on the right side of Figure 1. It consists of two components: a shared block across all decision steps and a decision step–dependent block. The shared block includes a sequence of batch normalization layers, linear projections, and gated linear units (GLUs), which collectively enable the model to capture complex nonlinear dependencies and shared feature representations throughout the decision step. The decision-dependent block, unique to each decision step, is designed to inject step-specific information into the learning process. It follows a similar architecture but operates independently across steps, allowing the network to dynamically refine representations based on the evolving attention masks and selected features at each step.
Then, the Attentive Transformer module receives the hidden representation
where
The masked feature vector is computed via element-wise multiplication with the shared embedding (Equation 5):
Interpretability is embedded directly into TabNet’s architecture through the accumulation of attention masks over time. It generates a sequence of masks
This summation represents how frequently each feature (i.e., wavelength) was selected across all steps. This provides a global feature attribution profile, enabling identification of key wavelengths relevant to prediction, both globally and per oxide.
Next, the multi-step aggregation information key is iteratively refined feature usage over decision steps. The masked input is then processed by a step-specific Feature Transformer to generate a latent representation. This representation is used to produce a partial prediction
TabNet models prediction as a multi-step decision process, analogous to boosting or residual learning. Instead of producing the output in a single forward pass, the model incrementally refines its prediction across steps. Final prediction is obtained by weighted aggregation
where
The core training objective of the TabNet model is to minimize the discrepancy between predicted and true oxide contents. Given the multivariate regression setting, the primary loss function employed is the Mean Squared Error (MSE). To further promote sparsity in feature selection, TabNet incorporates a regularization term based on the Kullback-Leibler (KL) divergence between the learned attention masks and a uniform prior distribution. The loss function combines the MSE for regression and a sparsity-inducing regularization term
This multi-object loss facilitates shared representation learning while treating each oxide prediction as a separate regression sub-task. This sequential approach allows subsequent steps to focus on correcting the residuals from earlier ones, enabling the model to progressively enhance its estimates. This is particularly advantageous in spectral data, where meaningful signals may be distributed nonlinearly and across non-contiguous wavelengths.
3 Results and discussion
To validate the effectiveness of the proposed TabNet method, this paper conducted extensive experiments on two datasets collected from different production regions: Qufu and Linyi. The workflow encompassed datasets, experiments setup, results analysis and discussion.
3.1 Dataset
The dataset used in this study was sourced from Liu et al. (2024), which covers cement production sites in Qufu and Linyi, China. The dataset contains NIR spectra and oxide compositions measured using standard analytical methods. To ensure consistent spectral acquisition, measurements were conducted at 24 °C–26 °C, 45%–55% humidity, averaging 64 scans at 4 cm-1 resolution to improve signal-to-noise ratio. The spectral data covered a wavenumber range of 3998.14–9998.25 cm-1, providing approximately 3,000 wavebands per sample (∼1.93 cm-1 spacing), effectively capturing key molecular vibrations associated with Si-O, Al-O, and Fe-O bonds present in cement clinker. The details of both datasets are shown in Table 1. The dataset was randomly divided into training (80%) and testing (20%) subsets to facilitate model evaluation. Our work applies it in a new context by utilizing the TabNet framework for multi-oxide prediction, which is not addressed in Liu et al. (2024). The primary contribution of our study lies in the innovative application of TabNet to this dataset, leading to improved predictive performance and insights into cross-regional variability. The dataset setup also enables a comparative analysis of regional variability in oxide prediction, highlighting differences in raw material composition or manufacturing conditions between Qufu and Linyi. The training data was used to train the model, while the testing data was reserved as a hold-out set for final model evaluation to ensure that no data leakage occurred between the two. The test set represents unseen data that was not involved in model fitting, making it a true hold-out test set for assessing the model’s generalization ability.
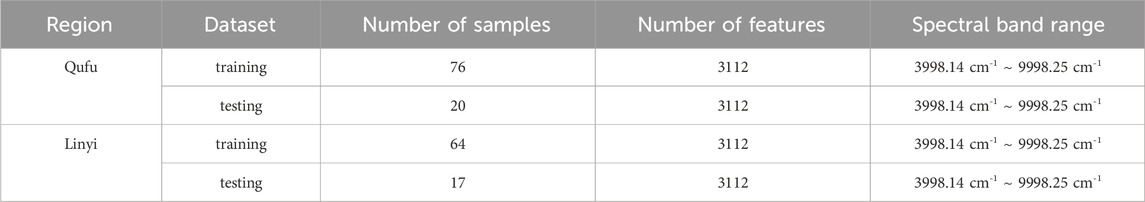
Table 1. Basic information of the datasets samples.
To reduce noise in the NIR spectral data, this paper applied consistent preprocessing steps across all samples. Specifically, z-score normalization was used to standardize the features, facilitating gradient-based optimization in the TabNet framework. Unlike conventional approaches, the paper deliberately avoided principal component analysis (PCA) or other dimensionality reduction techniques to emphasize TabNet’s intrinsic capability for efficient feature selection and handling of high-dimensional inputs.
3.2 Experiment setup and evaluation
The proposed TabNet method was configured with the following hyperparameters. The model was constructed with 5 decision steps and an attention dimensionality of 16, providing adequate capacity for learning relationships in high-dimensional spectral data. For the training protocol, it used a batch size of 256, the Adam optimizer with an initial learning rate of 0.02, and a scheduler for adaptive learning rate adjustment. To ensure stable convergence, the paper implemented a ReduceLROnPlateau scheduler that dynamically adjusted the learning rate by a factor of 0.5 when the validation loss plateaued for 15 consecutive epochs. All experiments were conducted under a fixed random seed (42) to ensure reproducibility. Meanwhile, sparsity regularization was introduced with a coefficient γ = 1.3, enhancing interpretability by promoting sparse attention masks and activation functions. The implementation was built upon PyTorch with the PyTabNet library, with training performed on NVIDIA RTX 3090 GPUs. To evaluate generalization performance and mitigate sampling bias, a multi-fold cross-validation strategy was employed. To rigorously evaluate generalization performance and mitigate potential sampling bias, the paper employed a comprehensive k-fold cross-validation strategy (k = 5) on the training data, while maintaining a strict hold-out test set (20% of total samples) for final performance assessment. This dual-validation approach ensures reliable estimation of the model’s predictive capability on unseen data while providing robust hyperparameter tuning.
To evaluate the performance of method on cement oxide content prediction, the paper adopt three widely recognized regression metrics: Root Mean Square Error (RMSE) (Equation 9), Mean Absolute Error (MAE) (Equation 10), and the Coefficient of Determination (R2) (Equation 11). RMSE measures the average magnitude of prediction errors and penalizes larger deviations more heavily due to the squaring operation:
where
Compared to RMSE, MAE provides a robust, scale-aware measure of the average absolute error:
It is more robust to outliers and offers a straightforward interpretation in the same units as the objects variable (e.g., oxide weight percent).
R2 quantifies the proportion of variance in the actual values that is captured by the model predictions. Its value range is between −1 and 1. A value of one implies perfect prediction, while 0 indicates the model performs no better than predicting the mean:
3.3 Results analysis
3.3.1 Oxides prediction analysis
The predictive performance for each oxide component is summarized in Table 2. On the Qufu dataset, the TabNet model demonstrated excellent predictive capability, achieving an average RMSE of 0.097, MAE of 0.075, and an average R2 of 0.922 across all oxides. Specifically, CaCO3 (RMSE = 0.142, MAE = 0.111 and R2 = 0.965) and SiO2 (RMSE = 0.149, MAE = 0.111, R2 = 0.971) exhibited consistently high prediction fidelity. Al2O3 achieved the lowest RMSE of 0.085 and a strong R2 of 0.951, suggesting that its spectral characteristics were effectively captured. Although Fe2O3 had the lowest RMSE of 0.015, it recorded the lowest R2 of 0.802 due to its narrow concentration range. Multi-fold cross-validation further confirmed the robustness of the predictions, with an average MSE cross-validation of 0.080. Among all oxides, Fe2O3 showed particularly low RMSE values (0.015) due to its limited variability, whereas SiO2 and CaCO3 exhibited slightly higher RMSE values, reflecting broader compositional ranges. These findings confirm that TabNet effectively captures the complex spectral-chemical relationships in Qufu raw materials, delivering highly accurate and reliable predictions.
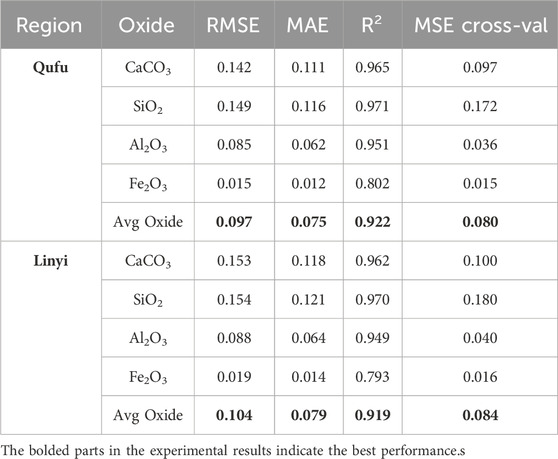
Table 2. Testing performance for Qufu and Linyi datasets.
To further evaluate generalization ability, experiments were also conducted on the Linyi dataset. TabNet maintained similarly strong performance, with an average RMSE of 0.104, MAE of 0.079, and R2 of 0.919. Both CaCO3 (RMSE = 0.153, MAE = 0.118, R2 = 0.962) and SiO2 (RMSE = 0.154, MAE = 0.121, R2 = 0.970) showed comparable accuracy to Qufu, demonstrating the stability of TabNet across different regions. Al2O3, and Fe2O3 exhibited slightly higher RMSE values (0.088 and 0.019, respectively) compared to Qufu. This discrepancy is partly due to outliers, which increase prediction variance and lower R2. In particular, Fe2O3 had a lower R2 of 0.793 despite small absolute errors, likely due to regional composition differences or spectral noise. The overall predictive performance in Linyi remained strong and closely aligned with the results from Qufu.
To provide an intuitive assessment of regression performance, the paper further visualized the relationship between predicted and actual oxide contents using scatter plots. A detailed visualization of the model’s predictive accuracy is presented in Figure 2, which displays the scatter plots of predicted versus reference concentrations for the four major oxides using the Qufu dataset. Each data point in the figure represents an individual prediction obtained through our cross-validation procedure, providing a comprehensive assessment of model performance across the entire dataset. Different colors denote different oxides. TabNet demonstrates strong predictive performance, with most points closely aligning along the ideal line and a clear linear correlation between predicted and actual values. For CaCO3, predictions align closely with the ground truth, with most errors confined within ±0.15%. This high accuracy is attributed to TabNet’s ability to capture carbonate absorption features in the 4,300–4,500 cm-1. Predictions for SiO2 also demonstrate strong linearity, with an R2 of approximately 0.97. A slight overestimation is observed at lower concentrations, while higher concentrations (∼15%) are nearly perfectly predicted. For Al2O3, TabNet achieves the lowest prediction error (RMSE = 0.085), with scatter points almost perfectly overlapping the ideal line and showing no systematic deviation. This result highlights the model’s capability to leverage strong Al-O absorption responses in the 4,800–5,500 cm-1 region, delivering highly accurate and stable predictions. In the case of Fe2O3, while the absolute prediction error remains minimal (RMSE = 0.015), the R2 value (0.802) is lower than for the other oxides. This discrepancy is primarily due to Fe2O3’s narrow concentration range, which limits variance explanation despite accurate predictions. Although slight discrepancies were observed—such as higher RMSE for Al2O3 and Fe2O3 in Linyi—these variations were attributed to outliers and differences in regional compositions, which could be addressed by model fine-tuning.
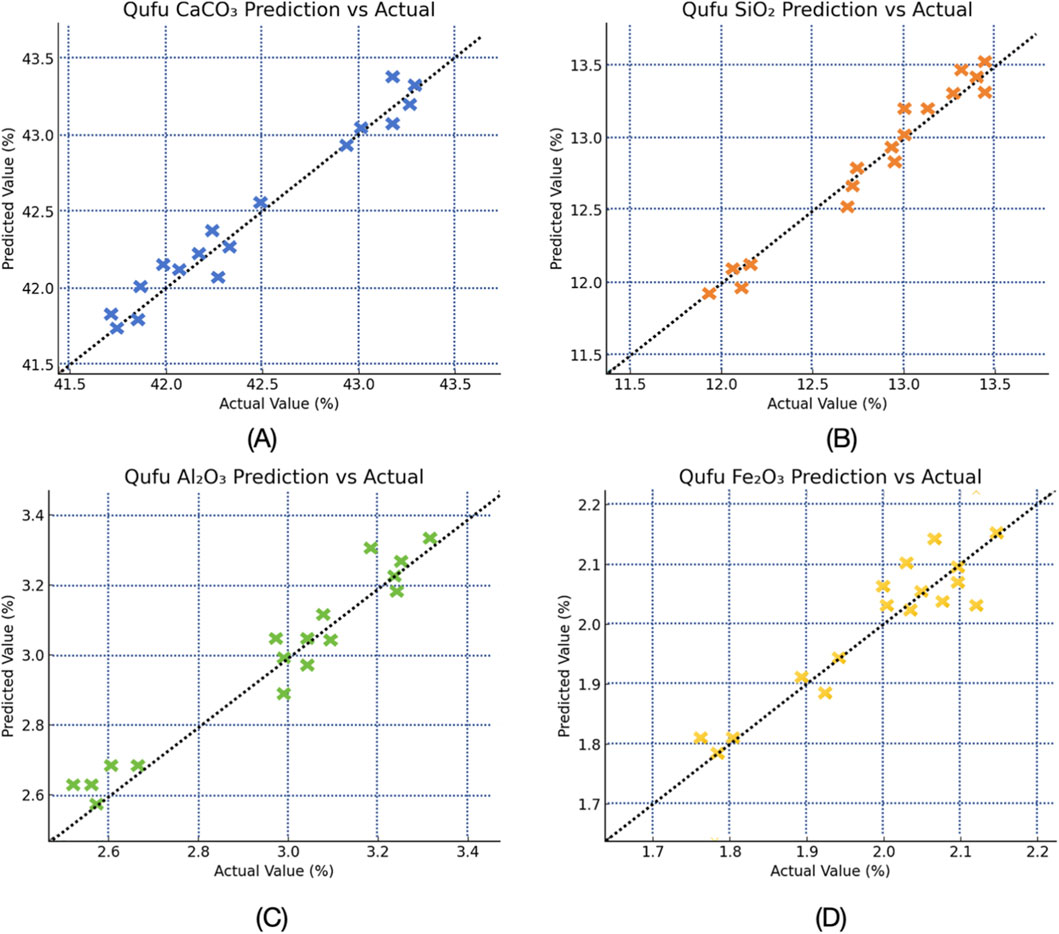
Figure 2. Scatter plots of TabNet predicted versus actual oxide concentrations on the test set from Qufu dataset. (A) CaCO3. (B) SiO2. (C) Al2O3. (D) Fe2O3.
3.3.2 Cross-regional generalization analysis
To rigorously evaluate the cross-regional generalizability of the proposed TabNet model, a stringent inter-regional generalization experiment was conducted. This test goes beyond simple hold-out validation and assesses the model’s ability to perform well on data from a completely different production region. We trained the TabNet model on the entire dataset from one region (including both training and testing splits) and then evaluated it directly on the entire, unseen dataset from the other region. This process was performed in both directions: “Train on Qufu, Test on Linyi” and “Train on Linyi, Test on Qufu”. The results of this challenging experiment are summarized in Table 3. As expected, the performance metrics under this cross-regional setting are lower than those obtained from intra-regional testing.
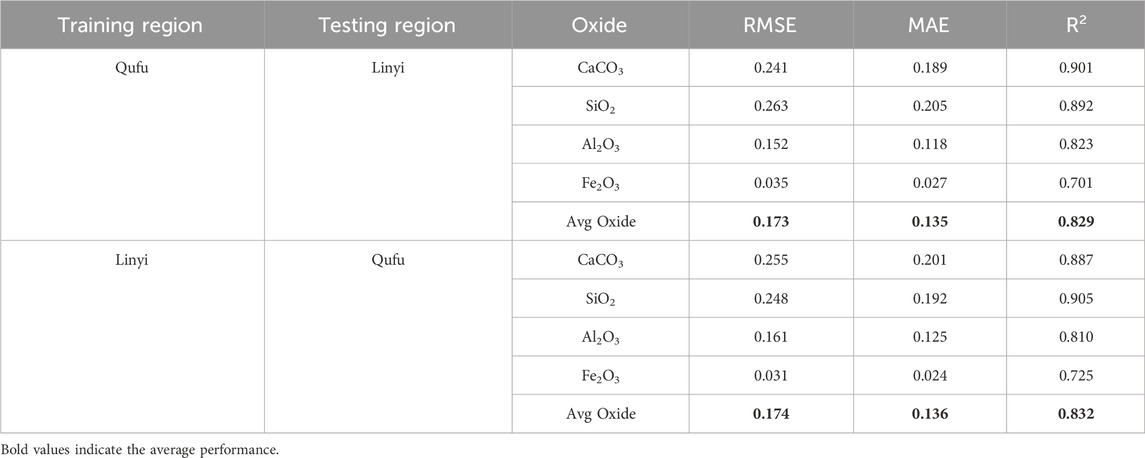
Table 3. Performance comparison of regression models.
When trained on Qufu data and tested on Linyi data, TabNet achieved an average R2 of 0.829 and RMSE of 0.173 across all oxides. The reverse scenario (Train on Linyi, Test on Qufu) yielded highly consistent results (Average R2 = 0.832, RMSE = 0.174), confirming the stability of our method. Notably, the predictions for CaCO3 and SiO2 remained strong in both directions, with R2 values consistently above 0.88. This can be attributed to the well-defined and strong absorption features of carbonate and silicate groups in the NIR spectrum, which the model can reliably identify even amidst regional variations.
The performance for Al2O3, and Fe2O3 saw a more noticeable drop (R2 between 0.70 and 0.82). This is a foreseeable outcome, as the spectral signatures of these oxides, particularly Fe2O3, can be more subtle and more susceptible to being influenced by region-specific impurities, particle size distribution, and the complex matrix effects within the raw meal. The model’s ability to maintain reasonable accuracy on entirely unseen data from a different production site underscores its potential for deployment in real-world industrial settings where raw material sources and conditions can vary.
3.3.3 Performance comparison of existing models
To comprehensively assess performance, six regression approaches were compared, including Partial Least Squares Regression (PLSR), Random Forest (Statistics and Breiman, 2001), Linear Regression (Maulud and Abdulazeez, 2020), Wavelength selection CARS (Zhang Y et al., 2024), SPORT (Zhang et al., 2023) and the proposed TabNet method. To ensure a comprehensive evaluation, we expanded our benchmark suite by incorporating two additional nonlinear models: Support Vector Machine (SVM) (Meza Ramire et al., 2020) and a Feedforward Artificial Neural Network (ANN) (Zhang Y et al., 2024). The ANN comprised two hidden layers with 64 and 32 neurons, respectively, and used ReLU activation, trained with the Adam optimizer. The SVM model was configured with a carefully tuned regularization parameter and kernel coefficient. The results are summarized in Table 4.
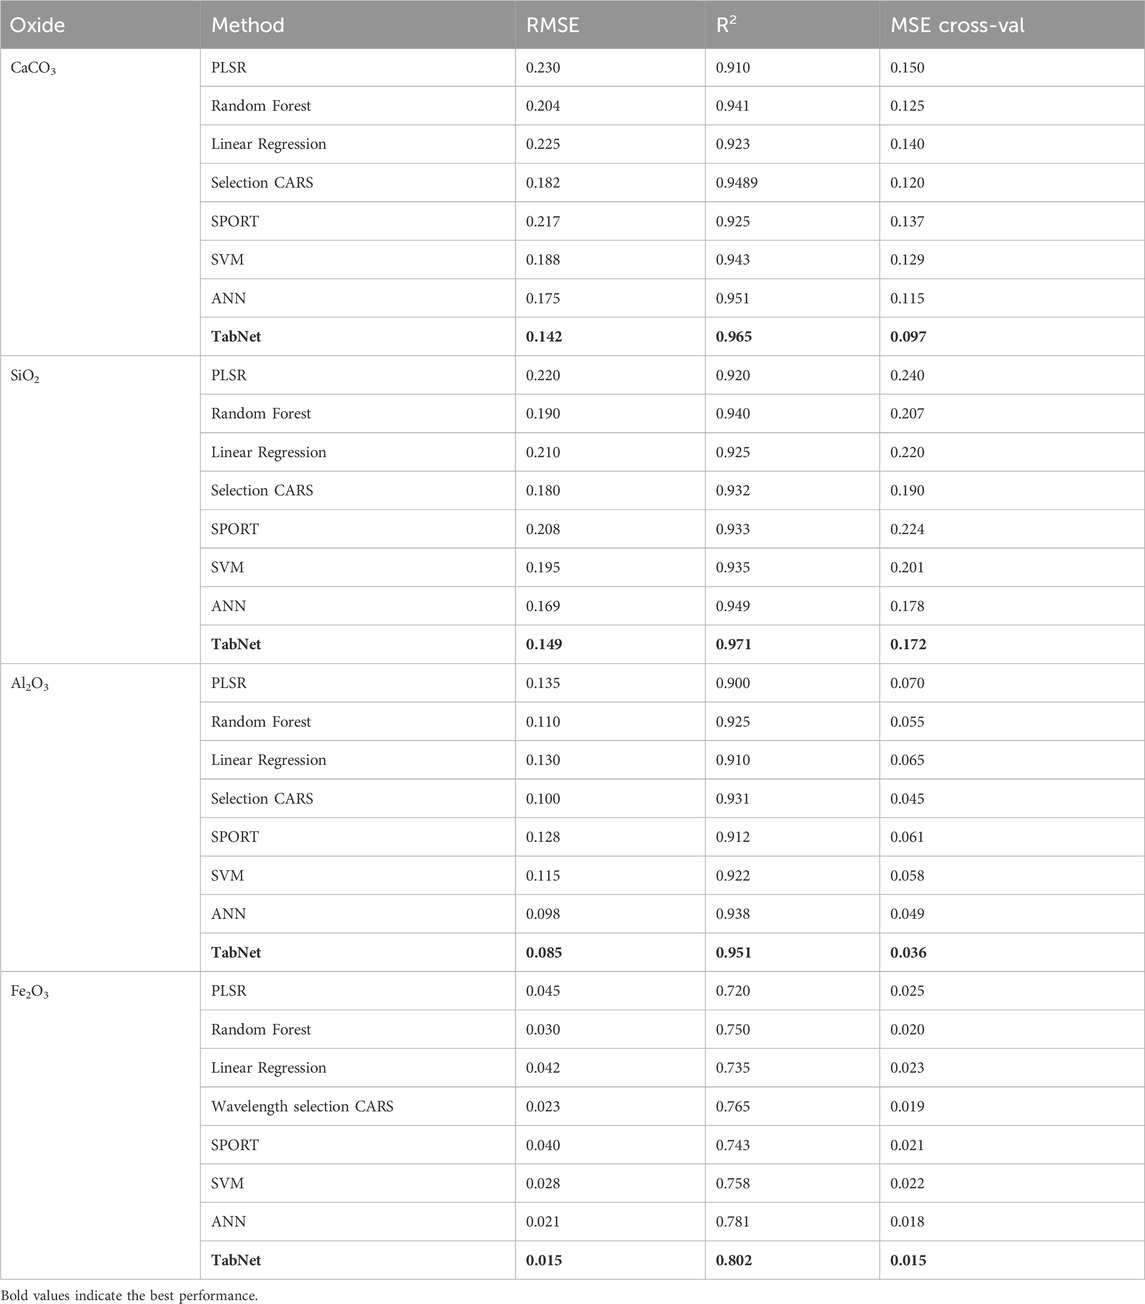
Table 4. Performance comparison of regression models.
Traditional linear models such as PLSR and Linear Regression demonstrated the highest prediction errors across all oxides. To ensure a fair comparison, we specify the type of data used for each regression model. They were applied to the full-spectrum data containing all 3,112 spectral features. On the other hand, Selection CARS and SPORT models utilized pre-selected wavelength subsets, where a smaller set of informative wavelengths was chosen using feature selection techniques prior to training. The TabNet model was also trained on full-spectrum data. For instance, CaCO3 exhibited RMSE values of 0.230 and 0.225 for PLSR and LR, respectively. While PLSR reduces collinearity by projecting features into latent variables, its linear nature limits its ability to capture subtle nonlinear patterns, resulting in suboptimal R2 scores. Random Forest improved predictive accuracy compared to PLSR and LR, as it can handle nonlinear interactions among spectral features. For example, the RMSE for Al2O3, decreased to 0.110 compared to 0.135 for PLSR. Nevertheless, Random Forest struggled to achieve high variance explanation for Fe2O3 (R2 = 0.750).
The newly introduced SVM and ANN models demonstrated competitive performance, solidly outperforming the linear models and aligning more closely with Random Forest. Notably, the ANN emerged as a particularly strong baseline, achieving the second-best performance for several oxides (e.g., CaCO3 and Al2O3). The prediction of CaCO3 achieved notably performance with an RMSE of 0.175, R2 of 0.951, and cross-validated MSE of 0.115, underscoring the capability of nonlinear function in capturing the complex spectral-carbonate relationships. This comprehensive comparison reinforces that TabNet’s success is not merely due to its non-linear nature, but to its sophisticated feature selection and sequential attention mechanism, which allows it to more effectively model the complex spectral-oxide relationships in an end-to-end manner.
Feature selection approaches such as CARS and SPORT reduced feature redundancy by identifying informative wavelengths. This strategy substantially improved prediction performance compared to simple linear methods. For instance, SPORT achieved an RMSE of 0.128 for Al2O3, versus 0.130 for Linear Regression. However, both methods rely on manual wavelength engineering, making them sensitive to noise and less effective in capturing nonlinear relationships. In contrast, the proposed TabNet model consistently delivered the best predictive performance across all oxides. TabNet achieved the lowest cross-validation errors among all evaluated oxides, with an average MSE of approximately 0.08, significantly outperforming feature selection methods CARS and SPORT, which yielded MSE values ranging from 0.12 to 0.22. Unlike traditional methods, TabNet eliminates the need for manual feature selection or complex preprocessing by integrating end-to-end learning, sparse attention, and nonlinear decision steps.
In addition, we present an intuitive comparison of model performance. As shown in Figure 3, the radar chart illustrates the average RMSE of each regression model across all oxides, where a smaller enclosed area represents lower prediction error and better overall performance. Notably, TabNet forms the smallest and most compact polygon, reflecting both the lowest average RMSE and the most balanced prediction across oxide types. These visual results align closely with the tabular analysis, further confirming TabNet’s ability to automatically select informative spectral bands and capture nonlinear dependencies via its sparse attention mechanism. It is a robust and scalable solution for multi-oxide prediction in cement quality monitoring.
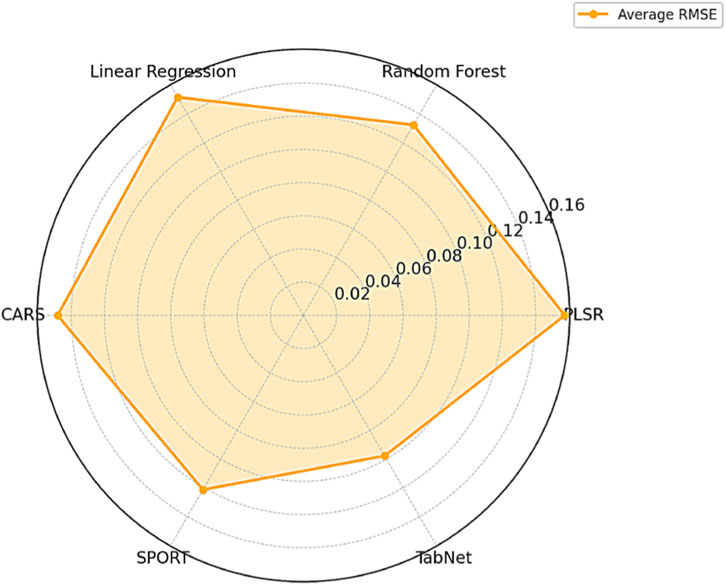
Figure 3. Average RMSE radar chart for models.
3.3.4 Discussion
To complement the quantitative results, a qualitative analysis was conducted to explore the interpretability of TabNet in predicting oxide compositions. TabNet’s sparse attention mechanism dynamically adjusts feature selection across decision steps, allowing the model to focus on the most relevant spectral regions for each oxide. The feature importance identified by TabNet provides a direct, data-driven window into the underlying chemistry of the cement raw meal. As shown in Table 5, the top-10 most relevant wavebands selected for CaCO3, SiO2, Al2O3, and Fe2O3 are primarily distributed within the 4,200–9500 cm-1 range. This aligns well with known short-wave infrared (SWIR) absorption bands commonly observed in cementitious materials, confirming the chemical plausibility of the selected features. The high relevance of specific wavelengths, as listed in Table 5, is not coincidental but aligns with fundamental molecular vibrations. A paramount example is the dominant role of the ∼4,300 cm-1 band for predicting CaCO3 content. This band is mechanistically assigned to the strong combination band of the carbonate ion (CO3 2-), which serves as the primary spectral fingerprint for calcite. The model’s autonomous and emphatic selection of this band provides a compelling validation of its chemical relevance and confirms that it is learning meaningful patterns.
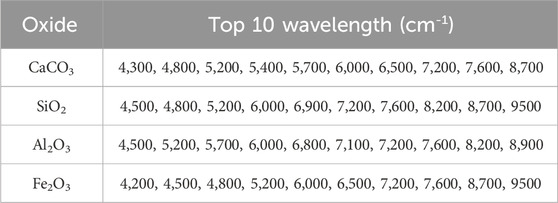
Table 5. The top-10 most relevant wavebands selected for oxides.
Specifically, CaCO3 shows unique peaks at 4,300 and 5,400 cm-1linked to carbonate stretching vibrations; SiO2 has distinctive high-wavelength peaks at 6,900, 8,200, and 9500 cm-1 associated with silicate network vibrations; Al2O3 features absorption at 7,100 and 8,900 cm-1 due to hydroxyl-alumina bonds; while Fe2O3 displays low-to mid-range peaks at 4,200 and 6,500 cm-1 corresponding to crystal field transitions of iron oxides. Importantly, TabNet successfully implemented an automatic feature selection mechanism, capturing chemically relevant spectral regions without manual engineering. Feature analysis further revealed that both regions shared nearly identical top spectral bands, with only the 10th most important band differing (6,900.63 cm-1 in Qufu vs. 6,750.63 cm-1 in Linyi). This subtle spectral shift may partially explain the small performance gap observed for Fe2O3. These results suggested that region-aware model fine-tuning could further improve cross-regional generalization and robustness.
The feature importance heatmap is shown in Figure 4, illustrating substantial overlap among the top-10 wavebands across the four oxides. Notably, wavebands at 5,200, 6,000, 7,200, 7,600, and 8,700 cm-1 correspond to fundamental molecular overtones and combination vibrations common to carbonate, hydroxyl, and silicate groups. Despite these shared features, the model effectively differentiates between oxides by leveraging distinctive wavebands: CaCO3 at 4,300 cm-1, Al2O3 at 7,100 cm-1, and Fe2O3 at 4,200 cm-1. The heatmap also highlights stronger importance of high-wavelength regions (9500 cm-1) for Fe2O3 and SiO2, and unique absorption features for Al2O3 in the 7,100–8,900 cm-1 range, whereas CaCO3 relies primarily on low-to-mid wavelength regions (4,300–5,400 cm-1) for accurate prediction. Peaks near 7,200 and 5,200 cm-1 are predominantly attributed to water and alumina-related vibrations, the strong absorption at 4,300 cm-1 originates from carbonate symmetric stretching, and weaker absorption near 4,500 cm-1 likely results from overlapping contributions of Al2O3, Fe2O3 and SiO2. This connection transcends mere spectral assignment and has direct implications for predicting material properties. In cement manufacturing, the precise content of CaCO3 is critical as it governs the burnability of the raw meal and the thermodynamics of clinker phase formation. Therefore, the model’s accurate identification of the ∼4,300 cm-1 band is not just a statistical outcome. It is the foundational step in a chain of reasoning that links a spectral feature to a core material performance property.
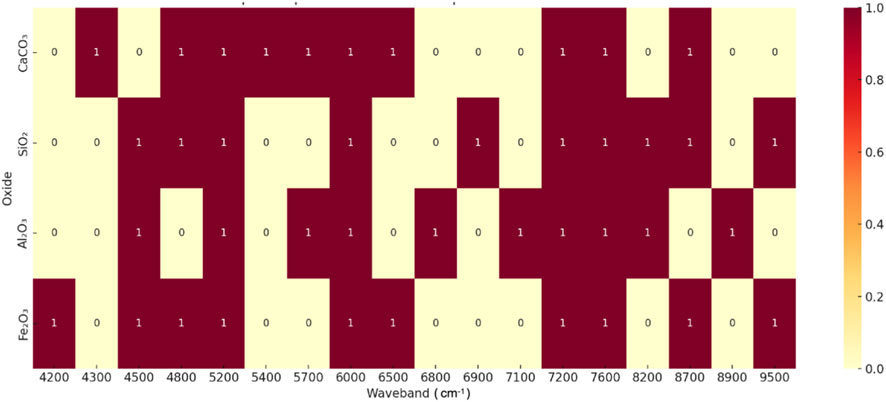
Figure 4. Heatmap of Top 10 Wavebands importance score for four Oxides.
The study note that the relatively small sample size, particularly for the Linyi dataset, may limit the statistical robustness and generalization of our model. While the current results demonstrate strong predictive performance, larger datasets would allow for more comprehensive evaluation, especially in capturing less common spectral variations and regional differences. In future work, we plan to collect larger-scale datasets from multiple production regions, which will not only improve cross-regional generalization but also further validate the applicability and scalability of the proposed TabNet framework for industrial cement quality monitoring.
4 Conclusion
The paper proposed a TabNet-based multi-output regression framework for accurate and interpretable prediction of key oxide contents in cement raw meals using NIR spectroscopy. Unlike traditional chemometric models, TabNet leverages sparse attention and sequential feature selection to automatically identify chemically meaningful spectral bands, enabling robust modeling of the complex nonlinear relationships inherent in high-dimensional spectral data. Extensive experiments on two real-world datasets from Qufu and Linyi demonstrated that the proposed method consistently outperforms baseline models such as PLSR and Random Forest in terms of both RMSE and R2. In addition to its superior predictive accuracy, the model offers interpretability through visualizable attention masks, which align with known oxide-specific SWIR absorption bands. Overall, this work presents a scalable, end-to-end solution for real-time cement quality monitoring. The proposed framework extends naturally to other spectral-based tasks, including inorganic material analysis, geochemical sensing, and process monitoring.
Data availability statement
The raw data supporting the conclusions of this article will be made available by the authors, without undue reservation.
Author contributions
GL: Writing – original draft, Writing – review and editing.
Funding
The author(s) declare that no financial support was received for the research and/or publication of this article.
Conflict of interest
The author declares that the research was conducted in the absence of any commercial or financial relationships that could be construed as a potential conflict of interest.
Generative AI statement
The author(s) declare that no Generative AI was used in the creation of this manuscript.
Any alternative text (alt text) provided alongside figures in this article has been generated by Frontiers with the support of artificial intelligence and reasonable efforts have been made to ensure accuracy, including review by the authors wherever possible. If you identify any issues, please contact us.
Publisher’s note
All claims expressed in this article are solely those of the authors and do not necessarily represent those of their affiliated organizations, or those of the publisher, the editors and the reviewers. Any product that may be evaluated in this article, or claim that may be made by its manufacturer, is not guaranteed or endorsed by the publisher.
References
Acquarelli, J., van Laarhoven, T., Gerretzen, J., Tran, T. N., Buydens, L. M., and Marchiori, E. (2017). Convolutional neural networks for vibrational spectroscopic data analysis. Anal. Chim. Acta 954, 22–31. doi:10.1016/j.aca.2016.12.010
Alessandra, B., and Tormod, N. (2019). The sequential and orthogonalized pls regression for multi-block regression: theory, examples, and extensions. Data Handl. Sci. Technol. 31, 157–177. doi:10.1016/B978-0-444-63984-4.00006-5
Arik, S. Ö., and Pfister, T. (2021). TabNet: attentive interpretable tabular learning. Proc. AAAI Conf. Artif. Intell. 35 (8), 6679–6687. doi:10.1609/aaai.v35i8.16826
Casson, A., Beghi, R., Giovenzana, V., Fiorindo, I., Tugnolo, A., and Guidetti, R. (2020). Environmental advantages of visible and near infrared spectroscopy for the prediction of intact olive ripeness. Biosyst. Eng. 189, 1–10. doi:10.1016/j.biosystemseng.2019.11.003
Castillo, J. A., Wilhelmsson, B., Broström, M., and Eriksson, M. (2025). Phase evolution of cement raw meal in a high-CO2 atmosphere. Cem. Concr. Res. 193, 107874. doi:10.1016/j.cemconres.2025.107874
Haruna, S. A., Li, H., Wei, W., Geng, W., Luo, X., Zareef, M., et al. (2023). Simultaneous quantification of total flavonoids and phenolic content in raw peanut seeds via NIR spectroscopy coupled with integrated algorithms. Biomol. Spectrosc. 285, 121854. doi:10.1016/j.saa.2022.121854
Hu, Z. Y., Wan, Y., Duan, Y. J., Shi, Y. H., Gu, C. P., Ma, R., et al. (2025). A review of the impact of graphene oxide on cement composites. Nanomaterials 15 (3), 216. doi:10.3390/nano15030216
Huang, J. S., Liew, J. X., and Liew, K. M. (2021). Data-driven machine learning approach for exploring and assessing mechanical properties of carbon nanotube-reinforced cement composites. Compos. Struct. 267, 113917. doi:10.1016/j.compstruct.2021.113917
Lee, H., and Kim, S. (2016). Black-box classifier interpretation using decision tree and fuzzy logic-based classifier implementation. Int. J. Fuzzy Log. Intelligent Syst. 16 (1), 27–35. doi:10.5391/IJFIS.2016.16.1.27
Liu, X., An, H., Cai, W., and Shao, X. (2024). Deep learning in spectral analysis: Modeling and imaging. TrAC Trends in Analytical Chemistry 172, 117612. doi:10.1016/j.trac.2024.117612
Ma, X., Cai, Y., Wang, X., Zhang, R., Chen, Y., and Huang, B. (2025). Quantitative measurement of cement raw meal composition via spectra fusion of laser-induced breakdown spectroscopy and near-infrared spectroscopy. Measurement, 253, 117865. doi:10.1016/j.measurement.2025.117865
Maulud, D., and Abdulazeez, A. M. (2020). A review on linear regression comprehensive in machine learning. J. Appl. Sci. Technol. Trends 1 (2), 140–147. doi:10.38094/jastt1457
Meza Ramirez, C. A., Greenop, M., Ashton, L., and Rehman, I. (2020). Applications of machine learning in spectroscopy. Applied Spectroscopy Reviews 56 (8-10), 733–763. doi:10.1080/05704928.2020.1859525
Mishra, P., Herrmann, I., and Angileri, M. (2021). Improved prediction of potassium and nitrogen in dried bell pepper leaves with visible and near-infrared spectroscopy utilising wavelength selection techniques. Talanta 225, 121971. doi:10.1016/j.talanta.2020.121971
Polavaram, K. C., and Garg, N. (2021). Enabling phase quantification of anhydrous cements via Raman imaging. Cem. Concr. Res. 150, 106592. doi:10.1016/j.cemconres.2021.106592
Qu, H. W., Wu, W., Chen, C., Yan, Z. W., Guo, W. J., Meng, C. Z., et al. (2021). Application of serum mid-infrared spectroscopy combined with an ensemble learning method in rapid diagnosis of gliomas. Anal. Methods Adv. Methods Appl. 13 (39), 4642–4651. doi:10.1039/d1ay00802a
Sambataro, L., Bre, F., Ukrainczyk, N., and Koenders, E. A. (2024). Environmental benchmarks for the European cement industry. Sustain. Prod. Consum., 45: 429–449. doi:10.1016/j.spc.2024.01.020
Statistics, L. B., and Breiman, L. (2001). Random forests. Mach. Learn. 45, 5–32. doi:10.1023/a.1010933404324
Wu, Z., Pan, H., Huang, P., Tang, J., and She, W. (2024). Biomimetic mechanical robust cement-resin composites with machine learning-assisted gradient hierarchical structures. Adv. Mater. 36 (35), 2405183. doi:10.1002/adma.202405183
Yang, G., Zhao, J., and Wang, Y. (2022). Durability properties of sustainable alkaliactivated cementitious materials as marine engineering material: a review. Mater. Today Sustain. 17, 100099. doi:10.1016/j.mtsust.2021.100099
Zhang, Y. Z., Wang, Y., Zhao, Z., Zhang, L., and Xiao, H. (2023). Improved prediction of oxide content in cement raw meal by near-infrared spectroscopy using sequential preprocessing through orthogonalization (SPORT). Anal. Lett. 57, 1678–1688. doi:10.1080/00032719.2023.2266070
Keywords: cement raw meal, near-infrared (NIR) spectroscopy, deep learning, oxides prediction, regression algorithm
Citation: Li G (2025) TabNet-driven interpretable prediction of multi-oxide composition in cement using NIR spectroscopy. Front. Chem. 13:1691413. doi: 10.3389/fchem.2025.1691413
Received: 23 August 2025; Accepted: 13 October 2025;
Published: 30 October 2025.
Edited by:
Bobby Pejcic, Mineral Resources - CSIRO, AustraliaCopyright © 2025 Li. This is an open-access article distributed under the terms of the Creative Commons Attribution License (CC BY). The use, distribution or reproduction in other forums is permitted, provided the original author(s) and the copyright owner(s) are credited and that the original publication in this journal is cited, in accordance with accepted academic practice. No use, distribution or reproduction is permitted which does not comply with these terms.
*Correspondence: GeZhiChen Li, bGlnZXpoaWNoZW5AMTYzLmNvbQ==