 S. Giuffrida1*
 F. Brighenti1,2
 F. Cannavò3
 F. Carnemolla1,2
 G. De Guidi1,2
 G. Barreca1,2
 S. Gambino1
 G. Barberi3
 L. Scarfì3
 C. Monaco1,2,3
- 1Department of Biological, Geological and Environmental Sciences, University of Catania, Catania, Italy
- 2CRUST—Interuniversity Center for 3D Seismotectonics With Territorial Applications, U.R. Catania, Catania, Italy
- 3INGV-OE, National Institute of Geophysics and Volcanology-Etnean Observatory, Catania, Italy
Active normal faulting and uplifting, consistent with a WNW-ESE-oriented regional extension, dominate the Quaternary tectonics of the southern Calabrian Arc. The main tectonic structures of this extensional domain are considered to be the source of numerous historical and recent strong earthquakes, among which the 1783 seismic sequence (M 6.5–7) was one of the most destructive earthquakes ever recorded in Southern Italy. Previous works on the seismotectonic of the Calabrian Arc indicate a disagreement on the attitude (E-dipping vs W-dipping) of the main seismogenic sources slicing across southern Calabria, whereby the seismotectonic framework is still debated. Following a multidisciplinary approach, based on morpho-structural and seismological data, the geometry at depth of the most reliable sources (i.e., Cittanova and Serre faults) was first modelled in a 3D environment to retrieve information about their seismic potential. The GNSS data from the permanent stations of RING/RDN and TopNETlive Italy networks have been processed in order to estimate the velocity field affecting this area. Then, data inversion allowed us to document a predominant WNW-ESE active extensional strain orthogonally to the modelled faults, consistent with the regional dynamics. The reliability of the model was tested using empirical relationships and fault response modelling simulation. Furthermore, slip tendency analysis revealed the propensity to slip of the modelled planes by applying a remote stress state derived from the kinematic-structural survey on fault planes.
1 Introduction
The Calabrian Arc (CA hereinafter), Southern Italy (Figure 1A), is an active structural domain where high-intensity historical and instrumental earthquakes with magnitude higher than 7 and MCS intensities up to 11 (Postpischl, 1985; Boschi et al., 1995; Barbano et al., 2005; Locati et al., 2022; Rovida et al., 2022) were recorded. In particular, some earthquakes in southern Calabria such as the seismic sequence of 1783, with the mainshock on February 5 (M 6.9–7.1; Jacques et al., 2001), the earthquake of 8 September 1905 (Mw 7.5; Presti et al., 2017), and the event of 28 December 1908 (M 7.1; Barbano et al., 2005) (Figure 1A) have been regarded as the strongest seismic events of the Italian Peninsula.
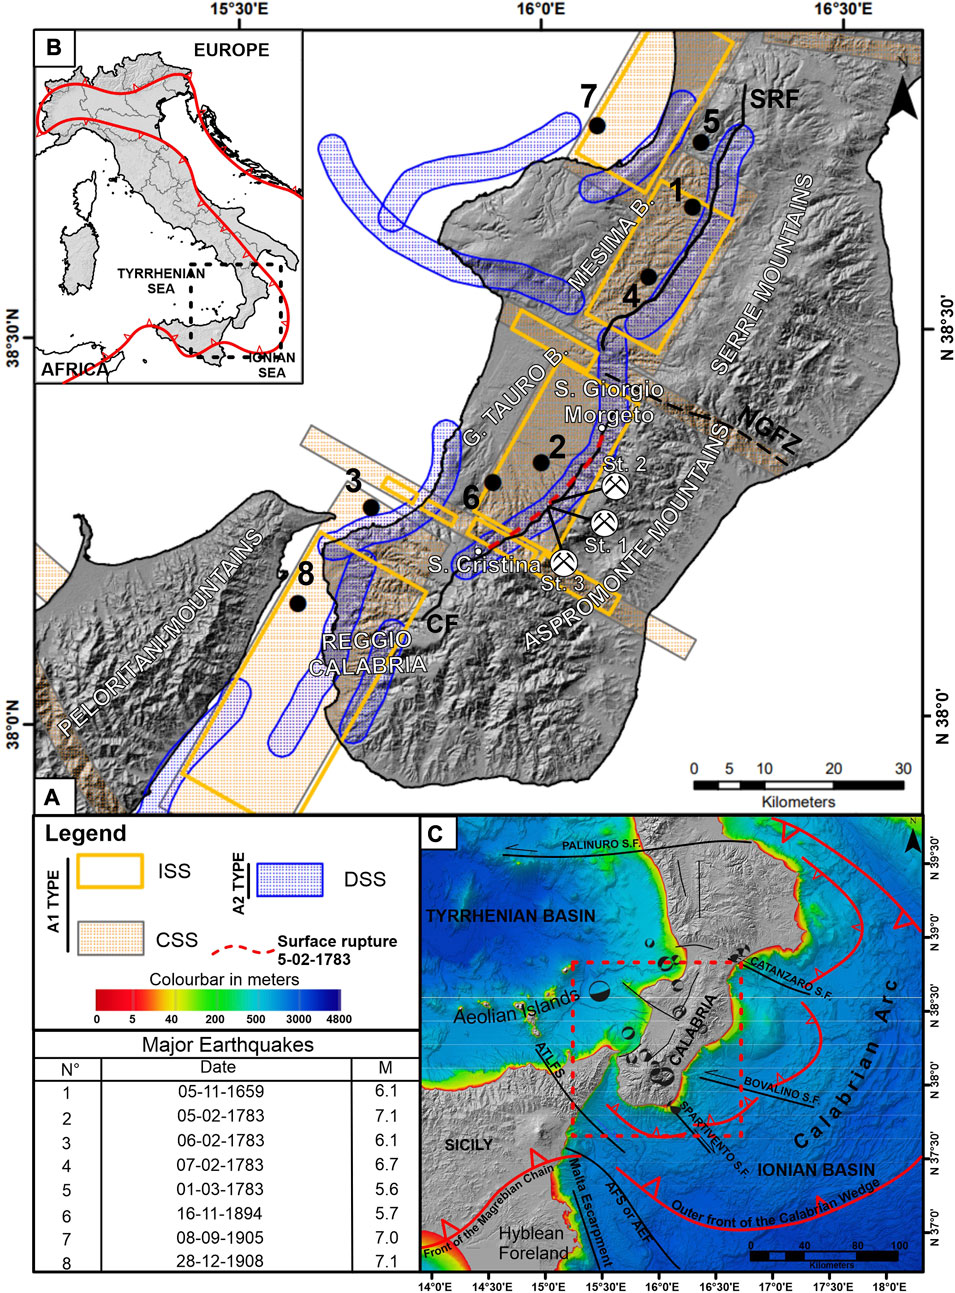
FIGURE 1. (A) Map of seismogenic source types in southern Calabria and major historical earthquakes. ISS, Individual Seismogenic Sources; CSS, Composite Seismogenic Sources; DSS, Debated Seismogenic Sources (from DISS Working Group, 2023); CF, Cittanova Fault; SRF, Serre Fault; NGFZ, Nicotera–Gioiosa Fault Zone from Tripodi et al. (2018). The red dashed line represents the coseismic evidence of the 5 February seismic event reported by de Dolomieu 1784 (from Tortorici et al., 1995; Jacques et al., 2001). (B) Front view of the Appenninic–Maghrebian Orogen (red line) in the context of the Europe–Africa plate convergence (Malinverno and Ryan, 1986; Dewey et al., 1989). (C) Simplified structural map of the Calabrian Arc domain; main structural elements are obtained from Finetti and Del Ben (1986), Monaco and Tortorici (2000), Del Ben et al. (2008), Polonia et al. (2011), Gutscher et al. (2016), Polonia et al. (2016), Gutscher et al. (2017), Scudero et al. (2020), Pirrotta et al. (2021), and Scarfì et al. (2021). ASF, Alfeo–Etna Fault System; AEF, Alfeo–Etna Fault; ATLFS, Aeolian–Tindari–Letojanni Fault System; focal solutions for the first 20 km of depth in the area of southern Calabria are obtained from the International Seismological Centre (ISC) and Italian Seismological Instrumental and Parametric Database (ISIDe); bathymetric data derived from: https://emodnet.ec.europa.eu/.
Although the seismotectonics of the CA has been explored through numerous studies (e.g., Westaway, 1993; Tortorici et al., 1995; Monaco and Tortorici, 2000), the seismogenic sources of major earthquakes occurred in the area are still debated. For instance, different interpretations were proposed regarding the location and the geometries of the causative faults responsible for the 1783 historical seismic sequence.
According to DISS (Database of Individual Seismogenic Sources, DISS 3.3.0, https://diss.ingv.it/), major extensional seismogenic sources of southern Calabria can be grouped into two categories: types A1 and A2 (Figure 1A). Type A1 consists of E-dipping normal faults bounded by the west of the Strait of Messina and the Gioia Tauro and Mesima basins (see also Valensise and D’Aaddezio, 1994; Cucci et al., 1996; Peruzza et al., 1996; Pizzino et al., 2004; Loreto et al., 2013). Type A2 structures consist of W-dipping normal faults limiting the same Quaternary basins to the east (see also Tapponnier et al., 1987; Ghisetti, 1992; Tortorici et al., 1995; Monaco and Tortorici, 2000; Jacques et al., 2001; Galli and Bosi, 2002), at the foot of the Aspromonte and Serre mountains. Unlike the Type 2 faults (i.e., Cittanova and Serre faults), which are well exposed on the surface, Type 1 (i.e., Gioia Tauro and Mesima faults) do not exhibit a clear morphological expression.
In this work, a multidisciplinary approach has been followed to reconstruct, in the MOVE Software Suite environment (granted by Petroleum Experts Limited; www.petex.com), the 3D geometry of the Cittanova fault (CF) and Serre fault (SRF), the longest tectonic structures occurring in southern Calabria (Tapponnier et al., 1987; Ghisetti, 1992; Tortorici et al., 1995; Monaco and Tortorici, 2000; Jacques et al., 2001; Galli and Bosi, 2002). These faults, belonging to the A2 category, are defined by Jacques et al. (2001) and recently, starting from macroseismic data, by Andrenacci et al. (2023) as the seismogenic sources of the 5 and 7 February 1783 seismic events, whereas other authors (e.g., Valensise and D’Aaddezio, 1994; Cucci et al., 1996) consider the Gioia Tauro and Mesima faults, belonging to the A1 category, as the most likely sources for the same seismic events. The open debate between different geometric interpretations (E-dipping vs. W-dipping) reported in DISS and different schools of thought on the sources of the 1783 seismic sequence proves that the development of a 3D model for these faults may be crucial to better characterize the seismotectonics of the area and evaluate its seismic potential. Being characterized by clear surface evidence and seismic cluster at depth, we choose the CF and SRF for our analysis. A structural survey was carried out in order to investigate the attitude of these faults and collect kinematic data. Then, a 3D model for these faults was built from their expression at surface, defined by geomorphological and structural analyses and with the available literature, and using seismological data at depth.
The geometric parameters built through the 3D modelling were then validated using the available empirical relationships (Wells and Coppersmith, 1994; Leonard, 2010). Moreover, we tested the kinematic effects of the modelled planes, simulating a uniform slip distributed on fault planes, according to the coseismic effect recognized at the base of the CF scarplet by de Dolomieu (1784) after the 5 February 1783 event. The expected total vertical displacement and its spatial distribution associated with the fault activity were also obtained to compare the current height of the fault scarps with that of the modelled faults. Finally, the potential reactivation of the modelled planes was evaluated using the slip tendency analysis method (Morris et al., 1996).
Geodetic data, measured at several GNSS stations of various permanent networks (e.g., RIGN/RDN network and TopNETlive Italy network), have been processed to obtain the velocity field of this area. Using the inversion techniques proposed by Shen et al. (1996) and Grid Strain 2D software, a strain field was also obtained for the investigated area.
2 Geodynamic and geological background
The CA represents an arc-shaped terrain originated from the deformation of the European paleo-margin in the context of Africa–Eurasia plate relative convergence (Malinverno and Ryan, 1986; Jolivet and Faccenna, 2000; Rosenbaum and Lister, 2004). It is part of a structural domain characterized by a large accretionary wedge located in the Ionian Sea, the latter formed as a response to the Miocene to Quaternary subduction process of the Ionian crust (Dewey et al., 1989; Faccenna et al., 2001 Figures 1B, C). Within this geodynamic framework, CA is made up of several tectono-stratigraphic units belonging to the Kabilo-Calabride Chain, constituted by Hercynian metamorphic and magmatic rocks, Mesozoic carbonate platform, and middle–late Miocene terrigenous sequences (Ogniben, 1969; Amodio-Morelli et al., 1976). Since the Late Miocene, CA has been dominated by extensional and transcurrent tectonics, superimposed on the previous collisional context, that have given rise to the shaping of Plio-Quaternary sedimentary basins (Ghisetti and Vezzani, 1982; Tortorici et al., 1995; Monaco et al., 1996; Monaco and Tortorici, 2000; Jacques et al., 2001; Tansi et al., 2007; Scudero et al., 2017; Pirrotta et al., 2021).
Several interpretations have been proposed to explain the regional extension affecting the CA: 1) isostatic response to the progressive Ionian Slab subduction processes (Westaway, 1993; Monaco et al., 1996; Wortel and Spakman, 2000); 2) ascent of asthenosferic flow due to slab roll-back processes (Faccenna et al., 2011); 3) counterclockwise rotation of the Adria Plate (D’Agostino and Selvaggi, 2004; D’Agostino et al., 2008); and 4) pull of the Hellenic slab dragging eastward the Ionian–Calabrian domain (Goes et al., 2004). Regardless of the cause, normal faulting has given rise to cumulative escarpments that characterize the present morphology of the major reliefs of the region (i.e., Catena Costiera and Serre and Aspromonte mountains; Tortorici et al., 1995; Monaco and Tortorici, 2000). Although different source models have been proposed over time (see DISS and references therein), normal faults are considered responsible for the most destructive historical earthquakes in CA (M. 6.5–7.4, Boschi, 1997; Jacques et al., 2001; Neri et al., 2020; Figure 1A), such as the 1905 and 1908 events and the seismic sequence of 1783. Recently, the inversion of structural data collected from extensional faults and joints (see Caputo and Caputo, 1989), combined with seismological data, allowed to define the stress field acting at various depths in the Calabrian Arc (e.g., 0–15 km, 15–35 km; De Guidi et al., 2013; Scudero et al., 2017). The latter testify a predominant WNW-ESE-oriented regional extension, in agreement with previous structural studies (e.g., Tortorici et al., 1995; Jacques et al., 2001) and consistent with GPS measurements (Hollenstein et al., 2003; Caporali et al., 2003; Palano et al., 2012; Serpelloni et al., 2005, 2010; D’Agostino and Selvaggi, 2004).
3 The 1783 seismic sequence and previous seismic source models
The 1783 seismic sequence was characterized by the following five mainshocks (Baratta, 1901; Jacques et al., 2001): the sequence started with a catastrophic event on 5 February that destroyed towns and villages located at the western foot of the northern Aspromonte (i.e., S. Cristina D’Aspromonte and S. Giorgio Morgeto; Figure 1A). On 6 February, a second large shock struck mostly the coastal area to the southwest, bringing the cumulative damage to this area to a level almost comparable to that in the Aspromonte piedmont, causing a rockslide along the cliff to the west of Scilla which in turn triggered a tsunami wave inside the Straits of Messina. On 7 February, a third shock ruined the small towns at the western foot of the Serre Mountains, approximately 40 km northeast of the epicentral area of the catastrophic event of 5 February (Figure 1A). On 1 March, a fourth shock struck a smaller area at the western foot of the Serre Mountains, approximately 20 km north of the epicentre of the 7 February event (Figure 1A). Finally, on 28 March, the fifth and last important shock of the sequence caused destruction farther toward the northeast, closer to the Ionian Sea. According to de Dolomieu (1784), after the 5 February mainshock, a 20-km-long scarplet that developed at the western foot of the Aspromonte Mountain between the village of S. Cristina and S. Giorgio Morgeto (red dashed line in Figure 1A) was observed. Jacques et al. (2001) interpreted this as the coseismic reactivation of the west dipping CF during the 5 February mainshock. Concerning the seismic source models of 5 February, 7 February, and 1 March, some authors proposed the CF and SRF west-dipping normal faults as responsible sources (Tapponnier et al., 1987; Ghisetti, 1992; Tortorici et al., 1995; Monaco and Tortorici, 2000; Jacques et al., 2001) (Figure 1A, DSS; Debated Seismic Source). This hypothesis was supported by field geologic and morphotectonic data and observation by the distribution of the high-damage sites as exploited by the mesoseismal areas of the 1783 sequence (Baratta, 1901) and revisited macroseismic data (Andrenacci et al., 2023), the observed coseismic fracturing (de Dolomieu, 1784), and also by paleoseismological studies (Galli and Bosi, 2002; Galli and Peronace, 2015). Conversely, other authors inferred ruptures along the Gioia Tauro and the Mesima east-dipping blind low angle (∼30°) normal faults for the same events (Valensise and D’Aaddezio, 1994; Cucci et al., 1996; Peruzza et al., 1996; Loreto et al., 2013) (see also Figure 1A, ISS: Individual Seismic Source). This hypothesis was supported for the first time by Ricchetti and Ricchetti, (1991) based on stratigraphic studies and subsequently by Valensise and D’Aaddezio (1994), Pizzino et al. (2004), and Tiberti et al. (2017) based on their model with the poor evidence of recent activity along the W-dipping faults, studies regarding the sediment attitude, and also by geochemical anomalies recognized along the Gioia Tauro faults. More recently, other studies have been proposed by Cucci (2022), who, accordingly with Jacques et al. (2001), reviewed his own previous theory (Cucci et al., 1996), asserting that the distribution of the observed coseismic hydrological anomalies after the 1783 seismic sequence does not support the role of E-dipping faults as accountable sources for these events.
4 Geomorphological features and structural data
The CF and SRF border the western sectors of the Aspromonte and Serre mountains, respectively. These NNE-SSW-oriented, west-dipping, and 40-km-long faults (Figures 1A, C) develop cumulative scarps of up to 450 m in height (Jacques et al., 2001). Morphological and geological analyses highlighted how the faults juxtapose the Plio-Pleistocene sediments of the Gioia Tauro and Mesima basins with the crystalline rocks outcropping in the Aspromonte and Serre mountains, respectively (Monaco and Tortorici, 2000; Jacques et al., 2001). The fault activity caused the tilting of Plio-Pleistocene sediments on the hanging wall and determined the development of various sets of triangular and trapezoidal facets on the footwall (Tortorici et al., 1995; Monaco and Tortorici, 2000). The drainage network is perpendicular to the fault segments and interacted with the tectonic activity resulting in pronounced v-shaped valleys on the footwalls. Differently, the hanging-wall sectors are characterized by flat morphology and large alluvial fans.
In order to investigate the surface expression and the kinematic of the faults, a geological–structural survey was carried out. Unfortunately, due to the poorly conservative rock types cropping out in the investigated area, the kinematic indicators are difficult to observe (particularly in the SRF area). Structural data were collected in a few selected outcrops along the CF near Oppido Marmertina Village. A first outcrop (Figure 2, St. 1 in Figure 1) highlights a clear fault gauge zone along a tectonic contact that juxtaposes two facies of the metamorphic basement. Structural analysis indicates a NE-SW trending, NW-dipping fault planes. A second outcrop is located southwest of Oppido Mamertina, along the Spilinga River (Figure 3, St. 2 in Figure 1), where the fault meets the Aspromonte gneisses in the footwall and the Middle–Upper Pleistocene deposits in the hanging-wall. Pleistocene deposits are faulted and tilted toward the west (layer attitude 310/35, Figures 3A, B). Minor faults are parallel to the master fault and show steep eastward dips (see also Jacques et al., 2001). The master fault (F1) is NE-SW-oriented and shows a set of slickenlines consistent with normal-oblique sinistral kinematics (Figure 3C). Figure 4 (see also St. 3 in Figure 1) shows structural data (see also Tortorici et al., 1995) collected along a cataclastic zone near the CF plane. The master fault exhibits a mean N 30° E direction with the west-dipping plane, with sub-vertical slickensides indicating prevalent normal kinematics. Associated minor faults were also recognized and are characterized by east-dipping planes.
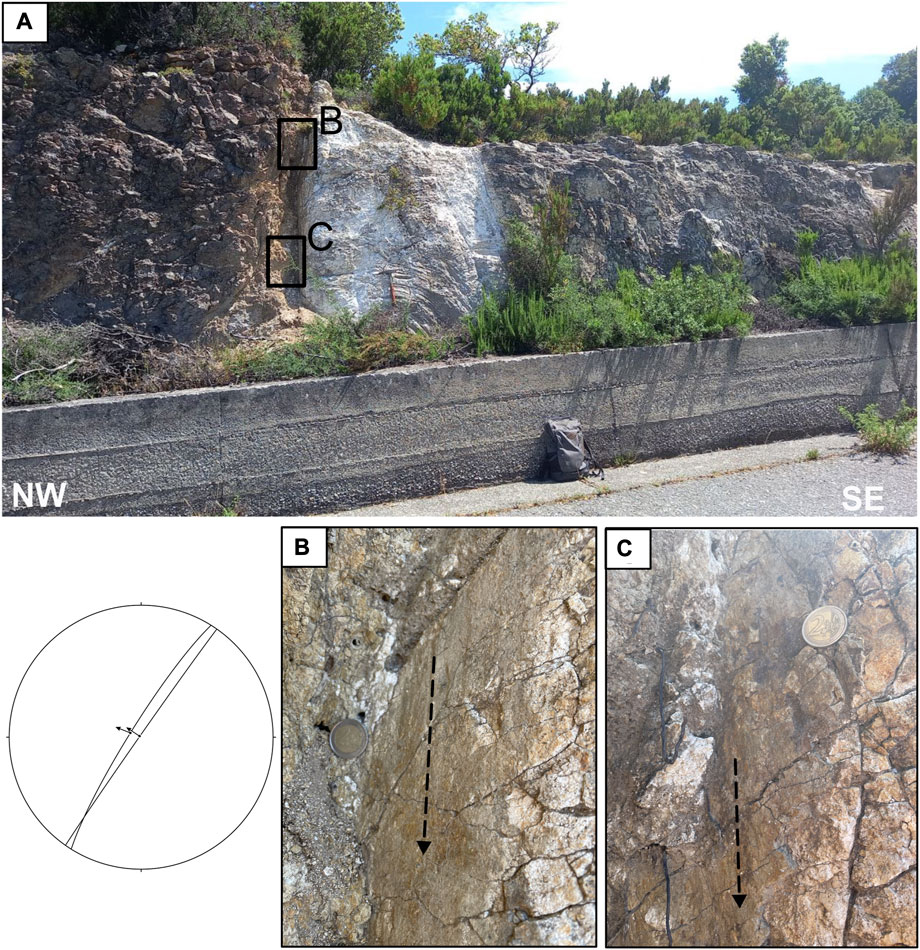
FIGURE 2. (A) Gauge zone (dark amphibolite and grey paragneiss to the left and right of the fault plane, respectively) and slickenlines related to secondary fault planes. (B) Zoom shot of the plane and slickenline (B) plotted in the stereonet diagram. (C) Zoom shot of the plane and slickenline (C) plotted in the stereonet diagram. Structural station coordinates: Easting 587393.379, Northing 4236403.872 (m; WGS 84 UTM Zone 33N).
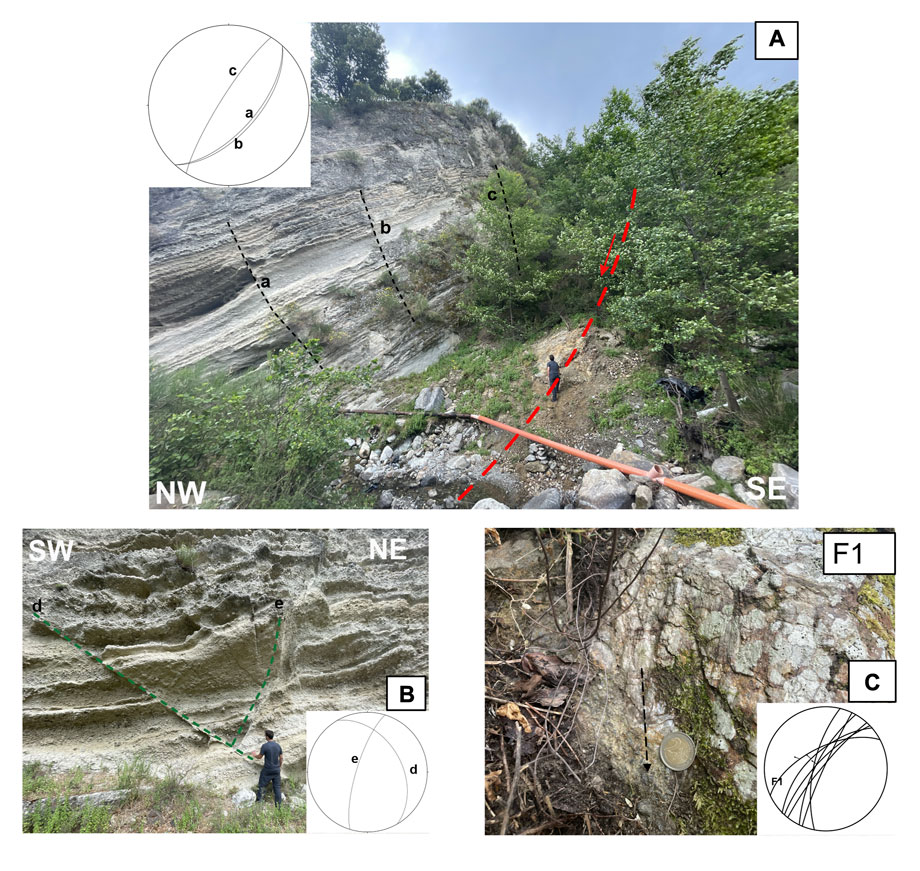
FIGURE 3. (A) Upper Pleistocene deposits, tilted by the main fault activity. The main fault [red dashed line, from Jacques et al. (2001)] juxtaposes the Pleistocene sediments with the basement rocks. Secondary planes a, b, and c are visible in stereographic projection and evidenced with a black dashed line in the outcrop picture view. Planes a and b are normal faults tilted into reverse attitude. (B) Secondary planes on Pleistocene deposits (planes d and e in stereographic projection). (C) Slickenlines on the main fault plane (F1). Structural station coordinates: Easting 588327.883, Northing 4236874.058 (m; WGS 84 UTM Zone 33N).
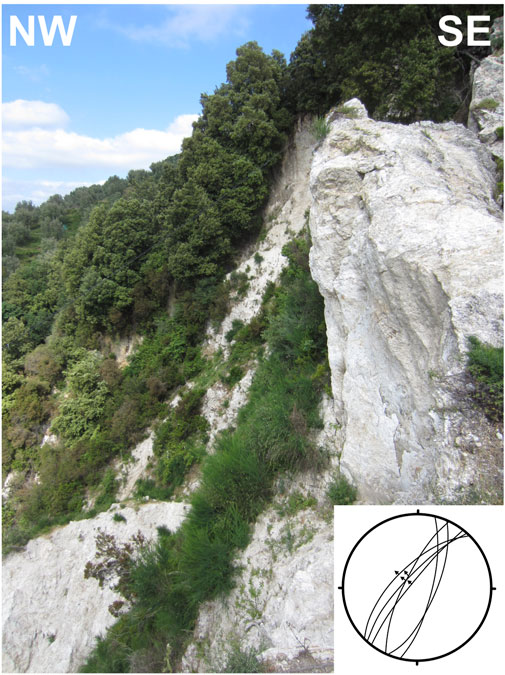
FIGURE 4. Structural data of the CF plane carried out along the west-dipping master fault (attitude N25°–45°E); this exhibits a prevalent normal kinematic and subordinate east-dipping fault planes, derived from Tortorici et al. (1995).
5 Seismological data: 3D fault modelling from earthquake distribution
To investigate the recent kinematics of the faults affecting the studied area, we analysed the available focal solutions from Scarfì et al. (2021) and the focal mechanism from ISC (http://www.isc.ac.uk/iscbulletin/search/fmechanisms/) and ISIDe (http://iside.rm.ingv.it/tdmt) databases (see Figure 1C). Within the first 15–20 km depth, focal mechanisms highlight prevalent normal kinematics, with major nodal planes oriented NNE-SSW, consistent with the geometries of the faults characterizing this domain. Conversely, the seismic layer between ∼20 and ∼30 km is characterized by prevalent strike slip mechanisms. In the deepest layer (30–40 km), focal solutions indicate reverse and strike slip faulting.
Earthquakes that have been instrumentally recorded since the early 1980s were used to infer the geometry of the studied faults at depth. We selected the seismic events occurred in the Calabrian Arc from the INGV databases (https://istituto.ingv.it/it/risorse-e-servizi/archivi-e-banche-dati.html) in order to enhance the picture derived from the seismic dataset. The initial parameters (i.e., arrival time and locations) were processed using tomoDDPS software (Zhang et al., 2009), which improves the accuracy of hypocentre location through a combination of absolute and differential arrival-time readings between couples of closely -spaced earthquakes. In addition, the code allows computing of the seismic ray-tracing in a 3D velocity model; here, we used the velocity model by Scarfì et al. (2018). The final locations (approximately 8,500 seismic events with magnitudes ranging from 1 to 5.7) resulted with an average uncertainty of 0.20 ± 0.15 km in both horizontal and vertical coordinates and an average root-mean-square travel-time residual of 0.02 s.
Kernel density maps of the final dataset allowed us to identify the most seismically active zones. The highest density of crustal seismicity (0–20 km) (Figure 5A) is recognizable along the main faults, particularly at the southern tip of the SRF and at the southern tip of CF. Sub-crustal seismicity (20–45 km) (Figure 5B) is concentrated in the northern and southern sectors. Note that the numerical values of density for the latter depth layer are lower than the other values (i.e., earthquakes/km2 lower than 0.37). Figure 5C shows the earthquakes between 45 and 300 km. In this case, the earthquake distribution and the corresponding high density associated with them are concentrated near the Tyrrhenian sector, which could be considered related to the Ionian Slab.
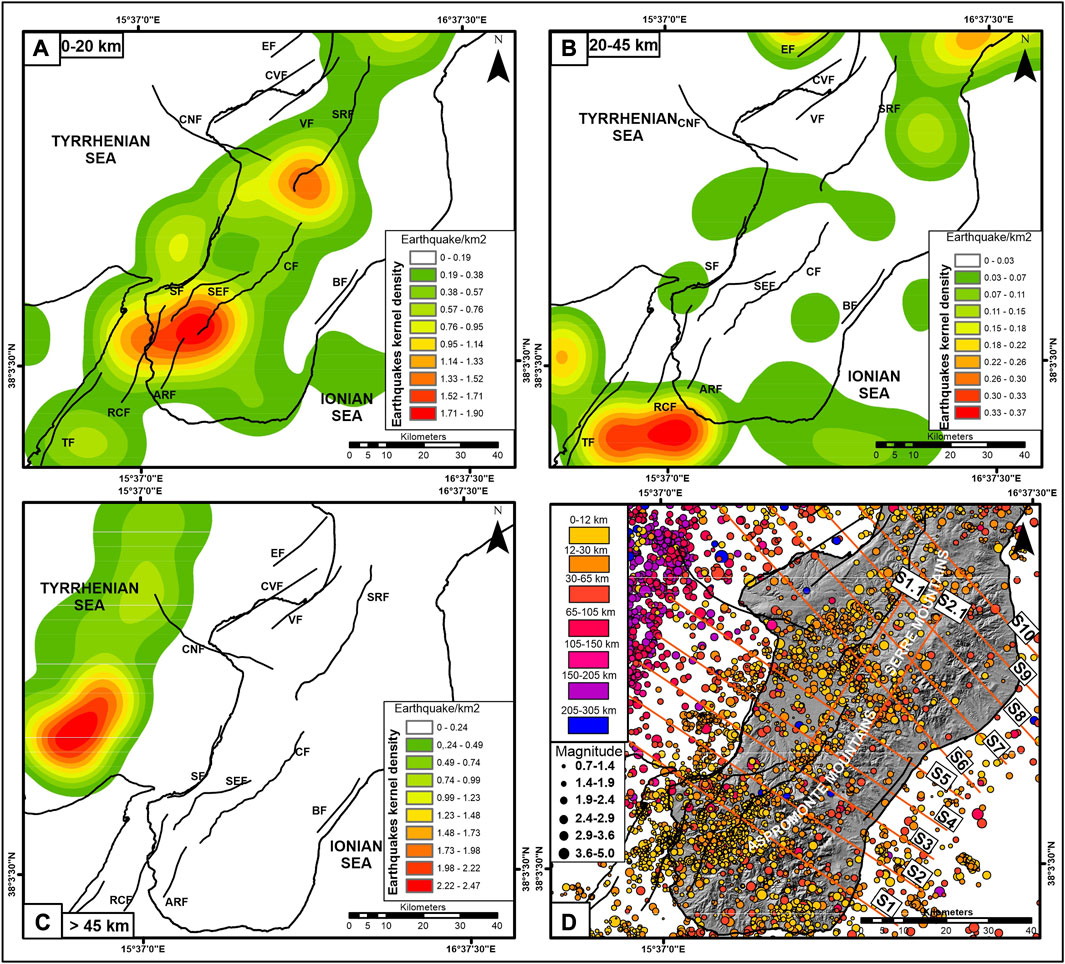
FIGURE 5. Kernel density map of earthquakes at different depth ranges: (A) 0 km < depth< 20 km; (B) 20 < depth < 45 km; and (C) depth > 45 km. (D) The epicentre location map shows seismological sections (S1–S10); seismic events are coloured as a function of depth and sized as a function of magnitude. TF, Taormina Fault; TFL, Tindari Fault Line; RCF, Reggio Calabria Fault; ARF, Armo Fault; SEF, S. Eufemia Fault; CF, Cittanova Fault; SF, Scilla Fault; BF, Bovalino Fault; CNFs, Coccorino–Nicotera faults; SRF, Serre Fault; VF, Vibo Fault; EF, Eufemia Fault.
To constrain the depth geometry of Serre and Cittanova faults, a set of 10-km spaced seismological sections (five sections for each fault, Figure 5D) with a buffer projection of 5 km was created (Figure 6); the geometry at depth of the considered faults (red lines) was traced following earthquake clustering starting from the intersection of the fault on surface (black crosses in Figure 6). In particular, in the 0–20 km depth range, the instrumental seismicity shows a high concentration of events near the area of Cittanova and Serre faults; clusters are visible, especially in S1 and S6 corresponding to the southern tip areas of the CF and SRF, respectively. Despite the other sections that do not exhibit clear clusters useful to infer the attitude of the studied faults at depth, we traced their geometry considering the same trend of S1 and S6 and the earthquakes with the highest magnitude for each sections. Subsequently, using a trial-and-error approach, we geometrically tested the modelled planes with the known empirical scaling in order to find a reliable solution for fault planes capable of generating events with a magnitude of 7 (as reported by historical catalogues for this area; CPTI15 catalogue; Rovida et al., 2022). It is worth noting that other clusters may be considered to trace a possible CF plane (see clusters to the left and right of the red line shown in S2, S4, S5 of Figure 6); however, for the aforementioned reasons, we decided to consider a trace that better fits with surface data (i.e., fault dip and position). In addition, here, clusters vertically arranged in sections S1, S4, and S6 (to the right of the red line, Figure 6) are interpreted as extensional cracks forming at footwall areas in response to the dilatational strain that generates at the base of a flexurally supported upper crust during normal faulting (see Ellis and King, 1991). Nevertheless, overpressured fluids causing distributed microseismicity (as proposed by Collettini et al., 2022 in the Central Italian areas) could not be ruled out. Frequently, without fluid overpressure, faulting can generate tension fractures within the first kilometre in depth (Griffith, 1920). The development of tension fractures at greater depths may be facilitated by loading dynamics associated with slips on seismogenic faults (see also Gudmundsson, 2000; Gudmundsson, 2011).
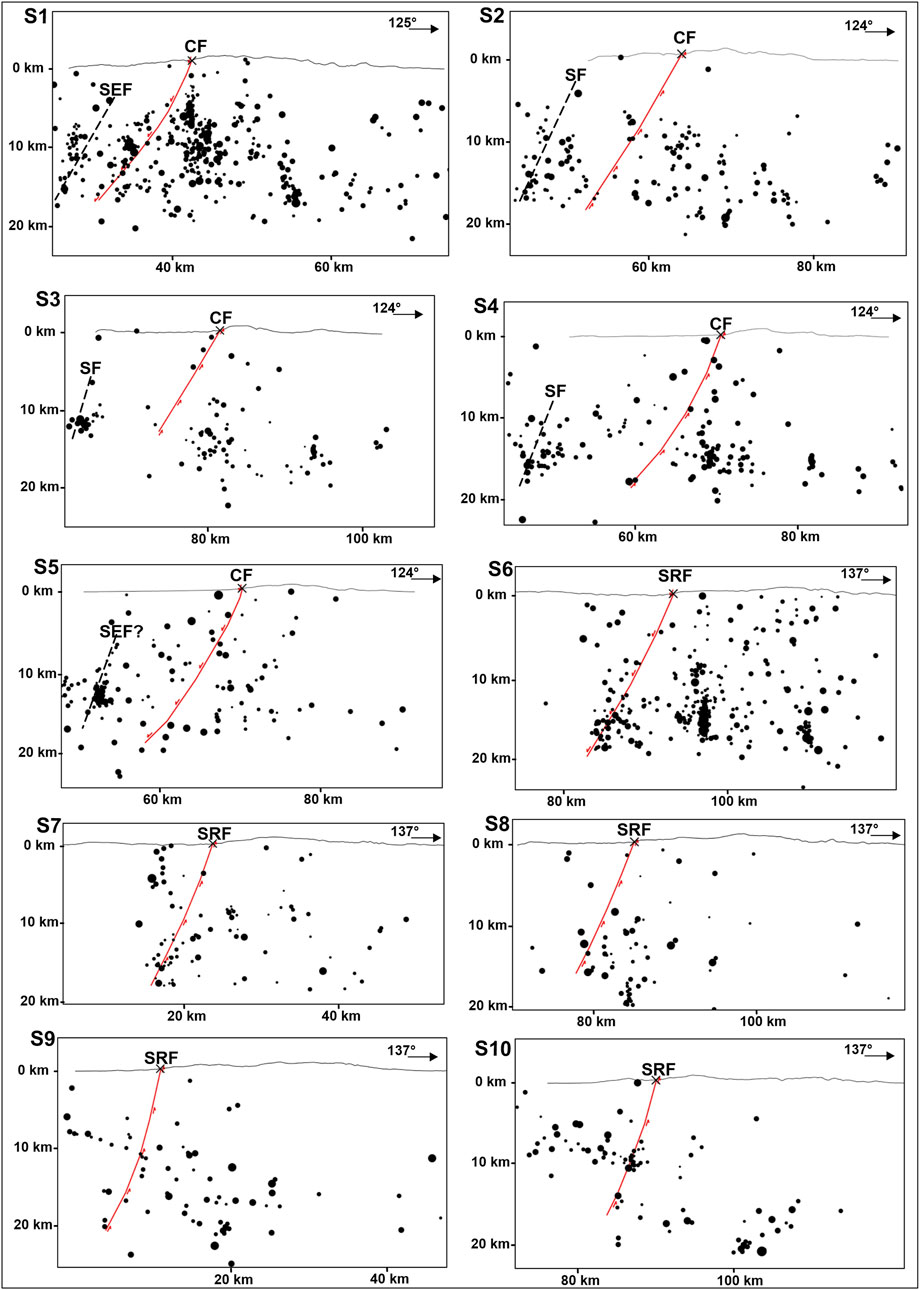
FIGURE 6. Seismological sections orthogonal to the Cittanova fault (S1–S5) and Serre fault (S6–S10); section traces in the map view are reported in the figure. Red lines are the modelled surfaces of SRF and CF from earthquakes. Crosses are the location of the studied faults at surface. Black dashed lines are the inferred traces of other faults (SF, Scilla Fault; SEF, S. Eufemia Fault) slicing along the sections.
The same seismic clusters were observed along S1–S5 and were used to infer the presence of other faults (i.e., the SEF and SF, S. Eufemia and Scilla faults, respectively, Figure 6). The S5 section is further north with respect to the SEF trace at surface (see also Figure 5D); thus, we consider this fault uncertain. Another interesting cluster is located between the tips of SRF and CF; this is also visible in the map view (Figure 5D). The cluster is roughly NNW-SSE-oriented, and it is probably generated by slips along the Nicotera–Gioiosa Fault Zone (NGFZ) (see Tripodi et al., 2018; Tripodi et al., 2022). To better investigate the origin of these seismic concentrations, we built two additional NNE-SSW trending seismological sections (S1.1 and S2.1, Figure 5D) (see Supplementary Figure S1). These sections allowed us to interpret the high concentrations of events between the SRF and CF as the result of the NGFZ activity. The fault belt is interpreted as a transfer zone that accommodates the SE migrations of the Calabrian terranes (see also Tripodi et al., 2022).
6 Geodetic data
We collected GNSS data from permanent stations of the RING network (http://ring.gm.ingv.it/) and TopNETlive Italy network in order to obtain the velocity field of the area across the previously described major faults (Figure 7). GNSS data were processed using GipsyX 1.5 (Bertiger et al., 2020), with precise ephemerides and clock correction provided by the Jet Propulsion Laboratory (https://sideshow.jpl.nasa.gov). In order to correctly process the data, we used the Earth orientation parameters from the International Earth Rotation Services (https://www.iers.org), the absolute IGS antenna phase center (GPS week 1958), and the Global Mapping Function (GMF) atmospheric zenith delay models (Boehm et al., 2006). Then, we processed the RINEX (Receiver INdependent EXchanges) files using the gd2e.gy module in GipsyX to estimate the position of the GNSS stations by using the Precise Point Positioning method. The obtained coordinates for each day of the year (DOY) were used to compute time series in the ITRF2014 reference frame (Altamimi et al., 2016). Subsequently, to show the current velocity field of the area, the velocities are referred to the eastern Sicily (Carnemolla, 2021, PhD thesis, for further information see also Pirrotta et al., 2021).
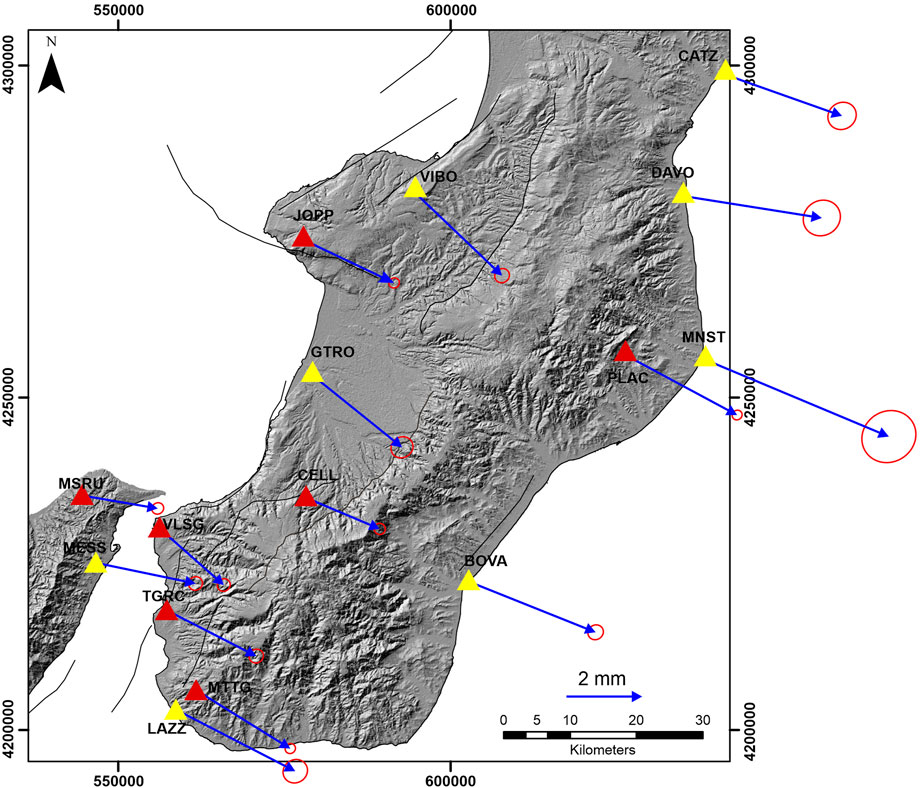
FIGURE 7. Velocity fields of the southern-central Calabria and northeastern Sicily, computed in the eastern Sicily fixed reference frame, and 95% confidence ellipses. The map also shows the distribution of the GNSS stations; red triangles indicate the RING/RDN network, and yellow triangles indicate the TopNETlive stations.
In order to investigate the effects of CF and SRF on surface, we calculated the strain field of the studied area from the GNSS velocity. This analysis is used by several authors to provide useful elements for studying tectonic phenomena (e.g., Caporali et al., 2003; Anzidei et al., 2005; Serpelloni et al., 2005). The strain field was obtained using Grid Strain (2D) software (Teza et al., 2008) based on the modified least square approach (Shen et al., 1996; Shen and Jackson, 2000). Strain eigenvalues and eigenvectors were computed within a series of experimental points (EPs) near a regular grid of node constructed in function of the median distance of available GNSS stations (Figure 8). We applied a reiterative approach in order to estimate the optimal scale factor for the distance weighting and to exclude the points too far from grid nodes. The reliability of the data inversion was estimated based on a significance geometric evaluation criterion in order to verify whether the grid nodes are well distributed respect to our experimental data (see also Teza et al., 2008).
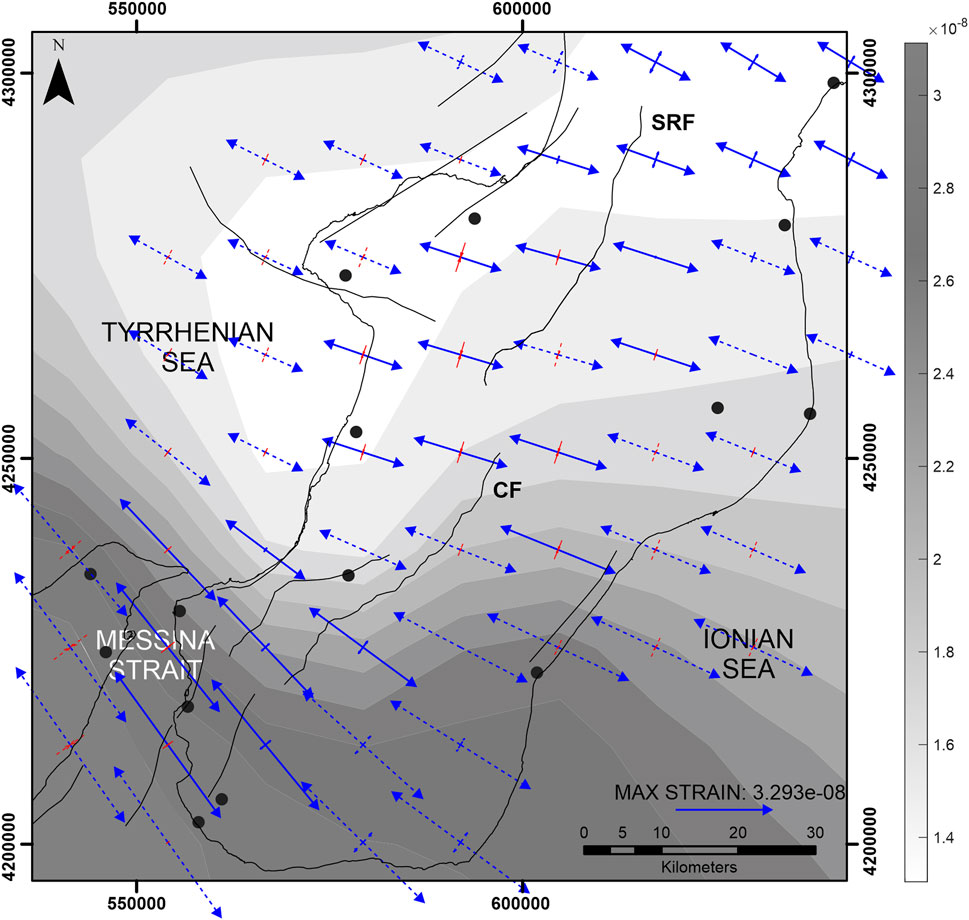
FIGURE 8. Strain field computed using the Grid Strain software (Teza et al., 2008). Black dots show the GNSS stations used for the inversion process. Blue and red lines represent extension and compression directions, respectively (solid line: high significance level; dotted lines: mid-significance level). The colour map shows the strain eigenvalue gradient. SRF, Serre Fault; CF, Cittanova Fault.
Figure 7 shows the horizontal velocities of GNSS stations resulting from our processing and error ellipses with a 95% confidence level. The velocity vectors exhibit a general south–east trend of motion with an average velocity of 2–3 mm/yr. The major change in the velocity is recognized near the Messina Strait; in this area, the velocity vectors show an increase in the module from west to east. Other minor changes in the velocity are visible across the major faults; here, a differential change in velocity is recognized near the CF and SRF traces. The WNW-ESE-oriented extensional strain is predominant, ranging from 1.2e−8 to 3.29e−8 strain (Figure 8). In the southwestern sector, near the Messina Strait, the extension rotates clockwise assuming a NW-SE direction. On the other hand, compressional strain is less evident in this domain, especially near the area surrounding major faults. The grey-shaded map shows the eigenvalue distribution that reaches the highest strain near the Messina Strait and near the footwall of CF. Maximum horizontal strain axes show an extension perpendicular to the directions of major faults. Thus, the obtained extensional dynamic is consistent with the observed tectonic framework characterizing the southern-central Calabria (Westaway, 1993; Tortorici et al., 1995; Monaco and Tortorici, 2000; Jacques et al., 2001; Ferranti et al., 2008; Palano et al., 2012).
7 Fault response modelling of the Cittanova and Serre faults
7.1 Methods
We combined the field structural data (dip and strike), literature data (especially for SRF), and kinematics observed at surface with the seismic dataset in order to develop a reliable 3D model of the fault planes using PETEX MOVE software (academic grant). The first phase of the modelling was the reconstruction of the geometry of the fault planes. It was constrained in depth by the seismological sections (S1–S10 sections in Figure 6). Fault kinematic was chosen using kinematic data measured on fault planes and according to the available focal solutions (ISC database http://www.isc.ac.uk/iscbulletin/search/fmechanisms; ISIDe database, http://iside.rm.ingv.it; see also Figure 1C). The obtained geometrical parameters of fault planes and the estimated fault rupture area and fault length vs. magnitude (respectively, RA and SRL in Table 1) were validated through statistical empirical relationships (Wells and Coppersmith, 1994; Leonard, 2010). The earthquake magnitude, estimated from the empirical relationships, is consistent with the magnitude of the seismic events occurred in this area (almost equal to 7), related to the reactivation of the Cittanova and Serre faults (see also Jacques et al., 2001 and references therein).
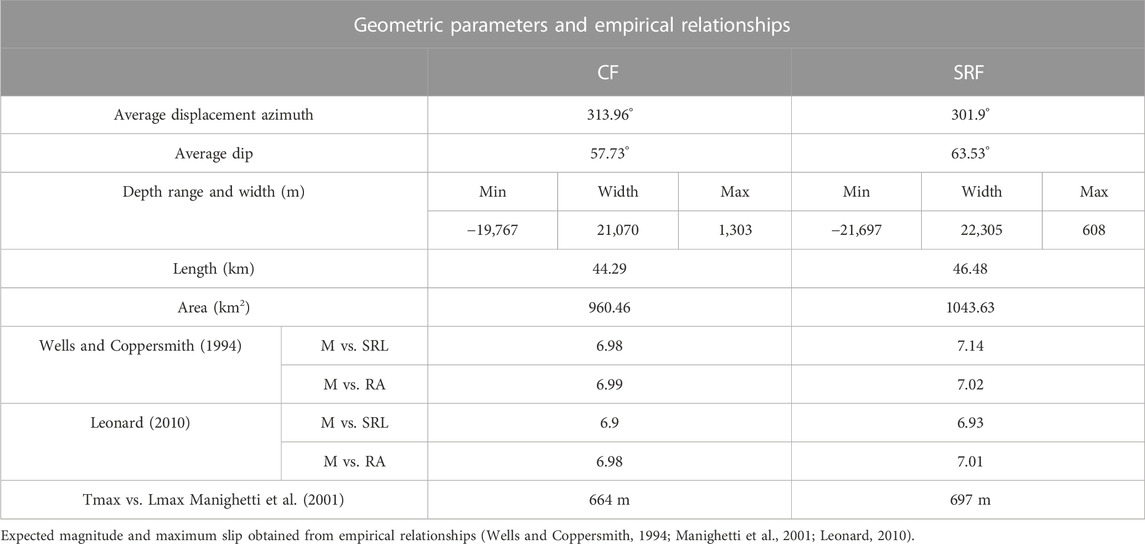
TABLE 1. Geometric parameters from the 3D model of the two faults.
The Fault Response Modelling (FRM) module was applied to kinematically test the model and verify the maximum vertical displacement and its spatial distribution associated with the activation of the fault planes for their entire length (which is consistent with a maximum expected magnitude of approximately 6.8–7). The FRM module in MOVE software allows a quick and flexible workflow to compute and visualize theoretical synthetic displacement, stress, and strain field induced by faults in assumption that planes belong to an elastic, isotropic, and homogeneous half space. This modelling approach is based on elastic dislocation theory (Okada, 1992) and the triangular dislocation element (TDE) method (Meade, 2007) used by several authors to define displacement, stress, and strain field related to interseismic and coseismic time-scale fault-related processes (Savage and Burford, 1973; Burgmann et al., 2000; McGuire and Paul, 2003).
The first test (Figure 10A) involves the activation of the fault planes with a uniform slip magnitude equal to 3 m. This value of the slip was chosen according to that reported by de Dolomieu (1784) after the 5 February 1783 earthquake. The vertical displacement was simulated on a topographic observation surface (see Table 2 for parameters of the medium) in order to estimate the spatial distribution of the fault effects during an event similar to the 1783 earthquake. Then, we compared the mesoseismal area of the 1783 seismic sequence, associated with the activity of Cittanova and Serre faults defined by Jacques et al. (2001), with our computed displacement diffusion. The second test (Figure 10B) involves the activation of fault planes assuming a maximum cumulative slip value obtained from the empirical relationships between Tmax (maximum slip) and Lmax (maximum fault length) estimated by Manighetti et al. (2001) for Quaternary normal faults (see also Table 1). In this case, the vertical displacement was computed on a horizontal observation surface (see Table 2 for parameters of the surface) in order to compare the actual height of the fault escarpments with our synthetic cumulative displacement field.

TABLE 2. Mechanical parameters of the medium (most commonly used values, see also Kanamori and Anderson, 1975; Karakas, 2008; Schön, 2011; Gudmundsson, 2011 and references therein).
7.2 Results
According to the proposed fault model (Figures 9A, B), CF is an almost 44-km-long fault, roughly N40E-oriented with a plane dipping toward NW, whereas the SRF is a N30E-striking, 40-km-long fault with a plane dipping toward NW. The average dip of the CF is 57°, while the SRF exhibits an average dip of approximately 60°. All geometric parameters are summarized in Table 1. Plane attitude and pole density distributions are reported in Figure 9C. The parameters derived from the 3D model were used to estimate the expected magnitude for each plane, assuming an activation of the faults for their entire length and using empirical relationships. We used the surface rupture length (SRL) and the rupture area (RA) vs. magnitude empirical scaling both for Wells and Coppersmith (1994) and Leonard (2010). The resulting magnitudes for the given faults are comparable (see Table 1).
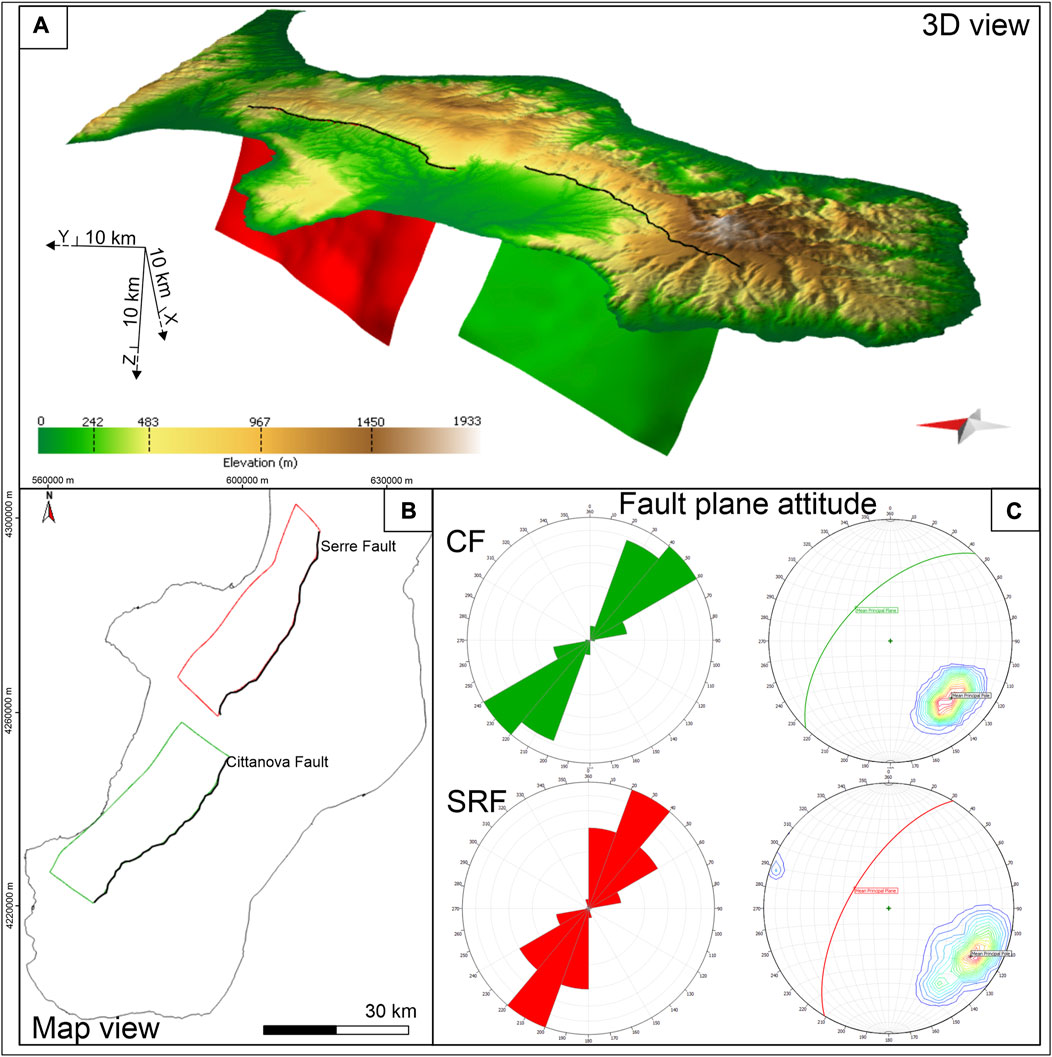
FIGURE 9. (A) 3D view of Serre and Cittanova fault planes, modelled according to fault trace on the surface, fault attitude from structural data, and earthquake clusters from the seismic section dataset. (B) Map view of the modelled planes. (C) Rose plots show the attitude of the modelled planes; stereonets exhibit poles contour density lines and the mean planes.
The first simulation (Figure 10A) shows the displacement field for the activation of both faults. The simulated vertical displacement ranges from 0.5 to 1.7 m (with a maximum value equal to 2.2 m) and is therefore consistent with that proposed by Jacques et al. (2001) (3 m of the slip on the fault plane) achieved from de Dolomieu’s historical report. The correspondence of the mesoseismal areas of 5 and 7 February and for the 1 March shocks (after Baratta, 1901; Jacques et al., 2001), macroseismic data (from Andrenacci et al., 2023), and simulated coseismic displacement (Figure 10A) confirms the choice of the CF and SRF faults, respectively, as the most likely causative sources for the considered events. Figure 10C shows that it is possible to visualize the profiles of vertical coseismic displacement across CF and SRF. Concerning the 6 February and 28 March events, we did not observe any correspondence, since the sources are different (Jacques et al., 2001; Pirrotta et al., 2021).
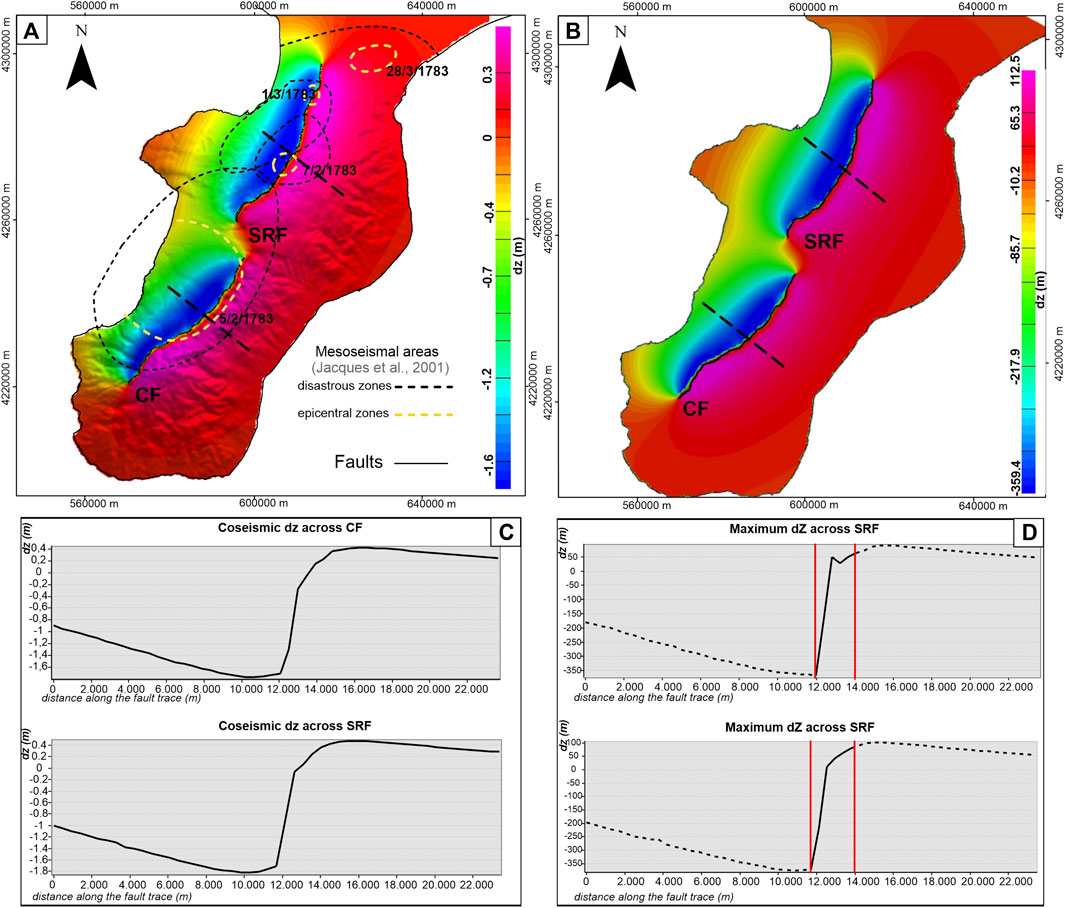
FIGURE 10. (A) Vertical displacement (dz) computed for 3 m of uniform slip on the fault planes. Fault responses were simulated on a topographic observation surface. Black and yellow dashed lines show the mesoseismal areas (disastrous and epicentral areas, respectively) for the shocks of the 1783 seismic sequence associated with the SRF and CF activity (see also Baratta, 1901; Jacques et al., 2001 for further information). (B) Vertical displacement (dz) computed for Tmax values of 664 m and 697 m, respectively, for CF and SRF. Fault responses were simulated on a horizontal observation surface (0 m a. s. l.). (C) Coseismic dz profile across CF and SRF. (D) Cumulative dz profile across CF and SRF. Red lines highlight the fault zone.
The second simulation (Figure 10B) shows the cumulative displacements ranging from −354 m to 112 m. In this case, the displacement values exhibit an abrupt change across the fault traces; the vertical cumulative displacement of CF and SRF reaches almost 450 m (see also the vertical displacement dz profiles shown in Figure 10D), which is consistent with the current height of the fault escarpment and the minimum vertical offset estimated for these faults (see also Jacques et al., 2001).
8 Slip tendency
8.1 Methods
Given a stress field, the reactivation of a fault surface depends on several parameters, such as the frictional resistance along the plane, the pore pressure (if any), and the fault orientation with respect to the remote stress applied. These mechanical parameters are not easily determinable for a fault of 10 km deep, displacing different lithologies and with an unknown deep groundwater setting. A simplified and powerful approach to evaluate the reactivation propensity of a given fault plane is to consider the fault as a cohesionless plane. In this case, slip occurs when the shear stress is equal to or more than the frictional resistance to slide, which depends on normal stress (as defined by the Amonton’s law). Morris et al. (1996) defined the ratio of shear stress to normal stress acting on the fault plane as slip tendency with the following equation:
where τ is the shear stress and σ ′ n is the effective normal stress.
Here, the slip tendency analysis is applied using the stress analysis module of the MOVE geomodelling suite (PETEX). Wallace (1951) and Bott (1959) stated that the distribution of Ts with fault orientation is possible starting from the magnitude and orientation of the principal stress axis. Thus, we used the structural data inversion method proposed by Angelier (1990) to obtain the differential stress field of the studied area, which is consistent with the stress field defined by De Guidi et al. (2013) and Scudero et al. (2020). Furthermore, assuming an average rock density of 2,600 kg/m3 and a water density of 1,053 kg/m3, approximating the maximum stress (σ1) to the lithostatic load, and considering a typical angle of internal friction of 30°, we obtained the confining stress at a depth of 10 km (average depth of the model; see also Figure 11A for the stress state settings and Figure 11B for the resolved stress state).
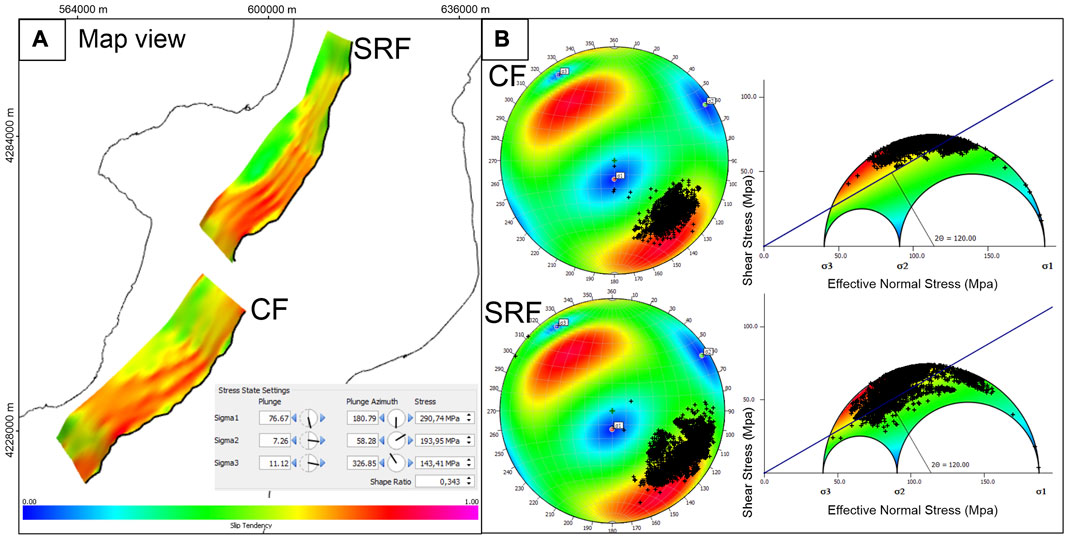
FIGURE 11. (A) Slip tendency (Ts) for CF and SRF planes and remote stress state settings. The distribution of Ts for each plane is expressed through the colour map. (B) Confining stress state resolved at 10 km of depth.
8.2 Results
The slip tendency analysis (Figure 11A) shows that both SRF and CF are under an almost unstable mechanical condition in the given remote stress state. Concerning the SRF, Ts ranges from 0.35 to 0.85, with the most frequent values ranging from 0.6 to 0.7, while CF exhibits Ts ranging from 0.45 to 0.80, with the most frequent values ranging from 0.62 to 0.68. Moreover, Ts value distribution for CF is more clustered than that for SRF which exhibits Ts spreading on its overall plane with another highly frequent minor distribution between 0.48 and 5.4, located especially near its northern and deepest portions. Note that the calculation was performed considering the saturated condition of the surrounding medium in order to take into account the worst condition for a potential reactivation of the fault planes, since it is noted that pore pressure facilitates slip (Terzaghi, 1945; Hoek, 2000).
9 Discussion
Adopting a multidisciplinary approach based on morpho-structural field data integrated with seismological and geodetic data, we modelled the 3D geometry of the Cittanova and Serre faults in southern Calabria, performed the FRM simulation for these faults, and evaluated their propensity to slip in the MOVE environment. On the basis of our results (maximum expected magnitude, vertical slip evaluation, and slip tendency) and according to the historical report (de Dolomieu (1784)) and previous works (Jacques et al., 2001; Andrenacci et al., 2023), we found that CF and SRF (called “debated seismogenic sources” in DISS; DISS Working Group, 2021, https://diss.ingv.it/) are the best candidate sources of the 5 February, 7 February, and 1 March 1783 events. On the contrary, the Gioia Tauro and Mesima faults do not exhibit surface evidence (e.g., coseismic scarplet, cumulative morphological scarps, kinematic indicators, and tectonic control on the drainage network) that would testify a recent activity associated with them.
The presence of numerous earthquakes and geodetic differential velocity across the faults testify that the southern Calabria is an active tectonic domain. The kernel density map for crustal earthquakes (0–20 km) (Figure 5A) shows a high value of density near the southern tip of CF and SRF, highlighting an increasing stress concentration in these sectors. According to Gudmundsson et al. (2010), this feature can be related to stress concentration that can occur around the fault zone due to a sudden change in geometry or geomechanical parameters, such as a decrease in Young’s modulus within the fault zone compared with the outside zone. The earthquake concentration near these structures may also be influenced by the presence of other structures, such as S. Eufemia, Armo, Reggio Calabria, and Scilla faults in the case of the CF source, and the presence of Nicotera and Coccorino faults in the case of the SRF source (Figure 1). Some of these faults are also considered capable of generating high-magnitude earthquakes (see also Jacques et al., 2001). Earthquakes show off-fault clusters vertically arranged in the same sections (Figure 6), suggesting the occurrence of extension or well-defined hydraulic fractures, which could be related to dynamic loadings, such as those associated with slip on seismogenic faults. In our opinion, considering the dip-attitude of faults at surface (∼60°) and the known strikes (∼N35°–40°E), clusters are congruent with a west-dipping geometry.
The strain field achieved from the geodetic velocity (Figure 8), consistent with the extensional stress state obtained by structural data inversion and with the stress state previously defined by other authors (e.g., Tortorici et al., 1995; De Guidi et al., 2013; Scudero et al., 2020), testifies a prevalent long-term extensional deformation oriented toward WNW-ESE. The latter seems to be orthogonally oriented with respect to CF and SRF attitude, which probably accommodate this process. Our results also agree with previous geodetic analysis carried out in these areas (Caporali et al., 2003; D’Agostino and Selvaggi, 2004; Serpelloni et al., 2010; Palano et al., 2012; Pirrotta et al., 2021). Although the strain values are very low (max strain equal to 3.29 × 10−08), the extensional strain field is clear. Low strain affecting the southern-central Calabrian is also documented by several studies (e.g., Mattia et al., 2009; D’Agostino et al., 2011; Palano et al., 2012 and reference therein); nevertheless, the process that determine this dynamic is still debated. In our opinion, the extensional regime is strictly related to the complex deep crustal dynamics and consequent mantle upwelling affecting the Calabrian Arc (see also Gvirtzman and Nur, 1999; Faccenna et al., 2001; Goes et al., 2004). In this scenario, the low strain in this domain vs. the high seismic moment release of the area remains an ongoing open challenge (see also Carafa et al., 2018).
Starting from the geometric parameter of the modelled planes, we investigated their reliability in relation to historical earthquakes (i.e., the 1783 events) using empirical scaling relationships (Wells and Coppersmith, 1994; Leonard, 2010; Table 1). Considering the relationship between the surface rupture length (SRL) vs. magnitude and the rupture area (RA) vs. magnitude, we found that both the CF and SRF planes are capable of generating an earthquake with M ∼7. Although the maximum length of the surface rupture observed by de Dolomieu (1784) is equal to 20 km (Figure 1C), using the empirical relationships (SRL vs. M), we calculated that the CF and SRF were activated at depth along their entire length (∼40 km) by an earthquake with magnitude ∼7. Furthermore, using the FRM module, we obtained the vertical displacement field for the modelled planes (Figure 10A). This seems to be consistent with the average slip of 3 m observed by de Dolomieu (1784) and with the cumulative escarpment associated with these faults. Note that the synthetic displacement for the FRM tests (see Section 7) was achieved from a kinematic constrain of the slip from direct observations (from de Dolomieu, 1784) and from the empirical scale by Manighetti et al. (2001) (see also Table 1).
To better understand the variability of the synthetic vertical displacement dz associated with the activity of the faults, we made a set of displacement profiles across the fault traces (Figures 10C, D). In our opinion, for the first test, the resulting synthetic dz distribution across the fault distance can depict the possible displacement field associated with an event similar to the main 5 February 1783 shock, also considering that the abrupt change in dz near the CF escarpment agrees with the average 3 m of slip on the fault plane recorded for this event. Assuming that the high-damage area corresponds to the area of maximum dz, we find a good match between the mesoseismal areas and the dz field distribution (Figure 10A). For the second test, the cumulative dz profile across the SRF and CF fits with the morphological escarpment across these faults, although this last simulation is valid only for the area enclosing the fault escarpment (i.e., 3–4 km across the fault traces, red lines in sections, Figure 10D). Moving away from the fault trace, dz can probably be overestimated or underestimated considering the presence of the other faults, such as S. Eufemia and Scilla, as well as the combination of erosion and isostatic rebound processes.
Finally, we used the slip tendency analysis (Morris et al., 1996) to evaluate a possible reactivation of the fault planes using the geometric parameters found in our 3D model and applied a remote stress obtained from structural and seismological data (see Sections 3–5). A critical review on the results of this analysis must take into account the deviation from the average geomechanical parameter values characterizing the host rocks and the fault planes. In our opinion, a density of 2,600 kg/m3, an angle of internal friction of 30°, and a Young’s module of 75 GPa represent the ideal condition for this evaluation. Furthermore, considering that these values can change with depth, the evaluation of Ts depends on change in the depth at which the resolved shear stress was computed.
10 Conclusion
A multidisciplinary study was developed to model the 3D geometry and kinematics of the Cittanova and Serre faults. Despite the scarcity of kinematic indicators in field, morpho-structural features (e.g., triangular and trapezoidal facets, drainage network, fracturing pattern, and kinematic indicators) confirm that CF and SRF are characterized by northwest-dipping planes with prevalent normal motion.
The instrumental seismicity, merged with structural field investigation and literature data, provided useful constraints to infer the geometry on surface and at depth of these faults. Earthquake concentration near the fault zone suggests that these structures are active and probably accommodate the extensional strain pattern recognized from the geodetic data. Strain pattern and geodetic velocity are also consistent with previous studies (see Palano et al., 2012; Pirrotta et al., 2021) and testify that the south-central Calabria is affected by a predominant extensional deformation.
Combining all previous data, we built, for the first time, a 3D model of the Cittanova and Serre fault planes. The geometric parameters obtained through the model of these faults are compatible with the empirical relationships (magnitude vs. rupture area and magnitude vs. fault length; Wells and Coppersmith, 1994; Leonard, 2010). Accordingly, we achieved the expected magnitude for CF and SRF and confirmed that these faults can be the probable sources of the mainshocks of the 1783 seismic sequence (5 February, 7 February, and 1 March, M = 6.9–7; Jacques et al., 2001). From the slip tendency analysis, we achieved the propensity to slip for both CF and SRF. According to this, we found that Ts values range from 0.35 to 0.85 and 0.45 to 0.80 for SRF and CF, respectively. This could suggest that both planes are astride under the stable and unstable mechanical conditions in the given regional stress state.
Considering the lack of seismic profiles onshore, the proposed model can represent an important starting point for seismotectonic modelling. The response of the modelled fault planes indicates that the simulated coseismic and cumulative vertical displacement fields agree with the historical observation of the slip along the fault planes and with actual height of the morphological scarps, respectively. Our work may lay a foundation for future data inversion to better constrain the seismogenic sources, for example, using the Okada (1992) analytical method and adopting interseismic kinematic models such as block modelling (McCaffrey, 2002; Meade and Hager, 2005) or dislocation modelling (Savage and Burford, 1973) approaches.
Data availability statement
The raw data supporting the conclusion of this article will be made available by the authors, without undue reservation.
Author contributions
SGi: investigations, conceptualization, methodology, data curation, modelling, and writing—editing. FB and FrC: data curation, methodology, and writing—review. FlC, GrB, and LS: data curation and writing—review. SGa and GiB: modelling, methodology, and writing—review. GD and CM: supervision, conceptualization, and writing—editing and review. All authors contributed to the article and approved the submitted version.
Funding
This research is part of the SGi research project at the University of Catania and was funded by the MUSE 4D project—Overtime tectonic, dynamic and rheologic control on destructive multiple seismic events—Special Italian Faults & Earthquakes: from real 4D cases to models in the frame of PRIN 2017, under grant number “2017KT2MKE” (fund manager CM) and by the PIAno di inCEntivi per la RIcerca di Ateneo (PIACERI 2020/2022) (fund manager GD).
Acknowledgments
The authors acknowledge the use of the MOVE Software Suite granted by Petroleum Experts Limited (www.petex.com).
Conflict of interest
The authors declare that the research was conducted in the absence of any commercial or financial relationships that could be construed as a potential conflict of interest.
Publisher’s note
All claims expressed in this article are solely those of the authors and do not necessarily represent those of their affiliated organizations, or those of the publisher, the editors, and the reviewers. Any product that may be evaluated in this article, or claim that may be made by its manufacturer, is not guaranteed or endorsed by the publisher.
Supplementary material
The Supplementary Material for this article can be found online at: https://www.frontiersin.org/articles/10.3389/feart.2023.1240051/full#supplementary-material
References
Altamimi, Z., Paul, R., Métivier, L., and Collilieux, X. (2016). ITRF2014: a new release of the international terrestrial reference frame modeling nonlinear station motions. J. Geophys. Res. Solid Earth 121 (8), 6109–6131. doi:10.1002/2016JB013098
Amodio Morelli, L., Bonardi, G., Colonna, V., Dietrich, D., Giunta, G., Ippolito, F., et al. (1976). Mem. Soc. Geol. It. 17, 1–60.
Andrenacci, C., Bello, S., Barbano, M. S., de Nardis, R., Pirrotta, C., Pietrolungo, F., et al. (2023). Reappraisal and analysis of macroseismic data for seismotectonic purposes: the strong earthquakes of southern Calabria, Italy. Geosciences 13, 212. doi:10.3390/geosciences13070212
Angelier, J. (1990). Inversion of field data in fault tectonics to obtain the regional stress—III. A new rapid direct inversion method by analytical means. Geophys. J. Int. 103 (2), 363–376. doi:10.1111/j.1365-246X.1990.tb01777.x
Anzidei, M., Baldi, P., Pesci, A., Esposito, A., Galvani, A., Loddo, F., et al. (2005). Geodetic deformation across the central appennines from GPS in time span 1999-2003. Ann. Geophys. 48, 973–988. doi:10.4401/ag-4405
Barbano, M. S., Azzaro, R., and Grasso, D. E. (2005). Earthquake damage scenarios and seismic hazard of Messina, north-eastern sicily (Italy) as inferred from historical data. J. Earthq. Eng. 9 (6), 805–830. doi:10.1080/13632460509350567
Bertiger, W., Bar-Sever, Y., Dorsey, A., Haines, B., Harvey, N., Hemberger, D., et al. (2020). GipsyX/RTGx, a new tool set for space geodetic operations and research. Adv. Space Res. 66 (3), 469–489. doi:10.1016/j.asr.2020.04.015
Boehm, J., Niell, A., Tregoning, P., and Schuh, H. (2006). Global mapping function (GMF): a new empirical mapping function based on numerical weather model data. Geophys. Res. Lett. 33 (7), L07304. doi:10.1029/2005GL025546
Boschi, E. (1997). Catalogo dei forti terremoti in italia dal 461 a. C. Al 1990. Berlin, Germany: Springer.
Boschi, E., Ferrari, G., Gasperini, P., Guidoboni, E., Smiriglio, G., and Valensise, G. (1995). Catalogo dei forti terremoti in italia dal 461 A.C. Al 1980. Roma: Istituto Nazionale di Geofisica, S.G.A.
Bott, M. H. P. (1959). The mechanics of oblique slip faulting. Geol. Mag. 96, 109–117. doi:10.1017/s0016756800059987
Burgmann, R., Schmidt, D., Nadeau, R. M., d’Alessio, M., Fielding, E., Manaker, D., et al. (2000). Earthquake potential along the northern hayward fault, California. Science 289 (5482), 1178–1182. doi:10.1126/science.289.5482.1178
Caporali, A., Martin, S., and Massironi, M. (2003). Average strain rate in the Italian crust inferred from a permanent GPS network-I. Strain rate versus seismicity and structural Geology. Geophys. J. Int. 155, 241–253. doi:10.1046/j.1365-246X.2003.02034.x
Caputo, M., and Caputo, R. (1989). Estimate of the regional stress field using joints systems. Bull. Geol. Soc. Greece 23 (1), 108–118.
Carafa, M. M. C., Kastelic, V., Bird, P., Maesano, F. E., and Valensise, G. (2018). A “geodetic gap” in the Calabrian Arc: evidence for a locked subduction megathrust? Geophys. Res. Lett. 45, 1794–1804. doi:10.1002/2017GL076554
Carnemolla, F. (2021). Monitoring and analysis of surface deformation using comparative geodetic and topographic techniques. Case study of the eastern slope of the Etna volcano. Ph.D. Thesis (Catania, Italy: University of Catania), 180.
Collettini, C., Barchi, M. R., De Paola, N., Trippetta, F., and Tinti, E. (2022). Rock and fault rheology explain differences between on fault and distributed seismicity. Nat. Commun. 13 (1), 5627. doi:10.1038/s41467-022-33373-y
Cucci, L., D’Addezio, G., Valensise, G., and Burrato, P. (1996). Investigating seismogenic faults in central and southern appennines (Italy): modeling of fault-related landscape features. United States: Annali Di Geofisica.
Cucci, L. (2022). NW-Dipping versus SE-dipping causative faults of the 1783 M7.1 southern Calabria (Italy) earthquake: the contribution from the analysis of the coseismic hydrological changes. Front. Earth Sci. 10, 987731. doi:10.3389/feart.2022.987731
D’Agostino, N., and Selvaggi, G. (2004). Crustal motion along the eurasia-nubia plate boundary in the Calabrian Arc and sicily and active extension in the Messina Straits from GPS measurements. J. Geophys. Res. 109 (11), 1–16. doi:10.1029/2004JB002998
D’Agostino, N., Avallone, A., Cheloni, D., D’Anastasio, E., Mantenuto, S., and Selvaggi, G. (2008). Active tectonics of the adriatic region from GPS and earthquake slip vectors. J. Geophys. Res. Solid Earth 113 (12), B12413–B12419. doi:10.1029/2008JB005860
D’Agostino, N., D’Anastasio, E., Anna, G., Guerra, I., Nedimović, M. R., and Seeber, L. (2011). Forearc extension and slow rollback of the Calabrian Arc from GPS measurements. Geophys. Res. Lett. 38 (17), 048270. doi:10.1029/2011GL048270
de Dolomieu, D. (1784). Me´moire sur les Tremblemens de Terre de la Calabre Pendant l’Anne´e 1783. Rome: Fulgoni.
De Guidi, G., Caputo, R., and Scudero, S. (2013). Regional and local stress field orientation inferred from quantitative analyses of extension joints: case study from southern Italy. Tectonics 32 (2), 239–251. doi:10.1002/tect.20017
del Ben, A., Barnaba, C., and Taboga, A. (2008). Strike-slip systems as the main tectonic features in the plio-quaternary kinematics of the Calabrian Arc. Mar. Geophys. Res. 29 (1), 1–12. doi:10.1007/s11001-007-9041-6
Dewey, J. F., Helman, M. L., Knott, S. D., Turco, E., and Hutton, D. H. W. (1989). Kinematics of the western mediterranean. Geol. Soc. Spec. Publ. 45, 265–283. doi:10.1144/GSL.SP.1989.045.01.15
DISS Working Group (2021). Database of individual seismogenic sources (DISS), version 3.3.0: a compilation of potential sources for earthquakes larger than M 5.5 in Italy and surrounding areas. Italy: Istituto Nazionale di Geofisica e Vulcanologia. doi:10.13127/diss3.3.0
Ellis, M., and King, G. (1991). Structural control of flank volcanism in continental rifts. Science 254, 839–842. doi:10.1126/science.254.5033.839
Faccenna, C., Becker, T. W., Lucente, F. P., Jolivet, L., and Rossetti, F. (2001). History of subduction and back-arc extension in the central mediterranean. Geophys. J. Int. 145, 809–820. doi:10.1046/j.0956-540x.2001.01435.x
Faccenna, C., Molin, P., Orecchio, B., Olivetti, V., Bellier, O., Funiciello, F., et al. (2011). Topography of the Calabria subduction zone (southern Italy): clues for the origin of Mt. Etna. Tectonics 30 (1), 2694. doi:10.1029/2010TC002694
Ferranti, L., Catalano, R., Lewis, D., and Marsella, E. (2008). Active deformation in southern Italy, sicily and southern sardinia from GPS velocities of the peri-tyrrhenian geodetic array (PTGA) VIGOR-valutazione Del PotenzIale geotermico delle RegiOni della convergenza view project NextData view project. Berlin, Germany: Springer.
Finetti, I., and Del Ben, A. (1986). Geophysical study of the Tyrrhenian opening. Boll. Geofis. Teor. Appl. 28 (110), 75–155.
Galli, P. A. C., and Peronace, E. (2015). Low slip rates and multimillennial return times for M<sub>w</sub> 7 earthquake faults in southern Calabria (Italy) M<sub>w</sub> 7 Earthquake Fault in Calabria Italy. Res. Lett. 42, 5258–5265. doi:10.1002/2015GL064062
Galli, P., and Bosi, V. (2002). Paleoseismology along the Cittanova Fault: implications for seismotectonics and earthquake recurrence in Calabria (southern Italy). J. Geophys. Res. 107 (3), 2044. doi:10.1029/2001jb000234
Ghisetti, F. (1992). Fault parameters in the Messina Strait (southern Italy) and relations with the seismogenic source. Tectonophysics 210 (1-2), 117–133. doi:10.1016/0040-1951(92)90131-o
Ghisetti, F., and Vezzani, L. (1982). Strutture tensionali e compressive indotte da meccanismi protondi lungo la linea del Pollino Appennino meridionale. Italian J. Geosciences 101 (3), 385–440.
Goes, S., Jenny, S. C. H., Kahle, H. G., and Geiger, A. (2004). A recent tectonic reorganization in the South-Central mediterranean. Earth Planet. Sci. Lett. 226 (3–4), 335–345. doi:10.1016/j.epsl.2004.07.038
Griffith, A. A. (1920). The phenomena of rupture and flow in solids. Philos. Trans. 221, 163–198. doi:10.1098/rsta.1921.0006
Gudmundsson, A. (2000). Active fault zones and groundwater flow. Geophys. Res. Lett. 27 (18), 2993–2996. doi:10.1029/1999GL011266
Gudmundsson, A. (2011). Rock fractures in geological processes. Cambridge: Cambridge University Press. doi:10.1017/CBO9780511975684
Gudmundsson, A., Simmenes, T. H., Larsen, B., and Philipp, S. L. (2010). Effects of internal structure and local stresses on fracture propagation, deflection, and arrest in fault zones. J. Struct. Geol. 32 (11), 1643–1655. doi:10.1016/j.jsg.2009.08.013
Gutscher, M.-A., Dominguez, S., Mercier de Lepinay, B., Pinheiro, L., Gallais, F., Babonneau, N., et al. (2016). Tectonic expression of an active slab tear from high-resolution seismic and bathymetric data offshore Sicily (Ionian Sea). Tectonics 34, 39–54. doi:10.1002/2015TC003898
Gutscher, M.-A., Kopp, H., Krastel, S., Bohrmann, G., Garlane, T., Zaragosi, S., et al. (2017). Active tectonics of the Calabrian subduction revealed by new multi-beam bathymetric data and high-resolution seismic profiles in the Ionian Sea (Central Mediterranean). Earth Planet. Sci. Lett. 461, 61–72. doi:10.1016/j.epsl.2016.12.020
Gvirtzman, Z., and Nur, A. (1999). Plate detachment, asthenosphere upwelling and topography across subduction zones. Geology 27, 563–566. doi:10.1130/0091-7613(1999)027<0563:pdauat>2.3.co;2
Hoek, E. (2000). Practical rock engineering. Available at: http://www.rockscience.com.
Hollenstein, C., Kahle, H. G., Geiger, A., Jenny, S., Goes, S., and Giardini, D. (2003). New GPS constraints on the Africa-Eurasia plate boundary zone in southern Italy. Geophys. Res. Lett. 30 (18), 3–6. doi:10.1029/2003GL017554
Jacques, E., Monaco, C., Tapponnier, P., Tortorici, L., and Winter, T. (2001). Faulting and earthquake triggering during the 1783 Calabria seismic sequence. Cambridge: Cambridge University Press.
Jolivet, L., and Faccenna, C. (2000). Mediterranean extension and the africa–eurasia collision. Tectonics 19, 1095–1106. doi:10.1029/2000TC900018
Kanamori, H., and Anderson, D. L. (1975). Theoretical basis of some empirical relations in seismology. Bolletin Seismol. Soc. Am. 65 (5), 1073–1095.
Karakas, A. (2008). Practical rock engineering. Environ. Eng. Geoscience 14 (1), 55–57. doi:10.2113/gseegeosci.14.1.55
Leonard, M. (2010). Earthquake Fault scaling: self-consistent relating of rupture length, width, average displacement, and moment release. Bull. Seismol. Soc. Am. 100 (5), 1971–1988. doi:10.1785/0120090189
Locati, M., Camassi, R., Rovida, A., Ercolani, E., Bernardini, F., Castelli, V., et al. (2022). Database macrosismico italiano (DBMI15), versione 4.0. United States: Istituto Nazionale di Geofisica e Vulcanologia. doi:10.13127/DBMI/DBMI15.4
Loreto, M. F., Fracassi, U., Franzo, A., Negro, P., Zgur, F., and Facchin, L. (2013). Approaching the seismogenic source of the Calabria 8 september 1905 earthquake: new geophysical, geological and biochemical data from the S. Eufemia gulf (S Italy). Mar. Geol. 343, 62–75. doi:10.1016/j.margeo.2013.06.016
Malinverno, A., and Ryan, W. B. F. (1986). Extension in the Tyrrhenian Sea and shortening in the Apennines as result of arc migration driven by sinking of the lithosphere. Tectonics 5, 227–245. doi:10.1029/tc005i002p00227
Manighetti, I., King, G. C. P., Gaudemer, Y., Scholz, C. H., and Doubre, C. (2001). Slip accumulation and lateral propagation of active normal faults in Afar. J. Geophys. Res. Solid Earth 106 (7), 13667–13696. doi:10.1029/2000jb900471
Mattia, M., Palano, M., Bruno, V., and Cannavò, F. (2009). Crustal motion along the calabro-peloritano arc as imaged by twelve years of measurements on a dense GPS network. Tectonophysics 476 (3–4), 528–537. doi:10.1016/j.tecto.2009.06.006
McGuire, J. J., and Paul, S. (2003). Imaging of aseismic fault slip transients recorded by dense geodetic networks. Geophys. J. Int. 155 (3), 778–788. doi:10.1111/j.1365-246X.2003.02022.x
Meade, B. J., and Hager, B. H. (2005). Block models of crustal motion in southern California constrained by GPS measurements. J. Geophys. Res. 110, 1–19. doi:10.1029/2004JB003209
Meade, B. J. (2007). Algorithms for the calculation of exact displacements, strains, and stresses for triangular dislocation elements in a uniform elastic half space. Comput. Geosciences 33 (8), 1064–1075. doi:10.1016/j.cageo.2006.12.003
Monaco, C., and Tortorici, L. (2000). Active faulting in the Calabrian Arc and eastern sicily. J. Geodyn. 29 (3–5), 407–424. doi:10.1016/S0264-3707(99)00052-6
Monaco, C., Tortorici, L., Nicolich, R., Cernobori, L., and Costa, M. (1996). From collisional to rifted basins: an example from the southern Calabrian Arc (Italy). Tectonophysics 266 (1–4), 233–249. doi:10.1016/S0040-1951(96)00192-8
Morris, A., Ferrill, D. A., and Henderson, D. B. (1996). Slip-tendency analysis and fault reactivation. Geology 24, 275–278. doi:10.1130/0091-7613(1996)024<0275:STAAFR>2.3.CO;2
Neri, G., Orecchio, B., Scolaro, S., and Totaro, C. (2020). Major earthquakes of southern Calabria, Italy, into the regional geodynamic context. Front. Earth Sci. 8, 579846. doi:10.3389/feart.2020.579846
Ogniben, L. (1969). Schema introduttivo alla geologia del Confine calabro-lucano. Mem. Soc. Geol. Ital. 8, 453–763.
Okada, Y. (1992). Internal deformation due to shear and tensile faults in a half-space. Bull. Seismol. Soc. Am. 92, 1018–1040. doi:10.1785/BSSA0820021018
Palano, M., Ferranti, L., Monaco, C., Mattia, M., Aloisi, M., Bruno, V., et al. (2012). GPS velocity and strain fields in sicily and southern Calabria, Italy: updated geodetic constraints on tectonic block interaction in the central mediterranean. J. Geophys. Res. Solid Earth 117 (7), 9254. doi:10.1029/2012JB009254
Peruzza, L., Pantosti, D., Slejko, D., and Valensise, G. (1996). Testing a new hybrid approach to seismic hazard assessment: an application to the Calabrian Arc (southern Italy). Nat. Hazards 14 (2–3), 113–126. doi:10.1007/bf00128260
Pirrotta, C., Barberi, G., Barreca, G., Brighenti, F., Carnemolla, F., de Guidi, G., et al. (2021). Recent activity and kinematics of the bounding faults of the catanzaro trough (central Calabria, Italy): new morphotectonic, geodetic and seismological data. Geosci. Switz. 11 (10), 405–419. doi:10.3390/geosciences11100405
Pizzino, L., Burrato, P., Quattrocchi, F., and Valensise, G. (2004). Geochemical signatures of large active faults: the example of the 5 february 1783, calabrian earthquake (southern Italy). J. Seismol. 8 (3), 363–380. doi:10.1023/B:JOSE.0000038455.56343.e7
Polonia, A., Torelli, L., Artoni, A., Carlini, M., Faccenna, C., Ferranti, L., et al. (2016). The ionian and alfeo-etna fault zones: new segments of an evolving plate boundary in the central mediterranean Sea? Tectonophysics 675, 69–90. doi:10.1016/j.tecto.2016.03.016
Polonia, A., Torelli, L., Mussoni, P., Gasperini, L., Artoni, A., and Klaeschen, D. (2011). The Calabrian Arc subduction complex in the Ionian Sea: regional architecture, active deformation, and seismic hazard. Tectonics 30, TC5018. doi:10.1029/2010TC002821
Postpischl, D. (1985). Catalogo dei terremoti italiani dall’anno 1000 Al 1980, CNR, PF geodinamica. Bologna: Graficcop.
Presti, D., Neri, G., Orecchio, B., Scolaro, S., and Totaro, C. (2017). The 1905 Calabria, southern Italy, earthquake: hypocenter location, causative process, and stress changes induced in the area of the 1908 Messina Straits earthquake. Bull. Seismol. Soc. Am. 107 (6), 2613–2623. doi:10.1785/0120170094
Ricchetti, E., and Ricchetti, G. (1991). Aspetti della morfogenesi pleistocenico olocenica sul versante tirrenico della Calabria. Mem. Soc. Geol. Ital. 47, 655–663.
Rosenbaum, G., and Lister, G. S. (2004). Neogene and quaternary rollback evolution of the tyrrhenian Sea, the apennines, and the Sicilian maghrebides. Tectonics 23, TC1013. doi:10.1029/2003TC001518
Rovida, A., Locati, M., Camassi, R., Lolli, B., Gasperini, P., and Antonucci, A. (2022). Catalogo Parametrico dei Terremoti Italiani (CPTI15), versione 4.0. United States: Istituto Nazionale di Geofisica e Vulcanologia. doi:10.13127/CPTI/CPTI15.4
Savage, J. C., and Burford, R. O. (1973). Geodetic determination of relative plate motion in central California. J. Geophys. Res. 78 (5), 832–845. doi:10.1029/jb078i005p00832
Scarfì, L., Barberi, G., Barreca, G., Cannavò, F., Koulakov, I., and Patanè, D. (2018). Slab narrowing in the central mediterranean: the calabro-ionian subduction zone as imaged by high resolution seismic tomography. Sci. Rep. 8 (1), 5178. doi:10.1038/s41598-018-23543-8
Scarfì, L., Langer, H., Messina, A., and Musumeci, C. (2021). Tectonic regimes inferred from clustering of focal mechanisms and their distribution in space: application to the central mediterranean area. J. Geophys. Res. Solid Earth 126 (1), 1–15. doi:10.1029/2020JB020519
Scudero, S., De Guidi, G., Caputo, R., and Perdicaro, V. (2017). Bulletin of the geological society of Greece volume XLIII, ?ο 3. Bull. Geol. Soc. Greece 43 (3), 280–316. doi:10.12681/bgsg.11274
Scudero, S., De Guidi, G., Caputo, R., and Perdicaro, V. (2020). A semi-quantitative method to combine tectonic stress indicators: example from the southern Calabrian Arc (Italy). Bull. Geol. Soc. Greece 43 (3), 280–316. doi:10.12681/bgsg.23485
Serpelloni, E., Anzidei, M., Baldi, P., Casula, G., and Galvani, A. (2005). Crustal velocity and strain-rate fields in Italy and surrounding regions: new results from the analysis of permanent and non-permanent GPS networks. Geophys. J. Int. 161 (3), 861–880. doi:10.1111/j.1365-246x.2005.02618.x
Serpelloni, E., Bürgmann, R., Anzidei, M., Baldi, P., Mastrolembo Ventura, B., and Boschi, E. (2010). Strain accumulation across the Messina Straits and kinematics of sicily and Calabria from GPS data and dislocation modeling. Earth Planet. Sci. Lett. 298 (3–4), 347–360. doi:10.1016/j.epsl.2010.08.005
Shen, Z.-K., Jackson, D. D., and Ge, B. X. (1996). Crustal deformation across and beyond the Los Angeles basin from geodetic measurements. J. Geophys. Res. Atmos. 101, 27957–27980. doi:10.1029/96jb02544
Shen, Z. K., and Jackson, D. D. (2000). Optimal estimation of geodetic strain rates from GPS data. EOS Transaction Am. Geophys. Union 81 (19), 247. doi:10.1785/0120140247
Tansi, C., Muto, F., Critelli, S., and Iovine, G. (2007). Neogene-quaternary strike-slip tectonics in the central Calabrian Arc (southern Italy). J. Geodyn. 43 (3), 393–414. doi:10.1016/j.jog.2006.10.006
Tapponnier, P., Tortorici, L., and Winter, T. (1987). Faulting during the 1783 Calabria earthquakes and tectonics of the Messina Strait. Terra Cognita: Terra Abstract, 305.
Terzaghi, K. (1945). Stress conditions for the failure of saturated concrete and rock. Proc. Am. Soc. Test. Mater. 45, 777–801.
Teza, G., Pesci, A., and Galgaro, A. (2008). Grid_strain and Grid_strain3: software packages for strain field computation in 2D and 3D environments. Comput. Geosciences 34 (9), 1142–1153. doi:10.1016/j.cageo.2007.07.006
Tiberti, M. M., Vannoli, P., Fracassi, U., Burrato, P., Kastelic, V., and Valensise, G. (2017). Understanding seismogenic processes in the southern Calabrian Arc: a geodynamic perspective. Italian J. Geosciences 136 (3), 365–388. doi:10.3301/ijg.2016.12
Tortorici, L., Monaco, C., Tansi, C., and Cocina, O. (1995). Recent and active tectonics in the Calabrian Arc (southern Italy). Tectonophysics 243, 37–55. doi:10.1016/0040-1951(94)00190-K
Tripodi, V., Gervasi, A., La Rocca, M., Lucà, F., and Muto, F. (2022). Seismotectonics of southern Calabria terrane (south Italy). J. Mt. Sci. 19 (11), 3148–3162. doi:10.1007/s11629-022-7354-1
Tripodi, V., Muto, F., Brutto, F., Perri, F., and Critelli, S. (2018). Neogene-Quaternary evolution of the forearc and backarc regions between the Serre and Aspromonte Massifs, Calabria (southern Italy). Mar. Petroleum Geol. 95, 328–343. doi:10.1016/j.marpetgeo.2018.03.028
Valensise, G., and D’Aaddezio, G. (1994). Il contributo della geologia di superficie all’identificazione delle strutture sismogenetiche della Piana di Gioia Tauro. Berlin, Germany: Pubblicazione ING, 34.
Wallace, R. E. (1951). Geometry of shearing stress and relation to faulting. J. Geol. 59, 118–130. doi:10.1086/625831
Wells, D. L., and Coppersmith, K. J. (1994). New empirical relationships among magnitude, rupture length, rupture width, rupture area, and surface displacement. Bull. Seismol. Soc. Am. 84, 974–1002.
Westaway, R. (1993). Quaternary uplift of southern Italy. J. Geophys. Res. 98 (12), 21741–21772. doi:10.1029/93jb01566
Wortel, M. J. R., and Spakman, W. (2000). Subduction and slab detachment in the mediterranean-carpathian region. Science 290 (5498), 1910–1917. doi:10.1126/science.290.5498.1910
Keywords: Calabrian Arc, active tectonics, seismogenic faults, 3D modelling, fault response modelling
Citation: Giuffrida S, Brighenti F, Cannavò F, Carnemolla F, De Guidi G, Barreca G, Gambino S, Barberi G, Scarfì L and Monaco C (2023) Multidisciplinary analysis of 3D seismotectonic modelling: a case study of Serre and Cittanova faults in the southern Calabrian Arc (Italy). Front. Earth Sci. 11:1240051. doi: 10.3389/feart.2023.1240051
Received: 14 June 2023; Accepted: 15 August 2023;
Published: 04 September 2023.
Edited by:
Fabio Luca Bonali, University of Milano-Bicocca, ItalyReviewed by:
Simone Bello, University of Studies G. d'Annunzio Chieti and Pescara, ItalyFrancesco Muto, University of Calabria, Italy
Copyright © 2023 Giuffrida, Brighenti, Cannavò, Carnemolla, De Guidi, Barreca, Gambino, Barberi, Scarfì and Monaco. This is an open-access article distributed under the terms of the Creative Commons Attribution License (CC BY). The use, distribution or reproduction in other forums is permitted, provided the original author(s) and the copyright owner(s) are credited and that the original publication in this journal is cited, in accordance with accepted academic practice. No use, distribution or reproduction is permitted which does not comply with these terms.
*Correspondence: S. Giuffrida, c2FsdmF0b3JlLmdpdWZmcmlkYUBwaGQudW5pY3QuaXQ=