 Gyeong-Mi Tak
 Hyun Kim
- Division of Environmental and Forest Science, Gyeongsang National University, Jinju, Republic of Korea
Forest soil sediment disasters, categorized as landslides, slow-moving landslides (land creep), and debris flows, result in destruction of forests and properties, loss of life, and damage to infrastructures. Therefore, it is imperative to evaluate factors that cause slow-moving landslides and establish a national-level hazard information system. In this study, we used geographic information system (GIS) to investigate the difference between landslides and slow-moving landslides by overlapping and analyzing landslide hazard map with slow-moving landslide sites. Slow-moving landslide areas (SLAs) and non-SLAs were characterized to compare the effects of altitude and slope in slow-moving landslide events. Finally, we performed a hydrographical analysis of waterways to compare the SLAs and non-SLAs. Grade 3 slow-moving landslide sites were found to be the most prevalent among all landslide hazard grades (1–5), including those in regions outside the specified grades. The altitude and slope of SLAs were 5 m higher and 1° steeper than those of non-SLAs, respectively. The waterways in non-SLAs (205.4 m) were longer than those in SLAs (85.2 m). Our study highlights the importance of altitude, slope, and waterways as triggers for slow-moving landslides and provides an empirical basis for establishing national hazard information systems for these events.
1 Introduction
Natural disasters are becoming increasingly prevalent worldwide (Senanayake et al., 2022). In particular, large-scale forest soil sediment disasters induced by complex topographical and climatic factors destroy forests and cause loss of life, property destruction, and infrastructure damage (Stanley and Kirschbaum, 2017; Habumugisha et al., 2022). According to a World Bank report, approximately 300 million people reside in landslide-prone areas, with approximately 600 annual landslide-related mortalities (Das and Lepcha, 2019). Numerous forest soil sediment disasters occurred in South Korea in 2000 as a result of typhoons and torrential rain (Ham and Hwang, 2014), and related damages were particularly severe in the summers of 2011 and 2020 owing to heavy precipitation (Korea Forest Service, 2021).
Forest soil sediment disasters are categorized as landslides, slow-moving landslides (land creep), and debris flows in South Korea. The United States Geological Survey (USGS) report, sponsored by the International Consortium on Landslides, defines a landslide as the downslope movement of soil, rock, and organic material under the influence of gravity and the resulting deformation of the landscape. The USGS explained that the term landslide is a general term used to describe this type of mass movement. Landslides are classified into various kinds, including falls (rockfalls, topples), slides (rotational landslides, translational landslides), spreads (lateral spreads), and flows (debris flows, lahars (volcanic debris flows), debris avalanches, earthflows, slow earthflows (creep), and flows in permafrost) (Highland and Bobrowsky, 2008). Among these, South Korea’s slow-moving landslide can be explained as slow earthflow (creep). Here, creep is an informal name for slow earthflow and refers to a phenomenon in which the soil or rocks forming a slope move downward so slowly and steadily that they are imperceptible. In other words, movement is caused by internal shear stress, which is enough to deform the terrain but not strong enough to cause rapid damage. Additionally, creep is widespread worldwide and is the most common type of landslide, often preceding faster and more destructive types of landslides (Highland et al., 2008).
The erosion of deep soils of formerly mountainous forest areas and increased urbanization and forest land-use conversion have increased the occurrence of slow-moving landslides recently (National Institute of Forest Science, 2021). The stability of areas at hazard of slow-moving landslides is indirectly influenced by ground and effective pores, which determine rainfall infiltration and groundwater levels. Groundwater levels and pore water pressure rise with increased precipitation, which reduces the shearing force of the soil (Agliardi et al., 2020; Tian et al., 2023; Yu et al., 2023; Zhang et al., 2023) and can lead to slow-moving landslides.
Several major slow-moving landslides during the early 1990s in South Korea were initially classified as landslides (Woo et al., 1996). Slow-moving landslides and landslides differ in their geological features, soil quality, earth and rock movement velocities, topography, activity and movement status, clod, occasional cause, scale, outcomes, and slope (National Institute of Forest Science, 2021). Landslides entail an increase in groundwater level and the eventual downward sliding of soil over bedrock (including the sliding surface of the soil); they are characterized by the instantaneous collapse of sediments because of the lubricating action of water at the soil–bedrock interface. In contrast, slow-moving landslides involve the slow movement of the entire soil layer (approximately 0.01 mm/day) owing to the impact of the clay layer in the soil stratum or groundwater pressure on the underlying rock (National Institute of Forest Science, 2021).
The occurrence of slow-moving landslides is determined by a combination of internal (e.g., geology, soil composition, topography, hydrology, and forest floor structure) and external (e.g., rainfall, earthquakes, and large-scale construction) factors. A national-level slow-moving landslide vulnerability assessment and hazard information system (slow-moving landslide hazard map) must be established to effectively observe, analyze, and predict the hazard of slow-moving landslide occurrence. South Korea currently provides landslide hazard maps to identify vulnerable areas, but there are no instruments to predict the occurrence of slow-moving landslides. Furthermore, recent studies have analyzed the geology (Shin et al., 2018; Kim et al., 2021; Park et al., 2022), topography (Kim et al., 2020; Lee et al., 2020; Park et al., 2021a; Choi et al., 2021), rainfall (Jeon and Lee, 2019; Kang et al., 2022), groundwater (Preisig et al., 2016; Kim et al., 2017; Lee et al., 2019), reservoir levels (Wang et al., 2021), forest floor (Kim et al., 2016; Park and Park, 2018; Park and Park, 2020), and slope (Choi et al., 2019; Park et al., 2019) of slow-moving landslides. However, these studies failed to consider the differences in characteristics depending on slow-moving landslide triggering factors between slow-moving landslide areas (SLAs) and surrounding non-SLAs, which are essential for predicting the overall hazard and outcome of slow-moving landslides. Given their importance, the altitude and slope differences between mountainous SLAs and non-SLAs should be considered when creating slow-moving landslide hazard maps.
In contrast to landslides caused by strong earthquakes or heavy rains, silent large-scale landslides in Zhaobishan, China, are said to occur in large water confluence areas behind the main scarp in mountainous areas (Tian et al., 2023). However, no study has yet been conducted to compare and analyze the differences in waterways within mountainous areas due to rainfall, which can affect changes in groundwater levels, a significant factor in slow-moving landslides. The principle of water flowing from high to low altitudes and from steep to shallow slopes has been used to analyze waterway behavior via a digital elevation model (DEM) and geographic information system (GIS) modeling (Kim et al., 2012).
In this study, we evaluated the applicability of a hazard information system for slow-moving landslides in South Korea. Accordingly, GIS modeling was utilized to overlap and analyze landslide hazard map and slow-moving landslide sites. We were interested in areas where slow-moving landslides had caused casualties or property damage in mountainous areas near our living areas. We also focused on why slow-moving landslides occur on some of these mountain slopes. It is essential to clearly identify the causes of slow-moving landslides, one of the forest soil sediment disasters that is likely to be caused by a complex mechanism due to numerous factors. Prior to this, in this study, we used GIS to attempt to verify whether topographical characteristics of mountainous areas, such as altitude, slope, and the characteristics of waterways formed by rainfall and topographical features, act as characteristic factors causing slow-moving landslides. To this end, we identified SLAs and their adjacent non-SLAs to analyze the altitude and slope differences. We then differentiated SLAs and non-SLAs based on the waterways created by precipitation and torrential rains to determine the applicability of waterways as novel triggering factors for slow-moving landslides.
2 Materials and methods
2.1 Selection of study sites
We selected 12 study sites across South Korea where recent slow-moving landslides caused mortalities or property damage (Park et al., 2021b). However, a digital topographic map was unavailable for two sites prior to the estimated period of slow-moving landslide occurrence; therefore, 10 sites were selected for the final analysis (Figure 1).
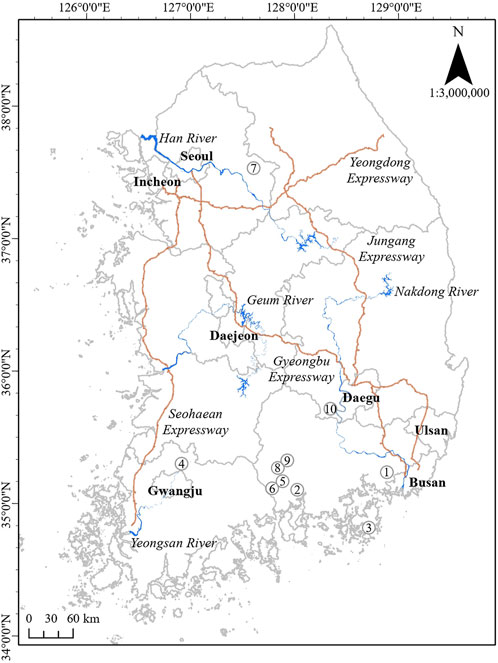
FIGURE 1. Geographic location of slow-moving landslide sites. Note: ① = site no. 1: 1,082-1, Naesam-ri, Gimhae, Gyeongnam, ② = site no. 2: 58 Mt., Jakpal-ri, Sacheon, Gyeongnam, ③ = site no. 3: 127-3 Mt., Hakdong-ri, Geoje, Gyeongnam, ④ = site no. 4: 99 Mt., Hakdong-ri, Damyang, Jeonnam, ⑤ = site no. 5: 217 Mt., Cheongnyong-ri, Hadong, Gyeongnam, ⑥ = site no. 6: 26-5 Mt., Hoesin-ri, Hadong, Gyeongnam, ⑦ = site no. 7: 12-1 Mt., Baegan-ri, Yangpyeong, Gyeonggi, ⑧ = site no. 8: 75-3, Un-ri, Sancheong, Gyeongnam, ⑨ = site no. 9: 27-1, Un-ri, Sancheong, Gyeongnam, and ⑩ = site no. 10: 35 Mt., Singok-ri, Goryeong, Gyeongbuk, South Korea.
2.2 Setting analysis area
To analyze the differences in altitude, slope, and waterway between SLAs and non-SLAs, we first established the polygon boundary of the slow-moving landslide site using a Pro-XRS GPS device (Trimble, Westminster, Colorado, United States) with a positioning accuracy of 50 cm or less (post-processed). The SLAs were created using the shape creation function of GIS software to form rectangular polygons around the boundaries of slow-moving landslide sites. The adjacent non-SLA was positioned on the left and right sides of half the corresponding SLA based on the direction and length of the SLA; placement was determined by the lowest end contour line of the SLA (See Figure 2). To understand the characteristics of SLAs, we established SLAs surrounding the boundaries of slow-moving landslide sites and non-SLAs adjacent to the SLAs. In addition, the size and placement of SLAs and non-SLAs were determined to ensure fairness in statistical analysis by ensuring equality of samples between comparison groups. Meanwhile, ArcMap 10.8 (ESRI, Redlands, CA, United States) was used to set up the analysis area, conduct overlap analyses, and analyze altitude, slope, and waterway.
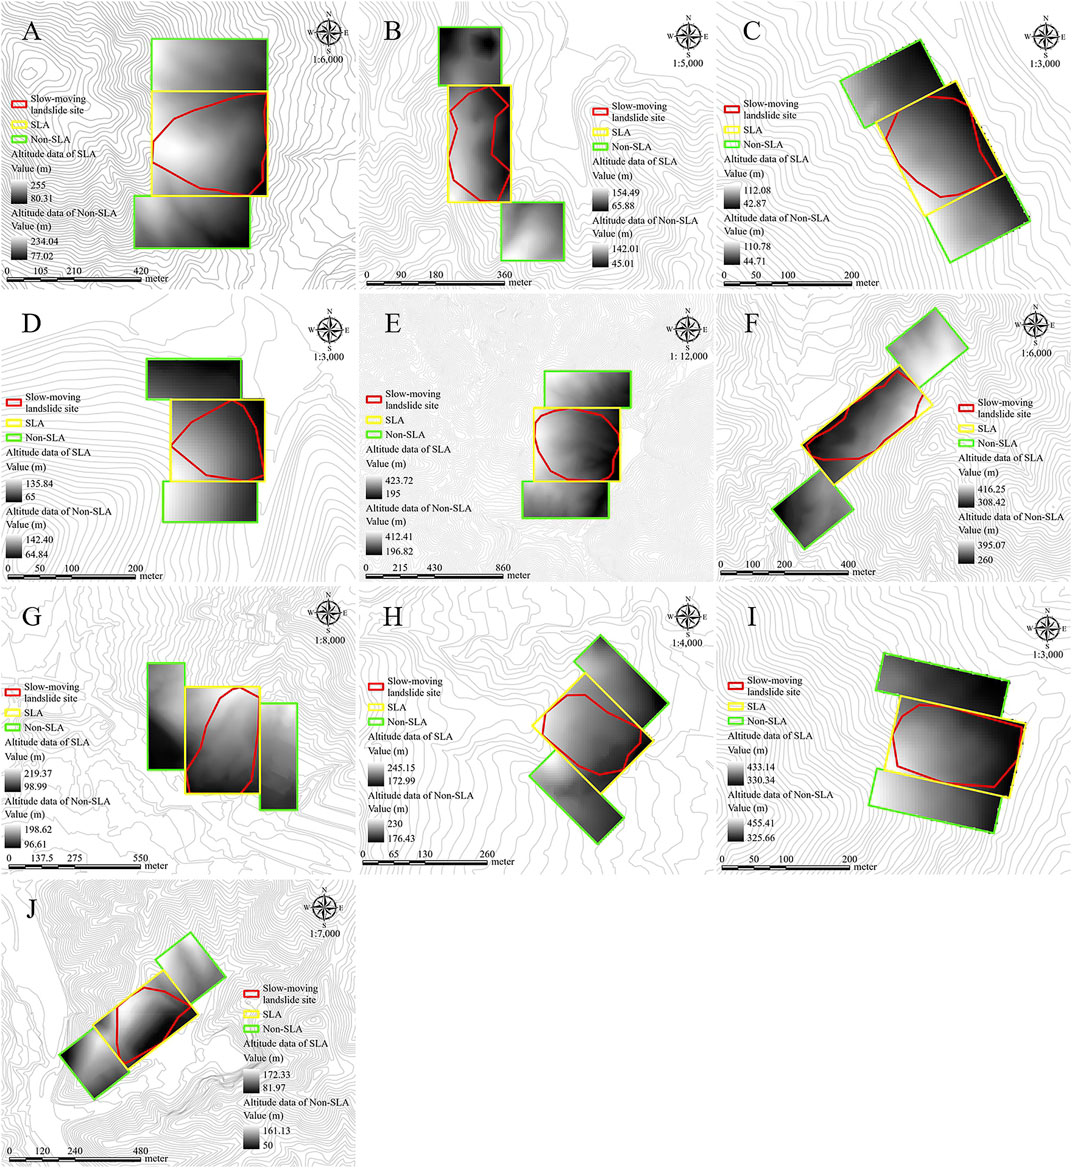
FIGURE 2. Determination of slow-moving landslide sites, SLAs, and non-SLAs, including altitude maps. (A) = site no. 1, (B) = site no. 2, (C) = site no. 3, (D) = site no. 4, (E) = site no. 5, (F) = site no. 6, (G) = site no. 7, (H) = site no. 8, (I) = site no. 9, and (J) = site no. 10.
2.3 Overlap analysis of the landslide hazard map and slow-moving landslide site
We overlapped the landslide hazard map (1:25,000; provided byKorea Forest Service; compiled in 2019) and the slow-moving landslide site boundary (n = 10) to analyze the differences. The landslide hazard map was clipped using the slow-moving landslide site boundary for the overlap analysis, and the area by each grade was calculated. The landslide hazard map comprised grid data with a 10 m × 10 m spatial resolution. Therefore, each area was calculated based on the number of graded cells clipped on the landslide hazard map.
2.4 SLA and Non-SLA altitude and slope analysis
We used ArcMap 10.8 and a digital topographic map (1:5,000) provided by the National Geographic Information Institute (Suwon, South Korea) to perform GIS analysis for determining the causes of slow-moving landslides. Altitude and slope differences between SLAs and non-SLAs were analyzed by generating a 5 m × 5 m DEM and slope map. The boundaries of each SLA and non-SLA in each study site were used to extract the altitude and slope data. Kolmogorov–Smirnov normality tests (Jeong, 2013) were performed to determine the altitude and slope differences between SLAs and non-SLAs. This test was followed by a non-parametric Mann–Whitney U test (Kim et al., 2018). Owing to the statistical reliability problems of the parametric test (t-test) of non-normally distributed data, a non-parametric test was performed.
We analyzed and compared the slopes of SLAs and non-SLAs to determine slope characteristics, which are expected to be one of the critical factors affecting slow-moving landslides on a portion of a mountain slope. The area data generated for SLA and non-SLA slopes were grouped into 5° intervals to analyze the differences in area. Kolmogorov–Smirnov and the non-parametric Kruskal–Wallis tests (Kim et al., 2018) were used to evaluate differences. The differences between SLA and non-SLA groups were ranked and assessed post hoc using Duncan’s multiple range test for non-parametric testing. The post hoc test of non-normally distributed data was performed after generating ranking data from the raw data (Woo, 2010).
Meanwhile, this study focused on locations where slow-moving landslides had caused human or material damage in mountainous areas near human settlements or social infrastructure; we could not secure many samples. In other words, we had to perform the analysis using samples more minor than the general minimum sample size required for the data to be statistically normally distributed (df ≥ 30). To address this limitation, we performed a normality test on the sample data before each analysis to confirm that it was not normally distributed. We then used non-parametric tests to verify the statistical significance of the data, as these tests do not require the data to be normally distributed. Statistical analyses were performed using SPSS Ver. 21 (IBM SPSS, Armonk, NY, United States), with a significance level of p < 0.05.
2.5 Waterway analysis
We analyzed the waterways using the Arc Hydro Tools in ArcMap. Arc Hydro is a GIS tool that is used to analyze topographic and hydrological factors (You et al., 2012). The Arc Hydro Model offers network tools for establishing a spatial database based on vector data. The network tools provide various functions, such as generating the upstream-to-downstream streamflow networks, nodes (river intersections), and reaches (linear watersheds linked to nodes) (Kim et al., 2004). Based on the principle that water naturally flows from high-to low-altitude areas, the DEM can be used to determine the flow direction in a watershed. Arc Hydro Tools can be used to calculate water flow, mountain slope, and total rainfall in each region, and the numerical data can be used to analyze the stream basin (Kim et al., 2012).
According to Jeon (2011), the cause of slow-moving landslides is primarily affected by the groundwater level, as opposed to landslides, which are considerably more affected by the type or intensity of rainfall than by the groundwater level. Additionally, indented mountain areas are susceptible to slow-moving landslides because of the ease of groundwater inflow during rainfall (Seo et al., 2008; Lee et al., 2019). Despite the importance of waterways created in mountainous areas by rainfall to the occurrence of slow-moving landslides, research has yet to be conducted on this topic. Therefore, we verified the roles of waterways as slow-moving landslide-triggering factors through a comparative analysis between SLAs and non-SLAs.
After estimating the direction of the waterways and rainfall catchments in SLAs and non-SLAs, we generated watersheds using a DEM created from a digital topographic map. The generated watersheds were used to delineate the waterways, and each waterway was extracted (An Overview of the Hydrology Toolset, 2023; https://resources.arcgis.com/en/help/main/10.2/index.html#/An_overview_of_the_Hydrology_tools/009z0000004w000000). The differences in waterways between SLAs and non-SLAs were determined using Shapiro–Wilk normality test (for waterway length) followed by the non-parametric Mann–Whitney U test. Shapiro–Wilk test was developed to test the normality of a limited sample size (less than 50 cases).
3 Results and discussion
3.1 Landslide hazard map and slow-moving landslide site overlap
In Figure 2, the red polygons represent the boundaries of the slow-moving landslide sites, and an overlap analysis with the landslide hazard map was performed using these polygons. In addition, yellow and green polygons represent SLAs and non-SLAs, respectively, which were to analyze differences in altitude, slope, and waterway (Figure 2).
The landslide hazard map used in the overlap analysis is a thematic map created using the past total landslide occurrence information in South Korea (n = 2,000) and a logistic regression analysis to assign weights to nine factors, namely, forest type, diameter class, slope degree, slope aspect, slope length, slope curvature, parent rock, soil depth, and topographical wetness index, and distinguish landslide occurrence probabilities according to five grades: very high (Grade 1), high (Grade 2), low (Grade 3), significantly low (Grade 4), and very low (Grade 5) (Landslide Information System: About Landslide Hazard Map, 2023; https://sansatai.forest.go.kr). The landslide hazard map and slow-moving landslide site boundaries were then overlapped to compare the differences between landslides and slow-moving landslides.
The proportion of land area occupied by slow-moving landslide sites (n = 10) on the landslide hazard map was 34% for Grade 3, 21% for Grade 2, and 20% for Grade 4. Regions that did not fall within the graded area accounted for 8.5% of the total area. Grade 3 accounted for ≥50% of the slow-moving landslide sites in sites 2 and 7, whereas Grade 5 accounted for ≥90% in site 3 (Table 1). In conclusion, we found that slow-moving landslides occurred in regions with low-hazard grades or regions that did not fall within the graded area (non-hazard areas) on the landslide hazard map. While also considering multiple regions that were outside the graded area, Park et al. (2022) showed that a slow-moving landslide site corresponding to Grades 3–5 was the largest on the landslide hazard map, and this finding is consistent with our results.
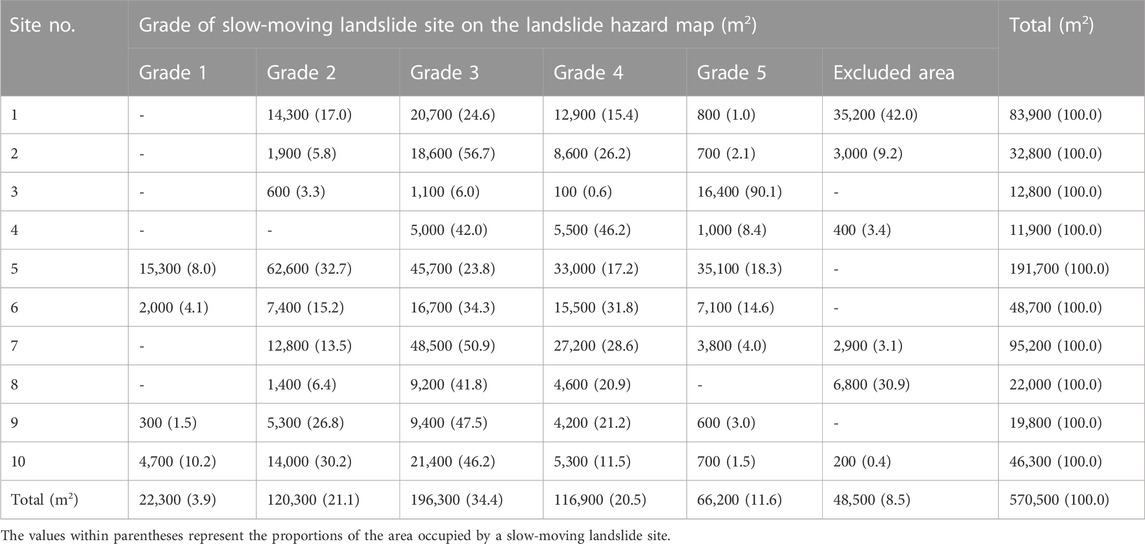
TABLE 1. Overlap results of the landslide hazard map and slow-moving landslide sites.
Landslide hazard maps are helpful indicators of landslide hazard areas, but they have limitations in predicting slow-moving landslide hazards. Landslides and slow-moving landslides are both disasters that cause ground collapse, but their causes are known to be different. Landslides are often caused by natural factors such as heavy rain or earthquakes, mainly on steep slopes (Lee et al., 2021). On the other hand, Slow-moving landslides are often caused by excessive soil extraction (artificial forest development) (Choi et al., 2021) or rising groundwater levels (Kim et al., 2017; Lee et al., 2019) and occur in areas with relatively gentle slopes (National Institute of Forest Science, 2021). Our research results show that many slow-moving landslide sites are located on the landslide hazard map in low-hazard or non-hazard areas. This result confirms that slow-moving landslides are caused by factors different from those that cause landslides. The differences between slow-moving landslides and landslides can also be confirmed by comparing the characteristics and phenomena of their causative factors, as reported by the National Institute of Forest Science in South Korea (Lee et al., 2022; Table 2).
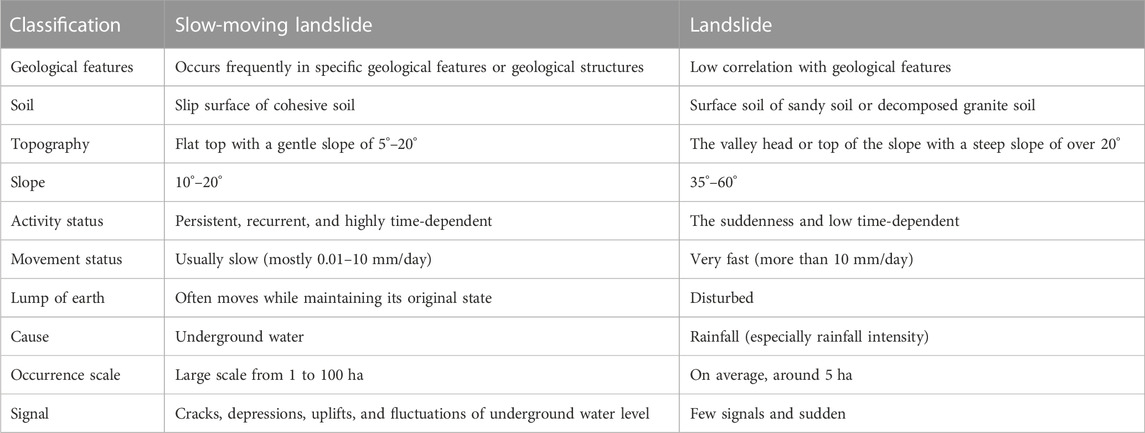
TABLE 2. Comparison of the triggering factor characteristics and phenomena between slow-moving landslides and landslides in South Korea.
Slow-moving landslides in South Korea wereconsidered a type of landslide; however, slow-moving landslides are characterized by a gradual movement of the soil stratum, whereas landslides are a type of superficial stratum collapse followed by rapid, often large-scale, mountain erosion (Woo et al., 1996; Jau et al., 2000). Given the damage caused by slow-moving landslides, they should be regarded as distinct phenomena in order to establish a national slow-moving landslide hazard map with similar predictive capabilities as landslide hazard maps.
3.2 Differences in altitude
We generated altitude data for the SLAs and non-SLAs (See Figure 2) to analyze the differences between areas. The average altitude was 213.9 m in SLAs and 209.0 m in non-SLAs. The results of Kolmogorov–Smirnov normality test showed that the altitude data for the two regions were not normally distributed (Table 3).

TABLE 3. Normality test results for altitude data of SLAs and non-SLAs.
The non-parametric Mann–Whitney U test showed that the altitude of SLAs and non-SLAs differed significantly (p < 0.001; Table 4). Therefore, slow-moving landslides occurred at relatively higher altitudes than those in the surrounding mountains.
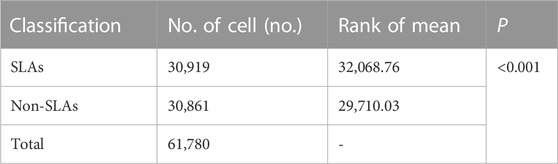
TABLE 4. Non-parametric Mann–Whitney U test results for altitude differences between SLAs and non-SLAs.
It was determined that mountain slopes with relatively low altitudes collect a lot of surface water due to rainfall or heavy rain, and this surface water infiltrates underground again, raising the groundwater level on the slopes (Kim et al., 2017; Lee et al., 2019). Rising groundwater levels increase ground pressure (Agliardi et al., 2020; Tian et al., 2023; Yu et al., 2023; Zhang et al., 2023), causing slow-moving landslides. These results suggest that the altitude characteristics of mountain slopes should be considered when predicting and preventing slow-moving landslides.
3.3 Differences in slope
Slope data were generated for the SLAs (yellow polygons) and non-SLAs (green polygons) (Figure 3) and analyzed to determine the differences between areas.
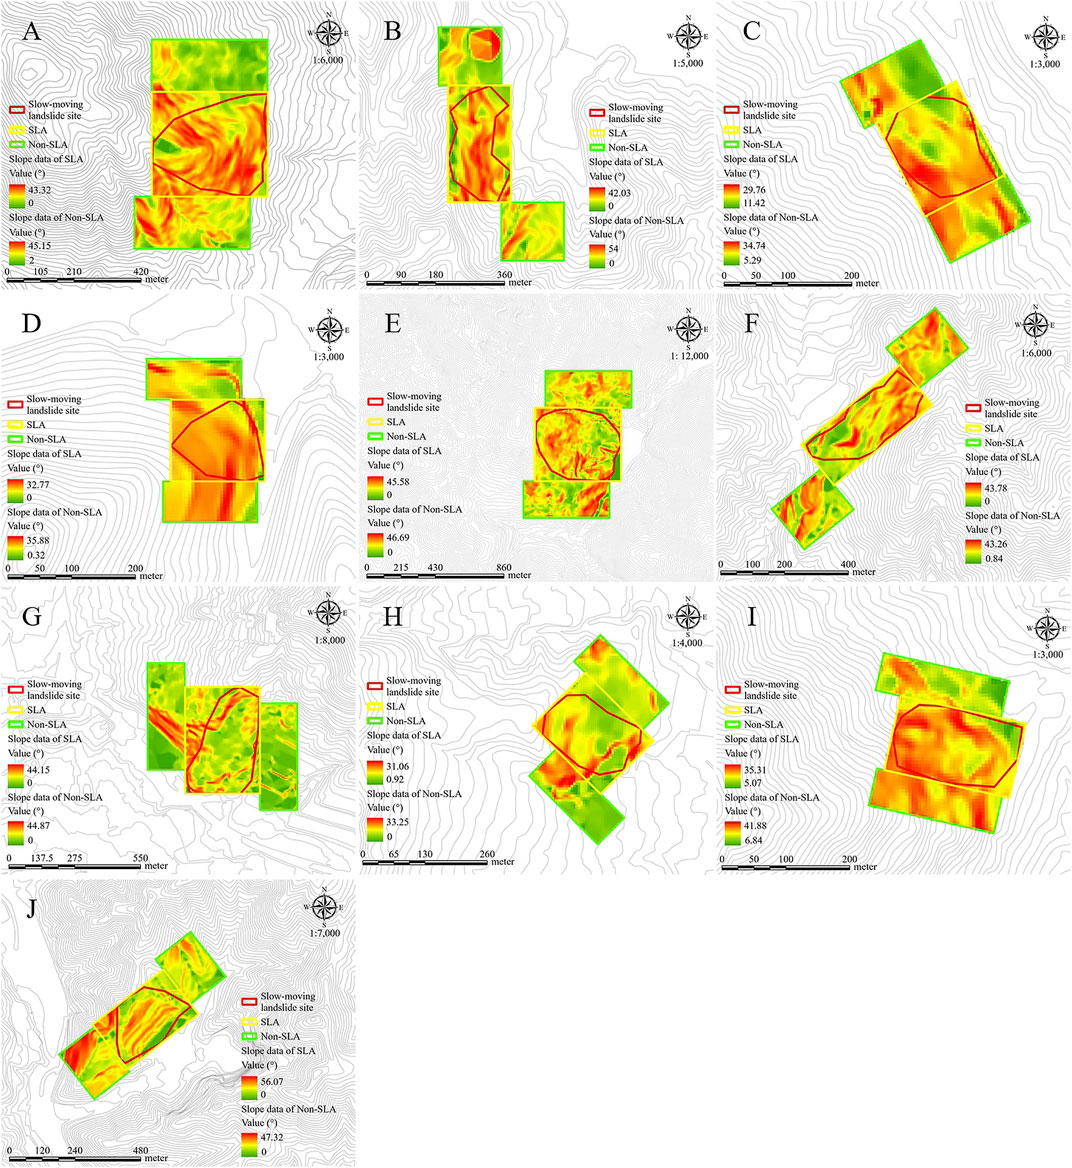
FIGURE 3. Slope maps of SLAs and non-SLAs. The panel labels correspond to the site numbers provided in Figure 2.
The average SLA and non-SLA slopes were 22.1° and 21.1°, respectively. The results of Kolmogorov–Smirnov test showed that the slope data were not normally distributed (Table 5).

TABLE 5. Normality test results for the slope data of SLAs and non-SLAs.
The non-parametric Mann–Whitney U test showed that the slope differed significantly between SLAs and non-SLAs (p < 0.001; Table 6). Therefore, slow-moving landslides occurred in areas with steeper slopes than those in the surrounding mountains.
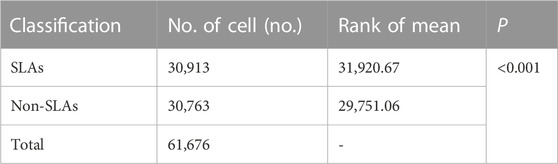
TABLE 6. Non-parametric Mann–Whitney U test results for slope differences between SLAs and non-SLAs.
These results suggest that slope characteristics must be considered when predicting slow-moving landslides in mountain areas. We must not overlook the fact that artificial factors such as damage to mountain areas or groundwater development can affect the slope of stable mountain areas, increasing the risk of slow-moving landslides.
We analyzed the slope characteristics of SLAs and non-SLAs based on area data. Kolmogorov–Smirnov normality test showed that the slope area data were not normally distributed (Table 7).

TABLE 7. Normality test results for the slope area data of SLAs and non-SLAs.
The results of the non-parametric Kruskal–Wallis test showed that the area for each slope differed significantly in the SLAs (p < 0.001). An analysis of variance (ANOVA) was used to assess the differences between slope groups based on the ranking data of the area of each slope, and the results showed that the groups differed significantly (p < 0.001). In the post hoc analysis, the 45° group displayed a low rank, whereas the 25° group presented a high rank (Table 8). Therefore, slow-moving landslides occurred in vast areas with 21°–25° slopes.

TABLE 8. Differences in the area occupied by slope groups in SLAs.
Jeon (2011) showed that slow-moving landslides typically occurred on gentle slopes of 5°–20°, and Park et al. (2019) claimed that the average slope of slow-moving landslide occurrence areas was 23.8°. In the present study, the largest area of slow-moving landslide occurrence was found on 21°–25° slopes. Research in Japan and South Korea has solely relied on a few events to establish the range of the slope factor in the assessment of slopes as triggering factors of previous slow-moving landslides. However, because of the difference between the results of this study and those of previous studies, the range of the slope factor should be re-established.
The area for each slope differed significantly in the non-SLAs (p < 0.001). The ANOVA based on the ranking data of slope area showed that the slope groups differed significantly (p < 0.001). In particular, the 50° group displayed a low rank, whereas the 25° group presented a high rank (Table 9).
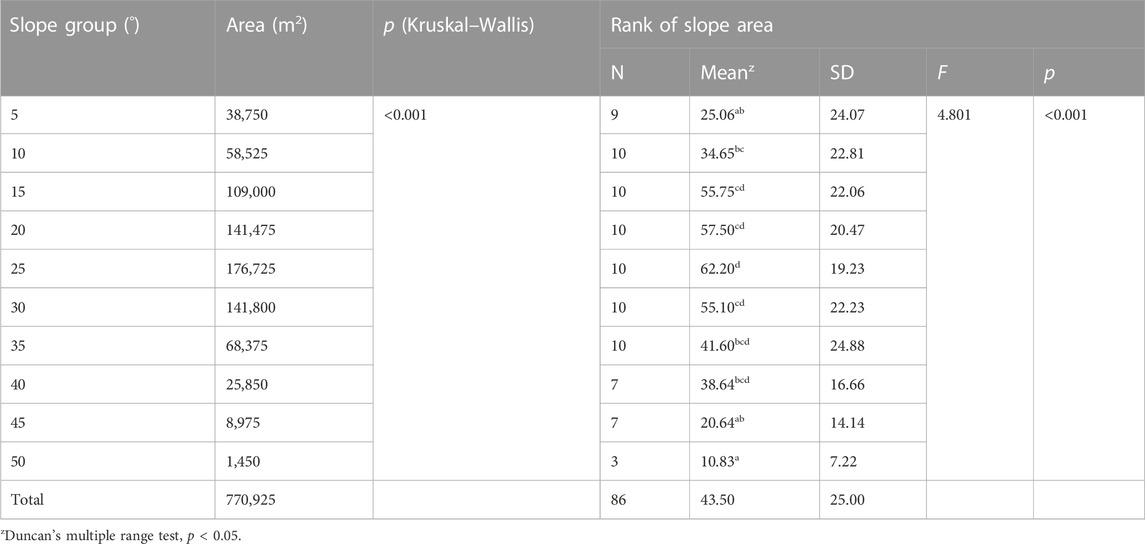
TABLE 9. Differences in the areas of slope groups in non-SLAs.
Analysis of the slope area difference between the SLAs and non-SLAs revealed that the 25° group had the largest area. This finding indicated that slow-moving landslides did not occur in non-SLAs, despite a sufficiently high probability of their occurrence in the future. Slow-moving landslides are not necessarily isolated events; they can also be continuous and recurrent, which necessitates the long-term analysis and management of slow-moving landslide sites and their surroundings. Site 1 is a critical case in this study. This region reportedly experienced a slow-moving landslide in August 2002. However, four past instances of slow-moving landslides widened the restoration area and caused considerable loss of life and property damage (Park et al., 2003a; Park et al., 2003b; Park et al., 2004; Park, 2015).
3.4 Differences in waterway characteristics
Waterway data were generated for the SLAs (blue lines) and non-SLAs (pink lines) (Figure 4), and the differences in waterway length between areas were analyzed using the Arc Hydro Tools. Shapiro–Wilk normality test showed that the waterway data were not normally distributed (Table 10).
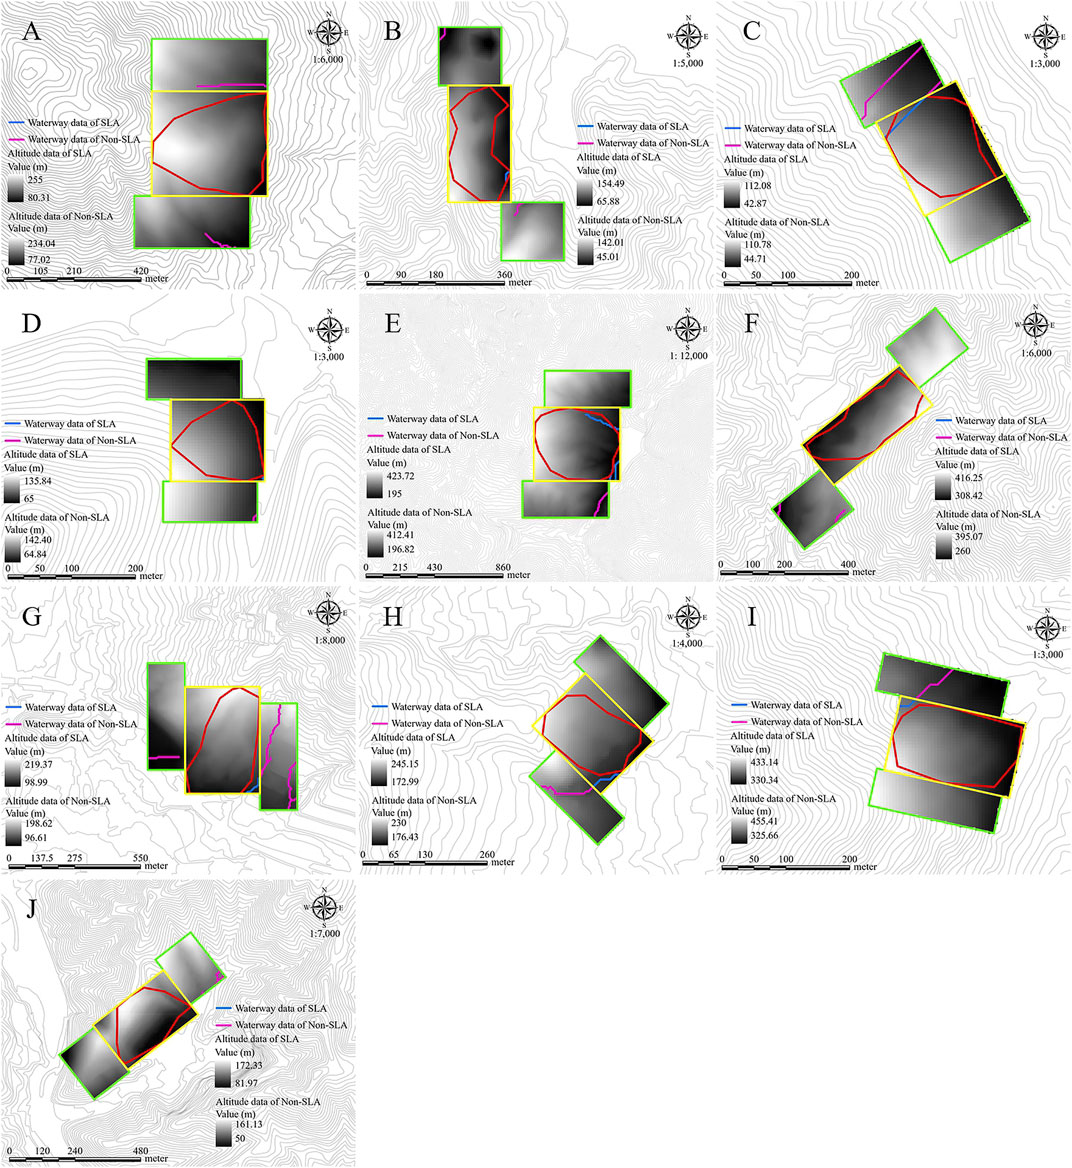
FIGURE 4. Waterway maps of SLAs and non-SLAs. The panel labels correspond to the site numbers provided in Figure 2.

TABLE 10. Normality test results for waterway data of SLAs and non-SLAs.
The non-parametric Mann–Whitney U test showed that the average rank of SLA waterway length was 7.3 (average 85.2 m) and that of non-SLA waterway length was 13.7 (average 205.4 m), indicating that non-SLA waterways were longer (p < 0.05; Table 11).
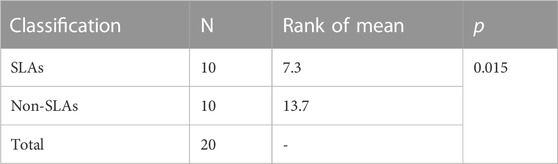
TABLE 11. Non-parametric Mann–Whitney U test results for differences in waterway length between SLAs and non-SLAs.
Based on our findings, we determined that the hazard of slow-moving landslides is high in the inner area where a long waterway is formed around the slope of a mountainous area. In conclusion, groundwater-related factors (Kim et al., 2017; Lee et al., 2019), as well as novel slow-moving landslide-triggering factors, such as waterway characteristics, are essential for national-level slow-moving landslide vulnerability assessments. Meanwhile, this study used GIS to focus on the length of waterways created within mountainous areas. However, there is a need to further develop the characteristics of waterway factors by comprehensively analyzing not only the length of the created waterway but also factors such as the width and depth of the waterway. In addition, the results of this research methodology can be used to predict the occurrence of gully erosion through local comparison.
Slow-moving landslides can be caused by various factors, including the altitude, slope, and waterway characteristics in this research and the geological features of mountain slopes, rainfall, groundwater, reservoir water level, and the composition of forests, as confirmed by previous studies. Before comprehensively analyzing the impact of these various factors, we first analyzed the differences between SLAs and non-SLAs in terms of topographic characteristics such as altitude and slope and waterways generated by topographic features and rainfall. And we confirmed that these differences were statistically significant. This suggests that altitude, slope, and waterway characteristics are still characteristic factors causing slow-moving landslides. However, it is undeniable that comprehensive research that considers not only altitude, slope, and waterways but also the geological characteristics of mountain slopes, the composition of forests, land cover, as well as meteorological factors such as drought, rainfall, and snowfall, is necessary for predicting the hazard of slow-moving landslides. This will allow us to quickly predict, preemptively manage, and prepare preventive measures in areas in danger of slow-moving landslides.
4 Conclusion
Slow-moving landslides are caused by a combination of internal and external factors. At times, slow-moving landslides can accelerate rapidly and collapse catastrophically (Lacroix et al., 2020). In contrast to landslides, slow-moving landslides, which were not actively investigated until recently, require further research. The development of an early warning system at the national level might enable us to minimize damage to social infrastructure and local communities caused by slow-moving landslides.
Slow-moving landslides can cause damage to a wide range of infrastructure, including forests, agricultural fields, roads, and buildings, and can also cause fatalities. Therefore, research on the factors causing slow-moving landslides is essential for predicting the hazard of slow-moving landslides and preparing preventive measures. Accordingly, we scientifically verified the topographic triggers of slow-moving landslides in this study and explored a new trigger factor called waterway. This study is expected to help researchers narrow the scope of verification for the many factors that cause natural disasters in mountain areas, such as slow-moving landslides.
In this study, GIS was used to verify the differences between landslide and slow-moving landslide occurrences by overlapping a landslide hazard map and slow-moving landslide sites. SLAs and non-SLAs were designated based on slow-moving landslide site boundaries to compare their altitude, slope, and waterway characteristic differences.
Grade 3 slow-moving landslide sites accounted for the largest area on the landslide hazard map, even when non-hazard areas were considered. Slow-moving landslide occurrences clearly differed from landslides, emphasizing the need for a distinct national slow-moving landslide hazard information system. In a comparative analysis of the altitude and slope of SLAs and non-SLAs, the SLAs were found to have higher altitudes and steeper slopes than the non-SLAs. The 25° (21°–25°) group comprised the largest SLA and non-SLA areas. This result suggests that slow-moving landslides are likely to occur in the surrounding non-SLAs. We analyzed the differences in slope area for the SLAs and non-SLAs and discovered that ≥35° slopes, which were associated with the highest number of landslides, had the lowest occurrence rate in SLAs. Waterways created by precipitation and torrential rains were longer in non-SLAs than in SLAs. Therefore, waterways could be a novel triggering factor for slow-moving landslides. The generated water could seep into the ground and converge in a certain location, increasing the hazard of slow-moving landslides. Additional research is needed to investigate the impact of waterways on groundwater cycles and slow-moving landslide hazards.
By scientifically analyzing the characteristics of slow-moving landslide-causing factors in this study, we can better understand their causes and develop technology to predict them. In particular, the factors in this study can be used to construct a slow-moving landslide hazard prediction model to identify areas in danger of slow-moving landslides. This is expected to lead to more accurate predictions of slow-moving landslide hazards by establishing a national slow-moving landslide hazard information system, enabling effective damage prevention measures to be prepared.
The Korea Forest Service aims to develop a slow-moving landslide hazard map by 2024. To promote the widespread management of slow-moving landslides and reduce fatalities and property damage, regions with topographies similar to South Korea, such as China and Japan, would benefit from slow-moving landslide hazard maps and information systems that incorporate various known and novel factors, such as the geology and topography of mountainous areas as well as altitude, slope, and waterway characteristics. Based on the findings of this study, future studies should investigate the factors that cause slow-moving landslides, such as maximum slope and area or volume of waterways. At this point, by assigning the shapes of SLAs and non-SLAs to various forms, such as circles or squares, it is possible to establish the reliability of trigger factors by comparing them. In addition, a study on the geology or topographical characteristics (factors used to create a landslide hazard map) of slow-moving landslide sites should be conducted, which was not covered in this study. For the findings of this study to be universally applicable, further information on slow-moving landslide sites should be obtained and analyzed in the future and compared with the results of this study. In addition, weights derived from correlation or regression analyses between factors should be applied to each factor in order to develop a reliable national slow-moving landslide hazard information system and map.
Data availability statement
The original contributions presented in the study are included in the article/Supplementary material, further inquiries can be directed to the corresponding author.
Author contributions
G-MT: Conceptualization, Data curation, Formal Analysis, Methodology, Resources, Software, Validation, Visualization, Writing–original draft, Writing–review and editing. J-HP: Conceptualization, Funding acquisition, Investigation, Project administration, Resources, Supervision, Validation, Writing–review and editing. C-KL: Conceptualization, Validation, Writing–review and editing. HK: Data curation, Formal Analysis, Methodology, Resources, Software, Supervision, Validation, Visualization, Writing–original draft, Writing–review and editing, Conceptualization.
Funding
The author(s) declare financial support was received for the research, authorship, and/or publication of this article. This study was conducted with the support of the R&D Program for Forest Science Technology (Project No. 2021347B10-2123-CD01) funded by the Korea Forest Service (Korea Forestry Promotion Institute, Seoul, South Korea).
Conflict of interest
The authors declare that the research was conducted in the absence of any commercial or financial relationships that could be construed as a potential conflict of interest.
Publisher’s note
All claims expressed in this article are solely those of the authors and do not necessarily represent those of their affiliated organizations, or those of the publisher, the editors and the reviewers. Any product that may be evaluated in this article, or claim that may be made by its manufacturer, is not guaranteed or endorsed by the publisher.
References
Agliardi, F., Scuderi, M. M., Fusi, N., and Collettini, C. (2020). Slow-to-fast transition of giant creeping rockslides modulated by undrained loading in basal shear zones. Nat. Commun. 11, 1352. doi:10.1038/s41467-020-15093-3
An Overview of the Hydrology Toolset (2023). An overview of the Hydrology toolset. Available at: https://resources.arcgis.com/en/help/main/10.2/index.html#/An_overview_of_the_Hydrology_tools/009z0000004w000000 (Accessed August 8, 2023).
Choi, J., Choi, B., Kim, N., Lee, C., Seo, J., and Jeon, B. (2021). Estimation of potential risk and numerical simulations of landslide disaster based on UAV photogrammetry. KSCE J. Civ. Environ. Eng. Res. 41, 675–686. doi:10.12652/Ksce.2021.41.6.0675
Choi, J., Eom, K., Jeon, K., and Yoon, Y. (2019). Monitoring ground movements for deep seated landslide risk areas during an earthquake episode Regular Conferences of Korean Society of Civil Engineers 2019, 960–961.
Das, G., and Lepcha, K. (2019). Application of logistic regression (LR) and frequency ratio (FR) models for landslide susceptibility mapping in Relli Khola River Basin of Darjeeling Himalaya, India. SN Appl. Sci. 1, 1453. doi:10.1007/s42452-019-1499-8
Habumugisha, J. M., Chen, N., Rahman, M., Islam, M. M., Ahmad, H., Elbeltagi, A., et al. (2022). Landslide susceptibility mapping with deep learning algorithms. Sustainability 14, 1734. doi:10.3390/su14031734
Ham, D., and Hwang, S. (2014). Review of landslide forecast standard suitability by analysing landslide-inducing rainfall. J. Korean Soc. Hazard Mitig. 14, 299–310. doi:10.9798/KOSHAM.2014.14.3.299
Highland, L. M., and Bobrowsky, P. (2008). The landslide handbook-A guide to understanding landslides. Reston, Virginia: U.S. Geological Survey Circular, 1325, 4–26.
Jau, J., Park, S., Son, D., and Joo, S. (2000). The effects of geological and topographical features on landslide and land-creep. J. Korean Soc. For. Sci. 89, 323–334.
Jeon, B., and Lee, S. (2019). A study on the effect of collector well on the landcreep slope. J. Eng. Geol. 29, 123–136. doi:10.9720/kseg.2019.2.123
Jeong, J. (2013). SPSS statistics descriptive statistics and correlation analysis. 12th ed. Seoul South Korea: Data Solution, 29–39.
Kang, X., Wang, S., Wu, W., Xu, G., Zhao, J., and Liu, F. (2022). Soil-water interaction affecting a deep-seated landslide: from field monitoring to experimental analysis. Bull. Eng. Geol. Environ. 81, 82. doi:10.1007/s10064-021-02556-0
Kim, H., Kim, M., Lee, M., Park, Y., and Kwak, J. (2017). Correlation of deep landslide occurrence and variation of groundwater level. J. Korea Soc. For. Eng. 15, 1–12.
Kim, J., Kim, B., Jeong, H., and Shin, S. (2018). Environmental statistics and data analysis. Seoul, South Korea: Hannarae Publishing Co., 158–173.
Kim, J., Kim, J., Lee, S., Cho, K., and Kim, J. (2021). Interpretation of electrical resistivity tomogram with contents of clay minerals for the land creeping area. J. Eng. Geol. 31, 187–197. doi:10.9720/kseg.2021.2.187
Kim, K., Choi, Y., Kim, J., Koh, J. T., Chun, B. J., Bae, C. S., et al. (2004). The promoter of brain-specific angiogenesis inhibitor 1-associated protein 4 drives developmentally targeted transgene expression mainly in adult cerebral cortex and hippocampus. J. Korean Assoc. Geogr. Inf. Stud. 7, 87–94. doi:10.1016/j.febslet.2004.03.106
Kim, K., Kang, M., and Park, J. (2016). Experimental research for collapse of tension crack in land creeping area. Hadong. J. Agric. Life Sci. 50, 11–17. doi:10.14397/jals.2016.50.6.11
Kim, N., Choi, B., Choi, J., and Jeon, B. (2020). Time series analysis of soil creep on cut slopes using unmanned aerial photogrammetry. J. Eng. Geol. 31, 447–456. doi:10.9720/kseg.2020.4.447
Kim, S., Kim, D., and Maeng, S. (2012). A risk analysis of water courses and landslide using contour maps: focusing on Mt. Seonggo in cheonan city. J. Digit. Converg. 10, 289–296.
Korea Forest Service (2021). National landslide prevention plan. Seoul, South Korea: Korea Forest Service, 2–4.
Lacroix, P., Handwerger, A. L., and Bièvre, G. (2020). Life and death of slow-moving landslides. Nat. Rev. Earth Environ. 1, 404–419. doi:10.1038/s43017-020-0072-8
Landslide Information System: About Landslide Hazard Map (2023). sansatai. Available at: https://sansatai.forest.go.kr (Accessed August 8, 2023).
Lee, C., Seo, J., Woo, C., and Eu, S. (2022).Development of a novel forest soil sediment disaster damage reduction technology: A focus on slow-moving landslides and earthquake-induced forest soil sediment disasters. Seoul, South Korea: National Institute of Forest Science, 8.
Lee, C., Woo, C., Seo, J., and Eu, S. (2021). Understanding landslides properly. Seoul, South Korea: National Institute of Forest Science, 7–14.
Lee, M., Park, J., and Park, Y. (2019). Analysis of characteristics using geotechnical investigation on the slow-moving landslide in the Pohang-Si area. J. Korean Soc. For. Sci. 108, 233–240. doi:10.14578/jkfs.2019.108.2.233
Lee, S., Kim, J., Kim, K., and Kwon, I. (2020). Delineation of the slip weak zone of land creeping with integrated geophysical methods and slope stability analysis. J. Eng. Geol. 30, 289–302. doi:10.9720/kseg.2020.3.289
National Institute of Forest Science (2021). 15 things needed to be known about land creeps in a Nutshell. Seoul, South Korea: National Institute of Forest Science, 4–6.
Park, J. (2015). Analysis on the characteristics of the landslide: with a special reference on geo-topographical characteristics. J. Korean Soc. For. Sci. 104, 588–597. doi:10.14578/jkfs.2015.104.4.588
Park, J., Choi, K., Lee, S., Ma, H., Lee, J., and Woo, B. (2003a). Analysis on the characteristics of the landslide in nasamri (I): with a special reference on geo-topographical characteristics. J. Korean Soc. For. Sci. 92, 246–253.
Park, J., Choi, K., Lee, S., Ma, H., Lee, J., and Woo, B. (2003b). Analysis on the characteristics of the landslide in nasamri (II): with a special reference on cause of landslide. J. Korean Soc. For. Sci. 92, 526–535.
Park, J., Kim, S., Lee, S., and Kang, H. (2022). Study on the characteristics of the slow-moving landslide (land creep) in the Sanji Valley of Jinju. J. Korean Soc. For. Sci. 111, 115–124. doi:10.14578/jkfs.2022.111.1.115
Park, J., Lee, S., Choi, K., Ma, H., Lee, J., and Woo, B. (2004). Analysis on the characteristics of the landslide in nasamri (III): with a special reference on stability analysis. J. Korean Soc. For. Sci. 93, 188–197.
Park, J., Ma, H., and Park, S. (2021a). Actual conditions on the land creep areas by the analysis of satellite imagery. J. Agric. Life Sci. 55, 57–64. doi:10.14397/jals.2021.55.1.57
Park, J., and Park, S. (2018). Analysis of instances of characteristics land creep on the mine area in Korea. J. Korean Soc. For. Sci. 107, 393–401. doi:10.14578/jkfs.2018.107.4.393
Park, J., Park, S., Davidson, E., and De Vera, M. A. (2020). Insights on mental health when living with rheumatoid arthritis: A descriptive qualitative study of threads on the reddit website. J. Korean Soc. For. Sci. 109, 62–71. doi:10.1186/s41927-020-00163-2
Park, J., Park, S., Kang, M., and Im, H. (2021b). Analysis on scale and geological characteristics-based influence factors in land creep. J. Agric. Life Sci. 55, 37–51. doi:10.14397/jals.2021.55.5.37
Park, J., Seo, J., and Lee, C. (2019). Analysis of GIS for characteristics on the slow-moving landslide: with a special reference on slope and grade of landslide. J. Korean Soc. For. Sci. 108, 311–321. doi:10.14578/jkfs.2019.108.3.311
Preisig, G., Eberhardt, E., Smithyman, M., Alexander, P., and Bonzanigo, L. (2016). Hydromechanical rock mass fatigue in deep-seated landslides accompanying seasonal variations in pore pressures. Rock Mech. Rock Eng. 49, 2333–2351. doi:10.1007/s00603-016-0912-5
Senanayake, A., Fernando, N., Wasana, M., Amaratunga, D., Haigh, R., Malalgoda, C., et al. (2022). Landslide induced displacement and relocation options: A case study of owner driven settings in Sri Lanka. Sustainability 14, 1906. doi:10.3390/su14031906
Seo, Y., Kim, S., and Lee, K. (2008). 3-D slope stability analysis on groundwater level changes in Oksan landslide area. J. Eng. Geol. 18, 167–173.
Shin, H., Kim, M., and Woon, W. (2018). Application of geophysical exploration technique to the identification of the active weak zones in large scale mountainous region. Geophys. Geophys. Explor. 21, 162–170. doi:10.7582/GGE.2018.21.3.162
Stanley, T., and Kirschbaum, D. B. (2017). A heuristic approach to global landslide susceptibility mapping. Nat. Hazards 87, 145–164. doi:10.1007/s11069-017-2757-y
Tian, S., Hu, G., Chen, N., Rahman, M., Ni, H., and Somos-Valenzuela, M. (2023). Effects of tectonic setting and hydraulic properties on silent large-scale landslides: A case study of the zhaobishan landslide, China. Int. J. Disaster Risk Sci. 14, 600–617. doi:10.1007/s13753-023-00502-0
Wang, J., Wang, S., Su, A., Xiang, W., Xiong, C., and Blum, O. (2021). Simulating landslide-induced tsunamis in the yangtze river at the three gorges in China. Acta Geotech. 16, 2487–2503. doi:10.1007/s11440-020-01131-3
Woo, B., Park, J., Choi, H., Jeon, G., and Kim, K. (1996). A study on the characteristics of the landslide in hyuseok-dong (I): topographical characteristics and surface displacement. J. Korean Soc. For. Sci. 85, 565–570.
You, H., Kim, D., and Yang, S. (2012). Development of GIS-based method for estimating and representing stream slopes along the river network. J. Environ. Sci. Int. 21, 725–738. doi:10.5322/JES.2012.21.6.725
Yu, P., Liu, H., Yu, H., Xie, Y., Yu, Y., Zhu, C., et al. (2023). Study on fluid-solid coupling numerical simulation and early warning of weathered granite landslides induced by extreme rainfall. Sustainability 15, 11738. doi:10.3390/su151511738
Keywords: land creep, landslide, slow-moving landslide, triggering factor, waterway
Citation: Tak G-M, Park J-H, Lee C-K and Kim H (2023) Influence of altitude, slope, and waterway characteristics on the occurrence of slow-moving landslides in South Korea. Front. Earth Sci. 11:1276768. doi: 10.3389/feart.2023.1276768
Received: 15 August 2023; Accepted: 26 September 2023;
Published: 09 October 2023.
Edited by:
Chong Xu, University of Ferrara, ItalyReviewed by:
Liye Feng, Ministry of Emergency Management, ChinaZhilu Chang, Nanchang University, China
Ionut Cristi Nicu, Norwegian Institute for Cultural Heritage Research, Norway
Gaetano Robustelli, University of Calabria, Italy
Copyright © 2023 Tak, Park, Lee and Kim. This is an open-access article distributed under the terms of the Creative Commons Attribution License (CC BY). The use, distribution or reproduction in other forums is permitted, provided the original author(s) and the copyright owner(s) are credited and that the original publication in this journal is cited, in accordance with accepted academic practice. No use, distribution or reproduction is permitted which does not comply with these terms.
*Correspondence: Hyun Kim, a2ltaHl1bkBnbnUuYWMua3I=