 Wanrui Hu
 Kai Wu2,3
 Peng Guan
- 1CISPDR Corporation, Wuhan, China
- 2Hubei Shenlong Geological Engineering Investigation Institute Co., Ltd., Wuhan, China
- 3Faculty of Engineering, China University of Geosciences, Wuhan, China
- 4Xinjiang Survey and Design Institute for Water Resources and Hydropower, Engineering Economics Institute, Urumqi, China
- 5Xinjiang Water Conservancy Development and Construction Group Co., Ltd., Urumqi, China
Accurate prediction of crown convergence in Tunnel Boring Machine (TBM) tunnels is critical for ensuring construction safety, optimizing support design, and improving construction efficiency. This study proposes an interpretable machine learning method based on Bayesian optimization (BO) and SHapley Additive exPlanations (SHAP) for predicting crown convergence (CC) in TBM tunnels. Firstly, a dataset comprising 1,501 samples was constructed using tunnel engineering data. Then, six classical ML models, namely, Support Vector Regression, Decision Tree, Random Forest, Light Gradient Boosting Machine (LightGBM), eXtreme Gradient Boosting, and K-nearest neighbors—were developed, and BO was applied to tune the hyperparameters of each model to achieve accurate prediction of CC. Subsequently, the SHAP method was adopted to interpret the LightGBM model, quantifying the contribution of each input feature to the model’s predictions. The results indicate that the LightGBM model achieved the best prediction performance on the test set, with root mean squared error, mean absolute error, mean absolute percentage error, and determination coefficient values of 0.9122 mm, 0.6027 mm, 0.0644, and 0.9636, respectively; the average SHAP values for the six input features of the LightGBM model were ranked as follows: Time (0.1366) > Rock grade (0.0871) > Depth ratio (0.0528) > Still arch (0.0200) > Saturated compressive strength (0.0093) > Rock quality designation (0.0047). Validation using data from a TBM water conveyance tunnel in Xinjiang, China, confirmed the method’s practical utility, positioning it as an effective auxiliary tool for safer and more efficient TBM tunnel construction.
1 Introduction
Tunnel Boring Machines (TBMs) are highly efficient and automated excavation equipment widely used in urban subways, hydraulic engineering, and transportation tunnels (Gao et al., 2021; Fu et al., 2023; Zhang et al., 2024). However, the deformation of surrounding rock during TBM construction remains a critical concern in the engineering community (Mahdevari et al., 2012). Crown convergence (CC) is a key indicator of tunnel stability, and excessive settlement can not only compromise the structural safety of the tunnel but also lead to construction delays and increased costs (Feng et al., 2019). Therefore, accurate prediction of crown convergence in TBM tunnels is crucial for ensuring construction safety, optimizing support design, and improving construction efficiency (Adoko and Wu, 2012).
Traditional methods for predicting tunnel convergence predominantly rely on empirical formulas and numerical simulations. For instance, Arora et al. (Arora and Gutierrez, 2021) presents a visco-elastic-plastic solution for deep circular tunnel under squeezing conditions, which can be used to determine the viscous behavior of tunnel wall convergence with time. Asadollahpour et al. (2014) determined the closure parameters of Panet Equation associated with face advance and time effect of a rock tunnel in six different monitoring stations. Huang et al. (2017) introduces a detailed numerical simulation to reveal the probabilistic response of tunnel convergence in spatial verified soils. Chen et al. (2018) proposed a case study on the stress and deformation characteristics of tunnels induced by close distance earth pressure balance shield under-crossing in sandy soil stratum. Empirical formulas are often based on limited engineering data and may not accurately reflect the deformation behavior of surrounding rock under complex geological conditions (Wang et al., 2021). Numerical simulations, despite their ability to model multi-factor interactions, are constrained by high computational costs and parameter sensitivity, hindering real-time engineering applications (Hu et al., 2024). With the rapid development of machine learning (ML) techniques, data-driven approaches have emerged as effective tools for solving complex engineering problems (Bo et al., 2023). ML methods can learn complex nonlinear relationships from large amounts of historical data, providing more accurate predictions. In recent years, ML methods have been widely applied in underground engineering due to their excellent feature analysis capabilities (Mahmoodzadeh et al., 2021; Ray et al., 2021; Kim et al., 2022; Xu et al., 2022; Zhang et al., 2022).
In the field of tunnel engineering, numerous studies have attempted to predict tunnel convergence using ML methods. For example, Adoko and Wu (2012) used an Adaptive Neuro-Fuzzy Inference System (ANFIS) to predict tunnel convergence, achieving satisfactory results. Mahdevari and Torabi (2012) employed an Artificial Neural Network (ANN) model to predict tunnel deformation, demonstrating that ANN models can achieve high prediction accuracy under complex geological conditions. Pan et al. (2012) combined the Firefly Algorithm (FA) with a Nonlinear Auto-Regressive (NAR) dynamic neural network to construct a dynamic nonlinear model for predicting surrounding rock convergence. Mahmoodzadeh et al. (2022) developed 5 ML models—Deep Neural Network (DNN), Gaussian Process Regression (GPR), K-Nearest Neighbors (KNN), Decision Tree (DT), and Support Vector Regression (SVR)—to accurately predict tunnel convergence. Zhou J. et al. (2023) collected 142 samples of highway tunnel deformation data and constructed six reliable ML models to predict tunnel convergence, using the Jellyfish Search Optimizer (JSO) for hyperparameter tuning. Sheini Dashtgoli et al. (2024) used FLAC 3D to create a dataset of 954 samples from shallow-buried tunnels and developed five tree-based ML algorithms to accurately predict the maximum convergence of unsupported shallow tunnels. An et al. (2024b) collected tunnel convergence data to build a dataset and used KNN, SVR, DT, RF, Extreme Gradient Boosting (XGBoost), Categorical Boosting (CatBoost), and Automated ML models to accurately predict tunnel convergence, and evaluated tunnel stability based on the prediction results in actual tunnel projects.
Despite the progress made in tunnel convergence prediction, several limitations still remain. Firstly, most studies focus solely on model prediction accuracy, neglecting model interpretability. The “black-box” nature of ML models makes their internal decision-making mechanisms difficult to understand, thus limiting their practical application in engineering (Adadi and Berrada, 2018; Naser, 2021). Secondly, many studies rely on limited datasets, which may not fully capture the deformation behavior of surrounding rock under complex geological conditions. Thirdly, the intelligent convergence prediction of TBM tunnels is very limited so far. SHapley Additive exPlanations (SHAP) is an explanation technique for ML models, which has been widely used in tunnel issues, such as explanation of tunnelling induced surface settlement prediction model (Li and Dias, 2024), tunnel squeezing prediction model (Bo et al., 2023), and tunnel convergence prediction model (An et al., 2024b). To address these issues, this study proposes a ML method based on Bayesian Optimization (BO) and SHAP for predicting crown convergence in TBM tunnels considering the successful application of SHAP in tunnel issues. A set of six classical ML models (SVM, DT, RF, LightGBM, XGBoost, and KNN) were adopted for CC prediction in TBM tunnels considering their successful application in tunnel issues (Zhou J. et al., 2023; An et al., 2024b; Guan et al., 2025). At the beginning, six input features were selected from geological, design, and time factors to construct a dataset containing 1,501 samples. Then, BO was adopted to tune the hyperparameters of six classical ML models (SVR, DT, RF, LightGBM, XGBoost, and KNN) to improve their prediction performance. Finally, the SHAP method was used to interpret the optimal model (LightGBM), quantifying the contribution of each input feature to the model’s predictions. The novelties of this research are as follows: (1) It constructs a large-scale dataset with 1,501 samples, covering the deformation behavior of surrounding rock under complex geological conditions, which offers a solid data foundation for model training and testing. (2) It employs six classical ML models (SVR, DT, RF, LightGBM, XGBoost, and KNN) for CC prediction and uses BO to optimize the hyperparameters of each model, thereby improving prediction accuracy and generalization ability. (3) It applies the SHAP method to interpret the optimal model (LightGBM), quantifying the contribution of each input feature to the model’s predictions and enhancing model interpretability. (4) The study validates the proposed method using data from a TBM water conveyance tunnel in Xinjiang, China, demonstrating that the approach can serve as an auxiliary tool for promoting safer and more efficient construction of TBM tunnel projects. This study not only helps engineers better understand the mechanisms of tunnel deformation but also provides a scientific basis for tunnel support design and construction decision-making, enabling safer and more efficient tunnel construction processes.
The remainder of this paper is organized as follows: Section 2 introduces the TBM tunnel crown convergence dataset constructed in this study; Section 3 presents the proposed method for predicting CC; Section 4 provides a detailed analysis of the prediction results; Section 5 displays the application of the proposed method in tunnel engineering; and Section 6 concludes the study and outlines its limitations.
2 Database
The selection of input features has a significant impact on the training effectiveness of ML models (An et al., 2024b). Proper selection of input features can enhance the prediction performance of ML models. In this study, nine input features were selected from geological, design, and time factors, including depth ratio (DR), rock grade (RG), saturated compressive strength (SCS), saturated tensile strength (STS), Rock Quality Designation (RQD), friction angle (FA), cohesion (C), steel arch height (SA), and time (T) since initial support completion. The output of the ML models is the CC of the tunnel. The dataset of this study is available via https://github.com/Unic1124/data.
The depth ratio reflects the relationship between the tunnel depth and diameter. A higher depth ratio indicates more complex stress conditions in the surrounding rock, which can affect tunnel deformation (Zhou J. et al., 2023). The depth ratio is calculated using Equation 1.
where R is depth ratio, H is the depth of the tunnel roof, D is the diameter of the tunnel.
Geological factors (RG, RQD, FA, C, SCS, and STS) directly reflect the integrity, stability, and strength of the surrounding rock, which are decisive factors in tunnel deformation. The lower the RG, the better the engineering properties of the rock mass, and the higher the stability of the tunnel’s surrounding rock, resulting in a relatively lower likelihood of deformation. A higher RQD value implies fewer internal rock fractures, better integrity, and stronger self-stability of the surrounding rock after tunnel excavation, thus limiting the extent of deformation. Greater values of FA and C enhance the rock’s shear strength, improving its overall integrity and stability. Rocks with higher SCS and STS can better withstand various stresses generated during tunnel excavation, reducing the likelihood of deformation. Design factors (DR, SA) influence stress distribution and support effectiveness. The steel arch height reflects the stiffness of the initial support. Higher stiffness leads to better support effects and smaller tunnel deformation. A rational steel arch design can effectively disperse the stress of the surrounding rock and mitigate deformation caused by localized stress concentration (An et al., 2024b). Temporal factor (T) accounts for time-dependent deformation processes. Tunnel deformation is caused by the creep of surrounding rock, especially after the completion of initial support, where the creep effect significantly impacts tunnel stability. Therefore, the time since initial support completion is also an important factor influencing tunnel deformation (Adoko et al., 2013).
Sample data were extracted from tunnel sections of a TBM water conveyance tunnel in Xinjiang, China, to construct a dataset for model training and validation. Feature information was extracted from geological reports, design materials, construction schemes, and monitoring reports to form a dataset of 1,501 samples. This comprehensive dataset captures diverse geological and engineering conditions, ensuring robust model training. The data encompasses a wide range of geological and engineering conditions, reflecting the complex and diverse nature of TBM tunneling environments. It includes various input features as articulated above, which are critical factors influencing tunnel stability and deformation. The quality of the dataset is ensured through rigorous data cleaning and preprocessing steps, removing any inconsistencies or errors that could affect the ML model’s performance. The dataset’s representativeness is further validated by its alignment with the actual geological and engineering characteristics of the tunnel, making it a reliable benchmark for evaluating the predictive models.
Feature selection can avoid data redundancy and reduce the computational load of ML models (An et al., 2024b). Pearson correlation coefficients were calculated for each feature in the dataset using Equation 2 to perform feature selection. A correlation coefficient (COR) greater than 0.6 indicates a strong correlation between two variables. As shown in Figure 1a, the COR values between FA and DR, SCS, STS, RQD, and C were −0.61, 0.85, 0.73, 0.79, and 0.92, respectively, indicating strong correlations between FA and these five variables. The COR values between C and SCS, RQD, and FA were 0.71, 0.82, and 0.93, respectively, suggesting strong correlations between C and these three features. The COR values between STS and SCS and RQD were 0.77 and 0.61, respectively. Therefore, STS, FA, and C were removed from the input features to avoid computational burden caused by data redundancy. After feature selection, the data distribution and correlations of the input and output features are shown in Figures 1b,2, , and the statistical characteristics of the dataset are presented in Table 1.
where x and y are the values of the two variables,
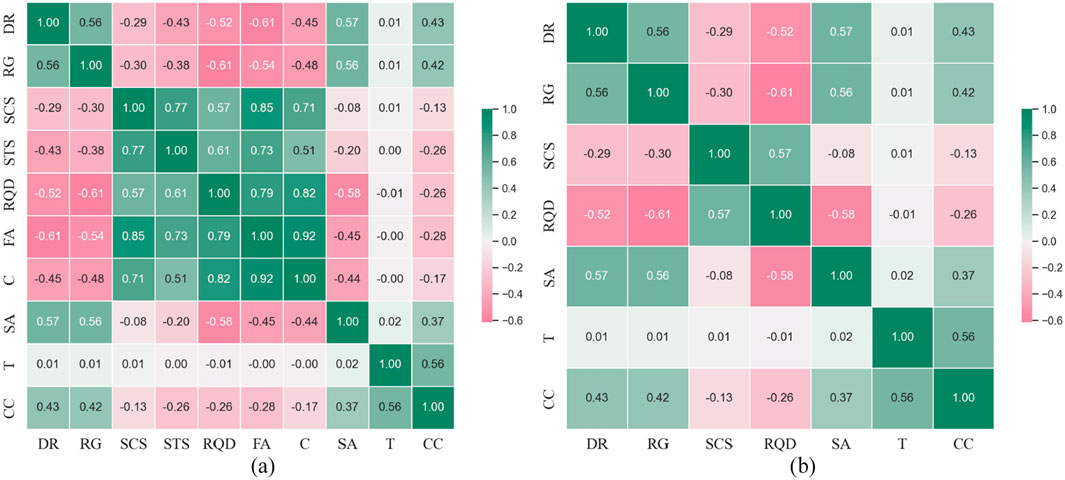
Figure 1. The correlation between the features: (a) before feature screening; (b) after feature screening.
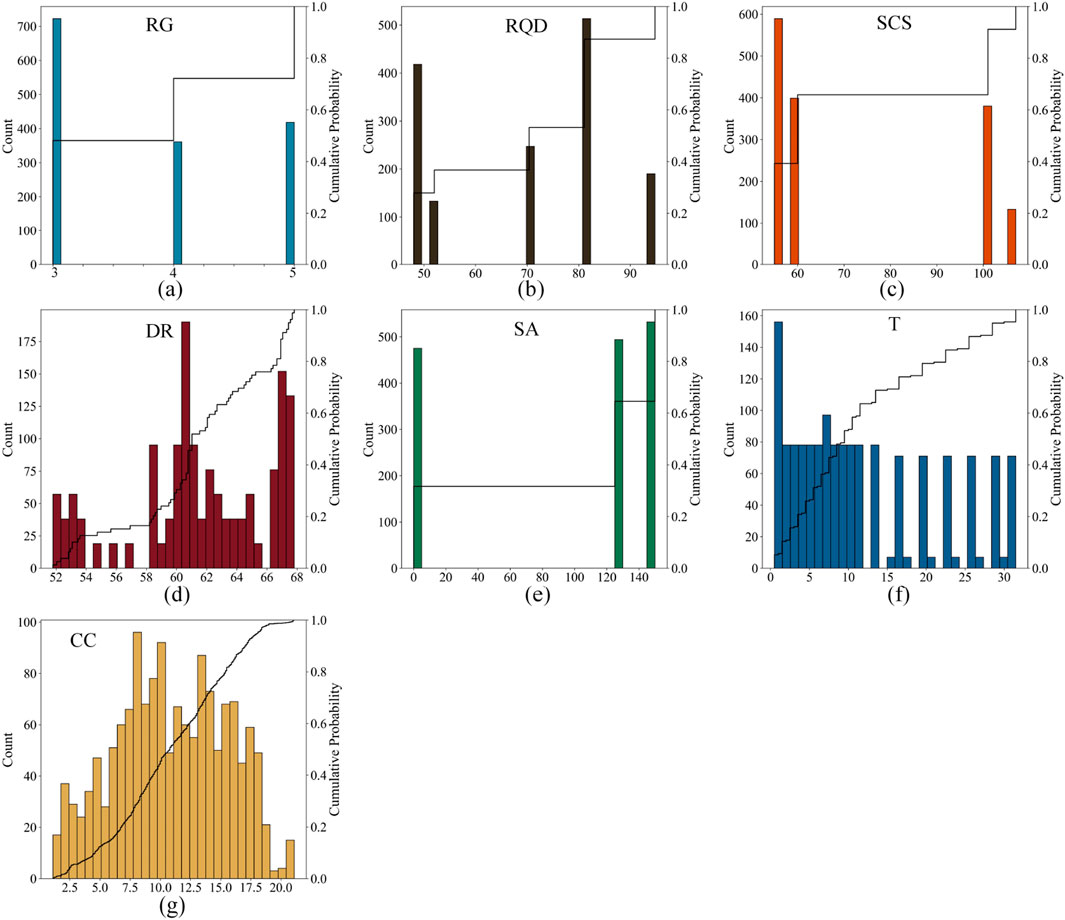
Figure 2. The distribution of the dataset after screening: (a) RG; (b) RQD; (c) SCS; (d) DR; (e) SA; (f) T; (g) CC.
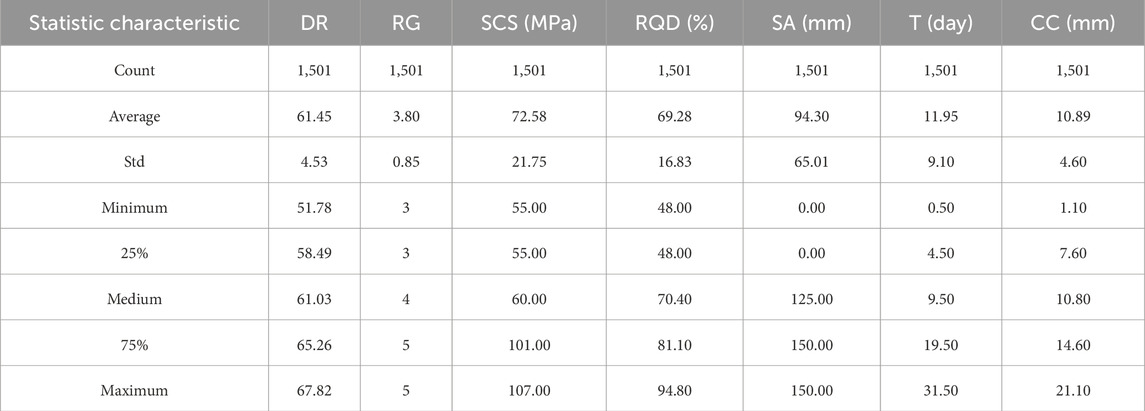
Table 1. The statistic characteristic of the dataset.
3 Methods
In tunnel engineering, predicting the convergence of the tunnel is a complex issue involving the coupling of multiple factors, and traditional mechanical analysis methods often struggle to accurately capture its nonlinear characteristics. In recent years, ML methods, due to their strong data-driven capabilities and advantages in modeling complex relationships, have gradually become effective tools for solving such problems. This study develops six distinct ML models, which are subsequently trained and tested utilizing a dataset pertaining to TBM tunnel crown convergence. The hyperparameters of these ML models are meticulously optimized through the application of BO. Furthermore, the SHAP method is employed to provide interpretability to the models. The comprehensive workflow of this research is visually depicted in Figure 3.
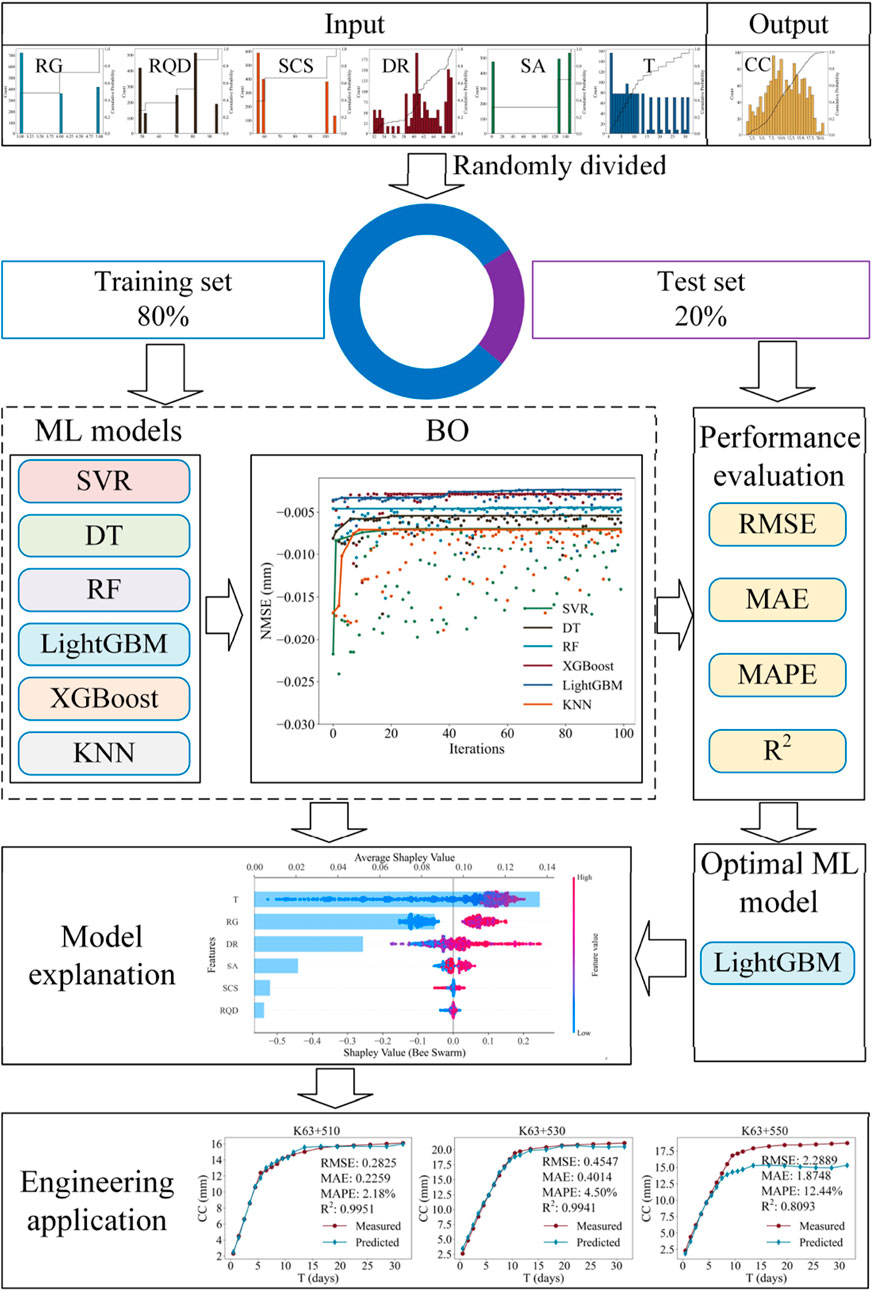
Figure 3. Workflow of the proposed approach.
3.1 Machine learning algorithms
3.1.1 Support Vector Regression
The Support Vector Machine (SVM) emerged from the Statistical Learning Theory proposed by Vapnik and colleagues in the 1990s and stands as a robust supervised learning algorithm (Zhou et al., 2022). Initially conceived for classification tasks, it was subsequently adapted for regression problems through the incorporation of the ε-insensitive loss function, giving rise to Support Vector Regression (SVR). In regression problems, SVR seeks to find the optimal regression function (Equation 3) that minimizes the prediction error (Yin et al., 2023).
where
3.1.2 Decision tree
The DT is a tree-based classification and regression model that is widely used in the fields of ML and data mining (Liu et al., 2022). For regression problems, the objective of the DT is to minimize the MSE for each leaf node. Suppose the input space is partitioned into M regions, denoted as
where
3.1.3 Random Forest
RF is an ensemble learning algorithm based on DTs. By constructing multiple DTs and aggregating their predictions, the overall model achieves high prediction accuracy and stability (Zhao et al., 2024). The work process of RF is depicted in Figure 4. The work process of RF is described by Equation 5.
where T denotes the number of decision trees;
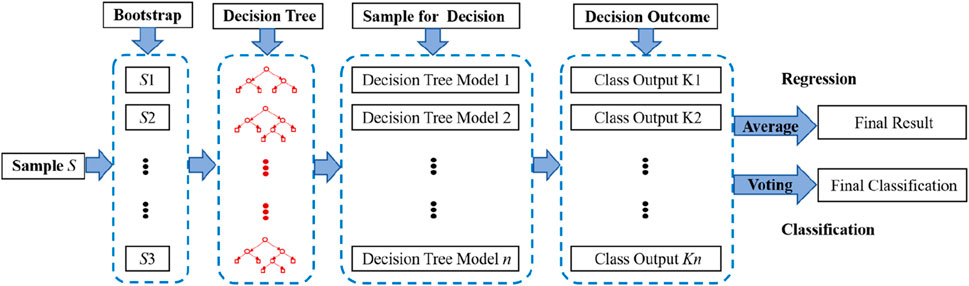
Figure 4. Schematic diagram of the RF
3.1.4 LightGBM
LightGBM is an efficient ML algorithm based on the gradient boosting framework (Bo et al., 2023). By incorporating techniques such as the Histogram algorithm and Gradient-based One-Sided Sampling, it significantly enhances the training speed and memory efficiency of the model while maintaining high prediction accuracy (Ke et al., 2017). The principle of LightGBM is based on Gradient Boosting Decision Trees (GBDT), which aims to achieve fast and accurate predictions on high-dimensional data. GBDT iteratively adds new DTs to progressively reduce the loss value of the objective function, as expressed in Equation 6. LightGBM optimizes Equation 6 to incrementally improve prediction performance, ultimately achieving precise predictions.
where L denotes the objective function, n is the number of samples,
LightGBM employs the Histogram algorithm to discretize continuous feature values into multiple bins. Additionally, the introduction of Gradient-based One-Sided Sampling (GOSS) and Exclusive Feature Bundling (EFB) algorithms addresses the issue of excessive sample and feature counts, further optimizing computational efficiency. These optimization techniques endow LightGBM with significant advantages in handling large-scale datasets, making it well-suited for complex data analysis tasks in tunnel crown settlement prediction.
3.1.5 XGBoost
The principle of XGBoost is similar to that of LightGBM and is a gradient boosting-based ensemble learning algorithm. By optimizing the objective function and incorporating regularization terms, XGBoost further enhances the model’s generalization ability and prediction accuracy (Chen and Guestrin, 2016). The XGBoost algorithm constructs DTs sequentially, specifically fitting the residuals between the predictions of the previous tree and the actual values, with the aim of progressively approximating the true values (Tang et al., 2024). This process continues until a predefined number of iterations is reached or a specific termination condition is satisfied. After training is completed, the model aggregates the predictions from all decision trees using a weighted summation method to generate the final prediction for each sample.
During the optimization of the loss function, XGBoost employs a second-order Taylor expansion to simplify calculations and introduces a regularization term into the objective function to effectively control model complexity and prevent overfitting. The objective function is formulated as Equation 7.
where
3.1.6 K-nearest neighbors
The KNN algorithm is an instance-based learning method. Its core concept is to predict based on the label information of the k nearest neighbors to the input sample, using methods such as voting or weighted averaging (Bo et al., 2023; An et al., 2024b).
3.2 Bayesian optimization
Hyperparameters have a significant impact on the predictive performance of ML models. Optimizing the hyperparameters of ML models can enhance their predictive performance (Chen and Seo, 2023). BO is an efficient global optimization method suitable for scenarios where the objective function is non-analytical, computationally expensive, or noisy (Zhang et al., 2020). It can address the limitations of grid search, which has a large computational burden, and random search, which is prone to getting stuck in local optima. BO constructs probabilistic models, such as Gaussian processes, to predict the behavior of the objective function and uses acquisition functions, such as expected improvement and upper confidence bound, to balance exploration and exploitation (Frazier, 2018). By doing so, BO can intelligently select evaluation points and iteratively approach the optimal solution. Its core idea is to update the posterior distribution using prior knowledge, thereby guiding the optimization process.
3.3 Performance evaluation metrics
Mathematical models play an indispensable role in understanding, simulating, and predicting complex environmental phenomena and systems. In various application domains, the evaluation of ML prediction results is an essential component (Feng et al., 2022; Zhou X. et al., 2023; Liu et al., 2024). To accurately assess the predictive performance of ML models, it is advisable to consider commonly used statistical metrics such as coefficient of determination (
3.4 SHAP
Owing to the black-box nature of ML models, comprehending their output results presents a significant challenge (Ribeiro et al., 2016). In order to enhance the transparency of ML models, interpretability methods for these models have garnered substantial attention from researchers (Li et al., 2019; Love et al., 2023; Longo et al., 2024). The SHapley Additive exPlanations method is an additive explanation approach that interprets model output by calculating the contribution of each input variable to the prediction result, known as the SHAP value (Lundberg and Lee, 2017). SHAP method analyzes the impact of each feature to explain the model’s prediction and sums the SHAP values of all features to obtain the final prediction result (Lundberg et al., 2019; Qu and Zhang, 2025). The calculation of SHAP values is given by Equation 12.
where
For a prediction problem involving three parameter variables, the SHAP method is illustrated in Figure 5. Here,
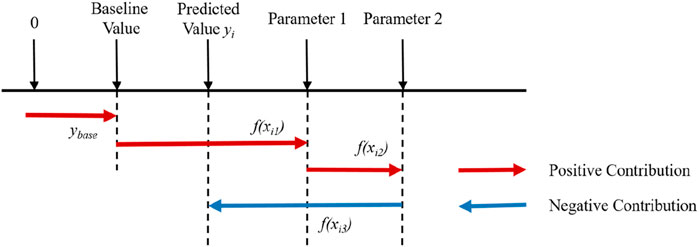
Figure 5. Schematic diagram of the SHAP method.
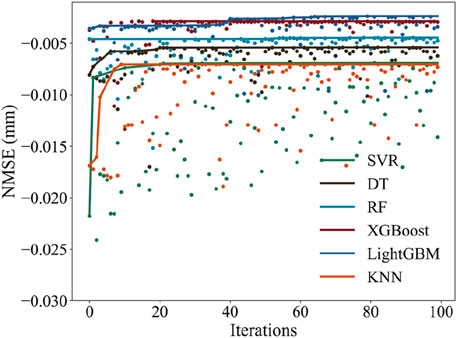
Figure 6. The BO process of the 6 ML models.
4 Result analysis
4.1 Model development and hyperparameter optimization
The TBM tunnel crown convergence dataset was standardized and randomly divided into training and test sets in an 8:2 ratio for training and testing of the 6 ML models. After data standardization and train-test splitting, the training set and test set are divided into input data and output data, respectively. The input data and output data are input into the ML models using a function ‘.fit ()’, which is used to train the models. Similarly, the input data of the test set are input into the well-trained models to yield the output using the function ‘.predict ()’. The model development is conducted using the scikit-learn, xgboost and lightgbm packages with Python.
In this study, to achieve precise prediction of CC in TBM tunnels, six classical ML models—SVR, DT, RF, LightGBM, XGBoost, and KNN—were meticulously constructed and optimized using BO. The hyperparameters of each model were finely tuned via BO to enhance their predictive capabilities for CC. Negative Mean Squared Error (NMSE) was selected as the objective function for BO to minimize prediction error. To prevent overfitting, five-fold cross-validation was employed during model training. Each model underwent 100 optimization iterations, as shown in Figure 6. The results showed that the NMSE of all six models gradually increased during the BO process and eventually converged, demonstrating the effectiveness of BO in improving the models’ performance on the training set.
The optimal hyperparameters and optimization results for the 6 ML models are presented in Supplementary Tables A1-A6 in the supplementary materials. Using the optimal hyperparameters from Supplementary Tables A1-A6, the best-performing SVR, DT, RF, LightGBM, XGBoost, and KNN models were constructed for CC prediction of TBM tunnel. The prediction performance of the six models on the training set is shown in Table 2. From Table 2, it can be seen that the XGBoost model achieved the best prediction performance on the training set, with RMSE, MAE, MAPE, and R2 values of 0.7506, 0.5158, 0.0537, and 0.9744, respectively. The LightGBM model ranked second in prediction performance on the training set, with RMSE, MAE, MAPE, and R2 values of 0.8170, 0.4773, 0.0537, and 0.9673, respectively.
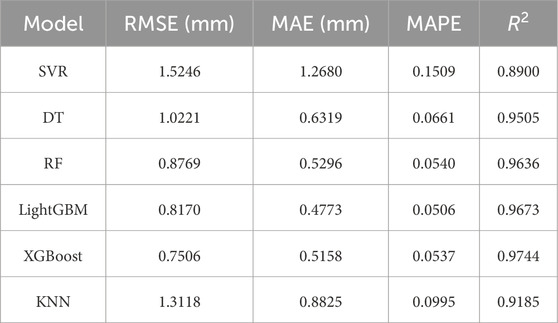
Table 2. The performance metrics of tunnel convergence prediction models on training set.
To further underscore the superiority of the BO, Grey Wolf Optimization (GWO) (Mirjalili et al., 2014), Beluga Whale Optimization (BWO) (Zhong et al., 2022), and Genetic Algorithm (GA) (Albus et al., 2024) are used to optimize the hyperparameters of the LightGBM model to provide comparison. The optimization results are illustrated in Figure 7 and in Table 3. It can be observed from Table 3 that the optimal NMSEs of the are −0.0028 mm, which is smaller than the NMSE of BO. Moreover, the GWO, BWO, and GA take much more time than that of BO. The optimization comparison of LightGBM indicates the superior tuning efficiency of BO and better tuning performance.
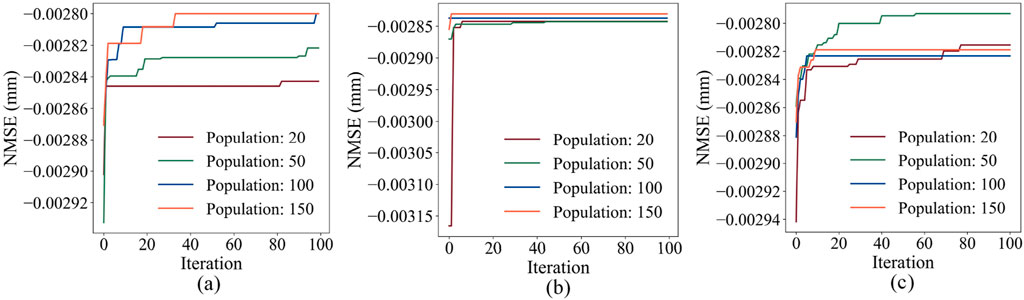
Figure 7. Optimization curves of LightGBM model using GWO, BWO, and GA: (a) GWO; (b) BWO; (c) GA.
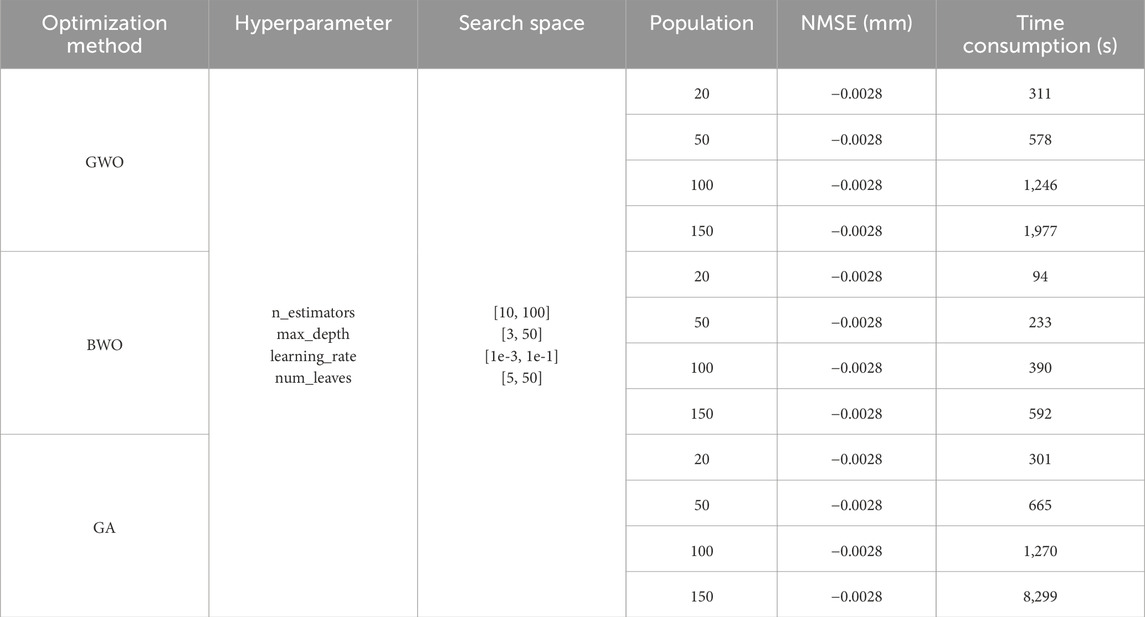
Table 3. Comparison of hyperparameter tuning for LightGBM model using GWO, BWO, and GA.
4.2 Prediction results analysis
The prediction performance of the 6 ML models on the test set is shown in Table 4. From Table 4, it can be observed that the LightGBM model outperformed the other models in terms of prediction accuracy on the test set. The LightGBM model achieved the lowest RMSE (0.9211 mm), MAE (0.6027 mm), and MAPE (0.0644), as well as the highest R2 (0.9636). This indicates that among the 6 ML models evaluated, LightGBM is the best-performing model for predicting TBM tunnel crown convergence. The XGBoost model, which performed best on the training set (as shown in Table 2), also demonstrated satisfactory performance on the test set, with RMSE, MAE, MAPE, and R2 values of 1.2195 mm, 0.7760 mm, 0.0802, and 0.9227, respectively. Although XGBoost’s performance on the test set was slightly inferior to LightGBM, it still ranked second, highlighting its good generalization ability on unseen data. The RF model also showed competitive performance, with RMSE, MAE, MAPE, and R2 values of 1.2979 mm, 0.8028 mm, 0.0839, and 0.9211, respectively. The RF model’s prediction performance on the test set was comparable to that of XGBoost, indicating that ensemble methods are generally suitable for this prediction task.
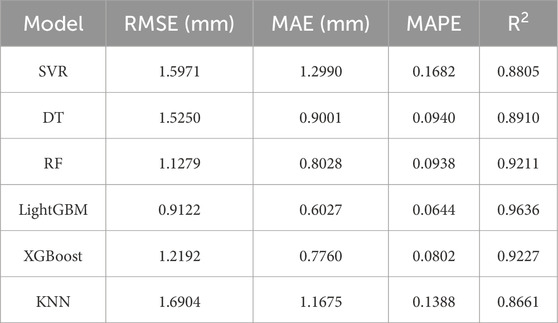
Table 4. The performance metrics of tunnel convergence prediction models on test set.
Compared to ensemble methods, the DT model has a simpler structure but still provides reasonable prediction results, with RMSE, MAE, MAPE, and R2 values of 1.5250 mm, 0.9001 mm, 0.0940, and 0.8910, respectively. However, its performance was significantly lower than that of LightGBM, XGBoost, and RF models, suggesting that more complex models may be needed to capture the nonlinear relationships in the data. The SVR and KNN models had relatively higher prediction errors compared to the other models. The SVR model achieved RMSE, MAE, MAPE, and R2 values of 1.5971 mm, 1.2990 mm, 0.1682, and 0.8805, respectively, while the KNN model achieved values of 1.6904 mm, 1.1675 mm, 0.1388, and 0.8661, respectively. These results indicate that SVR and KNN are less effective than ensemble methods for the specific task of predicting TBM tunnel crown convergence, likely due to their limitations in handling complex nonlinear interactions between input features. For instance, the SVR model’s training set performance is inferior to that of ensemble learning models like LightGBM, and it shows no significant improvement on the test set. This indicates that the SVR model may struggle to capture the complex nonlinear characteristics in TBM tunnel crown convergence data.
As indicated in Tables 2,4, the XGBoost, RF, DT, and KNN models exhibit markedly better predictive performance on the training set compared to the test set. This suggests potential overfitting during their training process. Conversely, the LightGBM model demonstrates comparable predictive performance on both the training and test sets, implying its strong generalization ability and lower risk of overfitting. This might be attributed to LightGBM’s unique algorithmic optimization strategies, such as gradient boosting and the histogram algorithm, which effectively reduce overfitting.
Figure 8 shows the prediction results of the six models on the test set, which depicts the actual versus predicted crown convergence values for each model, clearly comparing their prediction capabilities. Referring to Figure 8, the LightGBM model’s predicted values were closest to the actual values, with the smallest deviations, further confirming its superior performance. In contrast, the SVR and KNN models showed larger deviations from the actual values, especially for larger crown convergence values, indicating their limitations in accurately predicting extreme cases. Overall, the prediction performance of the 6 ML models for TBM tunnel crown convergence can be ranked as follows: LightGBM > XGBoost > RF > DT > SVR > KNN. This outcome offers a key reference for choosing a TBM tunnel crown convergence prediction model. It indicates that in similar complex engineering tasks, opting for advanced ensemble learning models like LightGBM is likely to yield superior predictive results.
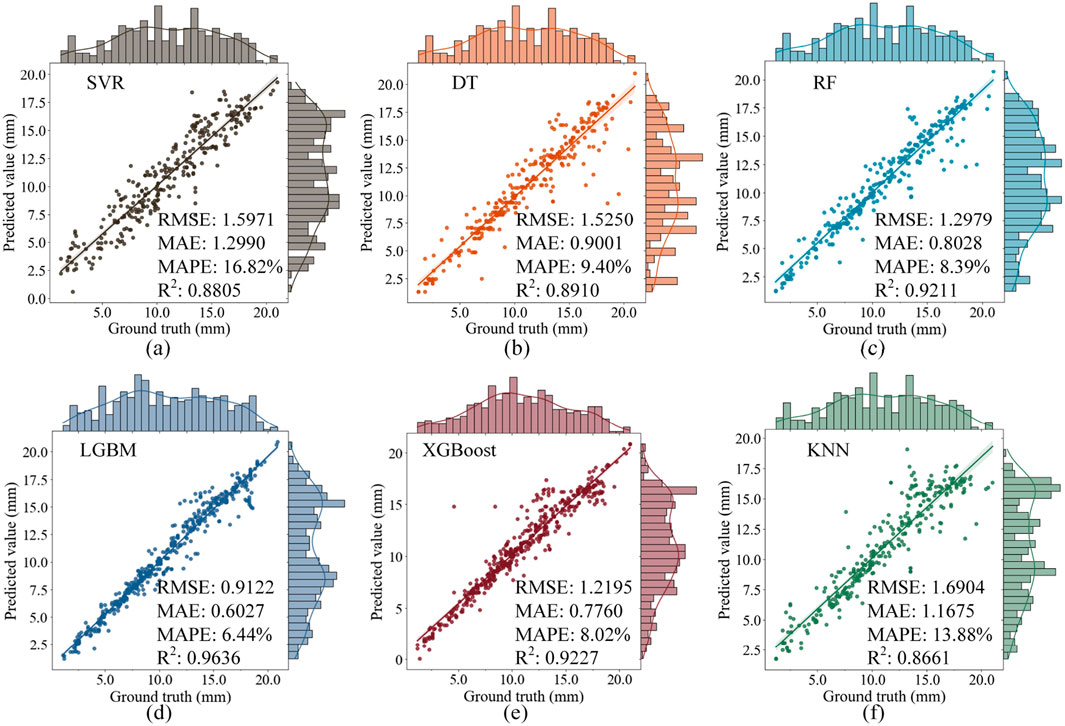
Figure 8. CC prediction results of the 6 ML models on test set: (a) SVR; (b) DT; (c) RF; (d) LightGBM; (e) XGBoost; (f) KNN.
Table 5 shows the improvement in prediction performance of the LightGBM model compared to the other five models. From Table 5, it can be observed that the LightGBM model significantly outperformed the other 5 ML models in terms of prediction accuracy on the test set. Specifically, the LightGBM model achieved average improvements of 36.80%, 36.46%, 37.92%, and 7.58% in RMSE, MAE, MAPE, and R2, respectively, compared to the XGBoost, RF, DT, SVR, and KNN models.
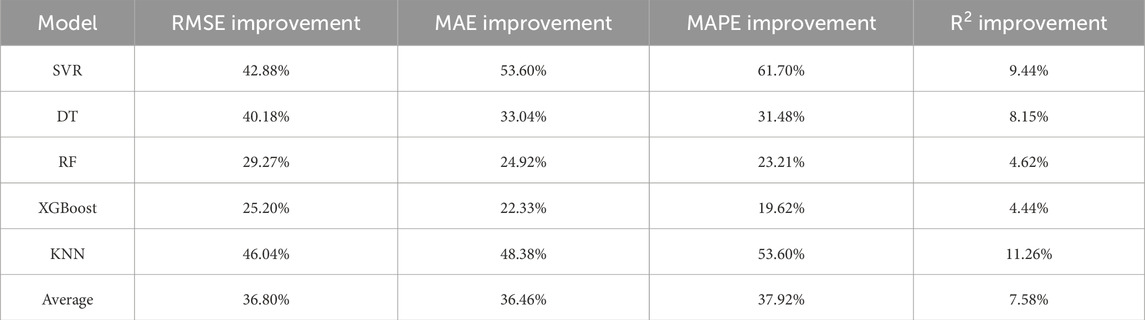
Table 5. Improvements of LightGBM compared to the other 5 ML models.
The results of this study have important implications for engineering practice, particularly in the context of TBM tunnel construction. Accurate prediction of crown convergence is crucial for ensuring the safety and stability of tunnels during and after construction. The LightGBM model, with its high prediction accuracy, can serve as a powerful tool for engineers to predict and mitigate potential risks associated with tunnel deformation. By integrating this model into real-time monitoring systems, engineers can make more informed decisions regarding support measures and construction schedules, leading to safer and more efficient tunnel construction processes.
4.3 Model explanation using SHAP
Although the developed ML models demonstrated satisfactory prediction performance in the task of predicting TBM tunnel crown convergence, particularly the LightGBM model, which achieved a low MAPE of 6.44% on the test set, the “black-box” nature of ML models makes their internal decision-making mechanisms difficult to understand (Adadi and Berrada, 2018). To explore the importance of input features and improve the interpretability of the ML models, the SHAP method was used to analyze the LightGBM model in depth, with the results shown in Figure 9. According to Figure 9, the average SHAP values of the six input variables were ranked as follows: T (0.1366) > RG (0.0871) > DR (0.0528) > SA (0.0200) > SCS (0.0093) > RQD (0.0047). This ranking of average SHAP values reveals the importance of each input feature to the LightGBM model’s predictions.
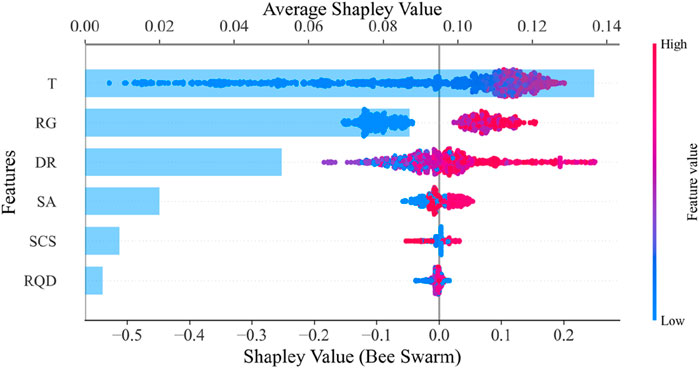
Figure 9. Model explanation results of LightGBM on the impact of the inputs using SHAP.
The time factor (T) had the highest average SHAP value (0.1366), indicating that it has the most significant impact on CC prediction. This result aligns with engineering practice, as tunnel deformation typically accumulates over time, especially after the completion of initial support, where the creep effect of surrounding rock significantly affects tunnel stability. Therefore, the time factor is a key variable in predicting CC. The RG had an average SHAP value of 0.0871, suggesting that it also has a significant impact on CC prediction. Rock grade reflects the strength and stability of the surrounding rock; higher grades indicate better stability and smaller tunnel deformation. The DR had an average SHAP value of 0.0528, demonstrating that it also has some influence on crown settlement prediction. However, compared to the T and RG, the influence of the depth ratio is relatively small. The SA had an average SHAP value of 0.0200, indicating that the stiffness of the initial support also contributes to crown settlement prediction. The steel arch height reflects the stiffness of the initial support; higher stiffness leads to better support effects and smaller tunnel deformation. However, compared to the T and RG, the influence of initial support is relatively small. The SCS and RQD had average SHAP values of 0.0093 and 0.0047, respectively, suggesting that they have a relatively small impact on CC prediction. This may be because these features are correlated with other features (e.g., RG), resulting in their independent contributions being relatively small.
Figure 10 presents the dependence between the four most influential features. The relationship between T and RG indicates that time has less impact on CC at lower RG (better rock quality), but a more pronounced impact at higher RG (poorer rock quality). This aligns with engineering reality, as poor rock quality implies lower stability, leading to more significant deformation over time due to enhanced creep effects. RG and DR are interdependent, with DR exerting a greater influence on CC at higher RG. When rock quality is poor, the tunnel’s stability mainly relies on geometric and burial factors, so changes in DR directly affect the stress environment and deformation characteristics, amplifying its impact on CC. DR and SA also show dependence, where steel arch height has a more noticeable effect on CC at larger DR. Deeply buried tunnels face higher geo-stress and deformation risks, and increasing steel arch height can better resist rock pressure and reduce deformation. In contrast, at smaller DR, steel arch height has a relatively minor impact on CC, as shallow tunnels have a milder stress environment, and lower steel arch height may already suffice for support.
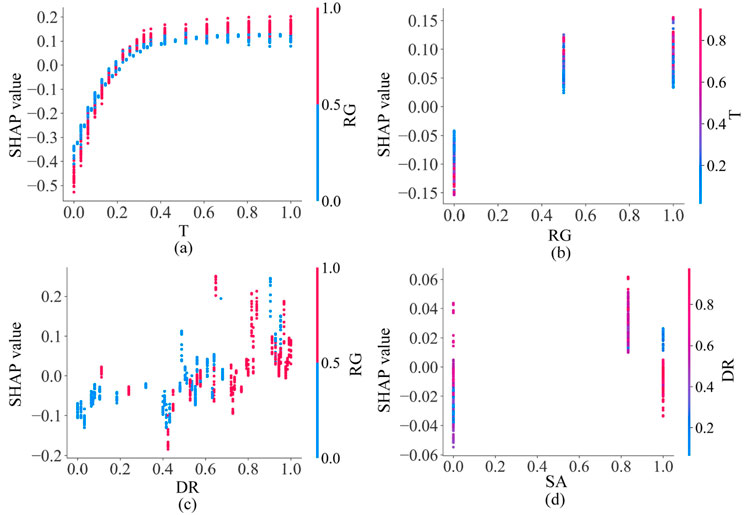
Figure 10. Dependence plots of the input features: (a) T; (b) RG; (c) DR; (d) SA.
Through SHAP analysis, not only can the contribution of each input feature to the model’s predictions be quantified, but the interactions between features and their specific impacts on CC can also be understood. This analysis not only improves model interpretability but also provides valuable insights for engineering practice. For example, engineers can focus on the factors that have the greatest impact on crown settlement (e.g., time factor and rock grade) based on the SHAP analysis results, enabling them to take more targeted support measures to ensure tunnel safety and stability.
4.4 Comparative analysis with related works
Previous studies have constructed reliable ML models for predicting tunnel convergence using different tunnel datasets. Table 6 summarizes the prediction performance of ML models in tunnel convergence prediction tasks from related studies. According to the statistical results in Table 6, the LightGBM model developed in this study achieved an R2 of 0.9636 on the test set, which is higher than the R2 values of most ML models in the related studies. This indicates that the LightGBM model developed in this study has satisfactory prediction performance comparable to that of ML models from previous studies, providing an effective tool for the safe and efficient construction of TBM tunnels.
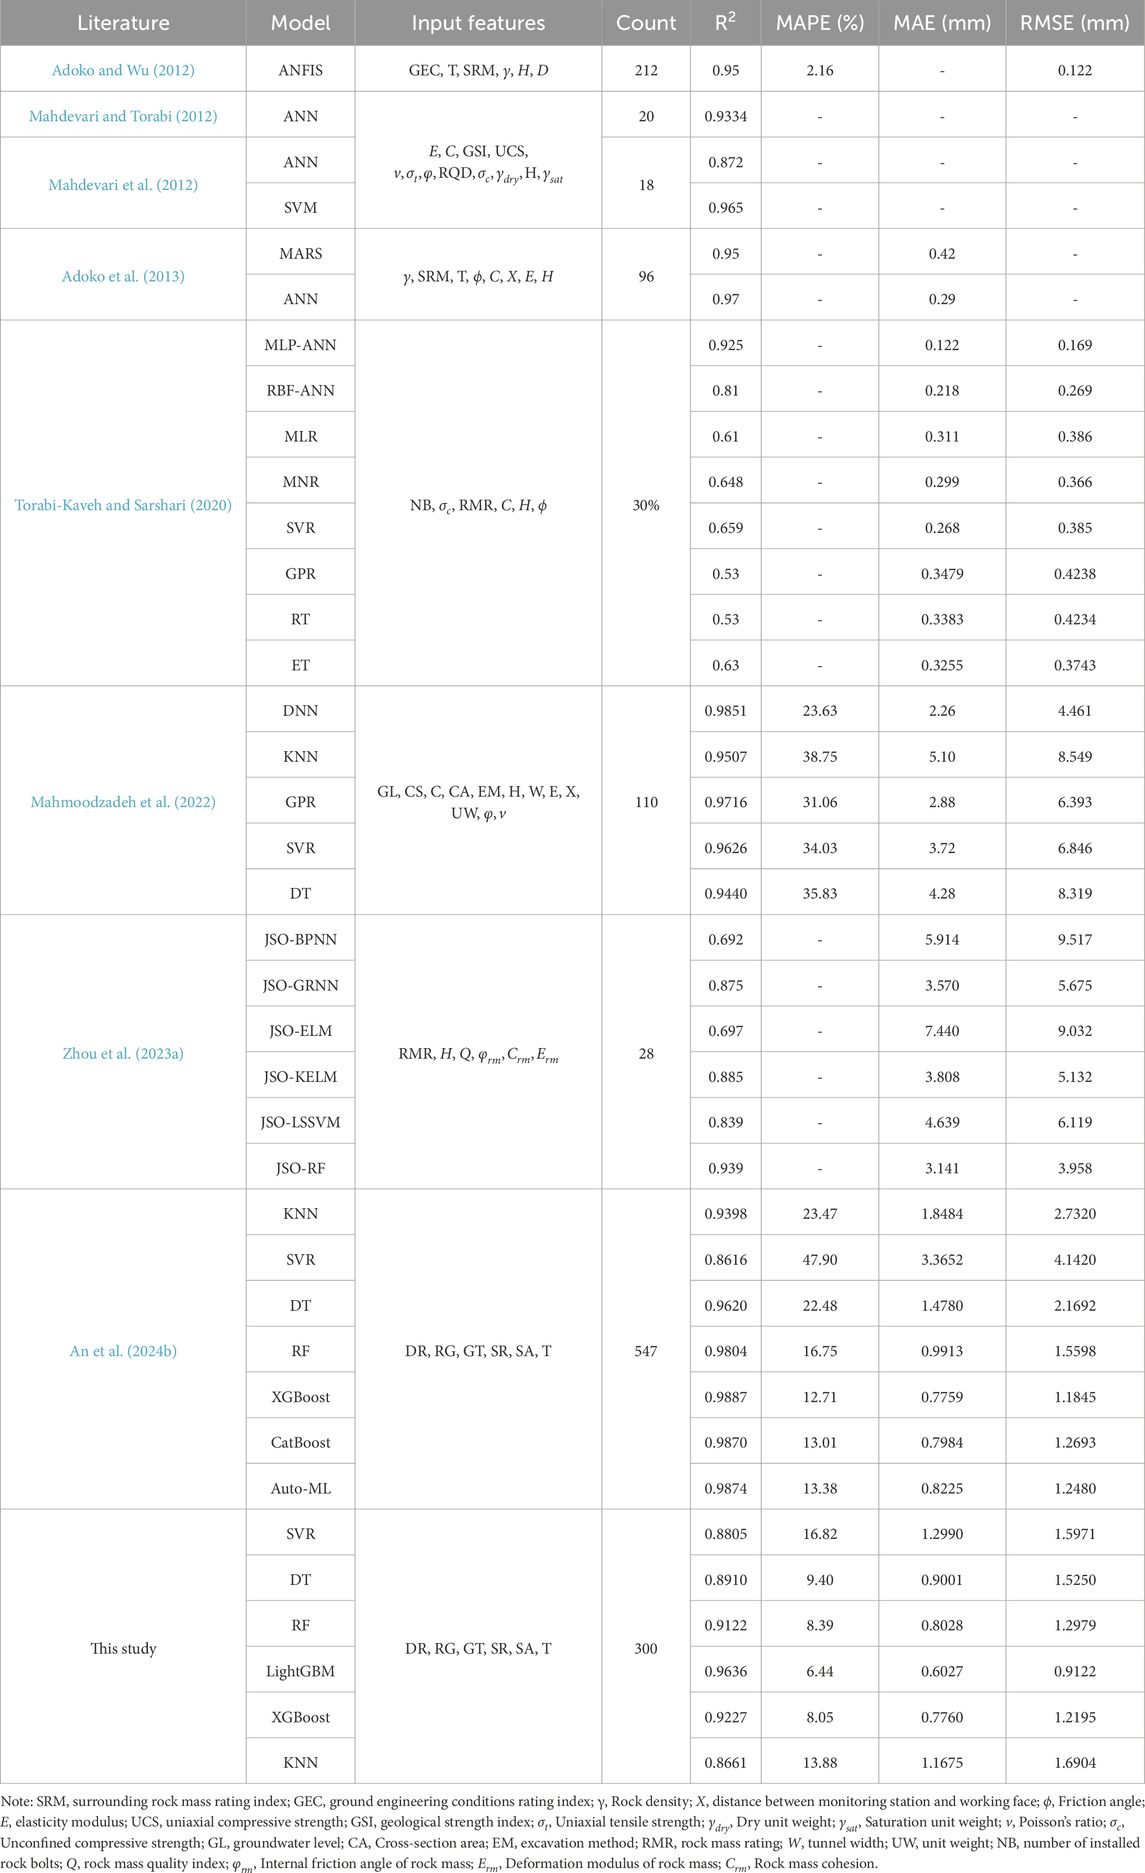
Table 6. Summary of tunnel convergence prediction performance of different ML models.
4.5 Limitations
Despite the accurate prediction of crown convergence in the TBM water conveyance tunnel, this study has some limitations that need to be addressed. Firstly, the generalization of the dataset needs improvement as some features have overly limited values, such as SCS having only 4 values and SA having only 3 values. Secondly, the support form only considered the steel arch height as an input feature, neglecting the stiffness provided by other support measures such as rock bolts, steel mesh, and concrete. Thirdly, the dataset in this study was constructed from a single tunnel, lacking regional and engineering diversity.
5 Engineering application
5.1 Engineering background
The TBM water conveyance tunnel in Xinjiang, China, traverses strata primarily composed of tuffaceous sandstone, tuff, calcareous sandstone, tuff breccia, breccia lava, andesite porphyry, basalt porphyry, dacite porphyry, feldspar sandstone, crystal tuff sandstone, and carbonaceous sandstone from the Devonian and Carboniferous systems; siliceous slate and schistose tuff from the Silurian system; and conglomerate, sandstone, argillaceous sandstone, and carbonaceous mudstone from the Permian and Triassic systems. The tunnel also passes through Hercynian intrusions such as biotite granite, granodiorite, migmatitic granite, and potassic granite. Most of the tunnel sections are located in fresh rock masses with poorly developed fractures, and the surrounding rock is generally blocky and thick-layered, with relatively intact rock masses. The groundwater along the tunnel is mainly bedrock fissure water, with low flow rates. The tunnel crosses five major fault zones, with fracture zones generally ranging from 90 to 100 m wide and a maximum fracture zone width of 800 m.
The total length of the tunnel is 283.41 km, with a burial depth ranging from 150 to 774 m and an average burial depth of 428 m. The maximum burial depth is 774 m. The designed flow rate is 40.0 m3/s. The elevation of the tunnel inlet is 638.23 m, and the elevation of the outlet is 528.494 m. The TBM excavation length is 227.08 km, and the drill-and-blast method is used for 56.33 km. The drill-and-blast method uses a horseshoe-shaped cross-section with an excavation diameter ranging from 6.56 to 8.96 m, while the TBM uses a circular cross-section with an excavation diameter of 7.00 m. Secondary lining is mainly applied in sections with poor rock integrity (Class III) and in Class IV and V rock sections, using C35 reinforced concrete lining. In sections with better rock integrity (Class II and III), shotcrete and rock bolting are used as the primary support.
5.2 Crown convergence prediction results
Six typical sections (K63 + 510, K63 + 530, K63 + 550, K63 + 630, K63 + 650, and K63 + 670) were selected from a TBM water conveyance tunnel in Xinjiang, China and used to validate the LightGBM model’s prediction performance. The geological and design information of the tunnel sections are displayed in Table 7. To enhance the understanding of engineers in relevant fields, the implementing steps of the application in real-world TBM tunnels are illustrated in Figure 11. To make it more convenient for the workers on site to use, a graphical user interface is designed to implement these models, as shown in Figure 12. In this user interface, the users can choose different well-trained models to predict the CC of the tunnel sections with the input features of the sections. The prediction results can be shown as a curve plot to enhance user’s understanding.
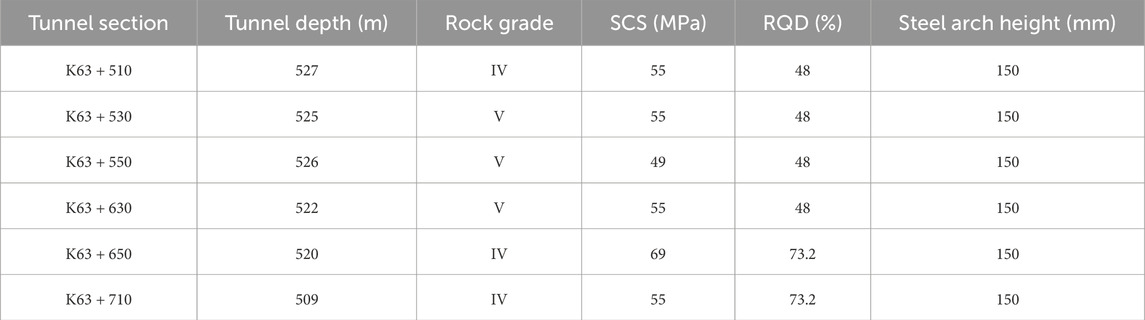
Table 7. Description of the four tunnel sections.
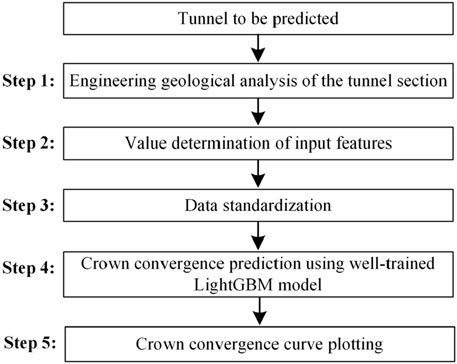
Figure 11. Workflow of crown convergence prediction for real-world TBM tunnels.
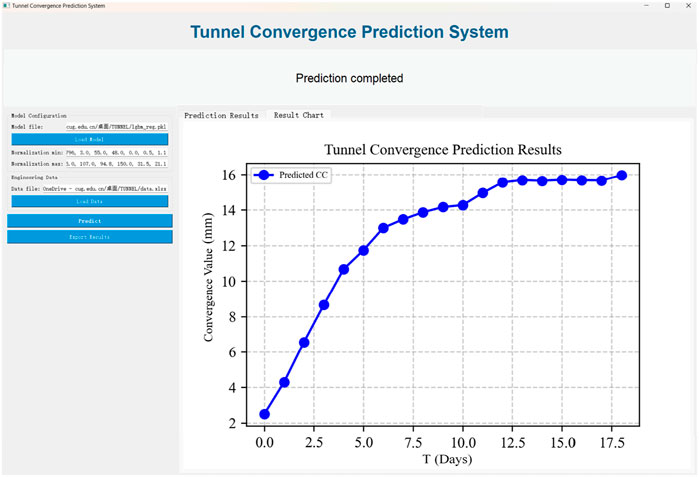
Figure 12. User interface to implement the machine learning models.
Table 8 shows the prediction performance metrics of the LightGBM model for these six sections. According to Table 8, the LightGBM model achieved high prediction accuracy in the K63 + 510, K63 + 530, K63 + 650 and K63 + 670 sections, with R2 values of 0.9951, 0.9941, 0.9822 and 0.9882, respectively. In the K63 + 550 and K63 + 630 sections, the prediction accuracy was slightly lower, with R2 values of 0.8093 and 0.9275, respectively.
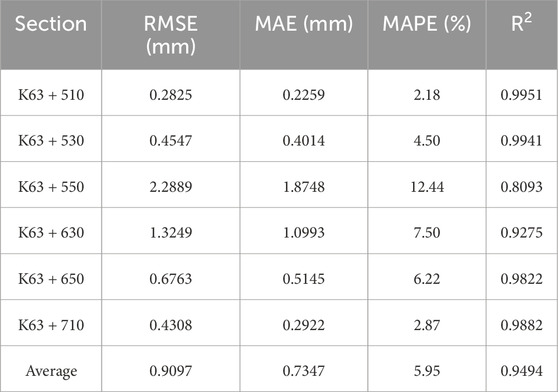
Table 8. The performance metrics of tunnel convergence prediction for the six tunnel sections using LightGBM.
Overall, the LightGBM model achieved an average RMSE of 0.9097 mm, an average MAE of 0.7347 mm, an average MAPE of 5.95%, and an average R2 of 0.9494 across the six sections. This indicates that the LightGBM model has high prediction accuracy and generalization ability in actual TBM tunnel engineering. Additionally, Figure 13 shows the prediction curves of the LightGBM model for the six sections compared to the actual observed values. It can be observed that the model’s prediction curves closely match the actual observed values in most sections, particularly in the K63 + 510, K63 + 530, K63 + 650, and K63 + 710 sections, where the prediction curves almost completely overlap with the actual observed values. In the K63 + 550 and K63 + 630 sections, although the prediction errors increased slightly, the model still captured the trend of crown convergence well, with small deviations between the prediction curves and the actual observed values.
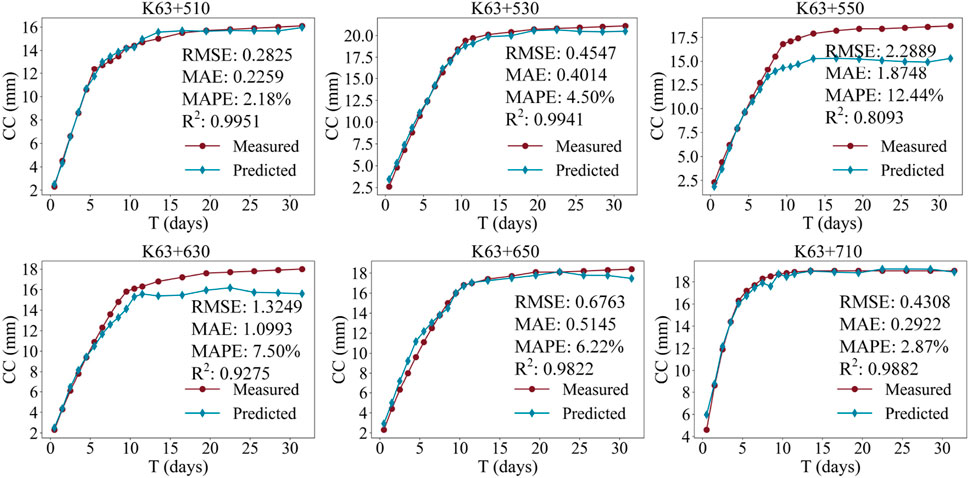
Figure 13. Prediction curves of the six tunnel sections yielded by LightGBM model.
The high prediction accuracy and generalization ability of the LightGBM model in actual TBM tunnel engineering provide strong support for tunnel support design and construction decision-making. By integrating this model into real-time monitoring systems, engineers can predict crown convergence in real-time and adjust support measures and construction schedules accordingly, ensuring the safety and stability of the tunnel. For instance, in the K63 + 550 and K63 + 630 sections, despite a slight increase in prediction errors, the model still captures the crown convergence trend effectively, offering a reliable basis for risk warning and decision support during construction.
6 Conclusion
This study proposes an interpretable ML method based on BO and SHAP for predicting crown convergence in TBM tunnels. Firstly, a large-scale dataset containing 1,501 samples was constructed. Then, six classical ML models (SVM, DT, RF, LightGBM, XGBoost, and KNN) were developed, and BO was applied to tune the hyperparameters of each model to achieve accurate prediction of crown convergence. Subsequently, the SHAP method was used to interpret the LightGBM model, quantifying the contribution of each input feature to the model’s predictions and improving model interpretability. Finally, the LightGBM model was validated using data from six sections of a TBM water conveyance tunnel in Xinjiang, China. The results show that:
(1) The LightGBM model achieved the best prediction performance on the test set, with RMSE, MAE, MAPE, and R2 values of 0.9122 mm, 0.6027 mm, 0.0644, and 0.9636, respectively. The prediction performance of the 6 ML models was ranked as follows: LightGBM > XGBoost > RF > DT > SVR > KNN.
(2) SHAP analysis revealed the contribution of input features to the LightGBM model’s predictions. The average SHAP values of the six input features were ranked as follows: T (0.1366) > RG (0.0871) > DR (0.0528) > SA (0.0200) > SCS (0.0093) > RQD (0.0047).
(3) In practical engineering applications, the LightGBM model achieved an average RMSE of 0.9097 mm, an average MAE of 0.7347 mm, an average MAPE of 5.95%, and an average R2 of 0.9494 across six sections, demonstrating accurate prediction of crown convergence in the TBM water conveyance tunnel.
Future research will incorporate the comprehensive stiffness of the support structure as an input feature to improve the model’s prediction accuracy. Moreover, data from other tunnels will be collected to increase the diversity of the dataset and improve the generalization ability of the ML models.
Data availability statement
The original contributions presented in the study are included in the article/supplementary material, further inquiries can be directed to the corresponding author.
Author contributions
WH: Conceptualization, Validation, Investigation, Writing – original draft, Methodology, Formal Analysis, Data curation. KW: Writing – original draft, Software, Validation, Data curation, Investigation. HL: Data curation, Visualization, Methodology, Writing – original draft, Formal Analysis, Investigation. WL: Validation, Data curation, Investigation, Writing – original draft, Formal Analysis, Software. XL: Formal Analysis, Writing – review and editing, Data curation, Investigation. PG: Funding acquisition, Resources, Writing – review and editing, Project administration, Supervision.
Funding
The author(s) declare that financial support was received for the research and/or publication of this article. This work was supported by the China Postdoctoral Science Foundation (2024M752746, 2024T170760) and Education Department of Hunan Province of China (24B0915).
Conflict of interest
Authors WH and HL were employed by CISPDR Corporation. Author KW was employed by Hubei Shenlong Geological Engineering Investigation Institute Co., Ltd. Author XL was employed by Xinjiang Water Conservancy Development and Construction Group Co., Ltd.
The remaining authors declare that the research was conducted in the absence of any commercial or financial relationships that could be construed as a potential conflict of interest.
The reviewer YZ declared a shared affiliation with the author PG to the handling editor at time of review.
Generative AI statement
The author(s) declare that no Generative AI was used in the creation of this manuscript.
Publisher’s note
All claims expressed in this article are solely those of the authors and do not necessarily represent those of their affiliated organizations, or those of the publisher, the editors and the reviewers. Any product that may be evaluated in this article, or claim that may be made by its manufacturer, is not guaranteed or endorsed by the publisher.
Supplementary material
The Supplementary Material for this article can be found online at: https://www.frontiersin.org/articles/10.3389/feart.2025.1608468/full#supplementary-material
References
Adadi, A., and Berrada, M. (2018). Peeking inside the black-box: a survey on explainable artificial intelligence (xai). IEEE Access 6, 52138–52160. doi:10.1109/ACCESS.2018.2870052
Adoko, A.-C., Jiao, Y.-Y., Wu, L., Wang, H., and Wang, Z.-H. (2013). Predicting tunnel convergence using multivariate adaptive regression spline and artificial neural network. Tunn. Undergr. Space Technol. 38, 368–376. doi:10.1016/j.tust.2013.07.023
Adoko, A. C., and Wu, L. (2012). Estimation of convergence of a high-speed railway tunnel in weak rocks using an adaptive neuro-fuzzy inference system (ANFIS) approach. J. Rock Mech. Geotech. Eng. 4, 11–18. doi:10.3724/SP.J.1235.2012.00011
Albus, M., Hornek, T., Kraus, W., and Huber, M. F. (2024). Towards scalability for resource reconfiguration in robotic assembly line balancing problems using a modified genetic algorithm. J. Intell. Manuf. 36, 1175–1199. doi:10.1007/s10845-023-02292-0
An, X., Luo, H., Zheng, F., Jiao, Y., Qi, J., and Zhang, Y. (2024a). Explainable deep learning-based dynamic prediction of surface settlement considering temporal characteristics during deep excavation. Appl. Soft Comput. 167, 112273. doi:10.1016/j.asoc.2024.112273
An, X., Zheng, F., Jiao, Y., Li, Z., Zhang, Y., and He, L. (2024b). Optimized machine learning models for predicting crown convergence of plateau mountain tunnels. Transp. Geotech. 46, 101254. doi:10.1016/j.trgeo.2024.101254
Arora, K., and Gutierrez, M. (2021). Viscous-elastic-plastic response of tunnels in squeezing ground conditions: analytical modeling and experimental validation. Int. J. Rock Mech. Min. 146, 104888. doi:10.1016/j.ijrmms.2021.104888
Asadollahpour, E., Rahmannejad, R., Asghari, A., and Abdollahipour, A. (2014). Back analysis of closure parameters of Panet equation and Burger’s model of Babolak water tunnel conveyance. Int. J. Rock Mech. Min. Sci. 68, 159–166. doi:10.1016/j.ijrmms.2014.02.017
Bo, Y., Huang, X., Pan, Y., Feng, Y., Deng, P., Gao, F., et al. (2023). Robust model for tunnel squeezing using Bayesian optimized classifiers with partially missing database. Undergr. Space 10, 91–117. doi:10.1016/j.undsp.2022.11.001
Chen, C., and Seo, H. (2023). Prediction of rock mass class ahead of TBM excavation face by ML and DL algorithms with Bayesian TPE optimization and SHAP feature analysis. Acta Geotech. 18, 3825–3848. doi:10.1007/s11440-022-01779-z
Chen, R.-P., Lin, X.-T., Kang, X., Zhong, Z.-Q., Liu, Y., Zhang, P., et al. (2018). Deformation and stress characteristics of existing twin tunnels induced by close-distance EPBS under-crossing. Tunn. Undergr. Space Technol. 82, 468–481. doi:10.1016/j.tust.2018.08.059
Chen, T., and Guestrin, C. (2016). “XGBoost: a scalable tree boosting system,” in Proceedings of the 22nd ACM SIGKDD international conference on knowledge discovery and data mining (New York, NY, USA: Association for Computing Machinery), 785–794. doi:10.1145/2939672.2939785
Feng, T., Wang, C., Zhang, J., Wang, B., and Jin, Y.-F. (2022). An improved artificial bee colony-random forest (IABC-RF) model for predicting the tunnel deformation due to an adjacent foundation pit excavation. Undergr. Space 7, 514–527. doi:10.1016/j.undsp.2021.11.004
Feng, X., Jimenez, R., Zeng, P., and Senent, S. (2019). Prediction of time-dependent tunnel convergences using a Bayesian updating approach. Tunn. Undergr. Space Technol. 94, 103118. doi:10.1016/j.tust.2019.103118
Fu, X., Wu, M., Ponnarasu, S., and Zhang, L. (2023). A hybrid deep learning approach for dynamic attitude and position prediction in tunnel construction considering spatio-temporal patterns. Expert Syst. Appl. 212, 118721. doi:10.1016/j.eswa.2022.118721
Fu, X., Wu, M., Tiong, R. L. K., and Zhang, L. (2022). Data-driven real-time advanced geological prediction in tunnel construction using a hybrid deep learning approach. Autom. Constr. 146, 104672. doi:10.1016/j.autcon.2022.104672
Gao, B., Wang, R., Lin, C., Guo, X., Liu, B., and Zhang, W. (2021). TBM penetration rate prediction based on the long short-term memory neural network. Undergr. Space 6, 718–731. doi:10.1016/j.undsp.2020.01.003
Guan, P., Ou, G., Liang, F., Luo, W., Wang, Q., Pei, C., et al. (2025). Tunnel squeezing prediction based on partially missing dataset and optimized machine learning models. Front. Earth Sci. 13. doi:10.3389/feart.2025.1511413
Hu, Y., Tang, H., Xu, Y., Lei, H., Zeng, P., Yao, K., et al. (2024). Ground settlement and tunnel response due to twin-curved shield tunnelling in soft ground with small clear distance. J. Rock Mech. Geotech. Eng. 16, 3122–3135. doi:10.1016/j.jrmge.2024.06.005
Huang, H. W., Xiao, L., Zhang, D. M., and Zhang, J. (2017). Influence of spatial variability of soil Young’s modulus on tunnel convergence in soft soils. Eng. Geol. 228, 357–370. doi:10.1016/j.enggeo.2017.09.011
Ke, G., Meng, Q., Finley, T., Wang, T., Chen, W., Ma, W., et al. (2017). “LightGBM: a highly efficient gradient boosting decision tree,” in Advances in neural information processing systems (Long Beach, CA, USA: 31st Conference on Neural Information Processing Systems (NIPS 2017)).
Kim, D., Pham, K., Oh, J.-Y., Lee, S.-J., and Choi, H. (2022). Classification of surface settlement levels induced by TBM driving in urban areas using random forest with data-driven feature selection. Autom. Constr. 135, 104109. doi:10.1016/j.autcon.2021.104109
Li, C., and Dias, D. (2024). Intelligent prediction and visual optimization of surface settlement induced by earth pressure balance shield tunneling. Tunn. Undergr. Space Technol. 154, 106138. doi:10.1016/j.tust.2024.106138
Li, H., Fan, W., Shi, S., and Chou, Q. (2019). “A modified LIME and its application to explain service supply chain forecasting,” in Natural Language processing and Chinese computing (Cham: Springer), 637–644. doi:10.1007/978-3-030-32236-6_58
Li, X., Pan, Y., Zhang, L., and Chen, J. (2023). Dynamic and explainable deep learning-based risk prediction on adjacent building induced by deep excavation. Tunn. Undergr. Space Technol. 140, 105243. doi:10.1016/j.tust.2023.105243
Liu, L., Zhou, W., and Gutierrez, M. (2022). Effectiveness of predicting tunneling-induced ground settlements using machine learning methods with small datasets. J. Rock Mech. Geotech. Eng. 14, 1028–1041. doi:10.1016/j.jrmge.2021.08.018
Liu, X., Li, K., Jiang, A., Fang, Q., and Zhang, R. (2024). Prediction interaction responses between railway subgrade and shield tunnelling using machine learning with sparrow search algorithm. Transp. Geotech. 44, 101169. doi:10.1016/j.trgeo.2023.101169
Longo, L., Brcic, M., Cabitza, F., Choi, J., Confalonieri, R., Ser, J. D., et al. (2024). Explainable Artificial Intelligence (XAI) 2.0: a manifesto of open challenges and interdisciplinary research directions. Inf. Fusion 106, 102301. doi:10.1016/j.inffus.2024.102301
Love, P. E. D., Fang, W., Matthews, J., Porter, S., Luo, H., and Ding, L. (2023). Explainable artificial intelligence (XAI): precepts, models, and opportunities for research in construction. Adv. Eng. Inf. 57, 102024. doi:10.1016/j.aei.2023.102024
Lundberg, S. M., Erion, G. G., and Lee, S.-I. (2019). Consistent individualized feature attribution for tree ensembles. doi:10.48550/arXiv.1802.03888
Lundberg, S. M., and Lee, S.-I. (2017). “A unified approach to interpreting model predictions,” in Advances in neural information processing systems 30 (NIPS 2017). I. Guyon, U. V. Luxburg, S. Bengio, H. Wallach, R. Fergus, and S. Vishwanathan, (La Jolla: Neural Information Processing Systems).
Mahdevari, S., and Torabi, S. R. (2012). Prediction of tunnel convergence using artificial neural networks. Tunn. Undergr. Space Technol. 28, 218–228. doi:10.1016/j.tust.2011.11.002
Mahdevari, S., Torabi, S. R., and Monjezi, M. (2012). Application of artificial intelligence algorithms in predicting tunnel convergence to avoid TBM jamming phenomenon. Int. J. Rock Mech. Min. Sci. 55, 33–44. doi:10.1016/j.ijrmms.2012.06.005
Mahmoodzadeh, A., Mohammadi, M., Daraei, A., Ali, H. F. H., Abdullah, A. I., and Al-Salihi, N. K. (2021). Forecasting tunnel geology, construction time and costs using machine learning methods. Neural comput. Appl. 33, 321–348. doi:10.1007/s00521-020-05006-2
Mahmoodzadeh, A., Nejati, H. R., Mohammadi, M., Ibrahim, H. H., Mohammed, A. H., and Rashidi, S. (2022). Assessment of wall convergence for tunnels using machine learning techniques. Geomech. Eng. 31, 265–279. doi:10.12989/gae.2022.31.3.265
Mirjalili, S., Mirjalili, S. M., and Lewis, A. (2014). Grey Wolf optimizer. Adv. Eng. Softw. 69, 46–61. doi:10.1016/j.advengsoft.2013.12.007
Naser, M. Z. (2021). An engineer’s guide to eXplainable Artificial Intelligence and Interpretable Machine Learning: navigating causality, forced goodness, and the false perception of inference. Autom. Constr. 129, 103821. doi:10.1016/j.autcon.2021.103821
Pan, Y., Chen, L., Wang, J., Ma, H., Cai, S., Pu, S., et al. (2021). Research on deformation prediction of tunnel surrounding rock using the model combining firefly algorithm and nonlinear auto-regressive dynamic neural network. Eng. Comput. 37, 1443–1453. doi:10.1007/s00366-019-00894-y
Qu, P., and Zhang, L. (2025). Uncertainty-based multi-objective optimization in twin tunnel design considering fluid-solid coupling. Reliab. Eng. Syst. Safe. 253, 110575. doi:10.1016/j.ress.2024.110575
Ray, R., Kumar, D., Samui, P., Roy, L. B., Goh, A. T. C., and Zhang, W. (2021). Application of soft computing techniques for shallow foundation reliability in geotechnical engineering. Geosci. Front. 12, 375–383. doi:10.1016/j.gsf.2020.05.003
Ribeiro, M. T., Singh, S., and Guestrin, C. (2016). ““Why should I trust you?”: explaining the predictions of any classifier,” in Proceedings of the 22nd ACM SIGKDD international conference on knowledge discovery and data mining (New York, NY, USA: Association for Computing Machinery), 1135–1144. doi:10.1145/2939672.2939778
Sheini Dashtgoli, D., Sadeghian, R., Mahboubi Ardakani, A. R., Mohammadnezhad, H., Giustiniani, M., Busetti, M., et al. (2024). Predictive modeling of shallow tunnel behavior: leveraging machine learning for maximum convergence displacement estimation. Transp. Geotech. 47, 101284. doi:10.1016/j.trgeo.2024.101284
Tang, Y., Yang, J., You, Y., Fu, J., Zheng, X., and Zhang, C. (2024). Multi-output prediction for TBM operation parameters based on stacking ensemble algorithm. Tunn. Undergr. Space Technol. 152, 105960. doi:10.1016/j.tust.2024.105960
Torabi-Kaveh, M., and Sarshari, B. (2020). Predicting convergence rate of namaklan twin tunnels using machine learning methods. Arab. J. Sci. Eng. 45, 3761–3780. doi:10.1007/s13369-019-04239-1
Wang, K., Zhang, L., and Fu, X. (2023). Time series prediction of tunnel boring machine (TBM) performance during excavation using causal explainable artificial intelligence (CX-AI). Autom. Constr. 147, 104730. doi:10.1016/j.autcon.2022.104730
Wang, X., Iura, T., Jiang, Y., Wang, Z., and Liu, R. (2021). Deformation and mechanical characteristics of tunneling in squeezing ground: a case study of the west section of the Tawarazaka Tunnel in Japan. Tunn. Undergr. Space Technol. 109, 103697. doi:10.1016/j.tust.2020.103697
Xu, Z., Ma, W., Lin, P., and Hua, Y. (2022). Deep learning of rock microscopic images for intelligent lithology identification: neural network comparison and selection. J. Rock Mech. Geotech. Eng. 14, 1140–1152. doi:10.1016/j.jrmge.2022.05.009
Yin, X., Huang, X., Pan, Y., and Liu, Q. (2023). Point and interval estimation of rock mass boreability for tunnel boring machine using an improved attribute-weighted deep belief network. Acta Geotech. 18, 1769–1791. doi:10.1007/s11440-022-01651-0
Zhang, L., Guo, J., Fu, X., Tiong, R. L. K., and Zhang, P. (2024). Digital twin enabled real-time advanced control of TBM operation using deep learning methods. Autom. Constr. 158, 105240. doi:10.1016/j.autcon.2023.105240
Zhang, Q., Hu, W., Liu, Z., and Tan, J. (2020). TBM performance prediction with Bayesian optimization and automated machine learning. Tunn. Undergr. Space Technol. 103, 103493. doi:10.1016/j.tust.2020.103493
Zhang, W., Li, Y., Wu, C., Li, H., Goh, A., and Liu, H. (2022). Prediction of lining response for twin tunnels constructed in anisotropic clay using machine learning techniques. Undergr. Space 7, 122–133. doi:10.1016/j.undsp.2020.02.007
Zhao, D., He, Y., Chen, X., Wang, J., Liu, Y., Zhang, Q., et al. (2024). Data-driven intelligent prediction of TBM surrounding rock and personalized evaluation of disaster-inducing factors. Tunn. Undergr. Space Technol. 148, 105768. doi:10.1016/j.tust.2024.105768
Zhong, C., Li, G., and Meng, Z. (2022). Beluga whale optimization: a novel nature-inspired metaheuristic algorithm. Knowledge-Based Syst. 251, 109215. doi:10.1016/j.knosys.2022.109215
Zhou, J., Chen, Y., Li, C., Qiu, Y., Huang, S., and Tao, M. (2023a). Machine learning models to predict the tunnel wall convergence. Transp. Geotech. 41, 101022. doi:10.1016/j.trgeo.2023.101022
Zhou, J., Zhu, S., Qiu, Y., Armaghani, D. J., Zhou, A., and Yong, W. (2022). Predicting tunnel squeezing using support vector machine optimized by whale optimization algorithm. Acta Geotech. 17, 1343–1366. doi:10.1007/s11440-022-01450-7
Keywords: TBM tunnel, crown convergence prediction, machine learning, model explanation, bayesian optimization
Citation: Hu W, Wu K, Liu H, Luo W, Li X and Guan P (2025) Interpretable machine learning approach for TBM tunnel crown convergence prediction with Bayesian optimization. Front. Earth Sci. 13:1608468. doi: 10.3389/feart.2025.1608468
Received: 09 April 2025; Accepted: 12 June 2025;
Published: 30 June 2025.
Edited by:
Chong Xu, Ministry of Emergency Management (China), ChinaReviewed by:
You Zhang, China University of Geosciences (Wu Han), ChinaZhiyuan Xia, Kunming University of Science and Technology, China
Zida Liu, Central South University, China
Copyright © 2025 Hu, Wu, Liu, Luo, Li and Guan. This is an open-access article distributed under the terms of the Creative Commons Attribution License (CC BY). The use, distribution or reproduction in other forums is permitted, provided the original author(s) and the copyright owner(s) are credited and that the original publication in this journal is cited, in accordance with accepted academic practice. No use, distribution or reproduction is permitted which does not comply with these terms.
*Correspondence: Peng Guan, MjAwODEwMDIxNDFAY3VnLmVkdS5jbg==