 Nasir Ali Khan1
 Hassan Alzahrani2
 Shibiao Bai1,3*Muhammad Hussain4
 Muhammad Tayyab4
 Safi Ullah5Kashif Ullah6Salman Khalid1
- 1School of Marine Science and Engineering, Jiangsu Center for Collaborative Innovation in Geographical Information Resource Development and Application, Nanjing Normal University, Nanjing, China
- 2Department of Geology and Geophysics, College of Science, King Saud University, Riyadh, Saudi Arabia
- 3China-Pakistan Joint Research Center on Earth Sciences, Institute of Mountain Hazards and Environment, Chinese Academy of Sciences, Chengdu, China
- 4Institute of Natural Disaster Research, School of Environment, Northeast Normal University, Changchun, China
- 5Department of Atmospheric and Oceanic Sciences, Fudan University, Shanghai, China
- 6School of Geophysics and Geomatics, China University of Geosciences Wuhan, Wuhan, China
Extreme climatic events, such as floods, are becoming increasingly frequent and severe worldwide, including in Pakistan. The Swat River Catchment (SRC), located in the eastern Hindukush region of Pakistan, is highly susceptible to flooding due to its unique geographical and climatic conditions. However, despite the region’s susceptibility, comprehensive flood risk assessments that integrate hazard, vulnerability, and exposure components remain limited. To address this gap, this study assesses flood risk in the SRC using 22 indicators distributed across the three core dimensions of flood risk: hazard, vulnerability, and exposure. Flood hazard was modeled using 11 indicators, broadly categorized into environmental, hydrological, and geographical aspects, while vulnerability was evaluated through socio-economic factors, geographical proximity, and land use characteristics. Exposure was analyzed based on population metrics and critical infrastructure. All data were converted into thematic layers in GIS, systematically weighted using the Analytical Hierarchy Process (AHP) and combined to produce hazard, vulnerability, and exposure maps respectively. These maps were then integrated through a risk equation to generate the final flood risk map. The results reveal that 31% of the study area is in a high flood risk zone, 27% in moderate risk zones, 23% in low risk, and 19% are safe areas. The results were validated using the Area Under the Curve (AUC) technique, yielding a value of 0.92, which indicates high reliability. By presenting the first integrated flood risk assessment for the SRC, this study provides valuable insights into flood-prone areas and risk distribution. These results highlight the urgent need for enhanced flood risk management, especially in urban areas. The developed methodology serves as a valuable tool for disaster management authorities and planners, helping them make risk-informed decisions, allocate resources efficiently, and implement targeted flood mitigation strategies.
1 Introduction
Flooding is widely recognized as a major global natural disaster, posing significant risks to human life, economic stability, property, and culture heritage (Billa et al., 2006; Samanta et al., 2018b; Zou et al., 2013). Every year, floods cause more than 2000 fatalities, affecting over 75 million people globally (Billa et al., 2006; Calil et al., 2015). Floods result from a combination of natural and anthropogenic factors. Recent research indicates that the frequency and intensity of flooding events are increasing, largely due to the effects of climate change (Scheuer et al., 2017; Khosravi et al., 2016b; Ullah et al., 2023; Syed et al., 2022). Additionally, land use changes, such as the expansion of impermeable surfaces and increased river velocities, significantly impact flood frequency and severity in specific regions (Charlton et al., 2006; Abbas et al., 2022). While floods cannot be entirely prevented, a comprehensive flood risk assessment can help mitigate their impacts by identifying flood-prone areas and enabling policymakers to allocate resources more effectively (Guo et al., 2014; Zhang and Chen, 2019). The Intergovernmental Panel on Climate Change (IPCC) emphasizes that flood risk is determined by three key factors: hazard, vulnerability, and exposure (Allan et al., 2023).
During the monsoon season, South Asian nations face significant challenges due to flooding, causing widespread devastation to lives and livelihoods (Hussain et al., 2023a). This region bears a disproportionate burden of flood-related impacts when compared to other geographical areas (Rahman et al., 2019). Over the past 2 decades, flood events have affected more than 1 billion individuals in South Asia (Waseem et al., 2023). The frequency of extreme flooding events is rising, and future projections indicate that such occurrences will become even more common as a result of climate change (Rahman et al., 2023).
Pakistan, due to its geographical location and designation as a climate change hotspot, frequently experiences severe floods that devastate communities and infrastructure. The catastrophic flood of August 2022 inflicted particularly severe damage on the country’s southern provinces (Ibrahim et al., 2024). Several factors have been identified as potential triggers for this disaster, including intense rainfall, glacial melting, and the formation of a powerful low-pressure system over the region (Rahman et al., 2023). Moreover, Pakistan is ranked among the top ten countries in the global climate risk index, reflecting the severity of climate-related disasters that occurred between 2000 and 2019. This underscores the nation’s susceptibility to extreme weather events exacerbated by climate change (Ullah et al., 2023).
Various studies have been conducted around the world to assess and map flood risk assessment (Charlton et al., 2006; Hong et al., 2018; Kia et al., 2012; Toosi et al., 2019). Traditional approaches, such as rainfall-runoff modeling and numerical simulations, often require extensive hydrological and topographical data, which can be costly and unavailable in data-scarce regions like Pakistan (Cremen et al., 2022). These models require detailed hydrological and topographical data, which are time-consuming and costly and often not available in developing countries, like Pakistan. The advancement of Geographic Information Systems (GIS) and remote sensing has expanded data availability for flood risk assessment, prediction, and mitigation (Khosravi et al., 2016b; Dandapat et al., 2017; Vojtek and Vojteková, 2019; Hossain and Paul, 2018). GIS is a decision support system that merges an information repository with analytical tools and has become increasingly popular in vulnerability and risk assessment studies (Chakraborty and Mukhopadhyay, 2019; Rahman et al., 2023; Ullah and Zhang, 2020; Hussain et al., 2021).
In recent years, researchers have developed various approaches to analyze flood risk. Some prominent approaches include the analytical hierarchy process (AHP) (Dou et al., 2018; Vojtek and Vojteková, 2019), fuzzy logic, and genetic algorithms (Hong et al., 2018), variable fuzzy theory (Guo et al., 2014) hydrological forecasting systems (Abbaszadeh, 2016; Mehr and Nourani, 2017), random forest (Wang et al., 2015), artificial neural networks (ANNs) (Kia et al., 2012; Wang et al., 2015), adaptive neuro-fuzzy interface systems (Mukerji et al., 2009), logistic regression (Nandi et al., 2016), the weight of evidence (Khosravi et al., 2016a; Rahmati et al., 2016b), analytic network process (ANP) (Dano et al., 2019), statistical index (Cao et al., 2016), Shannon’s entropy (Haghizadeh et al., 2017), Copula-Based Bayesian Network [30], and frequency ratio models (Rahmati et al., 2016b). Among these methods, many researchers preferred AHP because it provides a structured framework for decision-making, allowing researchers to systematically compare and prioritize criteria or alternatives (Hussain et al., 2021). Moreover, AHP can handle complex decision scenarios, incorporating both quantitative and qualitative factors. The flexibility of AHP coupled with its mathematical foundation for credible results makes it a trusted method in flood risk assessment (Saaty, 1989; Saaty, 1980; Tayyab et al., 2021). Despite the extensive use of AHP in disaster studies, limited research has applied GIS-enabled AHP for flood hazard, vulnerability, and exposure mapping in Pakistan, particularly in the Swat River Catchment (SRC), a highly flood-prone region in the eastern Hindukush.
This study aims to assess flood risk in SRC, Pakistan. The region has experienced several devastating floods in recent years, including 2010, 2016, and 2022 floods (Rahman et al., 2023; Waseem et al., 2023). Despite higher vulnerability, there is a noticeable lack of research on flood risk assessment in this region. This study proposed three important main factors for the first time in the study area (flood hazard, vulnerability, and exposure), which are essential for assessing flood risk. Additionally, the application of an advanced methodology, specifically an integrated approach that combines GIS with the AHP, is vital for enhancing the effectiveness of flood risk mapping in the SRC, Pakistan. The results provide valuable insights for stakeholders to effectively manage flood risks and promote sustainable development in the SRC, Pakistan.
2 Materials and methods
2.1 Study area
SRC is located in Pakistan’s eastern Hindukush region, at 34°35′60″ to 35°43′52″ N latitude and 72°08′53″ to 72°30′50″ E longitude with a total population of 2,309,570 as per the 2017 census. The region has a total geographical area of 5215 km2, out of which 980 km2 is cultivated land and 4,200 km2 is uncultivated land (Figure 1). The northern regions of the valley have tall and snow-capped mountains with rugged terrain. The Swat River, originating in the Hindu Kush mountains, flows from the northern highlands to the southern plains (Khan et al., 2021b), and is formed when the Ushu and Gabral Rivers meet at Kalam. The Swat River flows through the entire Swat District, converging with the Panjkora River in District Dir Lower before discharging into the Kabul River near Nisatta in District Charsadda. The elevation of the basin in the northern region is approximately 5,800 m and it gradually descends to 710 m downstream in the Shamozai Valley.
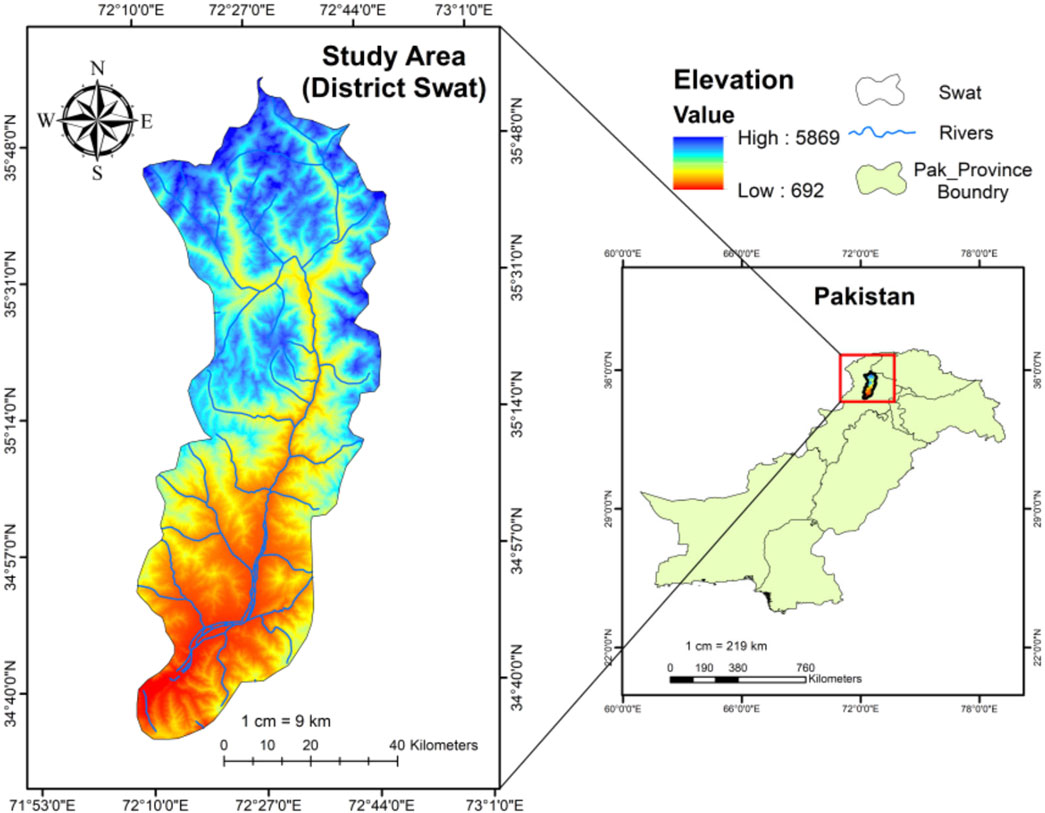
Figure 1. The study area of district Swat Pakistan, with digital elevation model (DEM).
The Swat River serves as a natural habitat for fish and birds, while also providing a source of irrigation and electricity. The study region exhibits a heightened susceptibility to flooding due to a confluence of factors, such as climate change, complex topography, and socioeconomic fragility (Ullah et al., 2021b; Rebi et al., 2023). The SRC in Pakistan is known to be one of the areas that is frequently affected by floods (Nasir et al., 2020). Devastating floods have historically plagued the area, causing significant physical and socioeconomic harm (Khan et al., 2021a). Monsoon rains in 2010, 2020 & 2022 caused floods in river Swat’s tributaries (Hussain et al., 2021; Hussain et al., 2023b). The water surge devastated the hilly areas and destroyed buildings, roads, bridges, agriculture, irrigation networks, infrastructure, and communication (Rahman et al., 2019; Islam et al., 2022). It has been reported that the 2010 floods resulted in the complete or partial destruction of 26 water channels, 988 houses, and the displacement of 2,751 households (Hussain et al., 2023b).
3 Methods overview
Flood risk assessment and mapping constitute indispensable components of disaster risk management, forecasting, prevention, and mitigation (Kelly et al., 2023). In the present study, parameters for assessing flood risk were selected across three components hazard, vulnerability, and exposure based on an extensive review of existing literature (Ibrahim et al., 2024; Rahman et al., 2023; Sun et al., 2023; Giurea et al., 2024; Nasir et al., 2020). Both primary and secondary data sources were utilized and the data were thoroughly analyzed to reflect the current conditions in the study area (Table 1).
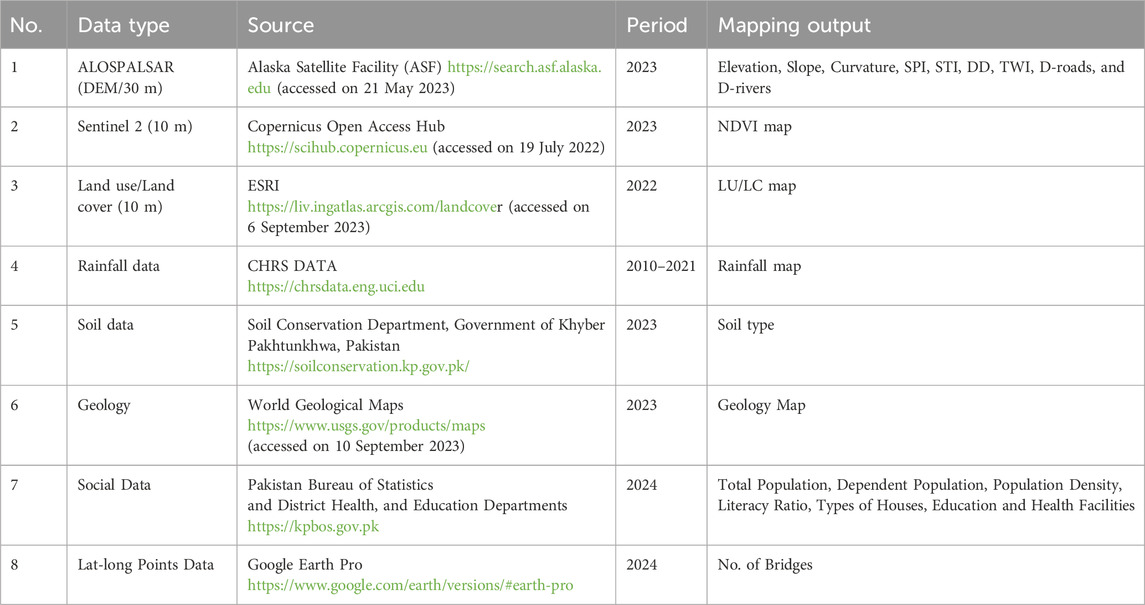
Table 1. List of data types and their sources used in this work.
The 22 indicators were carefully selected through a systematic process that involved analyzing established flood risk assessment techniques, incorporating expert input, and considering data accessibility and geographical relevance. The literature review confirmed that the chosen indicators align with commonly used frameworks for assessing flood risk, particularly those utilizing GIS and AHP. Consultations with hydrologists and catastrophe risk specialists further refined the selection by prioritizing the indicators based on their significance in evaluating flood hazard, vulnerability, and exposure.
For the hazard component, environmental parameters such as elevation, slope, rainfall, topographic wetness index (TWI), normalized difference vegetation index (NDVI), drainage density, soil types, geology, sediment power index (SPI), sediment transport index (STI), and curvature were included. A 30-m resolution digital elevation model (DEM) was used for slope analysis, elevation extraction, and stream ordering. Precipitation data were obtained from the Center for Hydrometeorology and Remote Sensing (CHRS) and analyzed for rainfall variability in the region (Data, 2021).
Vulnerability was assessed by incorporating socio-economic and infrastructural factors such as literacy rate, distance to roads, distance to streams, access to healthcare and educational facilities, and land use/land cover (LULC). For the exposure component, demographic and infrastructural indicators such as population density, dependent population, housing types, and number of bridges were considered.
A multi-criteria evaluation approach was applied using AHP to assign weights to the selected indicators, reflecting their relative significance in contributing to flood risk. These weights were used to prepare thematic layers in a GIS environment (Arc Map v10.8), resulting in three individual maps representing hazard, vulnerability, and exposure based on a weighted linear combination approach.
The flood risk map was then derived by integrating the weighted hazard, vulnerability, and exposure layers using the following Equation:
IPCC has provided valuable guidance for this research through its definitions. To suit the scope of this study, in terms of climate change, the risks are a result of the dynamic interaction between climate-related hazards, vulnerability, and exposure of the affected ecosystem or human population to such hazards (Allan et al., 2023).
The accuracy and reliability of the final flood risk map were validated through receiver operating characteristic (ROC) analysis, providing a quantitative evaluation of the model’s performance in identifying flood-prone areas. This methodology, supported by existing literature, enables a comprehensive assessment of flood risk by combining multi-criteria decision-making and GIS-based spatial analysis (Figure 2). represents the methodological framework employed in this study.
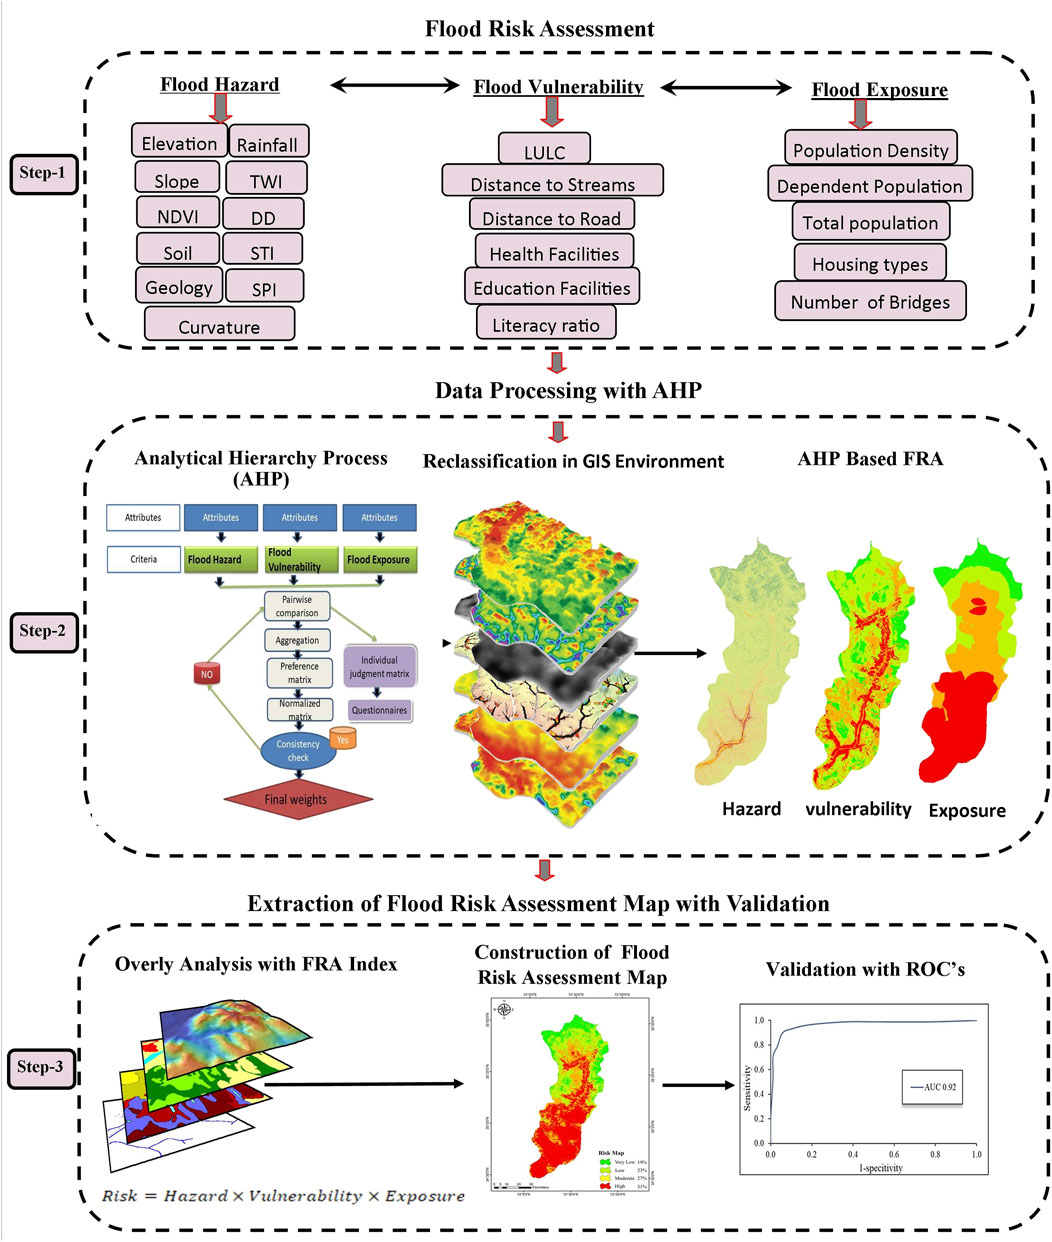
Figure 2. Flow chart of the adopted methodology for flood risk assessment in the SRC, Pakistan.
3.1 Flood hazard
A flood hazard can be generally defined as an event that has the potential to harm people and damage property, infrastructure, or the environment (Tsakiris, 2007). It generally involves the probability of a particular flood extent in an area that could be predetermined through various factors such as topography, hydrology, geology, and environment of a specific area (Ullah and Zhang, 2020; Waseem et al., 2023). The study area falls within a temperate climatic zone, receiving heavy monsoon rainfall in summer and snowfall in winter, which further increases the flood risk in the lower catchment areas. Apart from this, the study region is highly vulnerable due to the built and degraded environment, low socioeconomic status, unplanned urbanization, lack of an early warning system, and scientific risk assessment studies (Merz et al., 2014).
Several factors can influence the occurrence of flood hazards in a given area, emphasizing the importance of considering proper flood conditioning factors (Rahman et al., 2023). As a result, most of the researchers are conducting extensive studies on the relationship between prior hazard sites and local geo-environmental features (Ullah and Zhang, 2020). Based on the review of extensive relevant research (Rahman et al., 2019; Chakraborty and Mukhopadhyay, 2019; Rahman et al., 2023), this study considers 11 causative factors to assess flood hazard. These factors include elevation, rainfall, slope, TWI, NDVI, drainage density, soil properties, SPI, STI, geology of the area, and curvature. Each factor plays a distant role in the occurrence of floods in the study region, as described below.
Elevation is an important factor in flood hazard assessment, as low-lying areas are prone to flood and may inundate quickly because water often flows from high-altitude areas toward low-lying areas (Rahmati et al., 2016a). In comparison to high-elevated places, low-elevated areas have a higher likelihood of flooding (Elkhrachy, 2022). The elevation map was derived from the Advanced Space Borne Thermal Emission and Reflection Radiometer (ASTER) DEM. The map was divided into five categories and was based on the ASTER DEM (Figure 3a).
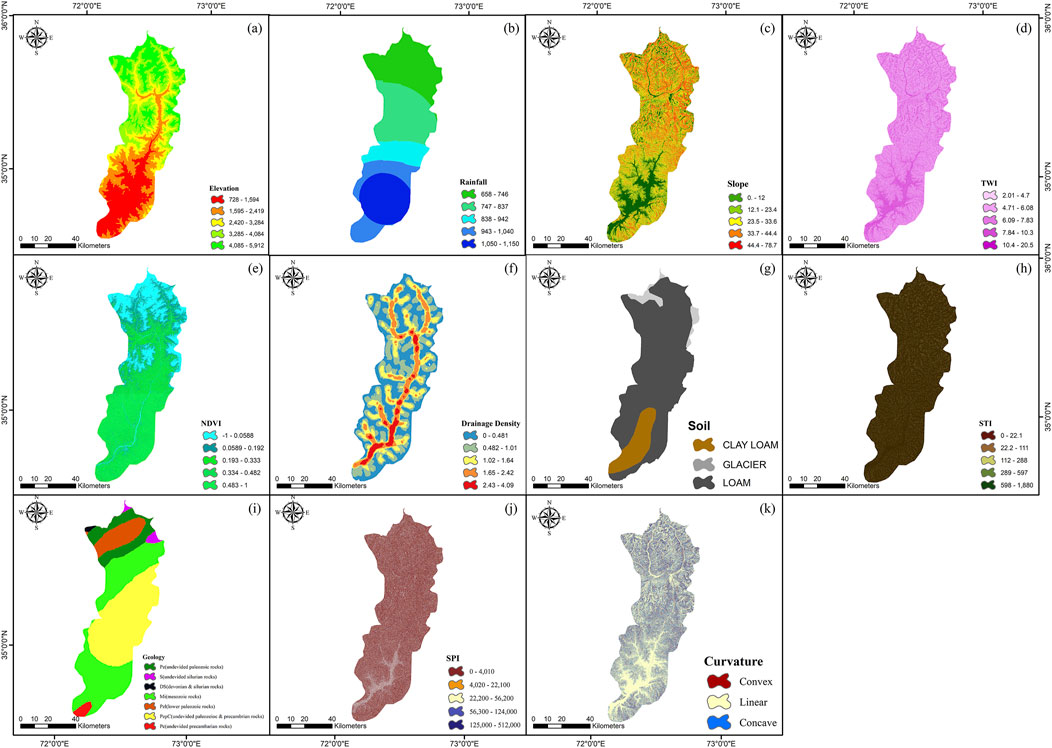
Figure 3. Causative factors of flood hazards used in this study; (a) elevation, (b) rainfall, (c) slope, (d) TWI, (e) NDVI, (f) drainage density, (g) soil, (h) STI, (i) Geology, (j) SPI, and (k) curvature.
Rainfall is another important variable that has a direct relationship with floods. The rainfall map was created from CHRS rainfall annual data from 2011 to 2022 (Figure 3b), which was classified into five classes using natural breaks. The slope is also an important variable in hydrological research since it regulates the strength of surface runoff and water flow, which can cause soil erosion and vertical infiltration (Khosravi et al., 2016b). We have observed that areas with higher slope gradients are less prone to flooding compared to areas with lower slope gradients. The slope map was created from ASTER DEM and classified into five classes, ranging from 0 to 78.7 (Figure 3c).
TWI is another essential element in mapping flood susceptibility (Rahman et al., 2023; Ullah and Zhang, 2020). This means that areas with high TWI are more likely to experience flooding, while those with low TWI are less likely to do so (Paul et al., 2019). Five classes were identified in the final TWI map, with sizes ranging from 2.01 to 20.5 (Figure 3d). TWI was calculated from the ASTER DEM using (Equation 2).
The symbol β denotes the gradient of the slope, while As refers to the area upstream that contributes to the flow.
NDVI is a crucial factor in assessing the susceptibility of an area to flooding (Rahman et al., 2023). The NDVI’s values fall between −1 and +1 (Sun et al., 2023). Positive values on the index denote locations with active plant cover, such as dense forests. Moreover, the numbers close to zero indicate dry areas, whereas negative values are usually connected to the sources of water. The NDVI Studies have shown that there is a negative correlation between floods and NDVI, which means that higher NDVI values indicate a lower probability of flooding (Ullah and Zhang, 2020) while lower NDVI values indicate a higher probability of flooding. The NDVI was calculated by using (Equation 3).
where, B8 means near-infrared band while B4 means red band. As shown in (Figure 3e), the results reveal a high probability of flooding in the studied area.
The drainage density measures how well or poorly streams empty a basin. Drainage density in watersheds is crucial for understanding runoff. Higher density is linked to larger peak flows and sediment loads. Spatial variations in density affect both surface and subsurface runoff. The drainage density positively correlates with flood risk (Das and Environment, 2019). Regions characterized by higher drainage densities exhibit a greater propensity for flooding, whereas areas with lower drainage densities are less likely to encounter flood events (Paul et al., 2019). The drainage of the SRC was calculated from ASTER DEM using (Equation 4).
Where drainage density is denoted by Dd, L is the sum of all stream lengths in the basin and A is the total area of the drainage basin (km). (Figure 3F)
Flooding is significantly influenced by the type of soil in an area. Sandy soil has less drainage capacity, which leads to rapid water absorption and increases the likelihood of flooding (Waseem et al., 2023). As sandy soils contain more pore space between their particles, they have higher saturated hydraulic conductivities compared to finer-surfaced soils, resulting in slower infiltration rates for clayey soils (Robinson and Ward, 1990). The type of soil in a region is very important because it determines how much water can be stored and how much can be used for agriculture or other purposes (Giertz et al., 2005). The composition and infiltration capacity of soil are critical factors in agricultural and urban growth, as they determine the availability of water for crops and other needs. As shown in (Figure 3g), the soil type in the study area is clay loam, glacier, and loam.
The method used to determine erosion and sedimentation rates is known as STI (Rahman et al., 2021). When evaluating landslides, debris flows, and flash floods in regions undergoing erosion and depositional processes, it is crucial to consider STI (Rahman et al., 2021). The following (Equation 5) has been used in calculating the class ranges from 0 to 1,880 m (Figure 3h).
where As means flow accumulation and sinβ is the slope.
Lithological units are essential to define the debris flows and soil erosion in each location (Pourghasemi and Kerle, 2016). Geological hazards in the study area include subsidence, landslides, debris flow, and floods. The lithological map and fault lines were digitized from the 1:100,000 scale geological map of Khyber Pakhtunkhwa Province obtained from the Geological Survey of Pakistan, as shown in (Figure 3i).
SPI quantifies the erosive force of water flows within a catchment region (Wang et al., 2023; Tehrany et al., 2014). The SPI map for the case study was generated using the ArcGIS environment and was subsequently divided into five classes as shown in (Figure 3j). The SPI was computed using followed Equation 6.
Where “As” denotes the specific catchment area in meters and
The curvature refers to the rate of change of slopes in a particular direction, and the values it produces provide information about the shape of the land (Rahman et al., 2023). The curvature map created using the ASTER DEM has three classes: concave, flat, and convex (Figure 3k). A positive value indicates a convex curvature, a negative value indicates an upward concave curvature and a zero value indicates a flat surface (Ullah and Zhang, 2020). Areas with zero values (flat surface) are more vulnerable to floods than those with convex and concave curvatures (Al Kuisi et al., 2024).
3.1.1 Flood vulnerability
Flood vulnerability can be defined as the propensity of a community, region, or ecosystem to adverse flood impacts (Hussain et al., 2021). Flood vulnerability is a multifaceted issue influenced by various factors such as socioeconomic conditions, geographic locations, infrastructure quality, and environmental factors (Ibrahim et al., 2024). Based on previous literature (Ullah et al., 2021a; Dandapat et al., 2017; Giurea et al., 2024), in this study, we considered several key factors such as LULC, distance to the streams and roads, availability of health and education facilities, and literacy ratio of the subject locality. Together, these factors create a comprehensive picture of flood vulnerability, highlighting the importance of integrating socio-economic considerations with environmental assessments to develop effective flood management strategies. These indicators data were collected from different sources and mapped as detailed below.
The primary indicator for vulnerability assessment is LULC, which reveals how people and natural processes use the land, influencing water runoff and flooding in catchment areas (Das and Environment, 2019; Khosravi et al., 2016b). LULC is very important in flood vulnerability assessment since it determines the state of the land and its infiltration capacity that affects the runoff and flood (Hussain et al., 2021; Samanta et al., 2018a). The Environmental Systems Research Institute (ESRI) 2022 data was used to create the LULC map of the study area (Karra et al., 2021; Tariq et al., 2023). The LULC map was further categorized into eight classes, namely, water, trees, crops, built-up areas, rangeland, snow, flooded vegetation, and barren land (Figure 4a).
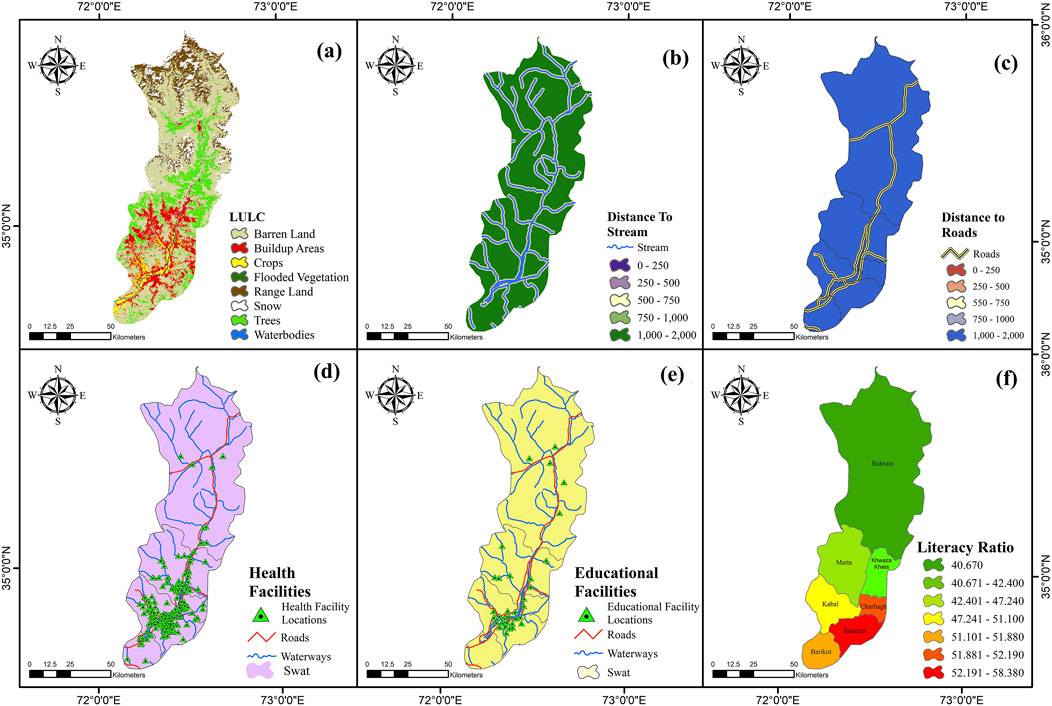
Figure 4. Flood vulnerability indicators used in this study; (a) LULC, (b) distance to stream, (c) distance to roads, (d) health facilities, (e) education facilities, and (f) literacy ratio.
Moreover, the distance to streams is another indicator in determining a community’s vulnerability to floods (Das and Environment, 2019). The areas that are close to active water channels may face higher flood risk as compared to those areas that are far away. To create proximity to the water map, the Euclidean distance tool was used in ArcGIS to compute the distance to the stream as shown in (Figure 4b). Furthermore, distance to roads becomes an important determinant in establishing the extent of exposure of infrastructure to floodwaters and how the latter interferes with the natural patterns of drainage (Ullah et al., 2022). Areas closer to roads are usually more vulnerable because of increased development and interference in the way that water flows, whereas regions farther away may encounter complications in evacuation and emergency response (Hussain et al., 2021). The Euclidean distance tool of ArcGIS was employed to generate the distance to the road map, as depicted in (Figure 4c).
In addition, the availability of health and education facilities further contributes to community resilience; well-equipped healthcare services are vital for responding to flood-related health issues, while educational institutions can promote awareness and preparedness among residents and vice versa (Zhran et al., 2024). Therefore, having access to health facilities is crucial in mitigating the negative effects of disasters (Hoque et al., 2019). Health facilities data was gathered from the district health department and mapped as shown in (Figure 4d).
On the other hand, the presence of educational facilities within a community can function as shelters or evacuation centers during disaster events, contributing to minimizing flood risk (Hoque et al., 2019). For example, school buildings are used as shelters, showcasing the community’s resilience while health services ensure that supplies and rescue personnel are easily accessible in the aftermath of a disaster (Shah et al., 2017; Hussain et al., 2021). The data on educational facilities was obtained from the Pakistan Bureau of Statistics and was subsequently mapped, as illustrated in (Figure 4e). Finally, the literacy ratio is another important factor that indicates how well-prepared people are to anticipate and cope with the disruptions caused by natural disasters (Zhran et al., 2024). A higher level of literacy generally means increased “access to information” for example, knowledge of early warning systems, knowledge of evacuation plans, and performance of necessary precautions to reduce overall vulnerability. While highly literate regions would thus have the capacity to gain and use information on the actions required in the event of disasters, less literate areas may hardly comprehend or put into proper practice the information related to disasters and hence be more vulnerable to flooding and slower in recovery processes. The necessary data for each tehsil was acquired from the Pakistan Bureau of Statistics, and a spatial layer was subsequently constructed within the GIS environment, as depicted in (Figure 4f).
3.1.2 Flood exposure
Flood exposure refers to the degree to which a community is subjected to catastrophic environmental stressors, such as floods (Poussard et al., 2021). To quantify flood exposure in the research area, the following characteristics are employed. The initial indicator of exposure in flood risk assessment is often population density (Cremen et al., 2022; Ming et al., 2022), so the population density of an area can be calculated by dividing its land area by the estimated number of residents living there, which is usually obtained from census data. Flood exposure is strongly associated with population density, with higher population densities leading to more people being impacted by catastrophic floods (Giurea et al., 2024). We generated information in the study area by focusing further on the tehsils level (Figure 5a). It is crucial to understand that floods can impact different groups of people in different ways.
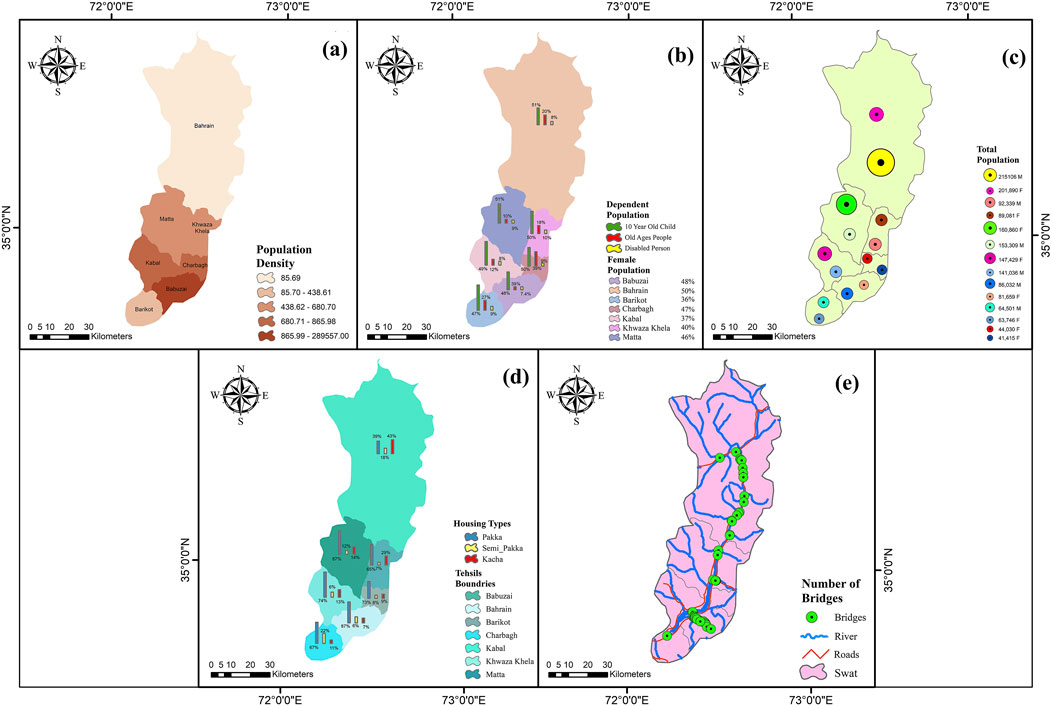
Figure 5. Flood exposure indicators used in this study; (a) population density, (b) dependent population, (c) total population, (d) housing types, and (e) number of bridges.
Vulnerable populations, including children, the elderly, and women, may be disproportionately at-risk during flooding events. Physically, children, the elderly, and women may not be as equipped to handle the risk of flooding. Children may be too small and inexperienced to navigate flood waters safely, while the elderly may struggle with mobility issues (Hoque et al., 2019). Children also may not have the knowledge or resources to protect themselves, while the elderly may be socially isolated and lack support systems (Hussain et al., 2021). Women may be physically weaker and therefore less able to deal with the challenges posed by flooding. Furthermore, they may face cultural or social barriers that prevent them from accessing resources or information that could help them cope with flooding. In addition to physical challenges, these groups may also face social obstacles during floods (Figure 5b). It’s important to take these exposures seriously and to ensure that everyone is prepared for the impact of floods. By understanding the unique challenges faced by exposed groups, we can take steps to minimize their risk and protect their safety.
The third significant indicator that has been identified is the total population of the entire study area. This information is presented in (Figure 5c), highlighting the number of people living in the study area focusing further on each tehsil and the overall number of males and females (Hussain et al., 2021). Housing types are another important indicator for assessing flood exposure, the study area has several housing types, including pacca, semi-pacca, and kacha houses (Ullah et al., 2021a; Giurea et al., 2024). However, it depends on how the house is constructed, as pacca houses will be less exposed, semi-pacca will be at moderate risk but kaccha houses in the study area are always at high risk during heavy rainfall and flooding (Hussain et al., 2023c). The data was collected from the Pakistan Bureau of Statistics census, subsequently analyzed using Microsoft Excel, and ultimately classified using ArcGIS (Figure 5d).
The final and most significant indicator for flood exposure in the research region is the number of bridges. Several bridges were lost in the 2010 flash flooding, mainly due to the debris in the rapid waters (Bazai et al., 2024). The debris was primarily composed of uprooted trees of various sizes, tree branches, and lumber logs. The destabilization of the sloping portions of the plant and subsoil layer caused the accumulation of debris (Farooq et al., 2019). The mountainous watershed systems in Northern Pakistan work together to transfer water to rivers, which then flow downstream. There is a significant concern about the number of bridges in the research region that are highly exposed to flooding. This concern is based on past events, such as the 2010 flash flooding that resulted in the loss of several homes and bridges (Shah et al., 2020). Recently, on 29 August 2020, a flash flood caused by heavy rainfall in the Shagram torrent of the SRC, destroyed over six bridges, 45 dwellings, and 14 fatalities (Nasir et al., 2020). This has raised concerns about the safety of the bridges in Khohistan (Nasir et al., 2020). The data was manually gathered from Google Earth Pro with precise latitude and longitude points and then converted in ArcGIS for additional mapping and displaying on a map, as shown in (Figure 5e).
3.2 Data standardization and index creation
3.2.1 Analytical hierarchy process
AHP is a multi-criteria decision-making method used to assess and rank choices. Created by Saaty in the 1970s, it serves as a framework for evaluating both tangible and intangible criteria (Saaty, 1987). The approach employs pairwise comparison matrices and algorithms to establish the relative importance of various criteria (Saaty, 1989). The criteria weighting process in AHP involved experts from diverse fields, including hydrology, disaster management, and GIS, who conducted pairwise comparisons of indicators to assess their relative importance. To ensure the reliability of expert judgments, the CR was calculated for each response. Comparisons with a CR exceeding the 0.1 threshold were flagged, and experts were asked to revise their inputs to improve consistency. The final weights were aggregated using the geometric mean method, which minimizes the influence of extreme values and ensures a balanced representation of expert opinions. Numerous disciplines, including the fields of hydrology, economics, education, transport, resource allocation, and management, heavily rely on this approach (Busico et al., 2019; Ejaz et al., 2024), Apart from this, several flood risk assessment studies have recently utilized it (Ha et al., 2023; Ibrahim et al., 2024; Al Kuisi et al., 2024; Sun et al., 2023). The core principle of this method is to transform subjective assessments into quantitative data by assigning scores to different criteria and sub-criteria, leveraging the insights of experts (Le Cozannet et al., 2013; Tayyab et al., 2021). In this study, we took experts from the relevant fields, i.e., hydrology and disaster management purely based on their basic knowledge of the subject matter. This method is based on five steps; identifying criteria, structuring the hierarchy, pairwise comparisons, aggregating scores, and decision making (Supplementary Figure S1). To follow these steps, in the first stage, we identified criteria for each component of risk, i.e., flood hazard, vulnerability, and exposure. After doing this step, then we made a hierarchy structure, with broader categories at the top and specific factors at the bottom to make it fit expert comparison based on Saaty 1 to 9 point scale of importance, as shown in (Supplementary Table S1).
Numerical weights have been assigned to each criterion based on comparisons, indicating their relative significance in evaluating flood risk (Table 2). To prevent biases or inconsistencies in these comparisons, the consistency index (CI) and CR are calculated using Equations 7, 8, respectively.

Table 2. Consistency indexes for randomly generated matrix.
Where ʎmax is the order of the matrix, the variable ʎmax represents the aggregate summation of each column in the matrix employed for pairwise comparison and the corresponding average value derived from the normalized matrix.
The variable “CI” represents the consistency index, while “RI” denotes the random index. CR is deemed acceptable if it falls below or is equal to 0.10. The CR is calculated by dividing the CI by the RI, with the RI values referenced in (Table 2).
The CR values for hazard, vulnerability, and exposure are 0.0868, 0.0564, and 0.00578, respectively, based on the number of criteria used in various research studies. These values are acceptable, indicating the validity of the evaluation. In this study, AHP was utilized to generate weighting factors (wi), and subsequently, each dimension map was created using Equations 9–11.
Where, FHaz, FVul, and FExp represent flood hazard, flood vulnerability, and flood exposure respectively, while
Following the calculation of each risk component, the respective scores were spatially distributed through overlay analysis within ArcGIS to generate maps representing hazard, vulnerability, and exposure. These maps were subsequently reclassified into four distinct categories (very low, low, moderate, and high) utilizing the “Reclass” tool within the Spatial Analyst extension, employing the natural breaks (Jenks) method. The flood risk map was constructed using (Equation 1), leveraging the raster calculator in ArcGIS, and was subsequently reclassified into four categories: very low, low, moderate, and high.
3.2.2 Index validation
The primary objective of risk mapping is to delineate locations, which are susceptible to flooding. Researchers employ a variety of models to study flood risk, but it is critical to validate the accuracy of the flood risk assessment model (Shafizadeh-Moghadam et al., 2018; Ullah and Zhang, 2020). The ROC approach is commonly used to validate prediction maps (Tehrany et al., 2013). Furthermore, this method is uncomplicated and produces unambiguous and reliable results (Tayyab et al., 2021). This technique has been used in numerous studies to validate the results (Ullah et al., 2022; Hossain and Mumu, 2024).
4 Results
4.1 Flood hazard assessment
For flood hazard assessment, we used eleven indicators (Figure 6a). The results show that elevation is the most important factor while assessing flood hazard risk with an importance value of (0.21), followed by rainfall (0.16), slope (0.14), TWI (0.09), NDVI (0.09), drainage density (0.07), soil (0.060), STI and geology (0.04), SPI (0.03) and curvature (0.020), respectively.
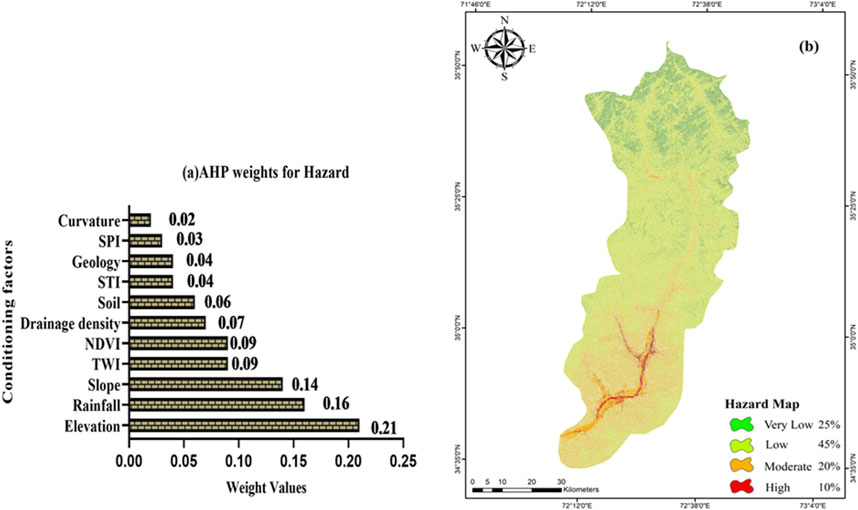
Figure 6. Flood hazard assessment in SRC, Pakistan; (a) AHP weights for flood causative factors and (b) flood distribution map with different flood hazard zones.
The flood hazard map was categorized into four distinct classes, as illustrated in (Figure 6b). The results show that 25% of the study area is safe from flood hazards, while 45% of the region exhibits low susceptibility to flood hazards. The very low to low susceptible areas mostly spread over north, northeast, and some central areas, which are far away from the active channels, and thus have no or low risk of flooding. It is noteworthy that the majority of the local population resides in elevated mountainous regions and depends upon the plains to fulfill their daily needs. As a result, the indirect effects of flooding cannot be ignored in these locations. On the other hand, 30% of the study area shows moderate to high susceptibility to flood. The moderate to high flood-susceptible areas stretch over the south, southeast, and southwest, which exhibit low slopes and low elevations with dense populations. The increased flooding susceptibility in these areas is due to factors, such as low elevation, heavy rainfall, and proximity to water bodies and roads (Sun et al., 2023). Typically, the SRC experiences substantial rainfall during both the summer and winter seasons (Ullah et al., 2021b; Khan et al., 2020; Abbas et al., 2023; Hussain et al., 2023a), resulting in snow melting and flash floods with high intensity in low-lying and adjacent areas.
These results are consistent with previous studies (Ullah and Zhang, 2020; Hussain et al., 2023c; Rahman et al., 2023), which found that flooding is more likely in flat areas with high flow accumulation and minimal runoff. Heavy rains have significantly increased flow and sediment in the river catchment, raising the flood risk in those regions (Tehrany et al., 2014; Ullah et al., 2022). The findings also indicate that areas with gentle slopes and close-to-water bodies are especially prone to flooding, while high-elevation regions with substantial rainfall are less directly affected.
4.2 Flood vulnerability assessment
Beyond the evaluation of flood hazards, we conducted a comprehensive assessment of the study area’s vulnerability to flooding by employing six key indicators: land use and land cover (LULC), distance to streams, distance to roads, health facilities, educational facilities, and literacy ratio. As illustrated in (Figure 7a), LULC emerged as the most critical factor in assessing flood vulnerability, with an importance value of (0.29) followed by distance to streams (0.25), distance to roads (0.19), health facilities (0.11), educational facilities (0.08) and literacy ratio (0.04). The flood vulnerability map shows that 39% of the study area has very low flood vulnerability, while 15% falls into a low vulnerability category. Most of these lower vulnerability areas are located along the eastern and western edges of the study area (Figure 7b). The reasons behind the very low to low flood vulnerability of these areas could be densely vegetated and far away from active water channels (Figures 4a, b). Conversely, 46% of the study area is categorized as having moderate to high flood vulnerability. Predominantly, these regions are situated on the southeast and southwest sides of the area (Figure 7b). These areas are at high flood risk due to their proximity to active water channels and dense human settlements with low access to basic facilities, like hospitals and schools.
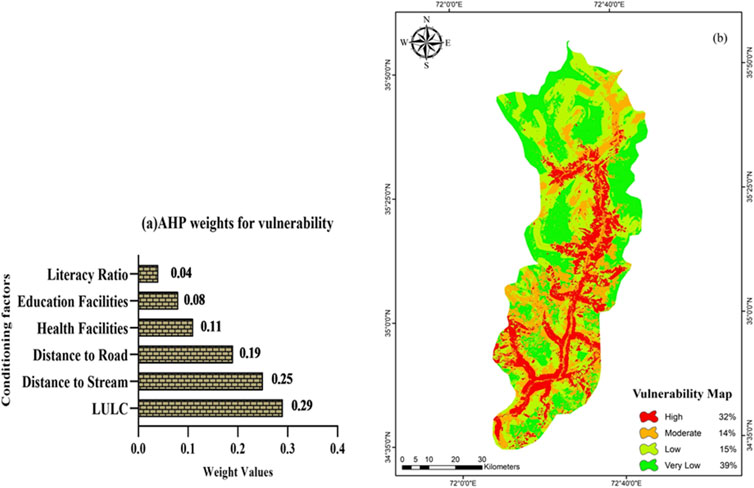
Figure 7. Flood vulnerability assessment in the SRC, Pakistan; (a) AHP weight for vulnerability intensifying factors and (b) flood vulnerability map with different vulnerable zones.
It should be noted that the most important factors for moderate to high vulnerability in the study area are LULC, distance to streams and roads as well as non-availability of basic facilities, like no schools and hospitals. Our results are consistent with other studies (Ibrahim et al., 2024; Ali et al., 2023; Hussain et al., 2021; Sun et al., 2023), implying that certain land uses, such as urban areas with impervious surfaces, like concrete and asphalt, can increase runoff during heavy rainfall, increasing the vulnerability of flooding. Similarly, agricultural practices that remove natural vegetation can reduce soil’s absorption capacity, hence exacerbating flooding risk (Hussain et al., 2021). Moreover, combining the above-mentioned factors amplifies the vulnerability to flooding, especially in areas where urbanization and poor land management practices intersect with proximity to roads and water channels (Ibrahim et al., 2024).
4.3 Flood exposure assessment
The flood exposure mapping and assessment provided valuable insights into how flood risk is distributed and its extent within the study area. Exposure in this study is assessed using various indicators, including population density, dependent population, total population, housing types, and the number of bridges. The AHP results shows that population density is the most crucial factor in evaluating flood exposure, with an importance value of 0.34 (Figure 8a). It is followed by dependent population (0.28), total population (0.17), housing types (0.11), and the number of bridges (0.07). The flood exposure mapping reveals that 40% of the target region is lying on very low to low exposure to flooding, which stretches from north to northwest and east sides of the study area. The study findings indicate that the north side of the study area has a very low population density and is less exposed to potential risks. However, the dependent population in this area is exposed, with additional indicators such as 8% of ten-year-old children, 20% of elderly people, 8% of disabled people, and 50% of the female population (Figure 5b).
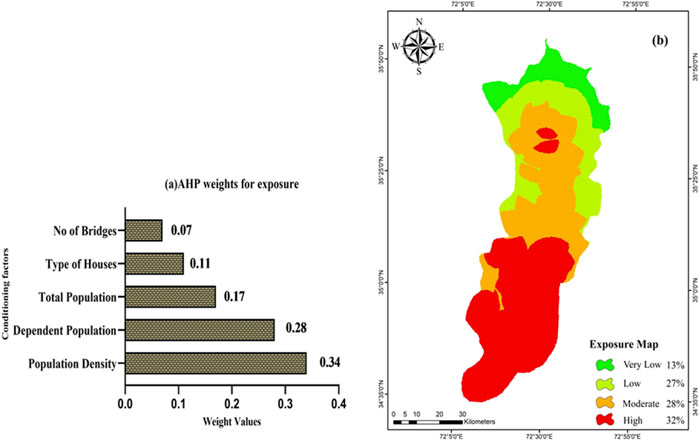
Figure 8. Flood exposure assessment in the SRC, Pakistan; (a) AHP weights for exposure factors and (b) flood exposure map with different exposure zones.
The study area has 23.08 million of the total population while the housing styles in the area are 39% pacca, 18% semi-pakka, and 43% kacha. On the other hand, the bridges in the region are located in the path of water flow, making them highly exposed to floods. When floods occur in this area, both the population and bridges are at risk of significant disruption, which can lead to difficulties in accessing critical resources and services. Further examination in the area revealed that certain groups, such as children, the elderly, and women, may lack specialized information on how to respond effectively in such circumstances (Hossain, 2015). This lack of knowledge further increases their exposure.
(Figure 8b) shows the significant flood exposure observed in the eastern-southern, eastern-western, and western-southern directions. It highlights the population density, total population, dependent population, housing types, and number of bridges in each tehsil within the research area. During community visits and surveys, it was discovered that educated people having knowledge of flood early warming, were less exposed as compared to uneducated people who had no idea about early warning and were highly exposed to flooding Besides, the housing types in the study area, which were constructed as pakka were less exposed while those which were semi-pakka were highly exposed. Furthermore, during surveys, it was also found that bridges in the study area were highly exposed during flooding. The findings of this study align with previous research (Hussain et al., 2023c), which identified high population density, low flood risk awareness, a high proportion of the dependent population, total population, type of houses, and the number of bridges as significant factors that exacerbate a community’s exposure to floods.
4.4 Flood risk map
The final flood risk map was generated by overlaying the three main weighted maps hazard, vulnerability, and exposure using the raster overlay technique. The map was then reclassified into four categories using the natural breaks (Jenks) method within the Spatial Analyst tool. The results indicate that 42% of the area is classified within very low to low flood-risk zones (Supplementary Table S2), which are mostly located in the north, northwest, and northeast parts of the SRC (Figure 9). Moreover, 27% of the region falls within the moderate flood risk category, primarily situated along the river and within mountainous terrain. Notably, the high velocity of streams in these mountainous areas heightens the risk of flood susceptibility, vulnerability, and exposure for nearby communities. This area is adjacent to active water channels, mainly located in the northern, northwestern, and northeastern parts of the study region. Additionally, it is important to highlight that approximately 31% of the area, is identified with significant flood risk (Supplementary Table S2). Most of the settlements in this area are situated along river banks, which make them highly vulnerable to flooding. This area is prone to hazard, high vulnerability, and high exposure, as shown in (Figures 6B, 7B, 8B). The high flood risk area extends from west to east, west to south, and east to south.
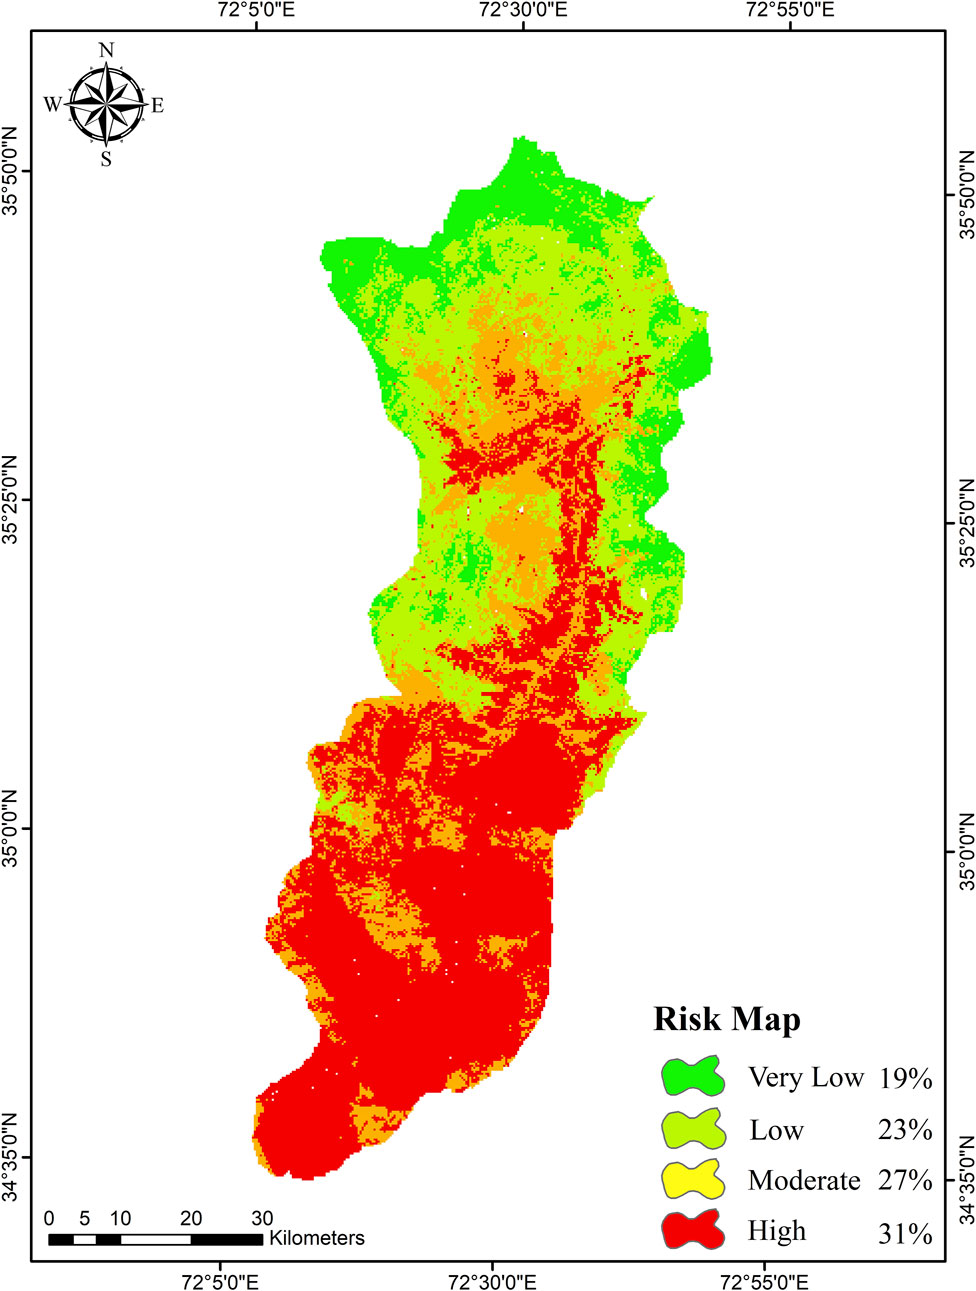
Figure 9. Flood risk map with different risk zones of the SRC, Pakistan.
4.5 Flood risk assessment validation
To validate the performance of our model, we used Receiver Operating Characteristic (ROC) curve analysis and the Area Under the Curve (AUC) as evaluation metrics. ROC curves are commonly employed to assess a model’s ability to distinguish between different classes, while AUC provides a single value that summarizes the model’s overall discriminative ability. This approach has been used in several studies to ensure the robustness of flood prediction models (Kelly et al., 2023; Hossain and Mumu, 2024). In our study, a total of 300 locations were used, consisting of 150 flooded and 150 non-flooded sites. The AUC value of 0.92 was derived by comparing the model’s predictions with actual flood occurrences in the validation dataset, indicating excellent predictive accuracy (Figure 10). The high AUC value reflects strong agreement between the predicted flood locations and the observed flood events.
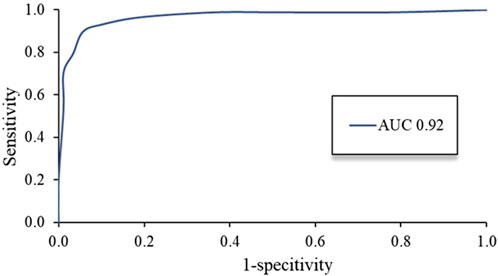
Figure 10. Validation of the model performance in flood risk mapping based on receiver operating characteristics (ROC) curve and area under curve (AUC).
5 Discussion
Climate change is driving an increase in the frequency and intensity of hydro-meteorological events, significantly impacting human wellbeing (Quesada-Román and Campos-Durán, 2023; Hussain et al., 2023a; Zhang et al., 2023; Zhang et al., 2024). Among these events, flooding is one of the most prevalent and destructive natural disasters, inflicting severe environmental damage and resulting in hundreds of fatalities globally each year. A thorough flood risk assessment is crucial for identifying areas vulnerable to flooding (Ullah and Zhang, 2020).
In this study, we evaluated flood risk in the SRC, Pakistan by integrating three critical components: flood hazard, vulnerability, and exposure, utilizing a GIS-based AHP. Our findings indicate that factors such as elevation, rainfall, and slope are the most important factors, influence flood hazard in the study area. This aligns with previous studies (Rahman et al., 2023; Hossain and Mumu, 2024; Mshelia et al., 2024), emphasizing the importance of meteorological and topographical factors in assessing flood hazards. The high flood zones are characterized by low altitudes, high rainfall, and steep slopes. The interplay of these factors heightens the risk, as lower altitudes tend to collect water from surrounding higher elevations. When combined with significant rainfall, this accumulation leads to increased water volume. Additionally, the steep slopes facilitate rapid runoff, further exacerbating flood risk in these areas (Ullah et al., 2019a; Ullah et al., 2019b). Conversely, areas with moderate to high flood susceptibility are predominantly located in flatter, densely populated regions, whereas those with very low to low susceptibility are mainly found at higher elevations with lower population densities. This observation reflects a typical pattern wherein low-elevation, high-density areas are more vulnerable to flooding due to runoff accumulation. This aligns with a common scenario in which areas with low elevation and high population density are more susceptible to flooding due to the accumulation of runoff (Tehrany et al., 2014).
The assessment of flood vulnerability revealed that LULC, proximity to streams and roads, and access to basic amenities are critical determinants of vulnerability in the study region (Hossain and Paul, 2018). Our findings indicate that regions situated near water bodies, characterized by high LULC vulnerability and limited access to essential services, are particularly susceptible to flooding and its impacts. This is consistent with prior research (Dandapat et al., 2017; Hussain et al., 2021; Aslam et al., 2020; Kelly et al., 2023), which emphasizes that the interplay among LULC characteristics, proximity to water sources, and availability of infrastructure significantly shapes flood vulnerability.
Furthermore, the flood exposure assessment highlighted population density and the presence of dependent populations as the most influential factors affecting exposure to flood risks. These findings align with earlier studies (Tayyab et al., 2021; Kelly et al., 2023), emphasizing that areas with high population densities and larger numbers of dependent populations, such as children and the elderly, are more exposed to flooding. The study underscores that communities with dense populations and a high number of dependents are at greater risk of flooding, particularly in regions lacking adequate flood response and preparation systems. This highlights the necessity of incorporating demographic information into flood risk assessments and planning.
A flood risk map was developed by combining flood hazard, vulnerability, and exposure data. Using the natural breaks (Jenks) approach, the map was categorized into four levels: very low, low, moderate, and high, with expert judgment applied for refinement. The results showed that 31% of the study area is at high flood risk, mainly in densely populated areas near active water channels. This finding supports previous research and aligns with historical flood records from 2010 to 2022. In contrast to previous studies that examined a limited number of characteristics usually around nine (Waseem et al., 2023; Rahman et al., 2023), this study takes into account 22 parameters, which makes the study findings more robust and reliable. This broader approach enables a more thorough and precise evaluation of flood risk. By improving forecast accuracy and enhancing disaster management plans, this methodology is consistent with recent advancements in flood risk analysis.
To mitigate flood risk, it is essential to improve LULC management through sustainable urban planning, reforestation, and eco-friendly agricultural practices. Establishing buffer zones along water bodies and enhancing road designs for better drainage can effectively reduce flood vulnerability associated with proximity. Additionally, upgrading infrastructure through improved drainage systems, flood control structures, and emergency services is crucial. Public education campaigns and community engagement initiatives can enhance awareness and preparedness, while leveraging technology for early warning systems and geospatial monitoring, along with enforcing building codes and offering financial incentives can further bolster flood resilience in these regions (Khan et al., 2022; Khosravi et al., 2016a; Das, 2018). The study is comprehensive but still needs additional research. Future investigations that incorporate climate change forecasts can provide valuable insights into how evolving scenarios such as altered precipitation patterns, increased rainfall intensity, and rapid snowmelt may heighten flood vulnerability by disrupting the hydrological cycle (Rahman et al., 2024; Ibrahim et al., 2025).
Furthermore, more research is essential to understand how deforestation, urbanization, and changes in land use affect natural water flow and contribute to increased surface runoff. Lastly, engaging the community and integrating indigenous knowledge into flood risk assessments could enhance the effectiveness of flood management strategies.
6 Conclusion
This study utilizes a GIS-based AHP framework to assess flood risk in the SRC, Pakistan, by examining exposure, vulnerability, and hazard through 22 indicators. Our comprehensive analysis spans an area of 5,215 km2, revealing a significant level of flood risk, unlike previous studies that concentrated on smaller areas or focused exclusively on hazard variables. According to the validated flood risk map, 31% of the study area is classified as high-risk, 27% as moderate risk zones, and 23% as low-risk. Within the high-risk zones, 32% of this risk arises from exposure and 32% from vulnerability. Our results underscore the importance of adopting a more holistic approach that integrates both structural and non-structural interventions. These include check dams, drainage enhancements, flood protection embankments, enforcement of strict zoning regulations to control settlement patterns, the modernization of critical infrastructure with flood-resistant designs, and the adoption of nature-based solutions, like upstream reforestation and wetland restoration. Moreover, disaster preparedness should focus on enhancing early warning systems, providing targeted alerts for high-risk urban areas (i.e., Mingora and Barikot), and deploying real-time hydrological sensors along the Swat River. The flood risk map should be integrated into land-use planning by local governments to facilitate the evacuation of residents from floodplains and guide urban growth toward safer areas.
Data availability statement
Publicly available datasets were analyzed in this study. This data can be found here: The supporting used in this article can be accessed from these open sources. The remote sensing data used in the article can be found on the websites https://search.asf.alaska.edu, The sentinel-2 data can be obtained from https://scihub.copernicus.eu, The Census data can be found in http://www.pbs.gov.pk on request, The other socioeconomic related data can found on www.kpbos.gov.pk. The rainfall data can be found on the website of https://chrsdata.eng.uci.edu. The field data that support the findings of this study are available on request from the corresponding author.
Author contributions
NK: Conceptualization, Data curation, Formal Analysis, Investigation, Methodology, Software, Visualization, Writing–original draft. HA: Funding acquisition, Resources, Writing–review and editing. SB: Project administration, Resources, Supervision, Writing–review and editing. MH: Methodology, Writing–review and editing. MT: Formal Analysis, Validation, Writing–review and editing. SU: Methodology, Writing–review and editing. KU: Writing–review and editing. SK: Data curation, Visualization, Writing–review and editing.
Funding
The author(s) declare that financial support was received for the research and/or publication of this article. This research was supported by Researchers Supporting Project number (RSP2025R425), King Saud University, Riyadh, Saudi Arabia.
Acknowledgments
We thank the Center for Hydrometeorology and Remote Sensing (CHRS) for providing rainfall data and the United States Geological Survey (USGS) for ASTER DEM images. The authors acknowledge King Saud University, Riyadh, Saudi Arabia for supporting Article Processing Charges (APC). The authors also acknowledge the Pakistan Bureau of Statistics, the Soil Conservation, and Irrigation Department, Government of Khyber Pakhtunkhwa, Pakistan for providing the relevant data.
Conflict of interest
The authors declare that the research was conducted in the absence of any commercial or financial relationships that could be construed as a potential conflict of interest.
Generative AI statement
The author(s) declare that no Generative AI was used in the creation of this manuscript.
Publisher’s note
All claims expressed in this article are solely those of the authors and do not necessarily represent those of their affiliated organizations, or those of the publisher, the editors and the reviewers. Any product that may be evaluated in this article, or claim that may be made by its manufacturer, is not guaranteed or endorsed by the publisher.
Supplementary material
The Supplementary Material for this article can be found online at: https://www.frontiersin.org/articles/10.3389/fenvs.2025.1567796/full#supplementary-material
References
Abbas, A., Ullah, S., Ullah, W., Waseem, M., Dou, X., Zhao, C., et al. (2022). Evaluation and projection of precipitation in Pakistan using the coupled model Intercomparison Project Phase 6 model simulations. Int. J. Climatol. 42, 6665–6684. doi:10.1002/joc.7602
Abbas, A., Ullah, S., Ullah, W., Zhao, C., Karim, A., Waseem, M., et al. (2023). Characteristics of winter precipitation over Pakistan and possible causes during 1981–2018. Water 15, 2420. doi:10.3390/w15132420
Abbaszadeh, P. (2016). Improving hydrological process modeling using optimized threshold-based wavelet de-noising technique. Water Resour. Manag. 30, 1701–1721. doi:10.1007/s11269-016-1246-5
Ali, A., Ullah, W., Khan, U. A., Ullah, S., Ali, A., Jan, M. A., et al. (2023). Assessment of multi-components and sectoral vulnerability to urban floods in Peshawar–Pakistan. Natural Hazards Research.
Al Kuisi, M., Al Azzam, N., Hyarat, T., and Farhan, I. (2024). Flood hazard and risk assessment of flash floods for Petra catchment area using hydrological and analytical hierarchy (AHP) modeling. Water 16, 2283. doi:10.3390/w16162283
Allan, R. P., Arias, P. A., Berger, S., Canadell, J. G., Cassou, C., Chen, D., et al. (2023). “Intergovernmental Panel on climate change (IPCC). Summary for policymakers,” in Climate change 2021: the physical science basis. Contribution of working group I to the sixth assessment report of the intergovernmental panel on climate change (Cambridge University Press), 3–32.
Aslam, H. M. U., Butt, A. A., Shabir, H., Javed, M., Hussain, S., Nadeem, S., et al. (2020). Climatic events and natural disasters of 21st Century: a Perspective of Pakistan. Int. J. Econ. Environ. Geol. 11, 46–54. doi:10.46660/ijeeg.vol11.iss2.2020.445
Bazai, N. A., Alam, M., Cui, P., Hao, W., Khan, A. P., Waseem, M., et al. (2024). Dynamics and impacts of monsoon-induced geological hazards: a 2022 flood study along the Swat River in Pakistan. Nat. Hazards Earth Syst. Sci. Discuss. 2024, 1–27. doi:10.5194/nhess-25-1071-2025
Billa, L., Shattri, M., Rodzi Mahmud, A., and Halim Ghazali, A. (2006). Comprehensive planning and the role of SDSS in flood disaster management in Malaysia. Disaster Prev. Manag. 15, 233–240. doi:10.1108/09653560610659775
Busico, G., Giuditta, E., Kazakis, N., and Colombani, N. (2019). A hybrid GIS and AHP approach for modelling actual and future forest fire risk under climate change accounting water resources attenuation role. Sustainability 11, 7166. doi:10.3390/su11247166
Calil, J., Beck, M. W., Gleason, M., Merrifield, M., Klausmeyer, K., and Newkirk, S. (2015). Aligning natural resource conservation and flood hazard mitigation in California. PLoS ONE 10, e0132651. doi:10.1371/journal.pone.0132651
Cao, C., Xu, P., Wang, Y., Chen, J., Zheng, L., and Niu, C. (2016). Flash flood hazard susceptibility mapping using frequency ratio and statistical index methods in coalmine subsidence areas. Sustainability 8, 948. doi:10.3390/su8090948
Chakraborty, S., and Mukhopadhyay, S. (2019). Assessing flood risk using analytical hierarchy process (AHP) and geographical information system (GIS): application in Coochbehar district of West Bengal, India. Nat. hazards 99, 247–274. doi:10.1007/s11069-019-03737-7
Charlton, R., Fealy, R., Moore, S., Sweeney, J., and Murphy, C. (2006). Assessing the impact of climate change on water supply and flood hazard in Ireland using statistical downscaling and hydrological modelling techniques. Clim. Change 74, 475–491. doi:10.1007/s10584-006-0472-x
Cremen, G., Galasso, C., and McCloskey, J. (2022). Modelling and quantifying tomorrow's risks from natural hazards. Sci. Total Environ. 817, 152552. doi:10.1016/j.scitotenv.2021.152552
Dandapat, K., and Panda, G. K. (2017). Flood vulnerability analysis and risk assessment using analytical hierarchy process. Earth Syst. Environ. 3, 1627–1646. doi:10.1007/s40808-017-0388-7
Dano, U. L., Balogun, A.-L., Matori, A.-N., Wan Yusouf, K., Abubakar, I. R., Said Mohamed, M. A., et al. (2019). Flood susceptibility mapping using GIS-based analytic network process: a case study of Perlis, Malaysia. Water 11, 615. doi:10.3390/w11030615
Das, S. (2018). Geographic information system and AHP-based flood hazard zonation of Vaitarna basin, Maharashtra, India. Arabian J. Geosciences 11, 576. doi:10.1007/s12517-018-3933-4
Das, S. (2019). Geospatial mapping of flood susceptibility and hydro-geomorphic response to the floods in Ulhas basin, India. Remote Sens. Appl. Soc. Environ. 14, 60–74. doi:10.1016/j.rsase.2019.02.006
Dou, X., Song, J., Wang, L., Tang, B., Xu, S., Kong, F., et al. (2018). Flood risk assessment and mapping based on a modified multi-parameter flood hazard index model in the Guanzhong Urban Area, China. Stoch. Environ. Res. Risk Assess. 32, 1131–1146. doi:10.1007/s00477-017-1429-5
Ejaz, N., Khan, A. H., Saleem, M. W., Elfeki, A. M., Rahman, K. U., Hussain, S., et al. (2024). Multi-criteria decision-making techniques for groundwater potentiality mapping in arid regions: a case study of Wadi Yiba, Kingdom of Saudi Arabia. Groundw. Sustain. Dev. 26, 101223. doi:10.1016/j.gsd.2024.101223
Elkhrachy, I. (2022). Flash flood water depth estimation using SAR images, digital elevation models, and machine learning algorithms. Remote Sens. 14, 440. doi:10.3390/rs14030440
Farooq, M., Shafique, M., and Khattak, M. S. (2019). Flood hazard assessment and mapping of River Swat using HEC-RAS 2D model and high-resolution 12-m TanDEM-X DEM (WorldDEM). Nat. Hazards 97, 477–492. doi:10.1007/s11069-019-03638-9
Giertz, S., Junge, B., and Diekkrüger, B. (2005). Assessing the effects of land use change on soil physical properties and hydrological processes in the sub-humid tropical environment of West Africa. Phys. Chem. Earth, Parts A/B/C 30, 485–496. doi:10.1016/j.pce.2005.07.003
Giurea, A., Comănescu, L., Dobre, R., Nedelea, A., and Mirea, I. (2024). Flood risk assessment using multi-criteria spatial analysis case study: Gilort river between Bălcești and Bolbocești. Water 16, 1760. doi:10.3390/w16131760
Guo, E., Zhang, J., Ren, X., Zhang, Q., and Sun, Z. J. N. h. (2014). Integrated risk assessment of flood disaster based on improved set pair analysis and the variable fuzzy set theory in central Liaoning Province, China. China 74, 947–965. doi:10.1007/s11069-014-1238-9
Ha, H., Bui, Q. D., Nguyen, H. D., Pham, B. T., Lai, T. D., and Luu, C. (2023). A practical approach to flood hazard, vulnerability, and risk assessing and mapping for Quang Binh province, Vietnam. Environ. Dev. Sustain. 25, 1101–1130. doi:10.1007/s10668-021-02041-4
Haghizadeh, A., Siahkamari, S., Haghiabi, A. H., and Rahmati, O. (2017). Forecasting flood-prone areas using Shannon’s entropy model. J. Earth Syst. Sci. 126, 39–11. doi:10.1007/s12040-017-0819-x
Hong, H., Panahi, M., Shirzadi, A., Ma, T., Liu, J., Zhu, A.-X., et al. (2018). Flood susceptibility assessment in Hengfeng area coupling adaptive neuro-fuzzy inference system with genetic algorithm and differential evolution. Sci. Total Environ. 621, 1124–1141. doi:10.1016/j.scitotenv.2017.10.114
Hoque, M. A.-A., Tasfia, S., Ahmed, N., and Pradhan, B. (2019). Assessing spatial flood vulnerability at Kalapara Upazila in Bangladesh using an analytic hierarchy process. Sensors 19, 1302. doi:10.3390/s19061302
Hossain, M. N. (2015). Analysis of human vulnerability to cyclones and storm surges based on influencing physical and socioeconomic factors: evidences from coastal Bangladesh. Int. J. disaster risk Reduct. 13, 66–75. doi:10.1016/j.ijdrr.2015.04.003
Hossain, M. N., and Mumu, U. H. (2024). Flood susceptibility modelling of the Teesta River Basin through the AHP-MCDA process using GIS and remote sensing. Nat. Hazards 120, 12137–12161. doi:10.1007/s11069-024-06677-z
Hossain, M. N., and Paul, S. K. (2018). Vulnerability factors and effectiveness of disaster mitigation measures in the Bangladesh coast. Earth Syst. Environ. 2, 55–65. doi:10.1007/s41748-018-0034-1
Hussain, A., Hussain, I., Ali, S., Ullah, W., Khan, F., Rezaei, A., et al. (2023a). Assessment of precipitation extremes and their association with NDVI, monsoon and oceanic indices over Pakistan. Atmos. Res. 292, 106873. doi:10.1016/j.atmosres.2023.106873
Hussain, A., Hussain, I., Ali, S., Ullah, W., Khan, F., Ullah, S., et al. (2023b). Spatiotemporal temperature trends over homogenous climatic regions of Pakistan during 1961–2017. Theor. Appl. Climatol. 153, 397–415. doi:10.1007/s00704-023-04484-3
Hussain, M., Tayyab, M., Ullah, K., Ullah, S., Rahman, Z. U., Zhang, J., et al. (2023c). Development of a new integrated flood resilience model using machine learning with GIS-based multi-criteria decision analysis. Urban Clim. 50, 101589. doi:10.1016/j.uclim.2023.101589
Hussain, M., Tayyab, M., Zhang, J., Shah, A. A., Ullah, K., Mehmood, U., et al. (2021). GIS-based multi-criteria approach for flood vulnerability assessment and mapping in district Shangla: khyber pakhtunkhwa, Pakistan. Pakistan 13, 3126. doi:10.3390/su13063126
Ibrahim, M., Huo, A., Ullah, W., Ullah, S., Ahmad, A., and Zhong, F. (2024). Flood vulnerability assessment in the flood prone area of Khyber Pakhtunkhwa, Pakistan. Front. Environ. Sci. 12, 1303976. doi:10.3389/fenvs.2024.1303976
Ibrahim, M., Huo, A., Ullah, W., Ullah, S., and Xuantao, Z. (2025). An integrated approach to flood risk assessment using multi-criteria decision analysis and geographic information system. A case study from a flood-prone region of Pakistan. Front. Environ. Sci. 12, 1476761. doi:10.3389/fenvs.2024.1476761
Islam, F., Riaz, S., Ghaffar, B., Tariq, A., Shah, S. U., Nawaz, M., et al. (2022). Landslide susceptibility mapping (LSM) of Swat District, Hindu Kush Himalayan region of Pakistan, using GIS-based bivariate modeling. Environ. Inf. Remote Sens. 10, 1027423. doi:10.3389/fenvs.2022.1027423
Karra, K., Kontgis, C., Statman-Weil, Z., Mazzariello, J. C., Mathis, M., and Brumby, S. P. (2021). “Global land use/land cover with Sentinel 2 and deep learning,” in 2021 IEEE international geoscience and remote sensing symposium IGARSS (IEEE), 4704–4707.
Kelly, M., Schwarz, I., Ziegelaar, M., Watkins, A. B., and Kuleshov, Y. (2023). Flood risk assessment and mapping: a case study from Australia’s Hawkesbury-Nepean catchment. Hydrology 10, 26. doi:10.3390/hydrology10020026
Khan, I., Ali, A., Waqas, T., Ullah, S., Ullah, S., Shah, A. A., et al. (2022). Investing in disaster relief and recovery: a reactive approach of disaster management in Pakistan. Int. J. Disaster Risk Reduct. 75, 102975. doi:10.1016/j.ijdrr.2022.102975
Khan, I., Lei, H., Shah, A. A., Khan, I., and Muhammad, I. (2021a). Climate change impact assessment, flood management, and mitigation strategies in Pakistan for sustainable future. Environ. Sci. Pollut. Res. 28, 29720–29731. doi:10.1007/s11356-021-12801-4
Khan, I., Waqas, T., Samiullah, , and Ullah, S. (2020). Precipitation variability and its trend detection for monitoring of drought hazard in northern mountainous region of Pakistan. Arabian J. Geosciences 13, 698–718. doi:10.1007/s12517-020-05700-4
Khan, W., Naqvi, S., Ahmad, N., Kamal, M., Hassan, H., Noor, A., et al. (2021b). Prevalence of rhabdochoniasis in snow trout of river Swat and river Panjkora, Khyber Pakhtunkhwa province, Pakistan. Braz J. Biol. 82, e238874. doi:10.1590/1519-6984.238874
Khosravi, K., Nohani, E., Maroufinia, E., and Pourghasemi, H. R. (2016a). A GIS-based flood susceptibility assessment and its mapping in Iran: a comparison between frequency ratio and weights-of-evidence bivariate statistical models with multi-criteria decision-making technique. Nat. hazards 83, 947–987. doi:10.1007/s11069-016-2357-2
Khosravi, K., Pourghasemi, H. R., Chapi, K., and Bahri, M. (2016b). Flash flood susceptibility analysis and its mapping using different bivariate models in Iran: a comparison between Shannon’s entropy, statistical index, and weighting factor models. Environ. Monit. Assess. 188, 656–721. doi:10.1007/s10661-016-5665-9
Kia, M. B., Pirasteh, S., Pradhan, B., Mahmud, A. R., Sulaiman, W. N. A., and Moradi, A. (2012). An artificial neural network model for flood simulation using GIS: Johor River Basin, Malaysia. Environ. Earth Sci. 67, 251–264. doi:10.1007/s12665-011-1504-z
Le Cozannet, G., Garcin, M., Bulteau, T., Mirgon, C., Yates, M. L., Méndez, M., et al. (2013). An AHP-derived method for mapping the physical vulnerability of coastal areas at regional scales. Nat. Hazards Earth Syst. Sci. 13, 1209–1227. doi:10.5194/nhess-13-1209-2013
Mehr, A. D., and Nourani, V. (2017). A Pareto-optimal moving average-multigene genetic programming model for rainfall-runoff modelling. Environ. Model. and Softw. 92, 239–251. doi:10.1016/j.envsoft.2017.03.004
Merz, B., Aerts, J., Arnbjerg-Nielsen, K., Baldi, M., Becker, A., Bichet, A., et al. (2014). Floods and climate: emerging perspectives for flood risk assessment and management. Nat. Hazards Earth Syst. Sci. 14, 1921–1942. doi:10.5194/nhess-14-1921-2014
Ming, X., Liang, Q., Dawson, R., Xia, X., and Hou, J. (2022). A quantitative multi-hazard risk assessment framework for compound flooding considering hazard inter-dependencies and interactions. J. Hydrology 607, 127477. doi:10.1016/j.jhydrol.2022.127477
Mshelia, Z. H., Nyam, Y. S., Moisès, D. J., and Belle, J. A. (2024). Geospatial analysis of flood risk hazard in Zambezi Region, Namibia. Environ. Challenges 15, 100915. doi:10.1016/j.envc.2024.100915
Mukerji, A., Chatterjee, C., and Raghuwanshi, N. (2009). Flood forecasting using ANN, neuro-fuzzy, and neuro-GA models. J. Hydrologic Eng. 14, 647–652. doi:10.1061/(asce)he.1943-5584.0000040
Nandi, A., Mandal, A., Wilson, M., and Smith, D. (2016). Flood hazard mapping in Jamaica using principal component analysis and logistic regression. Environ. Earth Sci. 75, 465–516. doi:10.1007/s12665-016-5323-0
Nasir, M. J., Iqbal, J., and Ahmad, W. (2020). Flash flood risk modeling of swat river sub-watershed: a comparative analysis of morphometric ranking approach and El-Shamy approach. Arabian J. Geosciences 13, 1082–1119. doi:10.1007/s12517-020-06064-5
Paul, G. C., Saha, S., and Hembram, T. K. (2019). Application of the GIS-based probabilistic models for mapping the flood susceptibility in Bansloi sub-basin of Ganga-Bhagirathi river and their comparison. Remote Sens. Earth Syst. Sci. 2, 120–146. doi:10.1007/s41976-019-00018-6
Pourghasemi, H. R., and Kerle, N. (2016). Random forests and evidential belief function-based landslide susceptibility assessment in Western Mazandaran Province, Iran. Environ. Earth Sci. 75, 185–217. doi:10.1007/s12665-015-4950-1
Poussard, C., Dewals, B., Archambeau, P., and Teller, J. (2021). Environmental inequalities in flood exposure: a matter of scale. Front. Water 3, 633046. doi:10.3389/frwa.2021.633046
Quesada-Román, A., and Campos-Durán, D. (2023). Natural disaster risk inequalities in Central America. Pap. Appl. Geogr. 9, 36–48. doi:10.1080/23754931.2022.2081814
Rahman, A.-u., Mahmood, S., Dawood, M., Rahman, G., and Chen, F. (2019). “Impact of climate change on flood factors and extent of damages in the Hindu Kush Region,” in Oxford research Encyclopedia of natural hazard science.
Rahman, M., Chen, N., Elbeltagi, A., Islam, M. M., Alam, M., Pourghasemi, H. R., et al. (2021). Application of stacking hybrid machine learning algorithms in delineating multi-type flooding in Bangladesh. J. Environ. Manag. 295, 113086. doi:10.1016/j.jenvman.2021.113086
Rahman, M., Shufeng, T., Tumon, M. S. H., Hossain, M. A., Kim, H.-J., Islam, M. M., et al. (2024). Multi-hazard could exacerbate in coastal Bangladesh in the context of climate change. J. Clean. Prod. 457, 142289. doi:10.1016/j.jclepro.2024.142289
Rahman, Z. U., Ullah, W., Bai, S., Ullah, S., Jan, M. A., Khan, M., et al. (2023). GIS-based flood susceptibility mapping using bivariate statistical model in Swat River Basin, Eastern Hindukush region, Pakistan. Front. Environ. Sci. 11. doi:10.3389/fenvs.2023.1178540
Rahmati, O., Haghizadeh, A., Pourghasemi, H. R., and Noormohamadi, F. J. N. H. (2016a). Gully erosion susceptibility mapping: the role of GIS-based bivariate statistical models and their comparison. Nat. Hazards 82, 1231–1258. doi:10.1007/s11069-016-2239-7
Rahmati, O., Pourghasemi, H. R., and Zeinivand, H. (2016b). Flood susceptibility mapping using frequency ratio and weights-of-evidence models in the Golastan Province, Iran. Geocarto Int. 31, 42–70. doi:10.1080/10106049.2015.1041559
Rebi, A., Hussain, A., Hussain, I., Cao, J., Ullah, W., Abbas, H., et al. (2023). Spatiotemporal precipitation trends and associated Large-scale Teleconnections in northern Pakistan. Atmosphere 14, 871. doi:10.3390/atmos14050871
Saaty, T. L., (1987). Highlights and critical points in the theory and application of the analytic hierarchy process. European. J. Operat. Res. 74 (3), 426–447. doi:10.1016/0377-2217(94)90222-4
Saaty, T. L. (1989). “Group decision making and the AHP,” in The analytic hierarchy process: applications and studies, 59–67.
Samanta, R. K., Bhunia, G. S., Shit, P. K., and Pourghasemi, H. R. (2018a). Flood susceptibility mapping using geospatial frequency ratio technique: a case study of Subarnarekha River Basin, India. Model. Earth Syst. Environ. 4, 395–408. doi:10.1007/s40808-018-0427-z
Samanta, S., Pal, D. K., and Palsamanta, B. (2018b). Flood susceptibility analysis through remote sensing, GIS and frequency ratio model. Appl. Water Sci. 8, 66. doi:10.1007/s13201-018-0710-1
Scheuer, S., Haase, D., and Volk, M. (2017). Integrative assessment of climate change for fast-growing urban areas: Measurement and recommendations for future research. PLoS ONE 12, e0189451. doi:10.1371/journal.pone.0189451
Shafizadeh-Moghadam, H., Valavi, R., Shahabi, H., Chapi, K., and Shirzadi, A. (2018). Novel forecasting approaches using combination of machine learning and statistical models for flood susceptibility mapping. J. Environ. Manag. 217, 1–11. doi:10.1016/j.jenvman.2018.03.089
Shah, A. A., Ye, J., Abid, M., and Ullah, R. (2017). Determinants of flood risk mitigation strategies at household level: a case of Khyber Pakhtunkhwa (KP) province, Pakistan. Nat. Hazards J. Int. Soc. Prev. Mitig. Nat. Hazards 88, 415–430. doi:10.1007/s11069-017-2872-9
Shah, S. M. H., Mustaffa, Z., Teo, F. Y., Imam, M. A. H., Yusof, K. W., and Al-Qadami, E. H. H. (2020). A review of the flood hazard and risk management in the South Asian Region, particularly Pakistan. Sci. Afr. 10, e00651. doi:10.1016/j.sciaf.2020.e00651
Sun, X., Jin, K., Tao, H., Duan, Z., and Gao, C. (2023). Flood risk assessment based on Hydrodynamic model—a case of the China–Pakistan economic corridor. Water 15, 4295. doi:10.3390/w15244295
Syed, A., Zhang, J., Rousta, I., Olafsson, H., Ullah, S., Moniruzzaman, M., et al. (2022). Statistical analysis of precipitation variations and its forecasting in Southeast Asia using remote sensing images. Front. Environ. Sci. 10, 832427. doi:10.3389/fenvs.2022.832427
Tariq, A., and Mumtaz, F. (2023). Modeling spatio-temporal assessment of land use land cover of Lahore and its impact on land surface temperature using multi-spectral remote sensing data. Environ. Sci. Pollut. Res. 30, 23908–23924. doi:10.1007/s11356-022-23928-3
Tayyab, M., Zhang, J., Hussain, M., Ullah, S., Liu, X., Khan, S. N., et al. (2021). Gis-based urban flood resilience assessment using urban flood resilience model: a case study of peshawar city, khyber pakhtunkhwa, Pakistan. Remote Sens. 13, 1864. doi:10.3390/rs13101864
Tehrany, M. S., Lee, M.-J., Pradhan, B., Jebur, M. N., and Lee, S. (2014). Flood susceptibility mapping using integrated bivariate and multivariate statistical models. Environ. Earth Sci. 72, 4001–4015. doi:10.1007/s12665-014-3289-3
Tehrany, M. S., Pradhan, B., and Jebur, M. N. (2013). Spatial prediction of flood susceptible areas using rule based decision tree (DT) and a novel ensemble bivariate and multivariate statistical models in GIS. J. hydrology 504, 69–79. doi:10.1016/j.jhydrol.2013.09.034
Toosi, A. S., Calbimonte, G. H., Nouri, H., and Alaghmand, S. (2019). River basin-scale flood hazard assessment using a modified multi-criteria decision analysis approach: a case study. J. Hydrology 574, 660–671. doi:10.1016/j.jhydrol.2019.04.072
Tsakiris, G. (2007). Practical application of risk and hazard concepts in proactive planning. European Water, 19 (20), 47–56.
Ullah, F., Shah, S. A. A., Saqib, S. E., Yaseen, M., and Haider, M. S. (2021a). Households’ flood vulnerability and adaptation: Empirical evidence from mountainous regions of Pakistan. Int. J. Disaster Risk Reduct. 52, 101967. doi:10.1016/j.ijdrr.2020.101967
Ullah, K., Wang, Y., Fang, Z., Wang, L., and Rahman, M. (2022). Multi-hazard susceptibility mapping based on Convolutional neural networks. Geosci. Front. 13, 101425. doi:10.1016/j.gsf.2022.101425
Ullah, K., and Zhang, J. (2020). GIS-based flood hazard mapping using relative frequency ratio method: a case study of Panjkora River Basin, eastern Hindu Kush, Pakistan. PLoS ONE 15, e0229153. doi:10.1371/journal.pone.0229153
Ullah, S., You, Q., Ali, A., Ullah, W., Jan, M. A., Zhang, Y., et al. (2019a). Observed changes in maximum and minimum temperatures over China-Pakistan economic corridor during 1980–2016. Atmos. Res. 216, 37–51. doi:10.1016/j.atmosres.2018.09.020
Ullah, S., You, Q., Ullah, W., Ali, A., Xie, W., and Xie, X. (2019b). Observed changes in temperature extremes over China–Pakistan Economic Corridor during 1980–2016. Int. J. Climatol. 39, 1457–1475. doi:10.1002/joc.5894
Ullah, W., Karim, A., Ullah, S., Rehman, A.-U., Bibi, T., Wang, G., et al. (2023). An increasing trend in daily monsoon precipitation extreme indices over Pakistan and its relationship with atmospheric circulations. Front. Environ. Sci. 11, 1228817. doi:10.3389/fenvs.2023.1228817
Ullah, W., Wang, G., Lou, D., Ullah, S., Bhatti, A. S., Ullah, S., et al. (2021b). Large-scale atmospheric circulation patterns associated with extreme monsoon precipitation in Pakistan during 1981–2018. Atmos. Res. 253, 105489. doi:10.1016/j.atmosres.2021.105489
Vojtek, M., and Vojteková, J. (2019). Flood susceptibility mapping on a national scale in Slovakia using the analytical hierarchy process. Water 11, 364. doi:10.3390/w11020364
Wang, Z., Chen, X., Qi, Z., and Cui, C. (2023). Flood sensitivity assessment of super cities. Sci. Rep. 13, 5582. doi:10.1038/s41598-023-32149-8
Wang, Z., Lai, C., Chen, X., Yang, B., Zhao, S., and Bai, X. (2015). Flood hazard risk assessment model based on random forest. J. Hydrology 527, 1130–1141. doi:10.1016/j.jhydrol.2015.06.008
Waseem, M., Ahmad, S., Ahmad, I., Wahab, H., and Leta, M. K. (2023). Urban flood risk assessment using AHP and geospatial techniques in swat Pakistan. SN Appl. Sci. 5, 215 doi:10.1007/s42452-023-05445-1
Zhang, J., and Chen, Y. (2019). Risk assessment of flood disaster induced by typhoon rainstorms in Guangdong province, China. Sustainability 11, 2738 doi:10.3390/su11102738
Zhang, Y., You, Q., Chen, C., Wang, H., Ullah, S., and Shen, L. (2024). Characteristics of flash droughts and their association with compound meteorological extremes in China: observations and model simulations. Sci. Total Environ. 916, 170133. doi:10.1016/j.scitotenv.2024.170133
Zhang, Y., You, Q., Ullah, S., Chen, C., Shen, L., and Liu, Z. (2023). Substantial increase in abrupt shifts between drought and flood events in China based on observations and model simulations. Sci. Total Environ. 876, 162822. doi:10.1016/j.scitotenv.2023.162822
Zhran, M., Ghanem, K., Tariq, A., Alshehri, F., Jin, S., Das, J., et al. (2024). Exploring a GIS-based analytic hierarchy process for spatial flood risk assessment in Egypt: a case study of the Damietta branch. Environ. Sci. Eur. 36, 184–225. doi:10.1186/s12302-024-01001-9
Keywords: flood risk assessment, GIS, AHP, Swat River Catchment, Pakistan
Citation: Khan NA, Alzahrani H, Bai S, Hussain M, Tayyab M, Ullah S, Ullah K and Khalid S (2025) Flood risk assessment in the Swat river catchment through GIS-based multi-criteria decision analysis. Front. Environ. Sci. 13:1567796. doi: 10.3389/fenvs.2025.1567796
Received: 29 January 2025; Accepted: 17 March 2025;
Published: 09 April 2025.
Edited by:
Chenghao Wang, University of Oklahoma, United StatesReviewed by:
Syed Hafizur Rahman, Jahangirnagar University, BangladeshMd Nazir Hossain, Ministry of Public Administration, Bangladesh
Copyright © 2025 Khan, Alzahrani, Bai, Hussain, Tayyab, Ullah, Ullah and Khalid. This is an open-access article distributed under the terms of the Creative Commons Attribution License (CC BY). The use, distribution or reproduction in other forums is permitted, provided the original author(s) and the copyright owner(s) are credited and that the original publication in this journal is cited, in accordance with accepted academic practice. No use, distribution or reproduction is permitted which does not comply with these terms.
*Correspondence: Shibiao Bai, c2hpYmlhb2JhaUBuam51LmVkdS5jbg==