 Yingfeng Kuang
 Xiaolong Chen
- 1Nanling Corridor Rural Revitalization Research Institute, Xiangnan University, Chenzhou, China
- 2Faculty of Humanities and Social Sciences, Macao Polytechnic University, Macao, China
Purpose: Urban forests play a key role in mitigating global warming and achieving carbon neutrality. This study aims to analyze and evaluate the spatial heterogeneity of forest carbon stocks in the Xiangjiang River Basin urban agglomeration. By constructing and comparing the ordinary least squares model (OLS) and four geographically weighted regression (GWR) models, it is hoped to provide a more reliable method for accurately estimating the spatial distribution of large-scale forest carbon stocks and provide a scientific basis for the construction of the Xiangjiang River Basin forest urban agglomeration.
Method: Based on the data of the 10th continuous forest resource inventory and climate data in Hunan Province, this study identified five key variables, including average breast diameter of the stand, stand density, average age of the stand, average tree height of the stand, and average annual precipitation. Utilizing SPSS V27 software and MGWR 2.2 software, the OLS model and four GWR models were constructed. By comparing the model fit and the results of the independent samples test, the optimal model, the MGWR (Gaussian) model, was selected to estimate the spatial distribution of forest carbon stocks in the Xiangjiang River Basin.
Results: The results show that the four GWR models outperform the OLS model in terms of model fit and independent samples test, particularly in estimating the spatial distribution of forest carbon stocks. The results of the spatial non-stationarity test indicate that the MGWR model better captures the spatial heterogeneity of variables. The estimated carbon stock per unit area of forest in the Xiangjiang River Basin using the MGWR (Gaussian) model is 31.162 t/hm2, exhibiting an overall pattern of high central values and low peripheral values. This finding provides a crucial scientific basis for the management and ecological protection of forest resources in the Xiangjiang River Basin.
Conclusion: This study effectively reflects the spatial relationship between forest carbon stocks and variables through the geographically weighted regression method and the selection of appropriate spatial kernel functions, enhances the estimation accuracy of the spatial distribution of large-scale forest carbon stocks, and accurately reveals the spatial distribution pattern of forest carbon stocks in the Xiangjiang River Basin. The study on forest carbon stocks in the urban agglomeration of the Xiangjiang River Basin holds significant implications for regional ecological security and climate change mitigation. It offers a scientific basis for the management and ecological protection of regional forest resources.
1 Introduction
With the acceleration of global climate change and urbanization, research on carbon storage in urban forests has received increasing attention (Guo et al., 2024; Zhao et al., 2023). As an important part of the terrestrial ecosystem, urban forests play an important role in sequestering carbon, releasing oxygen, and responding to climate change (Pati et al., 2024). During the urbanization process, large amounts of carbon dioxide emissions have a significant impact on global climate change. Urban forests serve as carbon sinks, absorbing atmospheric carbon dioxide through photosynthesis, converting it into biomass and storing it for long periods of time, thereby slowing down the rate of global warming (Mandal et al., 2022). Therefore, studies of carbon stocks in urban forests are critical to assess the climate change mitigation role of urban ecosystems. In addition, with the global pursuit of carbon neutrality goals, carbon storage management in urban forests has become one of the important ways to achieve this goal. Research on urban forest carbon storage not only helps us understand the service functions of urban ecosystems, but is also the key to achieving the goals of sustainable urban development and carbon neutrality (Pregitzer et al., 2022). Although cities emit large amounts of carbon dioxide to maintain rapid socio-economic development, urban green spaces also fix large amounts of carbon dioxide through plant photosynthesis and other pathways. Therefore, urban forests are an important component of the carbon sink in terrestrial ecosystems and their contribution to achieving carbon neutrality cannot be underestimated. Contributions (Gülçin and van Den Bosch, 2021; Singkran, 2022). The investigation of urban carbon sequestration represents a pivotal concern within the realms of global climate change and sustainable development. The precise quantification of carbon storage in urban forests has emerged as a prominent research focus both domestically and internationally, and serves as the fundamental basis for informed urban planning and managerial decision-making.
The rapid pace of urbanization, marked by the diminution of ecological land and a concomitant surge in carbon emissions, is poised to exacerbate global warming, thereby posing a grave threat to human survival and development. As one of the world’s preeminent carbon emitters, China’s commitment to addressing climate change and striving for carbon neutrality constitutes a momentous strategic decision (Zhao et al., 2022; Zhuo et al., 2022). In 2020, President Xi Jinping proposed that China will achieve carbon peak by 2030 and strive to achieve carbon neutrality by 2060. Forest ecosystems play an important role in absorbing and fixing atmospheric carbon dioxide. Their carbon sequestration accounts for two-thirds of the total carbon sequestration of terrestrial ecosystems and is considered one of the most effective ways to offset carbon dioxide emissions (Chen et al., 2022).
From the perspective of the Intergovernmental Panel on Climate Change (IPCC) reports, the world is facing severe climate challenges. The IPCC’s Sixth Assessment Report emphasizes the urgency of limiting global temperature rise to 1.5°C above pre - industrial levels to avoid the most catastrophic impacts of climate change. To achieve this goal, significant reduction in carbon dioxide emissions and enhancement of carbon sinks are essential. Urban forests, with their ability to sequester carbon, are crucial components in this global effort. For example, every additional ton of carbon stored in urban forests contributes to reducing the overall carbon load in the atmosphere, moving us closer to the IPCC’s target.
In relation to the United Nations Sustainable Development Goals (SDGs), specifically SDG 13 on Climate Action, which calls for urgent measures to combat climate change and its impacts. Understanding the spatial heterogeneity of forest carbon stocks in urban agglomerations, like the Xiangjiang River Basin, is directly relevant. It can provide scientific support for formulating effective urban forest management strategies, thereby enhancing the carbon sequestration capacity of urban forests and promoting the realization of SDG 13. This also aligns with other related SDGs, such as SDG 11 on Sustainable Cities and Communities, as well - managed urban forests can improve urban environmental quality and promote sustainable urban development.
As an important part of terrestrial ecosystems, forests effectively mitigate global warming by absorbing and storing carbon dioxide. This is mainly achieved by converting atmospheric carbon dioxide into organic matter through vegetation and soil in forests, and storing it in organisms and soil, thereby achieving carbon sequestration (Shi et al., 2022). As areas with concentrated populations and intense human activities, cities can emit 70% of the world’s total carbon dioxide emissions. Currently, urban carbon dioxide emissions have become the focus of global carbon reduction and low-carbon development, and forest carbon storage, as an important indicator for assessing ecosystem quality, can effectively reflect the CO2 absorption capacity of urban forests (Chen et al., 2024; Wang X. et al., 2021). Therefore, studying the aboveground carbon storage and spatial distribution of urban forests is of great significance to improving climate warming and achieving the dual carbon strategy.
Urban forests, as a vital carbon sink, exert a significant influence on the mitigation of global warming and the attainment of carbon neutrality objectives. The Changsha-Zhuzhou-Xiangtan urban agglomeration, situated within the Xiangjiang River Basin—one of China’s key river basins—holds considerable importance. The spatial distribution of forest carbon storage within this region is of paramount significance for comprehending and effectively responding to regional climate change. Research on forest carbon storage in the Xiangjiang River Basin urban agglomeration is urgent for regional ecological security and climate change response. With the acceleration of urbanization, urban forests, as important carbon sinks, play an important role in mitigating urban heat island effects, improving air quality, and reducing greenhouse gas emissions.
As one of the fastest-growing regions in China, Changsha-Zhuzhou-Xiangjiang River Basin Urban Agglomeration has rich forest resources, but it also faces challenges brought by rapid urbanization and economic development. Research on forest carbon storage in Xiangjiang River Basin Urban Agglomeration focuses on overall carbon storage and carbon storage per unit area, but ignores the spatial variability and distribution characteristics of forest carbon storage. Based on this, this study takes the Xiangjiang River Basin in Hunan Province as the study area, uses the data of the 10th continuous forest resource inventory in Hunan Province, constructs an ordinary least squares model and four geographically weighted regression models, and compares and selects the optimal estimation model to estimate the spatial distribution of forest carbon storage in the Xiangjiang River Basin, in order to provide a more reliable method for the accurate estimation of the spatial distribution of large-scale forest carbon storage, better measure the forest carbon absorption and storage capacity in the region, and provide a basis for guiding the construction of the Xiangjiang River Basin Forest Urban Agglomeration. In addition, the study of forest carbon storage in the Xiangjiang River Basin is of great significance for achieving China’s carbon neutrality goals, promoting ecological civilization construction and green development.
2 Literature review
As the “lungs of the city”, urban forests are an important part of urban greening and play an important carbon sink function. The carbon cycle and carbon storage of urban forests have become one of the important hotspots in urban ecological research in recent years.
At present, the carbon sink estimation of natural forests generally adopts: plot survey, estimating carbon storage by calculating biomass (Raihan et al., 2021); using remote sensing technology and model simulation to estimate forest carbon sink on a larger scale (Duarte et al., 2022; Odebiri et al., 2022). The above methods are also applied to the observation of urban forests, but each of the above methods has its own advantages and limitations. The plot inventory method has high accuracy, but the workload is large and it is limited by time and space; the eddy inventory method can achieve continuous and long-term observation, but the cost is high and the accuracy needs to be improved; the application of 3S technology provides a fast, economical and convenient method for the study of carbon storage (Raj and Jhariya, 2021; Arehart et al., 2021), which enables the research to break through the limitations of space and time and provides effective technical support for simulating and estimating regional carbon storage over a long period of time and on a large scale. However, there is still uncertainty in accuracy, so one or several methods can be combined to estimate the carbon sink of urban forests according to actual conditions.
North American countries recognized the importance of the carbon sink function of urban forests early on and developed relevant computer software, such as UFORE and City-green, to estimate the carbon storage and CO2 absorption function of urban forests (Zhuang et al., 2022). The application of the UFORE model requires a large number of sample plot surveys to obtain data on tree species composition, population structure, tree diameter at breast height and leaf area of urban forests, and to combine them with relevant meteorological data, atmospheric pollution conditions and other environmental factors for calculation. However, due to the complexity of the urban environment and the large workload of sample plot setting, it requires a lot of investment; City-green is a tool based on remote sensing technology that is relatively easy to use (Liao et al., 2021), but at the urban scale, it only considers the forest area and ignores the differences in tree species composition. At the same time, it uses the carbon sink function of general forest land as the basis, which affects the accuracy of the estimation.
Nowak summarized the research results on urban forests and applied remote sensing technology to establish a relationship model between the normalized difference vegetation index (NDVI) and forest biomass (Wani et al., 2021; Wang et al., 2022). NDVI is a remote sensing indicator that reflects the vegetation coverage status and is defined as the quotient of the difference between the reflectance of the near-infrared channel and the visible light channel and their sum. Biomass refers to the total amount of organic matter accumulated by an organism or community over a certain period of time. This method not only uses a smaller number of sample plots, but also can outline the distribution of biomass. This method has unique advantages for the more complex site environment of the city. Combining the UFORE model with remote sensing technology, Nowank et al. estimated the benefits of urban forests across the United States and in each state, including their carbon sequestration function (Shafique et al., 2020; Song et al., 2020). This is the first time in the world that urban forest functions have been measured at the national level.
Recently, the applications of GWR and MGWR models in carbon stock estimation have witnessed remarkable progress. For example, Costa et al. applied the GWR model to predict soil organic carbon (SOC) in the Brazilian southeastern mountainous region. They found that the GWR model could effectively capture the local spatial variation of SOC affected by terrain factors such as altitude and slope. By incorporating these spatial factors into the model, the estimation accuracy of SOC in different sub - regions was enhanced compared to traditional global regression models. Their study was published in the Journal of Environmental Quality (Costa et al., 2018). In the context of MGWR applications, Li et al. used the MGWR model to explore the spatial heterogeneity of the influencing factors of total CO2 emissions in 336 Chinese cities. Their results showed that the MGWR model could adaptively adjust the scale of influence of different variables. For instance, they revealed that the impact of GDP per capita, population, and the proportion of secondary industries on CO2 emissions was spatially heterogeneous (Li et al., 2021). Another study by Cheng et al. combined the MGWR model with remote sensing data to estimate forest carbon stocks in Yunnan Province, China. They integrated national forest resource inventory data and Landsat eight multispectral remote sensing imagery and used the MGWR model to account for the spatial heterogeneity of forest structure and environmental factors. This approach not only improved the accuracy of forest carbon stock estimation but also provided a more detailed spatial distribution map of carbon stocks, which could be used for targeted forest management and conservation strategies (Cheng et al., 2024).
In recent years, Chinese researchers have begun to pay attention to the important role of urban forests in achieving low-carbon cities, and have used different techniques to estimate the benefits of urban forest carbon storage and CO2 absorption (Sun and Liu, 2020; Zhang Y. et al., 2020; Qiu et al., 2020), but have not yet involved the carbon storage function and distribution pattern of urban forests in different functional areas.
Numerous regional studies on forest carbon stocks in China’s urban agglomerations have been carried out. For example, in the Beijing - Tianjin - Hebei urban agglomeration, Zou et al. found that from 2001 to 2020, the carbon sequestration in this area steadily increased, with forests accounting for 55.0% of the change (Zou et al., 2022). Their research focused on the overall carbon sequestration trend but did not delve deep into the fine - scale spatial distribution characteristics. Kowkabi explored the carbon storage and sequestration of urban forests in the qanats of Tehran built - up areas. They revealed that the carbon storage and sequestration patterns exhibit noticeable spatial heterogeneity, yet their study area was limited to the built - up areas of a single city and did not consider the broader context of the urban agglomeration (Kowkabi, 2021). In the urban agglomeration on the northern slope of the Tianshan Mountains, research using the PLUS model and InVEST model showed that the carbon stock in this area had a continuous increasing trend from 2000–2020, and was closely related to land - use change (published in 2022) (Tao et al., 2022).
However, the complex terrain and climate in this region are quite different from those in the Xiangjiang River Basin, and the research methods and results cannot be directly applied to our study area.
Despite these valuable studies, there are still significant gaps. Existing research on forest carbon stocks in urban agglomerations in China often fails to comprehensively consider the spatial non - stationarity of various influencing factors, especially in regions like the Xiangjiang River Basin. The Xiangjiang River Basin has a unique geographical location, complex terrain, and a large - scale urban agglomeration with diverse land - use types. The relationships between forest carbon storage and factors such as topography, climate, and human activities in this area are spatially non - stationary. For instance, the impact of precipitation on forest growth and carbon storage may vary significantly in different parts of the basin due to the influence of mountains and rivers. Our study aims to fill this gap by applying advanced models like the Multiscale Geographically Weighted Regression (MGWR) model to accurately capture the spatial non - stationarity of factors affecting forest carbon stocks in the Xiangjiang River Basin urban agglomeration, providing a more in - depth and accurate understanding of the carbon storage distribution pattern in this region.
This paper selects the important Changsha-Zhuzhou-Xiangjiang River Basin urban agglomeration as the research object, constructs an ordinary least squares model and four geographically weighted regression models, and compares and selects the optimal estimation model to estimate the spatial distribution of forest carbon storage in the Xiangjiang River Basin, providing a scientific method for urban forest construction and function measurement.
3 Overview of the study area and data sources
3.1 Overview of the study area
The Xiangjiang River Basin is separated from the Poyang Lake system by the Mufu Mountains and Luoxiao Mountains on the border between Hunan and Jiangxi in the east, connected to Guangxi in the south by the Xiangjiang and Pearl River watershed from Jianghua, adjacent to Zishui River in the west across the Hengshan Mountains, and connected to Dongting Lake in the north. The landform types in the basin are complex and diverse, mainly mountainous and hilly, with the characteristics of hilly gentle slopes, mountain streams and rivers (Liu and Mao, 2020; Zhang P. et al., 2020).
The core area of the Changsha-Zhuzhou-Xiangjiang River Basin urban agglomeration (Figure 1) is located in the central and eastern part of Hunan Province (112°36′–113°16′E, 27°36′–28°33′N), with an area of about 8,448.18 km2. It has a typical subtropical monsoon climate, with hot summers, mild winters and distinct four seasons. The summer precipitation is sufficient, with an annual precipitation of about 1,400 mm, an average annual temperature of 16°C–18°C, a frost-free period of up to 279 days, and an average annual sunshine of 1726 h (Lu et al., 2020; Zhong and Elzarka, 2021). This area is the core growth area of Hunan Province’s economic development, a rapid urbanization development area in Hunan Province, and an important part of the Yangtze River Middle Reaches Urban Agglomeration (Deng et al., 2021).
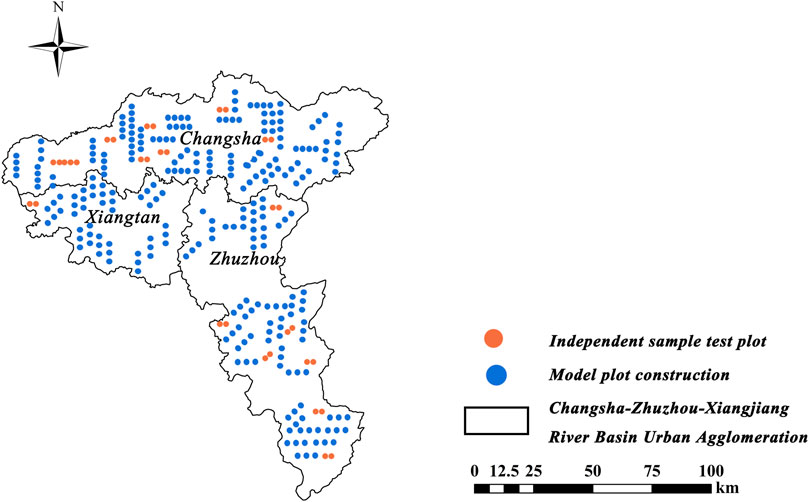
Figure 1. Schematic diagram of the Changsha-Zhuzhou-Xiangtan urban agglomeration and sample plot distribution in the Xiangjiang River Basin (The illustration was crafted utilizing ArcGIS software, version 10.2. For further reference, the URL link is provided: https://www.arcgis.com/index.html).
The Changsha-Zhuzhou-Xiangtan urban agglomeration is one of the most densely populated areas in Hunan Province, with a relatively high population density. According to the data from the sixth national census of Hunan Province, the population densities of Changsha, Zhuzhou and Xiangtan in 2010 were 791, 342 and 549 people per square kilometer respectively. With the rapid economic development, the economic aggregate of this urban agglomeration accounts for more than 40% of that of Hunan Province. Changsha is renowned for its construction machinery manufacturing, Zhuzhou is an important base for railway equipment manufacturing, and Xiangtan has developed strongly in the field of non-ferrous metal processing. However, the rapid economic development has also brought about relatively high carbon emissions. Therefore, the role of forest carbon sinks is particularly important.
In recent years, the forest coverage rate of the Changsha-Zhuzhou-Xiangtan urban agglomeration has been on the rise. The forest coverage rate in Hunan Province has reached 53.15%. The Changsha-Zhuzhou-Xiangtan Green Heart area, as a key area for afforestation, has also seen a continuous increase in its forest coverage rate. For example, the forest coverage rate of Zhuzhou City has reached 61.96%. Despite this, due to urban expansion and industrial development, forest resources in some areas still face challenges. It is necessary to accurately grasp the spatial distribution of forest carbon storage in order to better manage and protect forest resources.
The core area contains the world’s largest urban agglomeration green core area, with the main timber forest species including Masson pine and Chinese fir, and economic forest species including tea oil, tung oil, citrus, etc. The roadside trees in the urban agglomeration are mostly camphor trees, and continuous large-area forests are mainly distributed in the suburbs of the city. Changsha, Zhuzhou and Xiangtan are distributed in a “品” shape along the Xiangjiang River, with the distance between them less than 40 km. The structure is compact, and the Xiangjiang River runs through the north and south. Mountains, forests and plains are evenly distributed, and the overall terrain is low (Wang L. et al., 2021; Ma et al., 2020).
3.2 Data source
The data comes from the “2021 China Forest and Grassland Ecological Comprehensive Monitoring and Evaluation Report” (Wang and Li, 2024). The results of the 10th National Forest Resources Inventory show that the national forest coverage rate has reached 24.02% (Qiao et al., 2024; Cai et al., 2024). The data related to forest coverage rate in this study differ from those in the “Third National Land Survey”. On the one hand, it is because the statistical standards of the two are different. This study may have covered the parts not included in the “Third National Land Survey”. On the other hand, different survey mapping scales will affect the data. This kind of difference is acceptable under the influence of multiple factors and will not change the core conclusion of this study on the spatial heterogeneity analysis of forest carbon storage in urban agglomerations in the Xiangjiang River Basin.
The data of 431 tree forest sample plots in the 10th continuous forest resource inventory in Hunan Province in 2021 are shown in Figure 1. These sample plots were selected with the intention of covering different land use types, including urban core areas, suburbs, and peri - urban forests in the Changsha - Zhuzhou - Xiangtan urban agglomeration. The continuous large - area forests are mainly distributed in the suburbs, while the urban core areas have urban forest vegetation such as roadside trees. The random selection of sample plots, as described above, helps to reduce sampling bias to some extent. However, due to the complexity and diversity of different land use types in the study area, there may still be some potential sampling biases. For example, forests in some special terrains or hard - to - reach areas (such as deep in the mountains) may be under - represented in the sample plots. In the urban core area, the complex land use types may not be fully covered by the sample plots. Overall, the sample selection method in this study has made efforts to balance representativeness and feasibility, but future research can further increase the sample size or optimize the sampling method to more comprehensively cover different land use types and reduce potential sampling biases.
The sample plot location is 25.8 m × 25.8 m 335 sample plots were randomly selected at a ratio of 4:1 to construct the model, and 96 sample plots were used for independent sample testing. The survey factors include sample plot location, altitude, slope, slope aspect, breast diameter, tree height, age, canopy density, etc. (Singh et al., 2024; Wang et al., 2024), and the breast diameter of the sample tree is 5 cm. The climate factor data comes from the climate AP 3.0 software developed by Canadian scholars. By inputting the latitude, longitude and altitude of the sample site, the annual climate data corresponding to the sample site from 2018 to 2023 can be obtained, and the 5-year average value is taken as the climate variable value of the sample site, including 17 climate variables (Soto et al., 2024; Yin et al., 2024; Zhang et al., 2024) such as average annual temperature, average annual precipitation, and relative humidity.
4 Materials and methods
4.1 Calculation of carbon storage in sample plots
There are large differences in carbon storage and carbon density among vegetation types in different forest communities. Trees are the main body of vegetation carbon storage, usually accounting for more than 90% of vegetation carbon storage. There are certain differences in the carbon sequestration capacity of different tree species. Broad-leaved forests have a higher total carbon sequestration than coniferous forests (Bhardwaj et al., 2024; Yang et al., 2023; Jia et al., 2023). This means that in the Changsha-Zhuzhou-Xiangtan urban agglomeration, the choice of forest tree species has a direct impact on carbon emissions, and broad-leaved forests may perform better in carbon sequestration. The main tree species of forests in the Changsha-Zhuzhou-Xiangtan urban agglomeration in the Xiangjiang River Basin are classified as shown in Table 1.
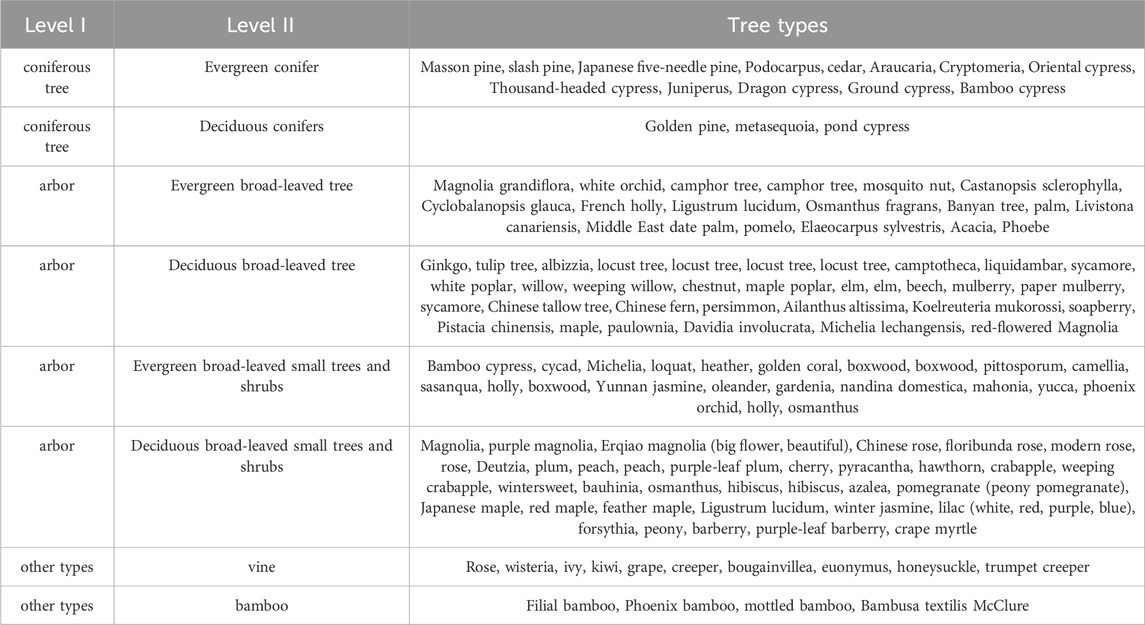
Table 1. Main tree species in the forests of the Changsha-Zhuzhou-Xiangtan urban agglomeration in the Xiangjiang River Basin (Deng et al., 2023; Wang et al., 2023).
As shown in Table 1, in the process of estimating the carbon storage of the sample plot, we first calculated the carbon storage of individual trees based on the single tree biomass model and the corresponding carbon content coefficient (Araza et al., 2023). This step involves calculating the aboveground and underground parts of individual trees separately. Specifically, we used published industry standards for standing tree biomass models and carbon accounting parameters for specific tree species (Volkov et al., 2023), which cover oak (Quercus spp.), Chinese fir (Cunninghamia lanceolata), Schima superba, cypress, slash pine (Pinus elliottii), Podocarpus, and Masson pine (Pinus massoniana). These models and parameters provide accurate biomass estimation methods for specific tree species, making the calculation of carbon storage more accurate.
For those tree species (groups) that do not yet have industry standards, we use the universal biomass model (Zeng et al., 2024; ZHANG et al., 2023; McClanahan et al., 2023) proposed by Zeng Weisheng and uniformly set the carbon content coefficient to 0.5. Formula 1 defines the aboveground biomass of a single tree. Formula 2 calculates the underground biomass for coniferous forests. Formula 3 provides the underground biomass for broad-leaved forests. Formula 4 computes the carbon storage of a single tree.
Where: Ma is the aboveground biomass of a single tree of the corresponding tree species; a and b are the model parameters of the single tree biomass; D is the breast height diameter of a single tree; Mb1 is the underground biomass of coniferous forest; Mb2 is the underground biomass of broad-leaved forest; C is the carbon storage of a single tree of the corresponding tree species; M is the whole plant biomass of the corresponding tree species (the sum of the aboveground biomass and the underground biomass); Ci is the carbon content coefficient of the corresponding tree species.
Formulas 2, 3 calculate underground biomass based on different tree species. The underground biomass calculation coefficients for coniferous forests and broad-leaved forests are different. The coefficient 0.0343 in formula 2 is a parameter in the empirical formula for calculating underground biomass in coniferous forests. It comes from the statistical and regression analysis of the relationship between coniferous forest biomass and breast diameter. The coefficient 0.0599 in formula 3 is a parameter in the empirical formula for calculating underground biomass in broad-leaved forests. It comes from the statistical and regression analysis of the relationship between broad-leaved forest biomass and breast diameter. Through formulas 2, 3, the underground biomass of a single tree can be estimated, and then the underground biomass of the entire plot can be calculated. These biomass data are very important for calculating forest carbon storage, because forest carbon storage includes carbon storage in both the aboveground and underground parts.
4.2 Optimal variable screening
Preliminarily screened statistically significant sample plot variables (10) and climate variables (11), and used SPSS V27 software to conduct stepwise regression and collinearity tests on the variables at the significance level a = 0.05 [variance inflation factor test (VIF)) less than 5] (Note: Variance inflation factor (VIF): This is an indicator to measure the severity of collinearity. The higher the VIF value, the more severe the collinearity and the more unstable the estimation of the regression coefficient. This is a commonly used As a rule, if the VIF value of a variable is greater than five or 10 (different researchers may use different thresholds), this variable is considered to have serious collinearity with other variables and may need to be removed or merged from the model). This process helps build a more robust and efficient statistical model.
According to the results of stepwise regression and collinearity test, five variables, namely, average diameter at breast height (ADBH), stand density (SD), average age of stand (ASA), average tree height (ASH), and average annual precipitation (MAP), were finally determined as independent variables.
These five independent variables (average diameter at breast height ADBH, stand density SD, average stand age ASA, average stand height ASH, and average annual precipitation MAP) were selected from a total of 21 statistically significant variables after comprehensive consideration. This means that these variables are considered to contribute the most to the model in the statistical analysis, and there is no serious collinearity problem between them.
4.3 Model construction
4.3.1 Ordinary least squares (OLS) model
Ordinary Least Squares (OLS) is a linear regression method widely used in statistics and econometrics to estimate parameters in linear models (Bai et al., 2021). The core idea of the OLS model is to estimate model parameters by minimizing the residual sum of squares so that the difference between the observed value and the model predicted value is minimized (Onifade et al., 2021; Cortiella et al., 2021).
Ordinary least squares method is a method to find the minimum sum of squares of residuals between dependent variables and multiple independent variables using n groups of observations. It is a common regression method used to explain the relationship between independent variables and dependent variables. The regression equation is formula 5:
In the formula: y is the dependent variable (carbon storage of the sample plot), the unit is t/hm2; Xi is the independent variable; βi is the regression coefficient estimated by the model; β0 is the constant term of the model; p is the number of independent variables; ε is the residual of the model, which obeys the normal distribution N (0, δ2).
The OLS model assumes that the influence of the independent variable on the dependent variable is globally homogeneous, that is, the regression coefficient obtained remains constant in space, ignoring the influence of the spatial position of the data on the influence of the independent variable.
4.3.2 Geographically weighted regression (GWR) model
The GWR model is an extension of the OLS model. Geographically Weighted Regression (GWR) is a local spatial regression analysis method (Comber et al., 2023; Oshan et al., 2020) that allows model parameters to vary spatially, thereby capturing the local spatial non-stationarity of spatial data.
The GWR model adds the location information of the data to the regression process in the form of a spatial weight function, and uses the function of the distance between neighboring points to weight all observations, fully considering the spatial effect of the data to improve the model’s prediction ability. The GWR model is a typical local regression model, that is, each sample point is regressed once, and its calculation formula is:
Formula 6 calculates the Residual Sum of Squares (RSS). Where, ŷi is the estimated value of the i-th point; (ui, vi) is the coordinate of the i-th point; β0 (ui, vi) is the constant term of the i-th point; xik is the k-th independent variable of the i-th point; βk (ui, vi) is the regression coefficient of the k-th independent variable of the i-th point; εi is the model residual term of the I-th point; i = 1, 2, 3, ., n (n is the number of sample points); k = 1, 2, 3, ., p (p is the number of independent variables).
4.3.3 Multiscale geographically weighted regression (MGWR) model
The Multiscale Geographically Weighted Regression (MGWR) model is a statistical method for spatial data analysis that is able to take into account the effects of geographic space and adjust the individual weights in the regression analysis. MGWR is an extension of Geographically Weighted Regression (GWR) (Shabrina et al., 2021; Kurkcuoglu, 2023) that allows different regression parameters to vary at different spatial scales, providing a more flexible and realistic model. Formula 7 is a geographically weighted regression (GWR) model, describing the local regression coefficients as they vary with spatial positions. The formula is as follows:
(1) The spatial weight kernel function is a mathematical function used in the GWR model to determine the weight of each observation point when estimating the local regression coefficient. This function assigns weights based on the spatial distance between observation points. The closer the observation points are, the greater the influence on the estimation of the local regression coefficient.
(2) The bandwidth is a parameter that determines the size of the local neighborhood. It defines the range of neighboring observation points considered when estimating the local regression coefficient of each point.
Spatial weight kernel function and bandwidth play a central role in GWR models (Lu et al., 2022). Different kernel function and bandwidth selections lead to different local spatial relationship capture and parameter estimation results, so they are important indicators to distinguish different GWR models. Correct kernel function and bandwidth selection are crucial to obtain accurate and reliable GWR model estimates. In practical applications, it is usually necessary to determine the optimal bandwidth and kernel function through methods such as cross-validation to balance the locality and globality of the model, thereby obtaining the best model fit and prediction performance.
For the spatial weight kernel function, this study used MGWR 2.2.1 version software to construct Gaussian function and Bi-square kernel function respectively; for bandwidth, this study used the golden section search method (Golden section), and selected the bandwidth with the smallest AICc value as the optimal bandwidth. Finally, the two GWR methods were combined with the two spatial weight kernel functions to construct a total of 4 GWR models (Table 2), namely, GWR (Gaussian), GWR (Bi-square), MGWR (Gaussian), and MGWR (Bi-square).
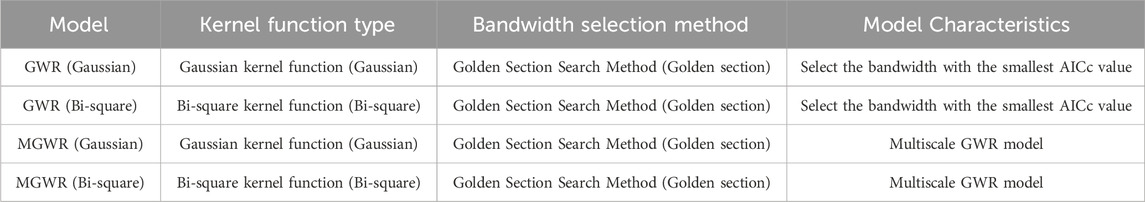
Table 2. Geographically Weighted Regression (GWR) model kernel function type and bandwidth selection method.
4.4 Model evaluation and independent sample test
4.4.1 Model evaluation
In this study, we used a variety of statistical indicators to comprehensively evaluate the performance of the constructed OLS model and four GWR models. Specifically, we used the following three indicators for model evaluation.
4.4.1.1 Residual Sum of Squares (RSS)
This indicator measures the sum of squares of the differences between the model predictions and the actual observed values. The smaller the RSS, the better the model fit (Ge et al., 2021).
4.4.1.2 Coefficient of Determination (R2)
Also known as the coefficient of determination, it measures the proportion of the variation explained by the model to the total variation. The closer the R2 value is to 1, the stronger the explanatory power of the model.
4.4.1.3 Akaike Information Criterion (AIC)
This is a criterion for measuring the relative quality of a model, which takes into account the complexity and goodness of fit of the model. The smaller the AIC value, the stronger the explanatory power of the model, while penalizing the complexity of the model (Kim et al., 2020).
Formula 8 calculates the sum of the squares of the deviations between the observed values of the dependent variable and the mean value Formula 9 defines the Coefficient of Determination. Formula 10 presents the AIC formula. Where: SRS is the residual sum of squares of the model; R2 is the determination coefficient of the model; STS is the total sum of squares of the model; AIC is the Akaike information criterion of the model; yi is the observed value of the i-th point, ŷi is the estimated value of the i-th point; n is the number of sample points; p is the number of independent variables; L is the likelihood function.
4.4.2 Independent sample test
In order to further verify the predictive ability of the model, we selected the following two indicators for independent sample test.
(1) Root mean square error (RMSE) This indicator measures the standard deviation of the difference between the model prediction value and the actual observation value. The smaller the RMSE, the higher the prediction accuracy of the model (Karunasingha, 2022; Liemohn et al., 2021).
(2) Mean absolute error (MAE)
This indicator measures the average absolute value of the difference between the model prediction value and the actual observation value. The smaller the MAE, the smaller the prediction error of the model (Chicco et al., 2021). Equations 11, 12 are used to calculate the Root Mean Square Error (RMSE) and Mean Absolute Error (MAE), respectively. Equation 11 computes RMSE as the square root of the average squared differences, while Equation 12 directly averages the absolute differences, both serving to quantify the accuracy of model predictions against observed data.
ERMS is the root mean square error of the model; EMA is the mean absolute error of the model; yi is the observed value of the i-th point, ŷi is the estimated value of the i-th point; n is the number of sample points; p is the number of independent variables.
5 Results and analysis
In this study, SPSS 27 software and MGWR2.2 software were used to fit the OLS model and four GWR models. The samples used for model construction were 335 plots. The independent variables used were average breast diameter (ADBH), stand density (SD), average age of stand (ASA), average tree height (ASH), and average annual precipitation (MAP). The corresponding dependent variable was carbon storage per unit area (L/hm2).
5.1 Model fitting and independent sample test
5.1.1 Model fitting
As shown in Table 3, the four GWR models are better than the OLS model in terms of model fitting. Their RSS and AIC are smaller than the OLS model, and their R2 is larger than the OLS model.
(1) From the perspective of RSS, the modeling accuracy of various models is ranked as MGWR (Gaussian) > MGWR (Bi-square) > GWR (Gaussian) > GWR (Bi-square).
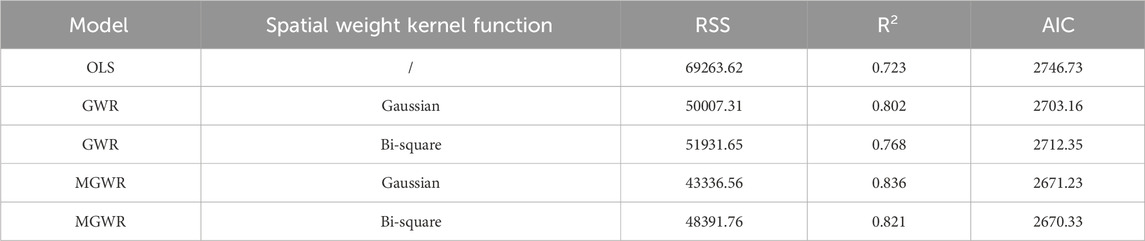
Table 3. Fitting and independence test results of each model.
The residual sum of squares (RSS) is an important indicator to measure the model fitting effect. The smaller the RSS, the smaller the difference between the model’s predicted value and the actual observed value, and the better the model fitting effect. Therefore, the ranking results show that among the compared models, the MGWR (Gaussian) model has the best fitting effect (43336.56), and the worst fitting effect is GWR (Bi-square) (51931.65).
(2) Considering R2, the modeling accuracy of various models is ranked as MGWR (Gaussian) > MGWR (Bi-square) > GWR (Gaussian) > GWR (Bi-square).
This result shows that among the four GWR comparison models, the multiscale geographically weighted regression model (MGWR (Gaussian)) using the Gaussian kernel function has the highest explanatory power, followed by the multiscale model (MGWR (Bi-square)) using the bi-square kernel function, while among the traditional GWR models, the Gaussian kernel function model (GWR (Gaussian)) has a higher explanatory power than the bi-square kernel function model (GWR (Bi-square)). This shows that the multiscale GWR model is more effective in capturing spatial heterogeneity, and in terms of the choice of kernel function, the Gaussian kernel function shows a better model fitting effect in this study, and can more effectively explain the variation of the dependent variable.
(3) It is generally believed that when the AIC value decreases by more than 2, the improved model is better. Considering AIC, the modeling accuracy of various models is ranked as MGWR (Bi-square) > MGWR (Gaussian) > GWR (caussian) > GWR (Bi-square).
From the perspective of Akaike Information Criterion (AIC), the order of model accuracy is MGWR (Bi-square) > MGWR (Gaussian) > GWR (Gaussian) > GWR (Bi-square). This ordering result shows that among the compared models, the multiscale geographically weighted regression model (MGWR (Bi-square)) using the bisquare kernel function has the lowest AIC value and is therefore considered to be the optimal model.
AIC is a criterion for measuring the relative quality of a model. It balances the goodness of fit and complexity of the model. The smaller the AIC value, the better the model is in explaining the data without being overly complex. Therefore, the MGWR (Bi-square) model not only has a good fitting effect, but also has a relatively low model complexity, avoiding the problem of overfitting. The MGWR (Gaussian) model follows closely, indicating that in the multi-scale model, the bi-square kernel function performs better than the Gaussian kernel function in this study. In the GWR model, the AIC value of the Gaussian kernel function model (GWR (Gaussian)) is better than that of the bi-square kernel function model (GWR (Bi-square)), showing the superiority of the Gaussian kernel function in the traditional GWR model. This may be related to the difference in the kernel function’s allocation of spatial weights, which affects the model’s ability to capture local spatial relationships. In general, this ranking result provides information on the relative efficiency and complexity of different models in fitting spatial data, providing a basis for selecting the most appropriate model.
In summary, considering the three fitting statistics, the MGWR (Gaussian) model has the best fitting effect. Although the AIC value of the MGWR (Bi - square) model is slightly lower than that of the MGWR (Gaussian) model, when considering the research purpose of accurately depicting the spatial distribution characteristics of forest carbon storage and the importance of model fitting effect, the determination coefficient (R2) and residual sum of squares (RSS) are more crucial evaluation indicators. The MGWR (Gaussian) model shows the best performance in these two indicators, indicating its stronger ability to explain the variation of the dependent variable and better fitting degree to the data. Therefore, we prioritize the MGWR (Gaussian) model as the optimal model. Compared with the OLS model, its RSS is reduced by 25927.06, the inflation is increased by 0.113, and the AIC is reduced by 76.4.
5.1.2 Independent sample test
This study uses 96 randomly selected samples to conduct independent sample tests on the five models to further compare the prediction capabilities of various models. As shown in Table 4, the four GWR models are superior to the OLS model in the independent sample test, and their RMSE and MAE are both smaller than the OLS model.
(1) From the perspective of RMSE, the validation accuracy of various models is ranked as GWR (caussian) > GWR (Bi-square) > MGWR (Bi-square) > MGWR (Gaussian).
(2) From the perspective of MAE, the accuracy of various models is ranked as follows: MGWR (Bi-square) > GWR (Gaussian) > MGWR (Gaussian) > GWR (Bi-square). Combining the two independence test indicators, GWR (Gaussian) has the best independent sample test result. Compared with the OLS model, its RMSE is reduced by 1.95 and MAE is reduced by 1.09.
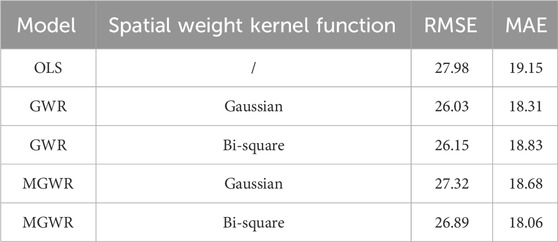
Table 4. Fitting and independence test results of each model.
5.2 Spatial heterogeneity test
The severity of the GWR model parameter fluctuations is the criterion for judging whether the model parameters change significantly in the entire study area. If the range (interquartile range) of the first and third quantiles of the GWR model variable regression coefficient is greater than twice the standard error of the OLS model, it means that the GWR model variable regression coefficient has significant spatial heterogeneity. It shows that this model can better reflect the spatial heterogeneity of variables.
Table 5 shows the results of the spatial heterogeneity test of each model. For the two GWR models, except for the interquartile range of the variable ASA of GWR (Bi-square) which is greater than twice the standard error of the OLS model, the interquartile ranges of the other variables are less than twice the standard error of the OLS model, indicating that the GWR model used in this study fails to fully reflect the spatial differences in the impact of variables on carbon storage in the sample plots.
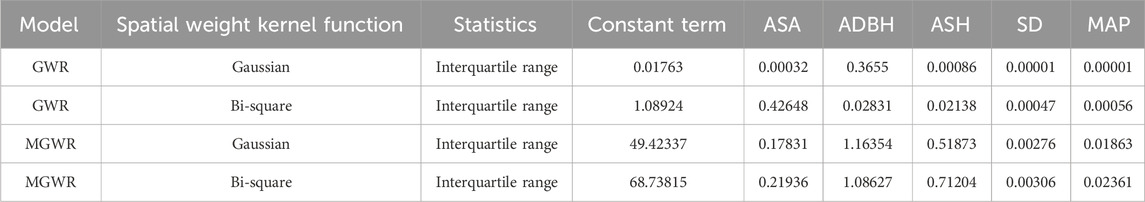
Table 5. Spatial heterogeneity test of each model.
Both MGWR, models well reflect the spatial heterogeneity of variables. Among them, the constant term of MGWR (Gaussian), the interquartile range of ASA, ADBH, ASH, MAP, and SD, are all greater than twice the standard error of the OLS, model. The interquartile ranges of the constant term of MGWR (Bi-square), ADBH, MAP, and SD, are all greater than twice the standard error of the OLS, model. There is also some spatial heterogeneity in the variables ASA, and ASH, but it is not significant.
Therefore, the MGWR (Gaussian) model variable regression coefficient has significant spatial heterogeneity, indicating that the model can better reflect the spatial heterogeneity of variables.
5.3 Optimal model and spatial distribution pattern of forest carbon storage
5.3.1 Optimal model
The statistical results of the regression coefficient of MGWR (Gaussian) are shown in Table 6. In Table 6, the average stand diameter at breast height is a very important stand variable that affects forest carbon storage in the study area. This is in line with the laws of nature. The larger the stand diameter at breast height, the carbon sequestration in the forest will inevitably increase. Even if the diameter at breast height changes slightly, the forest carbon storage will decrease. There will also be significant changes.
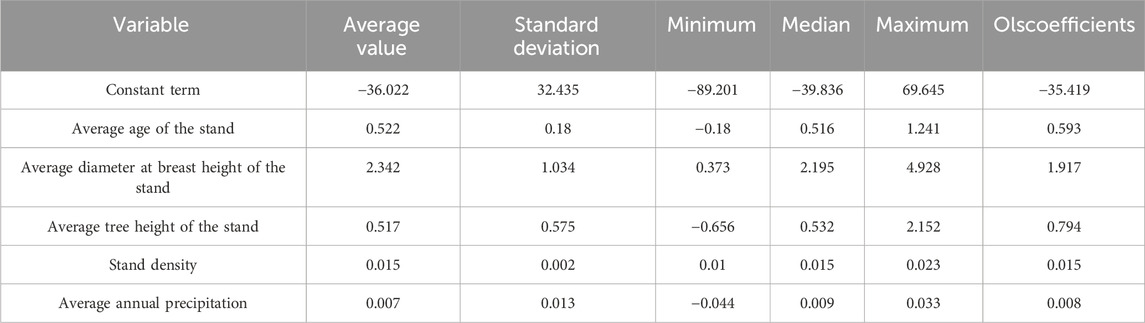
Table 6. GWR (Gaussian) model regression coefficients.
According to the sample data statistics, the carbon storage per unit area of 431 sample plots is 31.162 t/hm2. Table 7 gives the prediction results of the two models.
(1) The ordinary least squares model (OLS) is a global regression model that assumes that the model parameters are constant throughout the study area. Table 7 shows that the carbon storage per unit area estimated by the OLS model is 14.361% higher than the measured data, which means that the OLS model overestimates the carbon storage of the forest.
(2) The multiscale geographically weighted regression (MGWR) model, especially the MGWR (Gaussian) model, is a local regression model that allows model parameters to vary with geographic location, thereby better capturing spatial non-stationarity. Table 7 shows that the carbon storage per unit area estimated by the MGWR (Gaussian) model is 9.031% higher than the measured data, and its accuracy is 5.33% higher than that of the OLS model, indicating that the prediction results of the MGWR (Gaussian) model are closer to the measured data and have a smaller estimation error. The estimated values of the MGWR (Gaussian) model are consistent with the measured values.
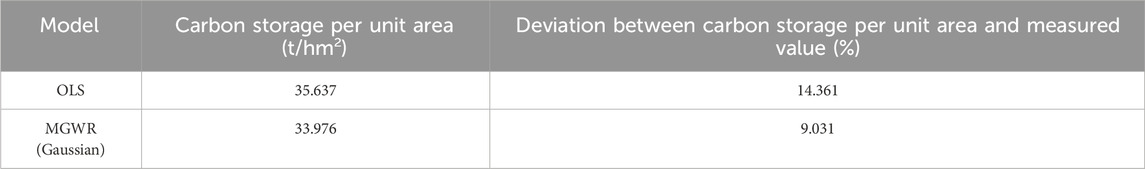
Table 7. Prediction results of two models.
By comparing the estimation results of the OLS and MGWR (Gaussian) models, it can be seen that the MGWR model has certain advantages in predicting the spatial distribution of forest carbon storage in the Pearl River Delta. The MGWR model provides more accurate predictions by considering spatial effects, especially in the estimation of the spatial distribution of carbon storage. The results emphasize the advantages of the MGWR model in dealing with spatially non-stationary data, especially in the estimation of the spatial distribution of forest carbon storage, and can provide more accurate and reliable prediction results than the traditional OLS model.
5.3.2 Spatial distribution pattern of forest carbon storage
In view of the good performance of MGWR (Gaussian) in model fitting, independent sample test and spatial non-stationarity test, the spatial distribution map of forest carbon storage in the study area was drawn based on the fitting results of this model (Figure 2). The figure shows that the forest carbon storage presents a distribution pattern with a high center and a low edge. The relatively high carbon storage values are mainly concentrated in the suburban areas such as the northern and southern parts of Changsha and some areas of Xiangtan, which are rich in forest resources. These areas have a high forest coverage rate and a strong forest carbon sink capacity. The lower carbon storage values are concentrated in the western part of Changsha, the western part of Zhuzhou and the southern part of Xiangtan. These areas have a low forest coverage rate due to the influence of industrial activities, terrain or economic development models.
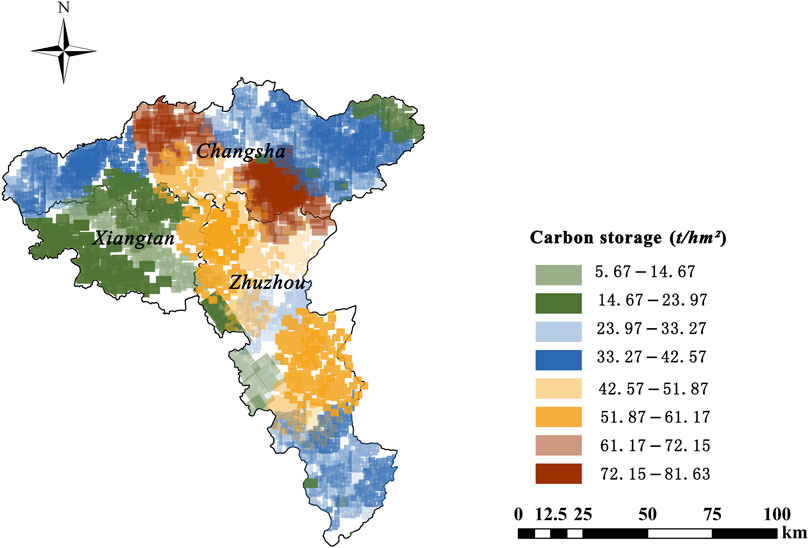
Figure 2. Spatial distribution of forest carbon storage in the urban agglomeration of the Xiangjiang River Basin estimated based on the MGWR (Gaussian) model (The illustration was crafted utilizing ArcGIS software, version 10.2. For further reference, the URL link is provided: https://www.arcgis.com/index.html).
The interpolation tool of ArcGIS 10.2 was used to interpolate the regression coefficients and variables of the OLS model and MGWR (Gaussian) model. The ordinary kriging method (Zhang and Brack, 2021; Cao et al., 2021; Sachdeva et al., 2023) was selected to obtain the spatial distribution results of the regression coefficients and variables in the study area, and the raster calculator tool was used for regression mapping.
As shown in Figure 2, the carbon storage in the middle area is generally greater than that in the edge area. The specific situation is analyzed as follows.
5.3.2.1 Regions with high carbon storage
As a provincial capital, Changsha’s northern and southern parts may have higher forest coverage and quality, and therefore higher carbon storage. The northern part of Changsha mainly refers to the Dongting Lake Plain and parts of the Xiangjiang River Basin. Although these areas are mainly agricultural, they also have some forest resources. The southern part of Changsha is rich in forest resources and has a high coverage rate. The northern and southern regions of Changsha exhibit some of the highest forest carbon stocks in the province, indicating that the region has a large area of forest coverage.
Some areas of Xiangtan, Xiangtan County borders Changsha City and has a high forest coverage rate. (Xiangtan County, Shaoshan City and Xiangxiang City also show their high forest coverage rate. Shaoshan City has successfully created the “Hunan Forest City” and its forest coverage rate is stable at a high level. Xiangxiang City: Xiangxiang City has also successfully created the “Hunan Forest City” and has many forest nature parks, such as Dongtaishan National Forest Nature Park, Huanggonglue Provincial Forest Nature Park, Baozhongshan Provincial Forest Nature Park, etc., showing its high forest coverage rate.
5.3.2.2 Regions with low carbon storage
Low carbon storage values are concentrated in the west of Changsha, the west of Zhuzhou and the south of Xiangtan. Changsha’s industrial areas are mainly concentrated in Changsha Economic Development Zone and Changsha High-tech Zone. These areas have relatively low forest coverage due to the concentration of industrial activities and high land use intensity. Zhuzhou has relatively low carbon storage because of the relatively concentrated industrial activities, which has caused great damage to forest resources. Zhuzhou High-tech Zone and Tianyi Economic Development Zone are the main industrial areas in Zhuzhou. These areas have also occupied a large amount of land due to industrial development, affecting the forest coverage rate.
The southern part of Xiangtan may have a lower forest coverage rate and carbon storage due to the influence of topography or economic development model. Xiangtan Economic Development Zone and Xiangtan High-tech Zone are the main industrial areas in Xiangtan City. Industrial activities in these areas may also have an impact on forest coverage and carbon storage. These industrial areas concentrate a large number of industrial enterprises and production activities, requiring a large amount of land for the construction of factories, warehouses and other related facilities, resulting in a decrease in forest coverage (Deng et al., 2020). At the same time, a large amount of carbon dioxide and other greenhouse gas emissions will be generated during industrial production, which will reduce the carbon storage of the region (Sousa et al., 2023). In addition, the development of industrial areas is often accompanied by urbanization (Wei et al., 2023). Urban expansion will occupy more land resources, further reduce forest area, and reduce forest coverage and carbon storage.
6 Discussion
This study analyzes and evaluates the spatial heterogeneity of forest carbon stock in the Xiangjiang River Basin urban agglomeration by introducing the multiscale geographically weighted regression (MGWR) model by comparing the ordinary least squares (OLS) model and the geographically weighted regression (GWR) model. The discussion will focus on the selection of models, the applicability of models, and the spatial distribution characteristics of forest carbon stock.
6.1 Model selection and applicability
The multiscale geographically weighted regression (MGWR) model showed better fitting effect and prediction accuracy than the OLS model in this study. This study extends prior work in several aspects. In terms of parameter calibration, unlike previous studies, we systematically compared different spatial weight kernel functions and bandwidth selection methods. By using MGWR 2.2.1 software to construct Gaussian and Bi - square kernel functions and applying the Golden Section Search Method to select the optimal bandwidth, we built four GWR models to determine the most suitable parameter settings for our study area. Regarding variable selection, we addressed the collinearity issue among variables through stepwise regression and collinearity tests, carefully screening out five key variables (average breast diameter, stand density, average age of stand, average tree height, and average annual precipitation) that contribute significantly to the model without serious collinearity. In terms of validation techniques, we used multiple statistical indicators for comprehensive model evaluation, including RSS, R2, AIC for model fitting evaluation and RMSE, MAE for independent sample tests, which provides a more comprehensive and accurate assessment of model performance compared to previous single - indicator evaluations.
The MGWR model can capture the spatial non-stationarity of the data and allow the model parameters to vary with the geographical location, which is of great significance for understanding and predicting the spatial distribution of forest carbon stock in the Xiangjiang River Basin urban agglomeration. As a global model, the parameters of the OLS model remain constant throughout the study area and cannot capture local spatial heterogeneity. Therefore, the MGWR model is more applicable in this study.
6.2 Spatial distribution characteristics of forest carbon stock
The results show that the forest carbon stock in the Xiangjiang River Basin urban agglomeration shows a trend that the central region is larger than the marginal region in space. This may be related to the higher forest coverage and better forest quality in the central region. The northern and southern regions of cities such as Changsha and Xiangtan have higher carbon storage due to rich forest resources, while the western and southern regions have lower carbon storage due to concentrated industrial activities and lower forest coverage.
6.3 Limitations of the model and future research directions
Although the MGWR model showed good performance in this study, it still has certain limitations, such as high dependence on sample quantity and quality, and stability issues in model parameter estimation. Future research can consider combining more remote sensing data and ground-based measured data to improve the accuracy and applicability of the model. Specifically, integrating satellite - based indices like NDVI could be a promising approach. NDVI can provide extensive and continuous information on vegetation coverage, which complements the limitations of ground - based sample plot data in spatial coverage. By incorporating NDVI data into the model, we can better understand the growth status and distribution of forest vegetation, and use it as an additional input variable to improve the accuracy of predicting the spatial distribution of forest carbon stocks. Additionally, LiDAR - derived canopy height data can offer precise information about the vertical structure of forests. Since different canopy heights are related to different vegetation growth stages and biomass accumulations, this data can help more accurately estimate forest biomass and carbon stocks. Integrating such data into spatial modeling would enable the model to better capture the relationship between forest structure and carbon storage, enhancing the model’s performance.
Although this study analyzed the spatial heterogeneity of forest carbon storage in urban agglomerations in the Xiangjiang River Basin using multiple models, there are still deficiencies in the processing of forest coverage rate data. The forest coverage rate data used in the research differs from that of China’s Third National Land Survey (“ The Third National Land Survey”). This is not only due to the difference in statistical standards, but also influenced by the scale of the survey mapping. Since the research did not deeply analyze the specific extent of the impact of these differences on the estimation of forest carbon storage, it may lead to certain deviations in the estimation of carbon storage. In future research, it is necessary to explore more deeply the influence mechanism of the differences in forest coverage data under different statistical scopes and scales on the research results of forest carbon storage, so as to assess regional forest carbon storage more accurately and provide more reliable basis for ecological protection and carbon management. At the same time, exploring more factors that affect forest carbon storage, such as soil properties, vegetation types, etc., is also one of the directions for future research.
7 Conclusion
Based on the continuous inventory data and meteorological data of forest resources in the Xiangjiang River Basin of Hunan Province, this study screened out five key variables, constructed four geographically weighted regression (GWR) models and an ordinary least squares (OLS) model, and estimated the spatial distribution pattern of forest carbon storage in the Xiangjiang River Basin.
This study is innovative in several respects. One notable aspect is the pioneering application of the Multiscale Geographically Weighted Regression (MGWR) model to investigate the spatial heterogeneity of forest carbon stocks in the Xiangjiang River Basin urban agglomeration. Utilizing the MGWR model allows for a more nuanced understanding of the spatial non-stationarity of variables across different scales, a dimension that prior research on this region has not fully addressed. This approach enhances the precision with which we can discern the intricate relationships between forest carbon storage and various influencing factors, such as average breast diameter, stand density, and precipitation.
Another distinctive feature of this study is the comparative analysis of multiple models, encompassing the ordinary least squares (OLS) model and four different Geographically Weighted Regression (GWR) models. This comprehensive comparison enables an evaluation of the relative performance of these models in fitting the data and predicting forest carbon storage. The insights gained from this analysis are valuable for guiding future research on forest carbon storage in similar regions, offering guidance on selecting appropriate models for accurate estimation.
Moreover, the integration of forest resource inventory data and climate data to identify key variables influencing forest carbon storage represents a novel perspective. This approach facilitates a deeper exploration of the factors affecting forest carbon sequestration within the context of a changing climate, thereby contributing to a more comprehensive understanding of the forest carbon cycle in urban agglomerations.
The following conclusions were drawn.
(1) Superiority of the MGWR model: The carbon storage per unit area estimated by the multiscale geographically weighted regression (MGWR) model was 9.031% higher than the measured data, and its accuracy was 5.33% higher than that of the OLS model, indicating that the prediction results of the MGWR (Gaussian) model were closer to the measured data and had a smaller estimation error. The estimated values of the MGWR (Gaussian) model were consistent with the measured values. The MGWR model was superior to the OLS model in predicting the spatial distribution of forest carbon storage in the urban agglomeration of the Xiangjiang River Basin, and could more accurately capture spatial non-stationarity and local spatial relationships. This shows that the multiscale geographically weighted regression (MGWR) model has obvious advantages in estimating the spatial distribution of forest carbon storage. By considering spatial effects, the MGWR model can capture local spatial relationships more accurately and provide more precise prediction results than the traditional OLS model.
(2) Spatial non-stationarity test: The results of the spatial non-stationarity test show that the MGWR model can better reflect the spatial heterogeneity of variables than the multi-scale GWR model, and its variable parameters have obvious differences in geographical space. This emphasizes the advantages of the MGWR model in dealing with spatial non-stationary data, especially in the estimation of the spatial distribution of forest carbon storage.
(3) Spatial distribution pattern of forest carbon storage: The carbon storage per unit area of the Xiangjiang River Basin estimated by the MGWR (Gaussian) model ranges from 5.67 to 81.63 t/hm2, with an average of 31.162 t/hm2, showing an overall distribution pattern of high center and low edge. This result reveals the spatial distribution characteristics of forest carbon storage in the Xiangjiang River Basin urban agglomeration, providing an important scientific basis for the management of regional forest resources.
(4) Reflection of spatial relationships: Through the multiscale geographically weighted regression (MGWR) model, the geographically weighted regression method and the selection of appropriate spatial kernel functions can better reflect the spatial relationship between forest carbon storage and variables, thereby improving the estimation accuracy of the spatial distribution of large-scale forest carbon storage. This study accurately reveals the spatial distribution pattern of forest carbon storage in the Xiangjiang River Basin, providing a scientific basis for achieving regional carbon neutrality goals and promoting the construction of ecological civilization.
Through this study, we not only improved our understanding of the spatial heterogeneity of forest carbon storage in the Xiangjiang River Basin urban agglomeration, but also provided a scientific basis for achieving regional carbon neutrality goals and promoting the construction of ecological civilization.
Data availability statement
The original contributions presented in the study are included in the article/supplementary material, further inquiries can be directed to the corresponding authors.
Author contributions
YK: Data curation, Formal Analysis, Investigation, Methodology, Project administration, Resources, Writing – original draft. XC: Conceptualization, Data curation, Formal Analysis, Methodology, Software, Visualization, Writing – original draft, Writing – review and editing.
Funding
The author(s) declare that no financial support was received for the research and/or publication of this article.
Conflict of interest
The authors declare that the research was conducted in the absence of any commercial or financial relationships that could be construed as a potential conflict of interest.
Generative AI statement
The author(s) declare that no Generative AI was used in the creation of this manuscript.
Publisher’s note
All claims expressed in this article are solely those of the authors and do not necessarily represent those of their affiliated organizations, or those of the publisher, the editors and the reviewers. Any product that may be evaluated in this article, or claim that may be made by its manufacturer, is not guaranteed or endorsed by the publisher.
References
Araza, A., De Bruin, S., Hein, L., and Herold, M. (2023). Spatial predictions and uncertainties of forest carbon fluxes for carbon accounting. Sci. Rep. 13, 12704. doi:10.1038/s41598-023-38935-8
Arehart, J. H., Hart, J., Pomponi, F., and D'Amico, B. (2021). Carbon sequestration and storage in the built environment. Sustain. Prod. Consum. 27, 1047–1063. doi:10.1016/j.spc.2021.02.028
Bai, J., Choi, S. H., and Liao, Y. (2021). Feasible generalized least squares for panel data with cross-sectional and serial correlations. Empir. Econ. 60, 309–326. doi:10.1007/s00181-020-01977-2
Bhardwaj, D., Salve, A., Kumar, J., Kumar, A., Sharma, P., and Kumar, D. (2024). Biomass production and carbon storage potential of agroforestry land use systems in high hills of north-western Himalaya: an approach towards natural based climatic solution. Biomass Convers. Biorefinery 14, 18079–18092. doi:10.1007/s13399-023-03952-0
Cai, Y., Xu, X., Zhu, P., Nie, S., Wang, C., Xiong, Y., et al. (2024). Unveiling spatiotemporal tree cover patterns in China: the first 30 m annual tree cover mapping from 1985 to 2023. ISPRS J. Photogrammetry Remote Sens. 216, 240–258. doi:10.1016/j.isprsjprs.2024.08.001
Cao, X., Shi, Y., Zhou, L., Tao, T., and Yang, Q. (2021). Analysis of factors influencing the urban carrying capacity of the shanghai metropolis based on a multiscale geographically weighted regression (mgwr) model. Land 10, 578. doi:10.3390/land10060578
Chen, X., Zhang, H., Wong, C. U. I., and Li, F. (2024). Investigation of the spatio-temporal distribution and seasonal origin of atmospheric PM2. 5 in chenzhou city. Appl. Sci. 14, 11221. doi:10.3390/app142311221
Chen, Y., Kou, W., Ma, X., Wei, X., Gong, M., Yin, X., et al. (2022). Estimation of the value of forest ecosystem services in pudacuo national park, China. Sustainability 14, 10550. doi:10.3390/su141710550
Cheng, F., Ou, G., Wang, M., and Liu, C. (2024). Remote sensing estimation of forest carbon stock based on machine learning algorithms. Forests 15, 681. doi:10.3390/f15040681
Chicco, D., Warrens, M. J., and Jurman, G. (2021). The coefficient of determination R-squared is more informative than SMAPE, MAE, MAPE, MSE and RMSE in regression analysis evaluation. Peerj Comput. Sci. 7, e623. doi:10.7717/peerj-cs.623
Comber, A., Brunsdon, C., Charlton, M., Dong, G., Harris, R., Lu, B., et al. (2023). A route map for successful applications of geographically weighted regression. Geogr. Anal. 55, 155–178. doi:10.1111/gean.12316
Cortiella, A., Park, K.-C., and Doostan, A. (2021). Sparse identification of nonlinear dynamical systems via reweighted ℓ1-regularized least squares. Comput. Methods Appl. Mech. Eng. 376, 113620. doi:10.1016/j.cma.2020.113620
Costa, E. M., Tassinari, W. d.S., Pinheiro, H. S. K., Beutler, S. J., and Dos Anjos, L. H. C. (2018). Mapping soil organic carbon and organic matter fractions by geographically weighted regression. J. Environ. Qual. 47, 718–725. doi:10.2134/jeq2017.04.0178
Deng, B., Affolderbach, J., and Deutz, P. (2020). Industrial restructuring through eco-transformation: green industrial transfer in changsha–zhuzhou–xiangtan, hunan province. Sustainability 12, 6945. doi:10.3390/su12176945
Deng, C., Liu, J., Liu, Y., Li, Z., Nie, X., Hu, X., et al. (2021). Spatiotemporal dislocation of urbanization and ecological construction increased the ecosystem service supply and demand imbalance. J. Environ. Manag. 288, 112478. doi:10.1016/j.jenvman.2021.112478
Deng, C., Ma, F., Xu, X., Zhu, B., Tao, J., and Li, Q. (2023). Allocation patterns and temporal dynamics of Chinese fir biomass in Hunan Province, China. Forests 14, 286. doi:10.3390/f14020286
Duarte, E., Zagal, E., Barrera, J. A., Dube, F., Casco, F., and Hernández, A. J. (2022). Digital mapping of soil organic carbon stocks in the forest lands of Dominican Republic. Eur. J. remote Sens. 55, 213–231. doi:10.1080/22797254.2022.2045226
Ge, L., Xu, H., Guo, Z., Song, S., and De Doncker, R. W. (2021). An optimization-based initial position estimation method for switched reluctance machines. IEEE Trans. Power Electron. 36, 13285–13292. doi:10.1109/tpel.2021.3081618
Gülçin, D., and van Den Bosch, C. C. K. (2021). Assessment of above-ground carbon storage by urban trees using LiDAR data: the case of a university campus. Forests 12, 62. doi:10.3390/f12010062
Guo, Y., Ren, Z., Wang, C., Zhang, P., Ma, Z., Hong, S., et al. (2024). Spatiotemporal patterns of urban forest carbon sequestration capacity: implications for urban CO2 emission mitigation during China's rapid urbanization. Sci. Total Environ. 912, 168781. doi:10.1016/j.scitotenv.2023.168781
Jia, X., Han, H., Feng, Y., Song, P., He, R., Liu, Y., et al. (2023). Scale-dependent and driving relationships between spatial features and carbon storage and sequestration in an urban park of Zhengzhou, China. Sci. Total Environ. 894, 164916. doi:10.1016/j.scitotenv.2023.164916
Karunasingha, D. S. K. (2022). Root mean square error or mean absolute error? Use their ratio as well. Inf. Sci. 585, 609–629. doi:10.1016/j.ins.2021.11.036
Kim, S., Lee, S. G., Kim, J. M., Lee, T. H., and Lim, M. S. (2020). Uncertainty identification method using kriging surrogate model and Akaike information criterion for industrial electromagnetic device. IET Sci. Meas. and Technol. 14, 250–258. doi:10.1049/iet-smt.2019.0349
Kowkabi, L. (2021). Revitalization of bio infrastructure network, an approach to urban regeneration: a case study of the qanats of Tehran. Urban For. and Urban Green. 59, 127020. doi:10.1016/j.ufug.2021.127020
Kurkcuoglu, M. A. S. (2023). Analysis of the energy justice in natural gas distribution with Multiscale Geographically Weighted Regression (MGWR). Energy Rep. 9, 325–337. doi:10.1016/j.egyr.2022.11.188
Li, W., Dong, F., and Ji, Z. (2021). Research on coordination level and influencing factors spatial heterogeneity of China's urban CO2 emissions. Sustain. Cities Soc. 75, 103323. doi:10.1016/j.scs.2021.103323
Liao, L., Zhao, C., Li, X., and Qin, J. (2021). Towards low carbon development: the role of forest city constructions in China. Ecol. Indic. 131, 108199. doi:10.1016/j.ecolind.2021.108199
Liemohn, M. W., Shane, A. D., Azari, A. R., Petersen, A. K., Swiger, B. M., and Mukhopadhyay, A. (2021). RMSE is not enough: guidelines to robust data-model comparisons for magnetospheric physics. J. Atmos. Solar-Terrestrial Phys. 218, 105624. doi:10.1016/j.jastp.2021.105624
Liu, Y., and Mao, D. (2020). Integrated assessment of water quality characteristics and ecological compensation in the Xiangjiang River, south-central China. Ecol. Indic. 110, 105922. doi:10.1016/j.ecolind.2019.105922
Lu, B., Hu, Y., Murakami, D., Brunsdon, C., Comber, A., Charlton, M., et al. (2022). High-performance solutions of geographically weighted regression in R. Geo-Spatial Inf. Sci. 25, 536–549. doi:10.1080/10095020.2022.2064244
Lu, S., Tang, X., Guan, X., Qin, F., Liu, X., and Zhang, D. (2020). The assessment of forest ecological security and its determining indicators: a case study of the Yangtze River Economic Belt in China. J. Environ. Manag. 258, 110048. doi:10.1016/j.jenvman.2019.110048
Ma, S., Zhao, Y., and Tan, X. (2020). Exploring smart growth boundaries of urban agglomeration with land use spatial optimization: a case study of Changsha-Zhuzhou-Xiangtan city group, China. Chin. Geogr. Sci. 30, 665–676. doi:10.1007/s11769-020-1140-1
Mandal, S., Chatterjee, P., Das, N., Banerjee, R., Batabyal, S., Gangopadhyay, S., et al. (2022). Modelling the role of urban forest in the regulation of carbon balance in an industrial area of India. Acta Ecol. Sin. 42, 553–564. doi:10.1016/j.chnaes.2022.05.005
McClanahan, T. R., D’agata, S., Graham, N., Kodia, M. A., and Maina, J. M. (2023). Multivariate environment-fish biomass model informs sustainability and lost income in Indian Ocean coral reefs. Mar. Policy 152, 105590. doi:10.1016/j.marpol.2023.105590
Odebiri, O., Mutanga, O., Odindi, J., and Naicker, R. (2022). Modelling soil organic carbon stock distribution across different land-uses in South Africa: a remote sensing and deep learning approach. ISPRS J. Photogrammetry Remote Sens. 188, 351–362. doi:10.1016/j.isprsjprs.2022.04.026
Onifade, S. T., Erdoğan, S., Alagöz, M., and Bekun, F. V. (2021). Renewables as a pathway to environmental sustainability targets in the era of trade liberalization: empirical evidence from Turkey and the Caspian countries. Environ. Sci. Pollut. Res. 28, 41663–41674. doi:10.1007/s11356-021-13684-1
Oshan, T. M., Smith, J. P., and Fotheringham, A. S. (2020). Targeting the spatial context of obesity determinants via multiscale geographically weighted regression. Int. J. health Geogr. 19, 11–17. doi:10.1186/s12942-020-00204-6
Pati, P. K., Kaushik, P., Maurya, D., Adhikari, C., Bishwas, A. J., Khan, M. L., et al. (2024). Evaluating the role of roadside vegetation in atmospheric carbon dioxide mitigation: a case study. Arboric. J. 46, 97–119. doi:10.1080/03071375.2023.2233868
Pregitzer, C. C., Hanna, C., Charlop-Powers, S., and Bradford, M. A. (2022). Estimating carbon storage in urban forests of New York City. Urban Ecosyst. 25, 617–631. doi:10.1007/s11252-021-01173-9
Qiao, D., Yuan, W., and Li, H. (2024). Regulation and resilience: panarchy analysis in forest socio-ecosystem of northeast national forest region, China. J. Environ. Manag. 353, 120295. doi:10.1016/j.jenvman.2024.120295
Qiu, Z., Feng, Z., Song, Y., Li, M., and Zhang, P. (2020). Carbon sequestration potential of forest vegetation in China from 2003 to 2050: predicting forest vegetation growth based on climate and the environment. J. Clean. Prod. 252, 119715. doi:10.1016/j.jclepro.2019.119715
Raihan, A., Begum, R. A., Mohd Said, M. N., and Pereira, J. J. (2021). Assessment of carbon stock in forest biomass and emission reduction potential in Malaysia. Forests 12, 1294. doi:10.3390/f12101294
Raj, A., and Jhariya, M. K. (2021). Carbon storage, flux and mitigation potential of tropical Sal mixed deciduous forest ecosystem in Chhattisgarh, India. J. Environ. Manag. 293, 112829. doi:10.1016/j.jenvman.2021.112829
Sachdeva, M., Fotheringham, A. S., Li, Z., and Yu, H. (2023). On the local modeling of count data: multiscale geographically weighted Poisson regression. Int. J. Geogr. Inf. Sci. 37, 2238–2261. doi:10.1080/13658816.2023.2250838
Shabrina, Z., Buyuklieva, B., and Ng, M. K. M. (2021). Short-term rental platform in the urban tourism context: a geographically weighted regression (GWR) and a multiscale GWR (MGWR) approaches. Geogr. Anal. 53, 686–707. doi:10.1111/gean.12259
Shafique, M., Xue, X., and Luo, X. (2020). An overview of carbon sequestration of green roofs in urban areas. Urban For. and Urban Green. 47, 126515. doi:10.1016/j.ufug.2019.126515
Shi, X., Wang, T., Lu, S., Chen, K., He, D., and Xu, Z. (2022). Evaluation of China’s forest carbon sink service value. Environ. Sci. Pollut. Res. 29, 44668–44677. doi:10.1007/s11356-022-18958-w
Singh, R. D., Gumber, S., Singh, S. P., and Singh, P. (2024). Bark thickness and related parameters of tree species along an elevation transect leading to treeline in Central Himalaya. Environ. Monit. Assess. 196, 441–517. doi:10.1007/s10661-024-12590-6
Singkran, N. (2022). Carbon sink capacity of public parks and carbon sequestration efficiency improvements in a dense urban landscape. Environ. Monit. Assess. 194, 750. doi:10.1007/s10661-022-10432-x
Song, P., Kim, G., Mayer, A., He, R., and Tian, G. (2020). Assessing the ecosystem services of various types of urban green spaces based on i-Tree Eco. Sustainability 12, 1630. doi:10.3390/su12041630
Soto, D. P., Seidel, D., Hernández-Moreno, Á., Puettmann, K. J., and Donoso, P. J. (2024). Increase in forest structural complexity along a precipitation gradient is mediated by partial harvests in temperate Patagonian forests. Sci. Rep. 14, 13656. doi:10.1038/s41598-024-64523-5
Sousa, V., Bogas, J. A., Real, S., and Meireles, I. (2023). Industrial production of recycled cement: energy consumption and carbon dioxide emission estimation. Environ. Sci. Pollut. Res. 30, 8778–8789. doi:10.1007/s11356-022-20887-7
Sun, W., and Liu, X. (2020). Review on carbon storage estimation of forest ecosystem and applications in China. For. Ecosyst. 7, 4–14. doi:10.1186/s40663-019-0210-2
Tao, Q., Gao, G., Xi, H., Wang, F., Cheng, X., Ou, W., et al. (2022). An integrated evaluation framework for multiscale ecological protection and restoration based on multi-scenario trade-offs of ecosystem services: case study of Nanjing City, China. Ecol. Indic. 140, 108962. doi:10.1016/j.ecolind.2022.108962
Volkov, A., Belan, L., Bogdan, E., Suleymanov, A., Tuktarova, I., Shagaliev, R., et al. (2023). Spatio-Temporal analysis of forest growing stock volume and carbon stocks: a case study of kandry-kul natural park, Russia. Land 12, 1441. doi:10.3390/land12071441
Wang, C., Luo, J., Qing, F., Tang, Y., and Wang, Y. (2022). Analysis of the driving force of spatial and temporal differentiation of carbon storage in taihang mountains based on InVEST model. Appl. Sci. 12, 10662. doi:10.3390/app122010662
Wang, L., Ye, W., and Chen, L. (2021b). Research on green innovation of the great Changsha-Zhuzhou-Xiangtan city group based on network. Land 10, 1198. doi:10.3390/land10111198
Wang, W., Wang, J., and Meng, J. (2023). A climate-sensitive mixed-effects tree recruitment model for oaks (Quercus spp.) in Hunan Province, south-central China. For. Ecol. Manag. 528, 120631. doi:10.1016/j.foreco.2022.120631
Wang, X., Wang, Y., Zhou, C., Yin, L., and Feng, X. (2021a). Urban forest monitoring based on multiple features at the single tree scale by UAV. Urban For. and Urban Green. 58, 126958. doi:10.1016/j.ufug.2020.126958
Wang, Y., Li, X., Yang, X., Qi, W., Zhang, D., and Wang, J. (2024). Estimation of picea schrenkiana canopy density at sub-compartment scale by integration of optical and radar satellite images. Forests 15, 1145. doi:10.3390/f15071145
Wang, Y., and Li, Y. (2024). Evaluation of ecosystem protection and restoration effects based on the mountain-river-forest-field-lake-grass community concept: a case study of the hunjiang River Basin in jilin province, China. Water 16, 2239. doi:10.3390/w16162239
Wani, A. A., Bhat, A. F., Gatoo, A. A., Zahoor, S., Mehraj, B., Najam, N., et al. (2021). Assessing relationship of forest biophysical factors with NDVI for carbon management in key coniferous strata of temperate Himalayas. Mitig. Adapt. Strategies Glob. Change 26, 1–22. doi:10.1007/s11027-021-09937-6
Wei, G., He, B.-J., Sun, P., Liu, Y., Li, R., Ouyang, X., et al. (2023). Evolutionary trends of urban expansion and its sustainable development: evidence from 80 representative cities in the belt and road initiative region. Cities 138, 104353. doi:10.1016/j.cities.2023.104353
Yang, Y., Li, H., and Qian, C. (2023). Analysis of the implementation effects of ecological restoration projects based on carbon storage and eco-environmental quality: a case study of the Yellow River Delta, China. J. Environ. Manag. 340, 117929. doi:10.1016/j.jenvman.2023.117929
Yin, X.-H., Sass-Klaassen, U., Hao, G.-Y., and Sterck, F. (2024). Ring-and diffuse-porous tree species coexisting in cold and humid temperate forest diverge in stem and leaf phenology. Dendrochronologia 86, 126220. doi:10.1016/j.dendro.2024.126220
Zeng, W., Zou, W., Chen, X., and Yang, X. (2024). A three-level model system of biomass and carbon storage for all forest types in China. Forests 15, 1305. doi:10.3390/f15081305
Zhang, B., and Brack, C. L. (2021). Urban forest responses to climate change: a case study in Canberra. Urban For. and Urban Green. 57, 126910. doi:10.1016/j.ufug.2020.126910
Zhang, P., Deng, M., Long, A., Deng, X., Wang, H., Hai, Y., et al. (2020b). Coupling analysis of social-economic water consumption and its effects on the arid environments in Xinjiang of China based on the water and ecological footprints. J. arid land 12, 73–89. doi:10.1007/s40333-020-0050-5
Zhang, P.-c., Liang, Y., Liu, B., Ma, T.-x., and Wu, M.-m. (2023). Remote sensing estimation of forest aboveground biomass in Tibetan Plateau based on random forest model. Chin. J. Ecol. 42, 415. doi:10.13292/j.1000-4890.202302.007
Zhang, Y., Lim, H. S., Hu, C., and Zhang, R. (2024). Spatiotemporal dynamics of forest fires in the context of climate change: a review. Environ. Sci. Pollut. Res., 1–15. doi:10.1007/s11356-024-33305-x
Zhang, Y., Yuan, J., You, C., Cao, R., Tan, B., Li, H., et al. (2020a). Contributions of national key forestry ecology projects to the forest vegetation carbon storage in China. For. Ecol. Manag. 462, 117981. doi:10.1016/j.foreco.2020.117981
Zhao, H., Zhao, D., Jiang, X., Zhang, S., and Lin, Z. (2023). Assessment of urban forest ecological benefit based on the i-tree eco model—a case study of changchun central city. Forests 14, 1304. doi:10.3390/f14071304
Zhao, X., Ma, X., Chen, B., Shang, Y., and Song, M. (2022). Challenges toward carbon neutrality in China: strategies and countermeasures. Resour. Conservation Recycl. 176, 105959. doi:10.1016/j.resconrec.2021.105959
Zhong, S., and Elzarka, H. (2021). Retrospective evaluation of the vulnerability of watershed sustainable water development using a time-series-based space geometry model: Xiang jiang watershed, China. J. Hydrologic Eng. 26, 05021023. doi:10.1061/(asce)he.1943-5584.0002118
Zhuang, Q., Shao, Z., Gong, J., Li, D., Huang, X., Zhang, Y., et al. (2022). Modeling carbon storage in urban vegetation: progress, challenges, and opportunities. Int. J. Appl. Earth Observation Geoinformation 114, 103058. doi:10.1016/j.jag.2022.103058
Zhuo, Z., Du, E., Zhang, N., Nielsen, C. P., Lu, X., Xiao, J., et al. (2022). Cost increase in the electricity supply to achieve carbon neutrality in China. Nat. Commun. 13, 3172. doi:10.1038/s41467-022-30747-0
Keywords: Xiangjiang river Basin, urban agglomeration, GWR model, MGWR model, forest carbon storage, spatial heterogeneity
Citation: Kuang Y and Chen X (2025) Spatial heterogeneity of forest carbon stocks in the Xiangjiang river Basin urban agglomeration: analysis and assessment based on the multiscale geographically weighted regression (MGWR) model. Front. Environ. Sci. 13:1573438. doi: 10.3389/fenvs.2025.1573438
Received: 09 February 2025; Accepted: 13 May 2025;
Published: 30 May 2025.
Edited by:
Chandra Prakash Kala, Indian Institute of Forest Management, IndiaReviewed by:
Lei Wang, International Research Center of Big Data for Sustainable Development Goals, ChinaSuneet Naithani, Doon University, India
Copyright © 2025 Kuang and Chen. This is an open-access article distributed under the terms of the Creative Commons Attribution License (CC BY). The use, distribution or reproduction in other forums is permitted, provided the original author(s) and the copyright owner(s) are credited and that the original publication in this journal is cited, in accordance with accepted academic practice. No use, distribution or reproduction is permitted which does not comply with these terms.
*Correspondence: Xiaolong Chen, b3Nha2Fjb29sQGhhaXQuZWR1LmNu
†These authors have contributed equally to this work and share first authorship