Abstract
Forest fires present a significant threat to both ecosystems and socio-economic systems, making accurate risk assessment essential for effective prevention and control. However, conventional assessment approaches are often limited by subjective bias, incomplete indicator frameworks, or a reliance on static analysis, which hinders a comprehensive understanding of the multidimensional drivers and spatiotemporal evolution of fire risk. To address these gaps, this study proposes an integrated forest fire risk assessment model that incorporates natural, social, and economic dimensions. An improved G1–CRITIC combined weighting method is applied to determine indicator weights, effectively balancing expert judgment with objective data metrics. The model was implemented using multi-source data from 2013 to 2022–including remote sensing imagery, government statistics, and field survey data–in Huangu Town, Ankang City, Shaanxi Province. The results show that the model reliably assesses regional forest fire risk levels and successfully delineates their spatiotemporal dynamics. Correlation analyses further confirm the robustness of the model. The study reveals that forest fire risk is co-driven by natural and socio-economic systems: natural factors predominantly influence short-term fluctuations, whereas socio-economic factors shape long-term trends. By overcoming several limitations of traditional methods, the proposed model enables a dynamic and multi-factor driven analysis of forest fire risk. These findings offer a scientific foundation for phased, zoned, and graded precision management of forest fire prevention, as well as for the optimized allocation of firefighting resources.
1 Introduction
Forest resources are a significant part of the Earth’s ecosystems. They provide wood, ecological goods, and other important things that help socio-economic growth. It also serves an important role in conserving water, controlling the climate, and keeping biodiversity. However, forest fires, as a type of forest fire behavior that is abrupt, destructive, and difficult to cope with, continue to endanger the integrity of forest ecosystems and pose a significant loss to human life and property safety (Werth et al., 2011). The frequency and severity of forest fires have increased in recent years as a result of the simultaneous influence of accelerating global climate change and rising human activities, making forest fire prevention a critical responsibility in guaranteeing the long-term growth of forest resources. Scientific forest fire risk assessment is an important tool for stopping fires from starting and keeping big, frequent fires from happening. Not only can it help make better decisions about how to stop forest fires and reduce fire damage, but it can also help stop forest fires in different areas by using “regional assessment” more effectively. Localities can use regional assessments to optimize the layout of firefighting facilities based on their own fire risk characteristics, rationally deploy resources, and significantly increase the utilization rate of firefighting facilities, build a strong forest fire defense line at the regional level, and effectively reduce the likelihood of fires and the impact of hazards.
Traditional forest fire risk assessment (Zang et al., 1997; Zhang et al., 1991) is mostly based on the assessor’s subjective judgment and uses qualitative or semi-quantitative methodologies, with conclusions that are subjectively affected and less accurate. Since the beginning of the 21st century, research on forest fire assessment has advanced significantly, culminating in the establishment of a quantitative assessment system focused on data and models, which are divided into three categories: statistical models, machine learning models, and multi-criteria decision-making models. Statistical modeling is based on the statistical correlation between historical fire data and influencing factors, and it is distinguished by its ease of interpretation. However, data quality standards are strict, and capturing nonlinear influence relationships poses significant challenges. Machine learning models excel at handling high-dimensional, nonlinear data and making accurate predictions. However, they struggle to explain how variables affect risk and do not perform well with non-sample data. The multi-criteria decision-making model can integrate qualitative and quantitative metrics. The rationale for the assessment parallels the requirements for defense and control; however, it is plagued by significant subjective reliance and elevated criteria for indicator independence.
(Keeping et al. (2024) used a Generalized Linear Model (GLM) approach to predict the daily probability of wildfire occurrence at 0.1°(∼10 km) spatial resolution across multiple model runs. Jodhani et al. (2024b) combined different environmental factors and applied machine learning techniques to assess wildfire vulnerability and predict surface temperatures using a set of environmental data, providing useful insights into spatial patterns and trends. Wang et al. (2024) used hierarchical analysis to weight seven factors and divide the Fangchenggang District of Guangxi Province into four risk levels. This provides a theoretical basis for managing forest resources in urban areas and preventing forest fires.
The initial fire risk assessment employed a single-factor approach, measuring regional risk using only one indicator (Liu and Hu, 2013), without taking into account the combined effects of numerous components. As research progressed, the evaluation method evolved to include both natural and human elements (Nasiri et al., 2022; Shafapourtehrany, 2023). Natural factors mainly contain combustible factors (e.g., vegetation type, moisture content, incendiary, etc.), meteorological factors (e.g., relative humidity, temperature, precipitation, wind speed, etc.), and topographical factors (e.g., elevation, slope, slope direction, slope position, etc.), which are the core input variables of the traditional assessment models; Human factors, encompassing fire management and firefighting, proximity to roads and rivers, and population density (Adab et al., 2018; Milanović et al., 2021), are variables that have garnered heightened scrutiny in recent research. Models that consider natural factors tend to assign excessive risk to climate and vegetation, resulting in an over-dependence on initiatives like “artificial rainfall enhancement” and “vegetation modification” for mitigation and control strategies (Moritz et al., 2014; Schoennagel et al., 2017). In a comprehensive model, integrating human factors allows for more accurate identification of “human behavioral dynamics” and promotes the prevention and control strategy from “passive response to natural risks” to “active control of man-made risks” (Thompson et al., 2022).
Numerous factors affect forest fire risk assessment, such as climate, human behavior, ecology, and regulation, complicating data collection. Despite existing research on the causes of forest fires, victim exposure, and system vulnerability, a comprehensive fire risk assessment method encompassing all these elements has not yet been established (Ministry of Emergency Management of the People’s Republic of China, 2021). Çoban and Özdamar (2014) assessed fire risk in Bucak Forest Enterprise, Turkey, using four factors: human behavior, forest tectonic features, topography, and terrain. Norovsuren et al. (2023) created a multivariate forest fire risk model by incorporating five natural factors: forest index, soil moisture index, surface temperature, slope, and slope direction. Both take into account multiple forest fire factors in an integrated manner, but the evaluation indicator system still has gaps. At the same time, the systematic lack of existing research makes it difficult for the assessment results to fully reflect the mechanisms that contribute to forest fire risk. For example, the limitation of focusing on a single aspect, such as natural. This causes the assessment results to differ from the actual risk scenarios and does not provide a comprehensive decision-making basis for cross-regional and chain-wide fire prevention and control.
At the same time, in addition to the lack of a systematic assessment model, existing models are mostly based on static data inputs, allowing them to only complete the “status quo assessment” and not simulate the evolution of risk distribution over time and space. It is even more difficult to explain the interactive driving effects of multiple factors such as “natural change—human activity—socio-economic.” Sevinc et al. (2020) employed a Bayesian network complex model to forecast the likely causes of forest fires and discovered that the month was a significant variable impacting fire occurrence, showing that fire incidence fluctuated dramatically over time. Toledo-Jaime et al. (2024) used Bayesian approaches and spatial modeling tools to highlight the importance of climate change, land cover, and human activities in driving wildfire trends. They focused on how climate change, land cover, and human activities affect wildfire patterns. The modeling considered human activities and natural changes; however, it failed to incorporate the coupled effects over time and space, as well as the interactions among influencing factors. This limitation hindered a comprehensive understanding of the intrinsic driving mechanisms of forest fires, thereby providing insufficient guidance for local governments in their prevention and management efforts.
Consequently, this paper develops a model aimed at addressing the shortcomings of conventional assessment methods, establishing a closed-loop design of “data—technology—indicators weights—functions”: to address the issues of subjective judgment and challenging data acquisition in conventional assessments, we utilize remote sensing information as the primary data source, gather extensive natural element data from Huanqiu Town, and achieve the integration of multi-source data and spatial analysis through the use of a geographic information system (ArcGIS 10.8). By incorporating natural influencing factors like climate and vegetation, we introduced additional socio-economic indicators, including population density, road network distribution for human activities, and financial expenditures on agriculture, forestry, and the water industry, to develop a comprehensive three-dimensional indicator system of “nature-society-economy” to address the deficiencies of the elemental system.
In the core weight determination link, this paper chooses the improved G1 method, which ensures the logical self-consistency of the expert judgment by introducing the weak consistency qualification and effectively overcomes the potential contradiction of weight calculation in the traditional G1 method. Based on the objective qualities of the data, the improved G1 approach is integrated with the CRITIC method to create the “improved G1-CRITIC” combined empowerment model. The model is scientifically integrated with subjective and objective weights using matrix thinking, which not only successfully relocates its application scenario from building (structure) fires to forest fire risk assessment (Liu et al., 2024), but also fundamentally balances expert experience with the amount of information in the data itself, resulting in a final calculated regional fire risk index that is both professionally insightful and statistically reliable.
Furthermore, using historical data retrospectively, the model cannot only assess the current static pattern of risk, but also reveal the historical evolution of risk, and use GIS technology to visually display its spatial differentiation characteristics, ultimately realizing the analysis of spatial-temporal coupling and multifactorial intrinsic driving mechanism, which overcomes the limitations of traditional static assessment. So far, this study has developed a more scientific and practical evaluation system that includes data, techniques, and outcomes, resulting in a core technological tool for the correct identification, dynamic prevention, and management of forest fires in Huangu Town.
To facilitate readers’ understanding of this paper, its structure is as follows. The first chapter is an introduction to the data and methodology, introducing the process of data extraction and deciphering, while selecting the three dimensional indicators of natural, social, and economic, combining the intrinsic driving mechanism of forest fires, and building the risk assessment model of this paper using the improved ordinal relationship method, the CRITIC method, and the integration of matrix ideas method. Chapter 2 discusses the model’s application in Huangu Town, Zi Yang County, and Ankang City. Based on the model evaluation results, Chapter 3 categorizes the findings into four sections to investigate changes in fire risk over the past decade and their underlying causes. Simultaneously, three indicators were chosen to characterize the actual fire situation, and they were compared to the evaluation results of this paper to preliminarily verify the accuracy of the findings. Chapter 4 discusses changes in fire risk on a seasonal basis using correlation studies, investigates changes in fire risk over 10 years, analyzes the underlying reasons, and summarizes the underlying driving processes. Finally, the study finishes with more explanations.
2 Materials and methods
2.1 Data extraction and decoding
This section delineates the dataset and processing methodologies employed in the development of the forest fire risk assessment indicator system. The following section will begin by describing data sources, such as remotely sensed imagery and its preprocessing processes. It then developed the data interpretation methods and analytical application logic for various indicators such as NDVI, WET, NDBSI, terrain factor, and human activity index. This standardized data processing process aims to lay a solid and consistent data foundation for the subsequent construction of a comprehensive risk assessment model.
2.1.1 Data sources and preprocessing
In this paper, data images acquired by Landsat-8 remote sensing satellites serve as the primary data source for remote sensing interpretation, encompassing a total of ten periods of remote sensing satellite image maps from the same quarter but different years in the relevant region during the decade 2013–2022. To suit research requirements, all data is available in a comprehensive and accurate format.
This paper uses 30 m resolution data to establish a balance between evaluation accuracy and computational efficiency. This resolution has been shown in regional fire risk assessments to successfully characterize macro-geographical causes (such as vegetation continuity and terrain complexity), thereby objectively portraying the spatial patterns of possible fire dangers (Fickas et al., 2016). Simultaneously, this strategy minimizes computational redundancy caused by ultra-high-resolution data, ensuring the model’s operational feasibility and the regional scalability of study results. This decision not only protects computational efficiency over wide areas, but it also assures that study findings can directly affect regional fire resource planning and policy design. Table 1 shows the relevant satellite image data parameters. It is important to note that the purpose of this paper focuses on fire risk appraisal and pattern analysis at the regional level, and the 30 m resolution is sufficient to meet the accuracy criteria at this scale. If the research goal is to monitor specific fires or map them in depth, remote sensing photos with resolutions of 10 meters or higher can be used to gather more thorough information on fire conditions.
TABLE 1
| Satellite | Sensor identification | Image acquisition time | Resolution | Strip number |
|---|---|---|---|---|
| Landsat-8 |
OLI |
2013.7.11 | 30 m (Except 8’ 9’10’ 11-band) |
127–37 |
| 2014.7.14 | ||||
| 2015.7.17 | ||||
| 2016.7.19 | ||||
| 2017.7.03 | ||||
| 2018.7.25 | ||||
| 2019.7.28 | ||||
| 2020.6.25 | ||||
| 2021.7.17 | ||||
| Landsat-9 | 2022.8.13 |
Details on satellite Landsat images.
In this paper, Huangu Town boundary shapefile data (Figure 1a) and a Google HD image (Figure 1b) serve as secondary data sources. These can be used to extract administrative boundary data from other images or datasets, allowing for the actual study area image to be obtained while also serving as a training sample.
FIGURE 1
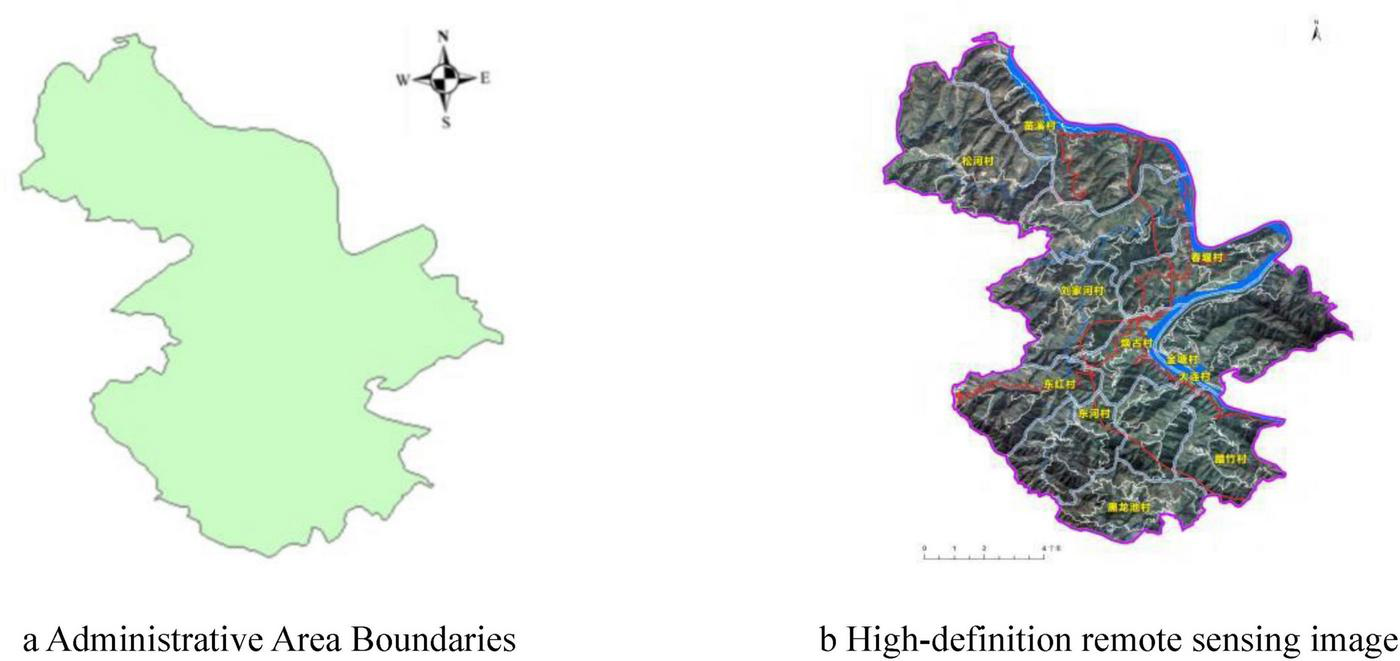
Two maps showing the geographical information of the study area, Huangu Town. (a) The boundary shapefile data of Huangu Town. (b) A high-resolution remote sensing image of Huangu Town, displaying detailed terrain features with clearly labeled roads and water bodies.
Interference from atmospheric conditions, sensor response characteristics, and topographical variations during acquisition can cause radiometric and geometric errors in remote sensing photography, compromising data accuracy and usability. To obtain high-quality analytical data, this study implemented a systematic pre-processing workflow prior to image interpretation: First, raw imagery with low cloud coverage was selected at the source. Radiometric and atmospheric corrections were then applied to the raw picture to remove atmospheric scattering and absorption effects, restoring ground features’ real reflectance. Geometric corrections were then applied to compensate pixel coordinate errors caused by terrain and sensor orientation. Finally, the valid region was accurately extracted using water body masking and research area cropping. This procedure creates a solid data foundation for future precise information extraction and analysis. Figures 2a, b show some of the preprocessed photos of the village of Huangu.
FIGURE 2
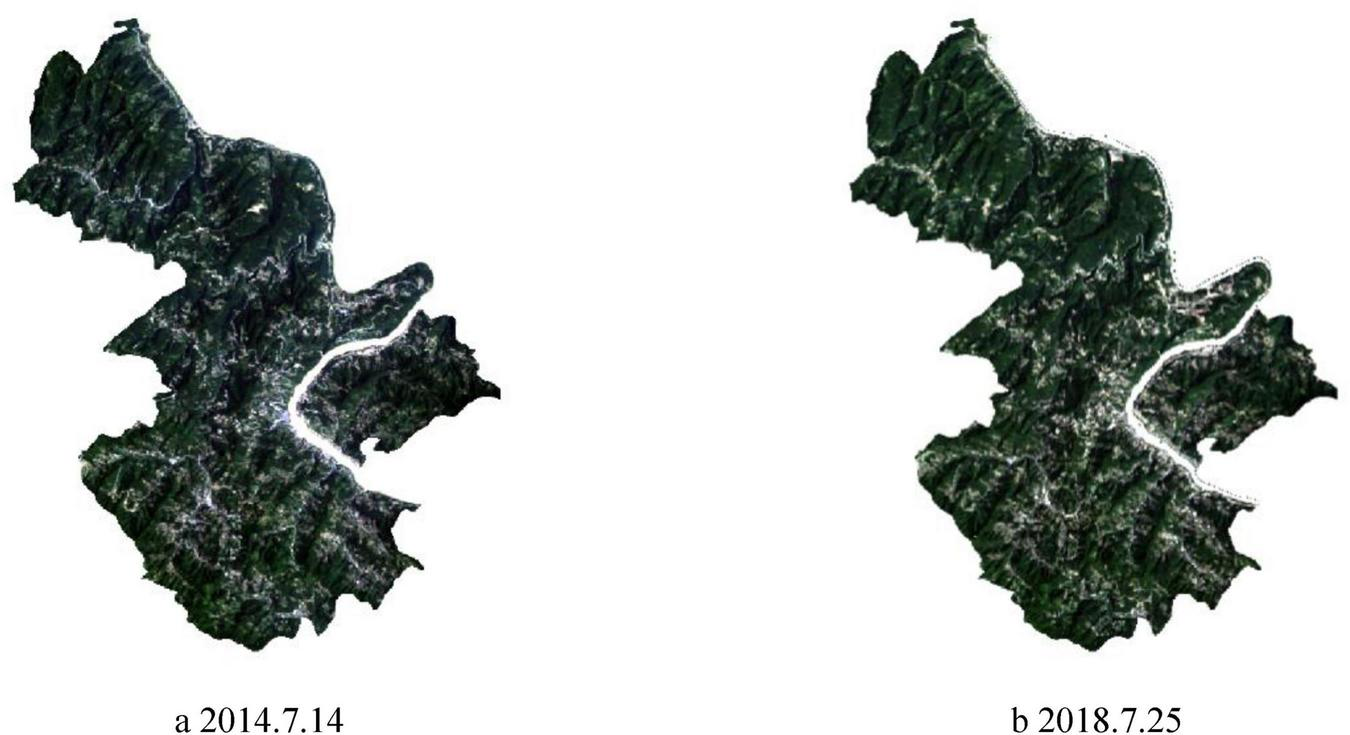
Results of preprocessing the remote sensing imagery for the study area (including radiometric calibration, atmospheric correction, geometric correction, water mask, and image cropping). (a) Image from July 14, 2014. (b) Image from July 25, 2018.
2.1.2 Data interpretation
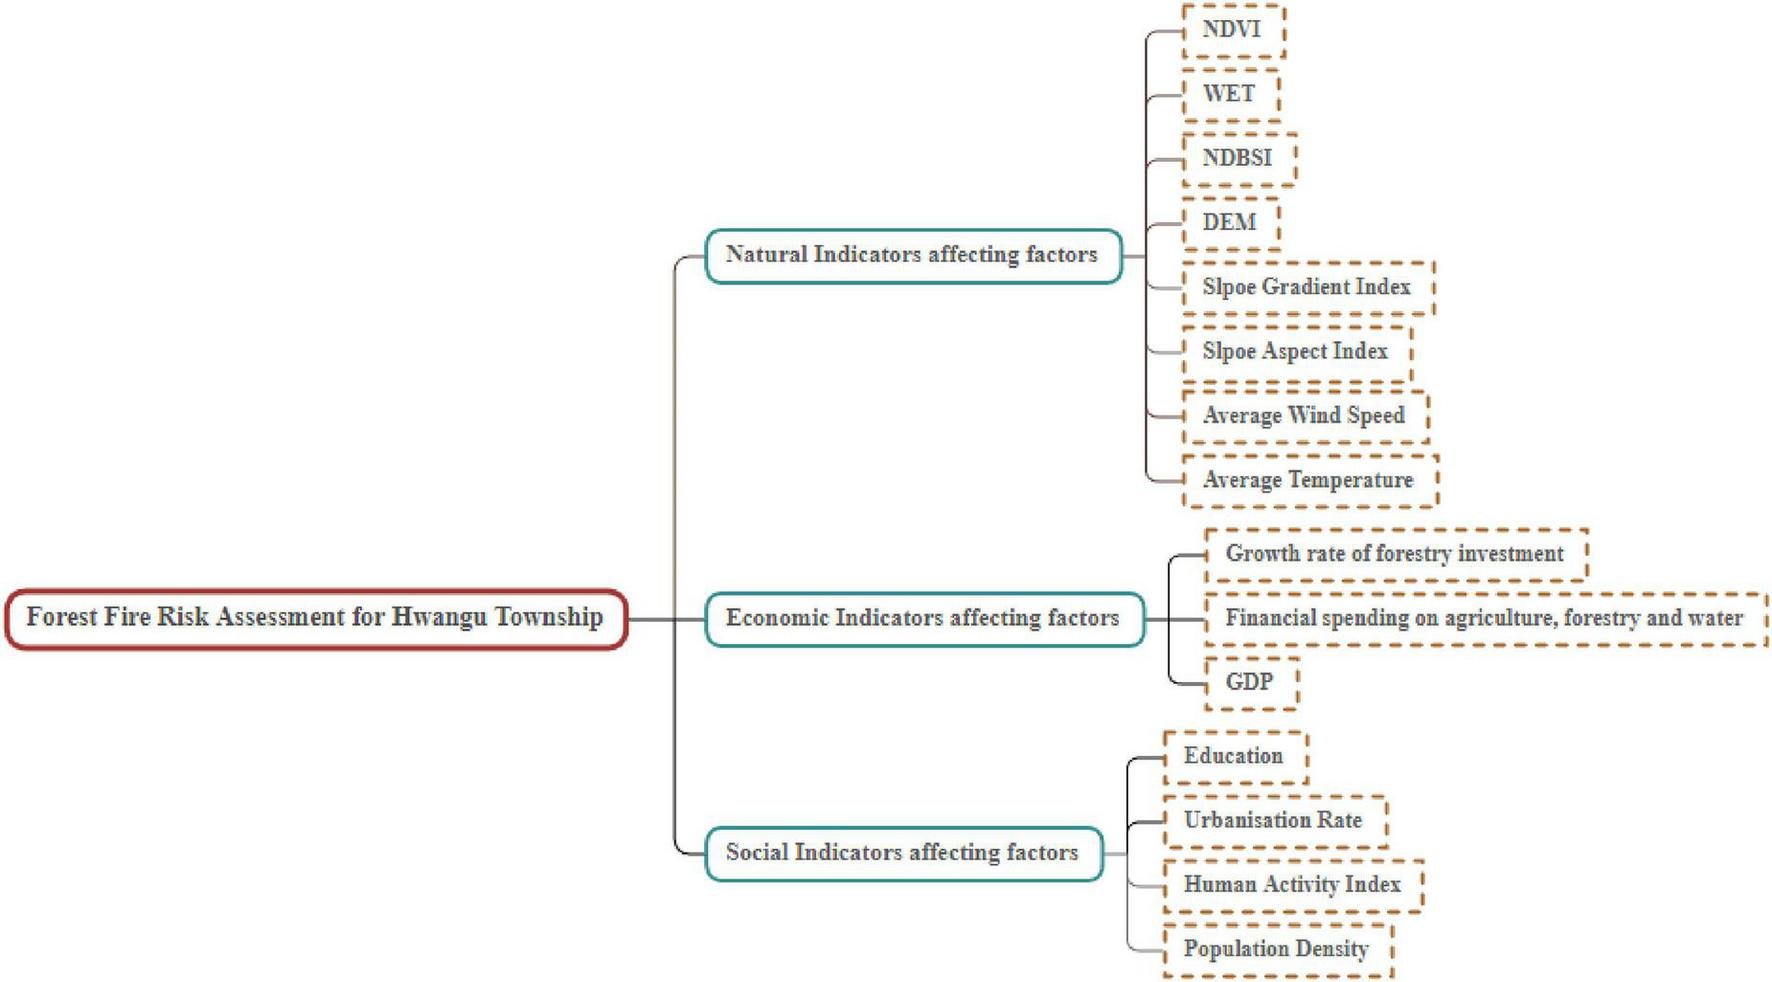
This work combines the “Forest Fire Danger Assessment Technical Engineering” (Ministry of Emergency Management of the People’s Republic of China, 2021), “Forest Fire Risk Assessment and Zoning Technical Regulations” (Ministry of Emergency Management of the People’s Republic of China, 2021), and related literature, Natural factors such as NDVI (Normalized Difference Vegetation Index), WET (Wetness index), NDBSI (Normalized Difference Built-up and Bareness Index), the average wind speed, and the average temperature were found to have a substantial correlation with forest fire risk. At the same time, topographical factors in natural indicators such as DEM (slope height), Slope Gradient, and Slope Aspect, as well as social indicators such as Human activity index and Population density, all have an impact on forest fire risk (Chen et al., 2025; Konurhan et al., 2025; Li et al., 2024; Wasserman and Mueller, 2023; Yi, 2024). This paper instead uses natural indicators, such as NDVI, WET, NDBSI, DEM, Slope Gradient, and Slope Aspect, average wind speed, and average temperature, to investigate the relationship between these factors and the risk of forest fires. The data sources for each indicator are listed in Table 2.
TABLE 2
| Natural indicators | Data type | Acquisition method |
|---|---|---|
| NDVI, WET, ND BSI, DEM, slope gradient, and Slope Aspect | Raster(.tif) | Geospatial data clouds |
| Average temperature and wind speed. | Tabular(.xlsx) | Ziyang County’s Natural Resources Bureau |
Natural indicator data sources.
This section uses Huangu Town, Zi Yang County, Ankang City, Shaan Xi Province, as a case study to demonstrate how to evaluate NDVI, WET, NDBSI, DEM, Slope Gradient, and Slope Aspect from a remote sensing image.
In the world of remote sensing, various land cover types exhibit distinct spectral features in imaging. These differential spectral responses provide the fundamental physical basis for recognizing and inverting surface characteristics. For regional-scale forest fire risk assessment, vegetation cover state is one of the most important risk indicators. This study uses the spectral information included in remote sensing imagery to thoroughly characterize and evaluate the growth status and biomass condition of forests in the study region by computing the greenness index.
The Normalized Difference Vegetation Index (NDVI) dataset is one of the study’s key data layers. NDVI accurately depicts vegetation coverage density and growth vigor by quantifying vegetation’s differential absorption and reflection characteristics in the red and near-infrared spectral regions. To correctly capture the peak growth phase of forests within a calendar year and completely examine the possible impact of this phenological period on fire danger, this study used remote sensing footage from June to August each year. Using the Equation 1 NDVI calculation function, to get its NDVI data value, through the observation data, to determine the confidence interval, according to the characteristics of the study area, we will be the Huangu Town confidence interval as the cumulative regional percentage of 5–95%. The NDVI values were normalized using the resulting confidence intervals, and the TIFF-format image of the NDVI was imported into ArcGIS to generate the results displayed in Figure 3a.
FIGURE 3
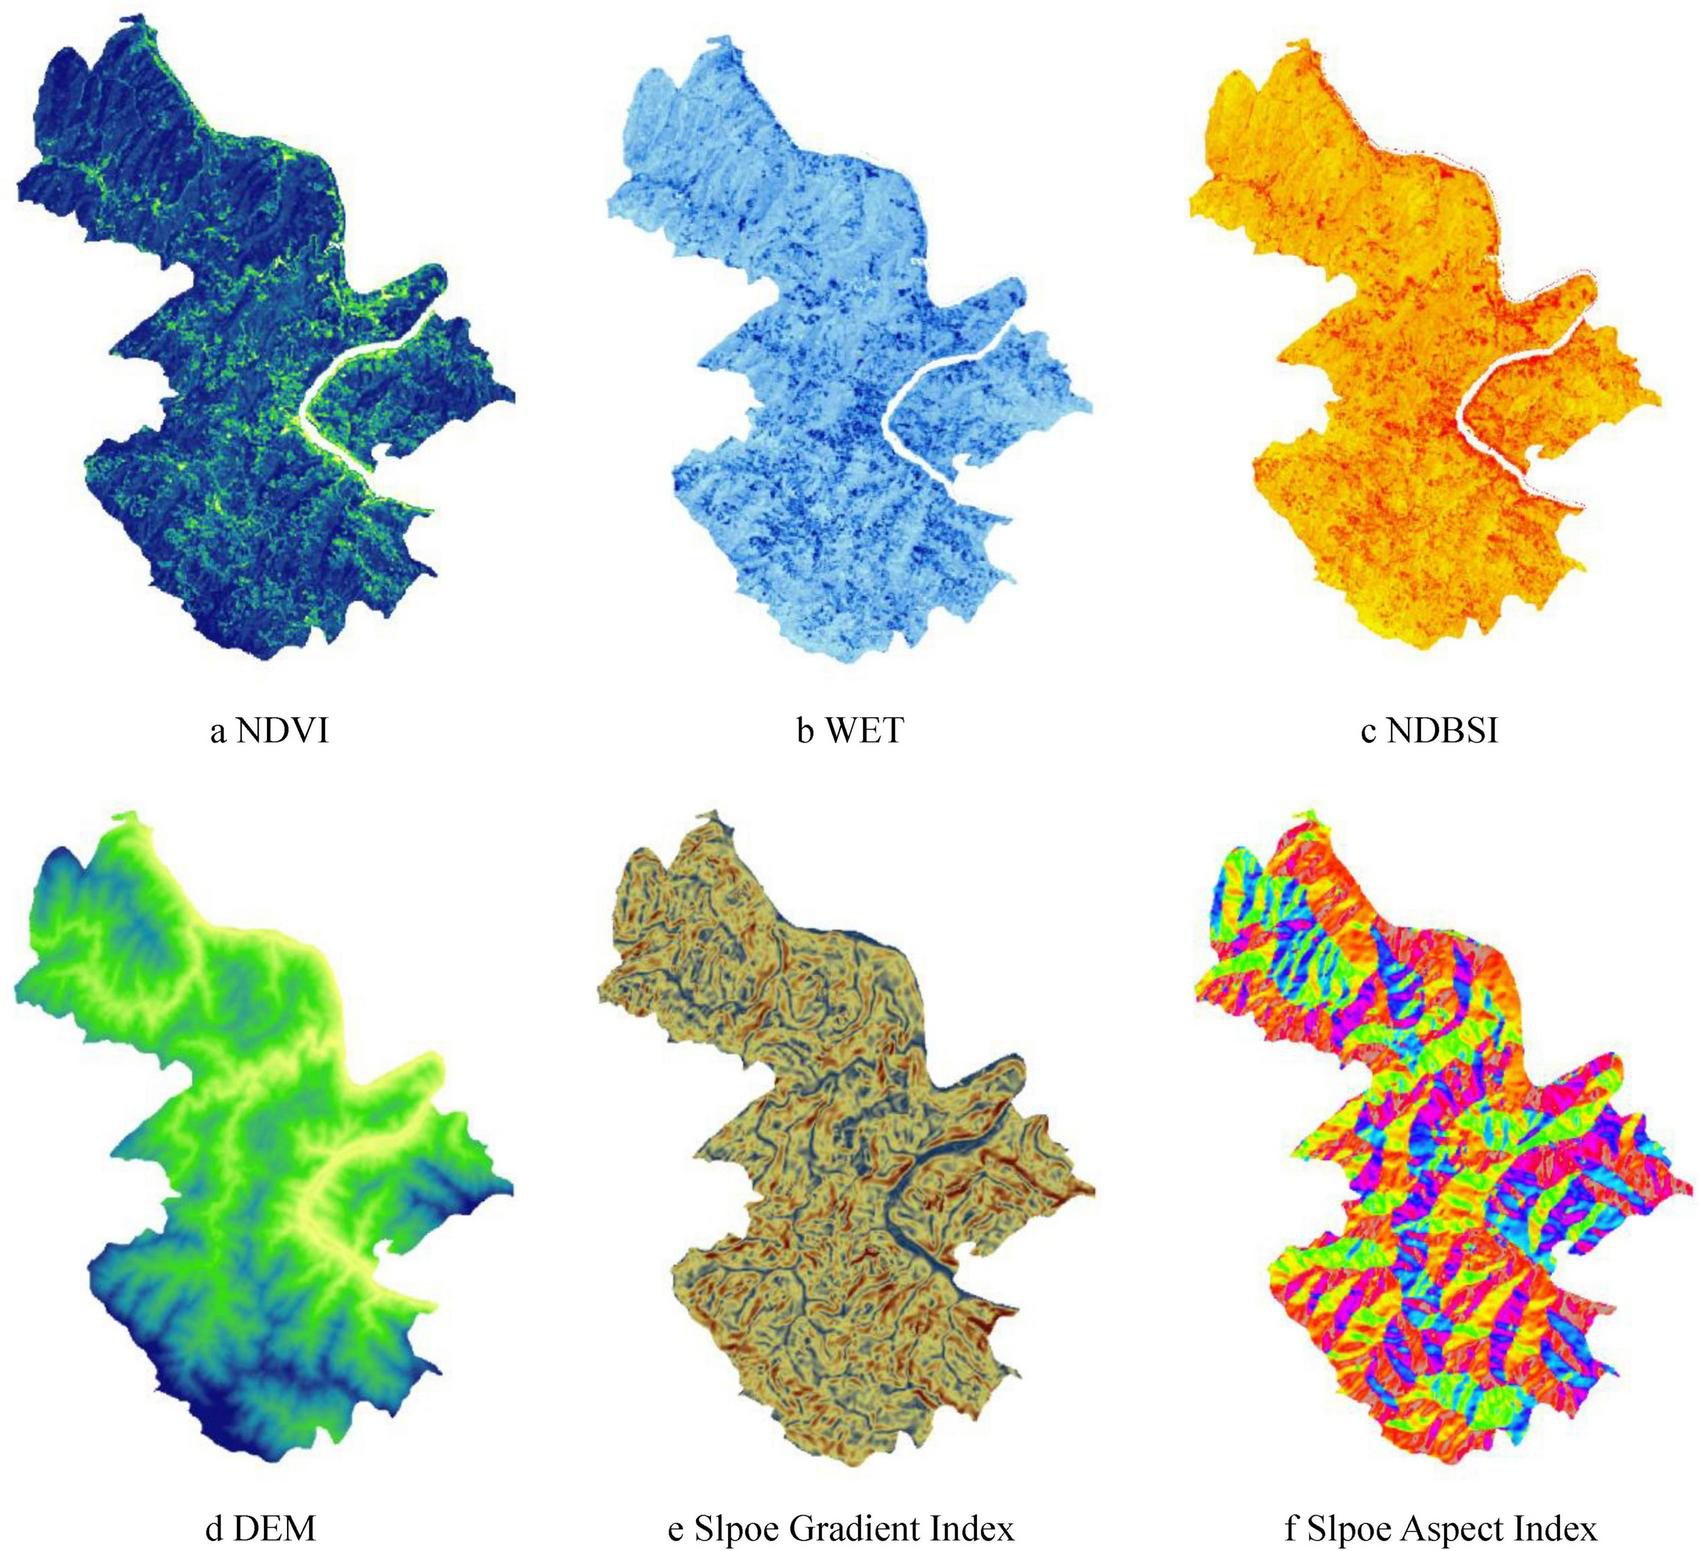
Six maps visualizing different geographical indices for Huangu Town. (a) NDVI, (b) WET, (c) NDBSI, (d) DEM, (e) Slope Gradient, and (f) Slope Aspect. Each map outlines the same area, using distinct color schemes to highlight data characteristics for the relevant indices.
Where NIR is the near-infrared band, R is the red light band.
Regarding WET, this paper uses the same preprocessed image of the study region to calculate the correlation index using Equation 2, and the humidity index infographic is displayed in Figure 3b.
In the context of the NDBSI, which primarily indicates the impact of impervious surfaces like bare land and urban structures, the IBI and SI were employed to signify surface desiccation in the study area (Chen and Luo, 2009; Wang, 2021; Zheng et al., 2024). The calculation as shown in Equations 3, 4, with the final NDBSI illustrated in Figure 3c.
Using the GIS “Slope” and “Aspect” tools, this paper analyzes the DEM (Figure 3d) and presents the derived Slope Gradient (Figure 3e) and Slope Aspect (Figure 3f) results.
In addition to interpreting natural factors, this study used the GIS multi-ring buffer analysis function to calculate the distances from each forest patch in the assessment area to roads and rivers, resulting in road distance distribution datasets and river distance distribution datasets. Based on the field survey results, road and river distances were classed individually, resulting in the Road Distance Distribution Map (Figure 4a) and the River Distance Distribution Map (Figure 4b). Given the strong correlation between the extent of human activity and the distance of roads and rivers from forests, this paper characterizes the distribution of distance from roads and rivers in order to compare the current situation of forest fires in the study area to the region’s human activity index (Ma, 2024).
FIGURE 4
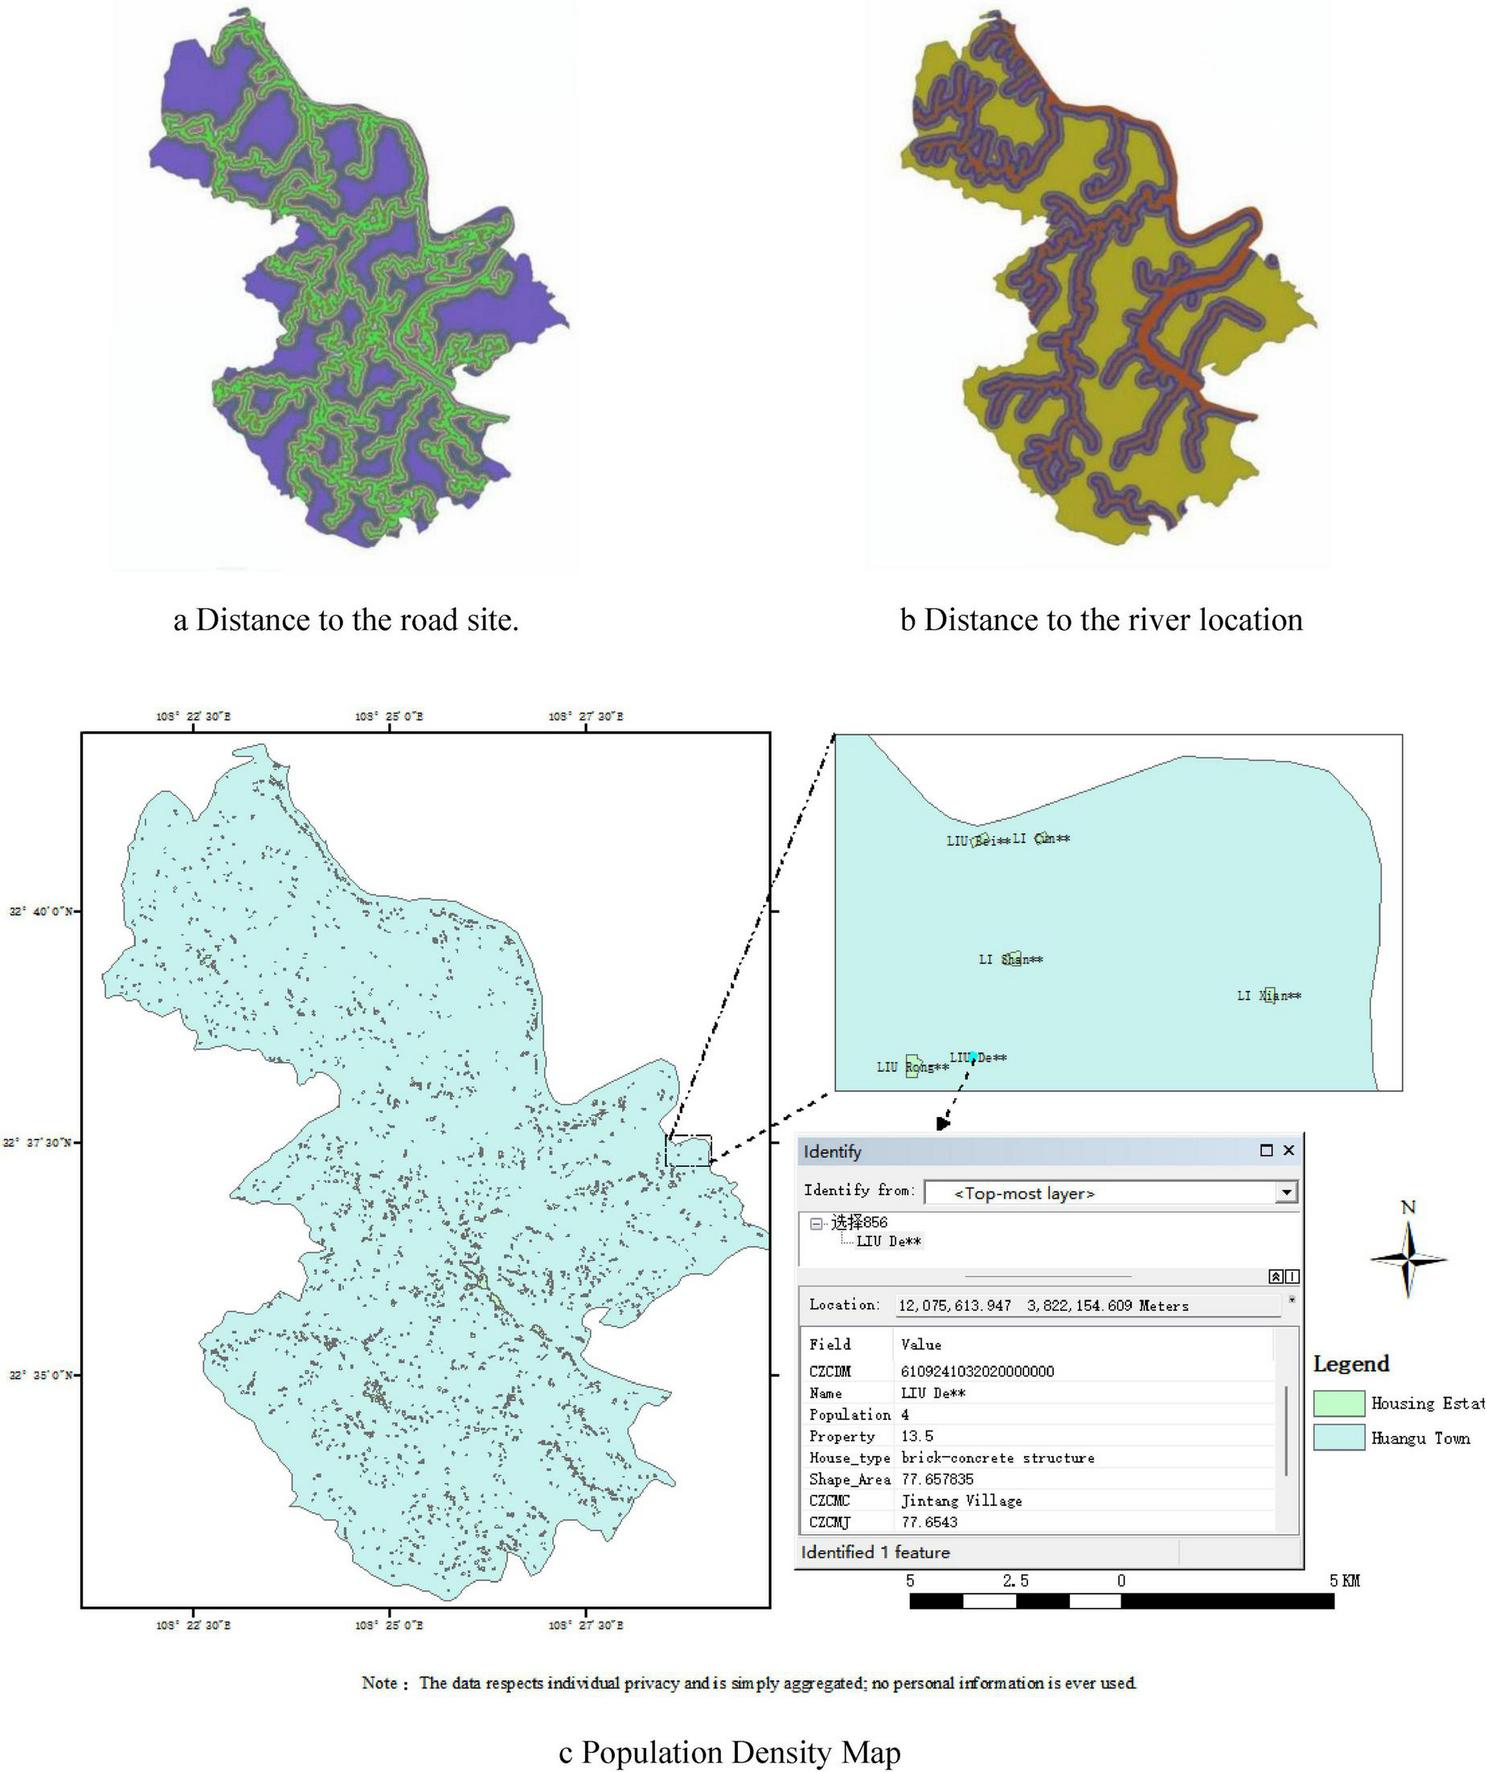
Three maps reflecting social indicators in the study area. (a) Distance from human activity areas to roads, (b) distance from human activity areas to rivers, and (c) population density (green patches indicating settlements, with an enlarged inset and a data box detailing location attributes).
Finally, using the quasi-precise data from the Eighth National Population Census and the findings of field verification, this study created an expandable, iteratively updated dataset of population distribution density for the study region. This dataset was used to create the population density map depicted in Figure 4c. This dataset achieves the integrated consolidation of macro-level distribution patterns and micro-level attribute information: at the macro level, it clearly reveals the spatial differentiation patterns of population density; at the micro level, it supports point-selection queries for any specific disaster-bearing entity (such as residential settlements) to obtain multidimensional attribute information including household head names, resident population figures, property.
Simultaneously, based on the data features that the indicator data are of various types and have distinct quantitative outlines, this work standardizes the decoded data such that the data of other indicators have the same quantitative outline (0–1). If the trend effect of the indicator on the vulnerability of a hazard-bearing body is positive, it is normalized using Equation 5. If the indicator has a negative trend influence on the vulnerability of a hazard-bearing body, Equation 6 is used to normalize it.
In conclusion, according to the Technical Regulations for Forest Fire Danger Assessment, the primary geographic fire impact elements used in this work are listed in the Table 3:
TABLE 3
| Indicator | Hidden meaning | Indicator | Hidden meaning |
|---|---|---|---|
| NDVI | Normalized greenness index | WET | Ground humidity index |
| NDBSI | Drying index assessment of forest fire impacts | DEM | DEM effects on forest fires |
| Slpoe Gradient Index | Slope effects on forest fires | Slpoe Aspect Index | Effect of slope orientation on forest fires |
| Human Activity Index | Assessing the extent of the fire | Population density | Assessment of fire frequency |
Geographical fire impact factors.
2.2 Models for assessing forest fire risks
This section aims to develop a thorough forest fire risk assessment model to quantify fire danger in the study area. The model utilizes multi-source data derived from the preceding text, spatial analysis through GIS and RS technology, and the computation of the forest fire danger index as per Equation 7, ultimately achieving the visualization and delineation of risk zones. First, the model’s theoretical framework will be established to explain its core idea of coupling natural direct drive and socioeconomic indirect regulation factors, as well as to demonstrate the applicability of GIS and RS technologies in dealing with such spatial problems, thereby providing a logical starting point for the overall assessment. Following that, the emphasis will be on assigning weights to the indicators in the model, utilizing “matrix thinking” to integrate the subjective experience of the improved ordinal relationship method with the objective data of the CRITIC method, to scientifically determine each indicator’s contribution to the final risk index. Figure 5 depicts the model’s constructed fire impact factor relationships.
FIGURE 5
Relationships among fire impact factors.
This study employs distinct treatments for each type of impact factor required by the model, tailored to their data characteristics. Spatial processing and analysis of natural geography and social human activity factors utilize ENVI and ArcGIS; natural climatic, economic, and other social factors were extracted and applied using the Ankang Statistical Yearbook. A mathematical model is uniformly applied to all factors to ascertain the value of their contribution to the impact of fire occurrence.
Finally, the fire hazard in the study area is estimated using Equation 7 and assessed for each unique location within the study area.
HI Is the Forest Fire Danger Index.
wi Is the weight of indicator i in the secondary indicator of hazard.
Is the value of the ith indicator upon standardization.
2.2.1 Assessment modeling basis
Following a comparison of assessment models grounded in Information Diffusion Theory, General Risks, Prediction of forest-fire, and GIS, RS (Bai and Zhang, 2008; Huang et al., 1998; Wang et al., 2021), the GIS, RS assessment model was chosen for this study. The model uses GIS and RS to gather information and figure out the fire danger area by processing and analyzing spatial data from each part. Support for spatial decision making (Hassan Abedi Gheshlaghi et al., 2020), and its interactive structure has significant advantages in identifying forest fire danger zones, which is preferred by forestry users (Bonazountas et al., 2005) Studies have demonstrated (Gabban et al., 2006; Lin et al., 2013; Liu et al., 2016; Maktav, 2009; Xu et al., 2019)that GIS and RS can precisely extract indicators of natural variables, including slope height and slope gradient, through their advanced spatial data processing, analysis, and visualization functionalities, rendering them suitable for evaluating regional forest fire risk.
The risk of forest fires comes from the interactions between the Natural system and Economic and Social systems: Natural elements (flora, terrain, climate) predominantly influence the onset and physical dynamics of fires via direct drive pathways, resulting in observable, ephemeral effects. Economic and Social factors (urbanization, gross domestic product (GDP), investment in disaster prevention) indirectly alter the distribution of combustibles and the spatial arrangement of fire sources through gradual reconfiguration pathways, resulting in cumulative effects (Chen et al., 2023; Li et al., 2021; Ruan, 2024; Wei, 2022; Xu et al., 2024a).
This paper presents a comprehensive assessment model of forest fires, incorporating the influencing factors from natural, economic, and social dimensions, utilizing GIS and RS technologies. The model can be customized for different regions, and the risk zoning maps and classifications it makes can clearly show how fire danger varies by location due to differences in the environment, economy, and society. Furthermore, it is not limited to particular data sources. This study not only gives current evaluation results, but also establishes a dynamic assessment system capable of continual self-optimization in tandem with advances in data technology.
2.2.2 Evaluation of the approach for determining model weights
To address the issue of indicator weighting in forest fire risk assessment, this study systematically compared multiple mainstream methodologies (including the Analytic Hierarchy Process (AHP), Delphi method, Improved Method for Rank Correlation Analysis, Entropy Weighting Method (EWM), CRITIC method, Principal Component Analysis (PCA), Grey Relational Analysis (GRA), the Matrix Ideation Integration Method, and Game Theory)(Nejatiyanpour et al., 2025),. Based on the analysis shown in Table 4, the following composite weighting approach was developed:
TABLE 4
| Weighting type | Selection method | Methods not selected | Core principle | Rationale for exclusion |
|---|---|---|---|---|
| Subjective weighting | Improvement of the ordinal relationship method (improvement of G1) | AHP (Analytic Hierarchy Process) | Constructs hierarchical judgment matrices and assigns weights after passing a consistency check. | 1. Pairwise comparisons become cumbersome with numerous factors ( ≥ 10 factors require ≥ 45 comparisons);2. The consistency check often fails, and the adjustment cost is high 2. The consistency test is easy to fail, and the adjustment cost is high. |
| Delphi method | Conducts multiple rounds of anonymous consultations to assign weights upon convergence of opinions. | 1. The multi-round feedback cycle is long and inefficient; 2. Expert opinions are prone to divergence and difficult to converge. |
||
| Objective weighting | CRITIC | EWM (Entropy Weight Method) | Assigns weights based on information entropy (variability) | Only considers variability while ignoring correlations between factors, easily leading to double-counting in weight assignment. |
| GRA (Gray Relation Analysis) | Assigns weights based on the degree of correlation with a reference sequence. | Relies on a reference sequence (subjective interference), fails to correct for redundant information between factors, and lacks sufficient objectivity. | ||
| PCA (Principal Components Analysis) | Reduces dimensionality to extract principal components and assigns weights based on the variance contribution rate. | 1. Dimensionality reduction loses the intrinsic meaning of individual factors; 2. Principal components hardly correspond to the original factors, resulting in poor interpretability of the weights. |
||
| Combined weighting | Matrix Ideation Integration Method | GT (Game Theory) | Constructs a subjective-objective game model to find the Nash equilibrium. | 1. The subjective and objective aspects are not opposing interest entities, making the game theory logic invalid.2. The solution process is complex and has high data requirements. |
Indicator system for forest fire risk assessment.
In terms of subjective weighting, The Improved Method for Rank Correlation Analysisis (Improved G1 Method) used. This strategy provides effective weighing by having experts rank indicators based on their relative value. It not only effectively captures professional experience, but it also eliminates the time-consuming pairwise comparisons and consistency testing issues associated with the Analytic Hierarchy Process (AHP). Furthermore, it addresses the Delphi method’s drawbacks, which include long cycles and difficulty attaining consensus.
For objective weighing, the CRITIC approach is used. This method takes into account both the variability and conflict between evaluation indicators. Its weighting results are more complete than those of the Entropy Weighting Method (EWM), which just considers variability. It overcomes the Gray Relational Analysis (GRA) method’s reliance on subjectively defined reference sequences and avoids the problems of the Principal Component Analysis (PCA) method, in which dimensionality reduction results in the loss of the original factors’ physical meaning and poor weight interpretability.
Finally, the matrix approach was used to integrate the previously indicated subjective and objective weightings. This method uses linear combinations to balance subjective and objective weights, avoiding the logical inconsistencies inherent in game-theoretic approaches due to the non-antagonistic nature of the subjective-objective weighting relationship, while also yielding a more straight forward and stable solution process. Furthermore, this strategy allows for variable adaptability to different fire circumstances by altering combination coefficients, resulting in the most appropriate weighting configuration.
Improved G1 Method (IG1): The sequential relationship approach (G1) is a subjective empowerment technique that expands on the hierarchical analysis method (AHP). It determines indicator weights based on the decision maker’s ordinal associations between different indicators. Specifically, the decision maker ranks the indicators in order of relevance, then estimates the importance ratio of adjacent indicators, and lastly calculates the weights of each indicator.
The improved G1 Method (Xu et al., 2024b), on the other hand, optimizes the traditional ordinal relationship method, and on the basis of the original ordinal relationship method, which requires the evaluation indicators to satisfy the condition of strong consistency among them, it proposes that the evaluation indicators satisfy the weak consistency. The weak consistency is that the importance ratio between indicators should not only satisfy the relationship between two neighboring indicators, but also satisfy the relationship between this indicator and other indicators (formula 1.9), to be more consistent with objective reality. For example, if a group’s correlation index is arranged as C1>C2>…>Cn, the contribution degree ratio must be satisfied C1−1.8Cn≤0, in order for the rk value to Table 5 requirements.
TABLE 5
| r k | Clarification |
|---|---|
| 1.0 | C k–1 makes the same amount of contribution as Ck |
| 1.2 | C k–1 provides slightly more than Ck |
| 1.4 | C k–1, where Ck contributes much more |
| 1.6 | C k–1 is significantly larger than the Ck contribution |
| 1.8 | C k–1 and Ck contributions are particularly substantial |
r k : assignment reference
Furthermore, when calculating the weights of the indicators, not only is the subjective judgment of the experts used, but also the objective information (li) of the indicator data is incorporated, making weight allocation more fair. The specific calculation steps employ the following Equations 8–12:
(1) The experts give the ordinal relationship in the set of contribution rates {C1, C2,…, Cm} as C1*>C2*>…>Cm*, which, for convenience of writing and without loss of generality, is nonetheless reported as C1>C2>…>Cm.
(2) Given the rational judgment of the ratio of the relative contributions of Ck–1 and Ck, let the rational judgment of the experts on the ratio of the contributions of the evaluation indicators be
Table 5 shows the assignment of rk.
(3) Calculate the contribution rate Cj
Solution:
(4) Calculation of weighting factors
Where lk represents the value of the indicator attribute as processed by the extreme value algorithm.
CRITIC method: The CRITIC (Criteria Importance Through Intercriteria Correlation) approach (Koulelis and Mitsopoulos, 2007) is an objective weight assignment method established by Diakoulaki in 1995. The essential notion is to assign weights to the indicators based on the contrasting and conflicting nature of the two fundamental principles. One is comparative, which reflects the extent of the gap between the values of the same indicator over time, expressed as standard deviation. The larger the standard deviation, the greater the gap between the indicators on the time series, and the higher the weight. The second stage involves examining the conflict between the indicators using the correlation coefficient. For example, a significant positive correlation between two indicators suggests that they are less contradictory and hence will have lower weights. The specific weighting calculation steps are as shown in Equations 13, 14.
-
(1)
Let Cj signify the amount of information included in the jth assessment indicator. Cj can be expressed as
Where . Signifies the quantity of information contained in the jth assessment indication, and rtj represents the correlation coefficient between evaluation indicators t and j.
(2) The more Cj, the more information contained in the jth assessment indication, the greater the relative value of that indicator; hence, the objective weight of the jth indicator is
Matrix Idea Integration Method (MIIM): The Matrix idea is a way of thought that involves the matrix-like examination and regularization of raw perceptual input. It focuses on breaking down complex situations into their parts and analyzing these elements from multiple perspectives to generate a systematic, logical, and comprehensive understanding of the problem.
The Matrix Idea Integration Method (Shi et al., 2022) is a way of applying matrix concepts to integration learning. It creates matrices that combine information from numerous models or data sources, hence improving decision accuracy and stability. The outputs of several models or information from data sources are first organized into a matrix, and the information in the matrix is then fused using matrix operations (e.g., weighted summation, matrix multiplication, etc.) to provide a consolidated judgment. Finally, based on the performance feedback from the fusion results, the matrix construction and fusion technique are modified to further enhance the integration impact. The specific calculation steps are shown in Equations 15, 16:
-
(1)
Calculate the significance coefficients of subjective and objective weights and φi
Where vi and wi represent the subjective and objective weights.
(2) Calculate the cumulative weights of the evaluation indicators Qi
Objective weighing can occasionally provide misleading results due to sample data; however, subjective weighting can be heavily influenced by human experience. To address these issues, this paper develops a system of empowerment that is naturally articulated and gradually expanded. To begin, the improved G1 Method was employed as a starting point to convert domain specialists’ deep understanding of fire processes into a set of structured subjective weights via ranking and rational judgment, thus creating the professional foundation for the weighting system. Second, the CRITIC method quantifies the volatility of the indicators and the correlation between them using historical data, generating weights that are entirely based on objective statistical laws, effectively avoiding bias caused by subjective preferences. Finally, the Matrix Idea Integration Method serves as a fusion hub, constructing an optimization model that systematically seeks an ideal solution that minimizes the sum of deviations from the subjective and objective weights (Chen et al., 2011).
This process places the expert’s “empirical wisdom” and the data’s “objective evidence” on an equal footing for weighing and integrating, and eventually outputs a set of comprehensive weights that are both in line with professional cognition and verified by the data, thus providing the core support for the construction of a scientific, reliable, and interpretable. This offers the foundation for the development of a scientific, accurate, and interpretable forest fire risk assessment model. Finally, this empowerment method is applied to the subject area of this paper to provide empirical support.
Based on the preceding discussion and the finalization of the findings on the concepts, the ideas and techniques of this work are summarized and presented in Figure 6 to provide a clearer illustration of the process of developing the assessment model.
FIGURE 6
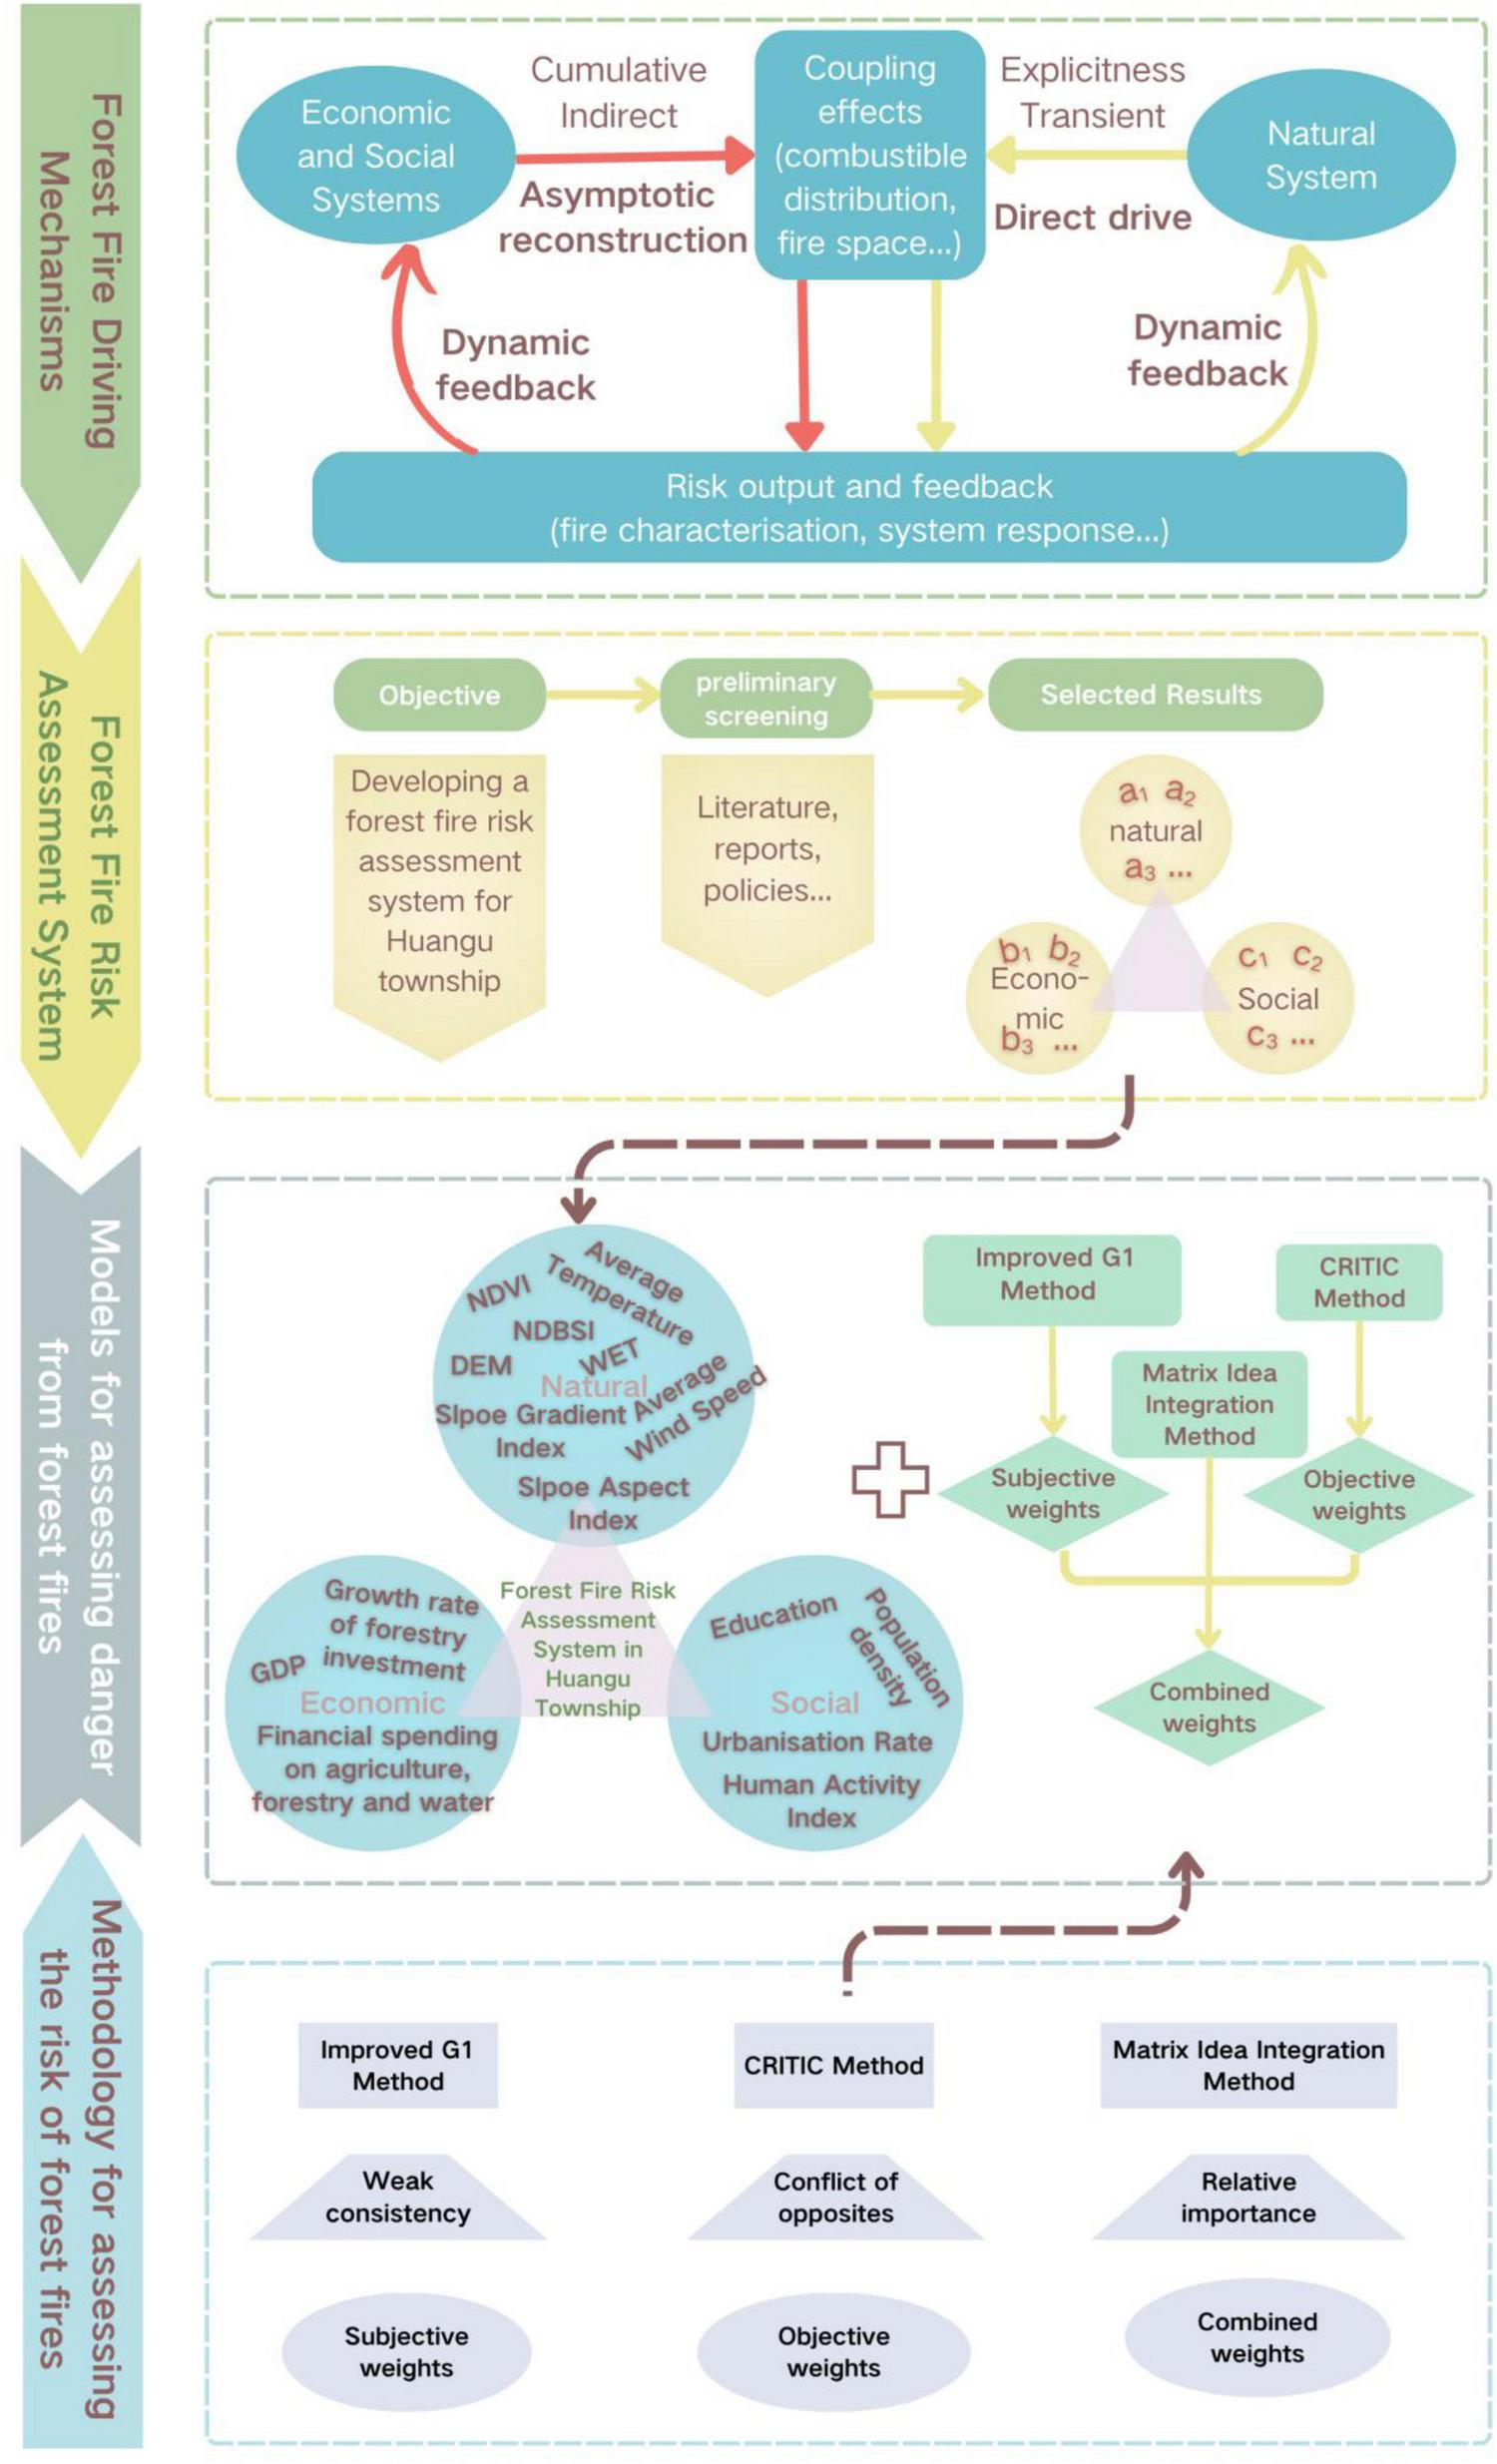
Assessment model construction diagram.
3 Example applications
3.1 Study area
Huangu Town is in Ziyang County, Ankang City, Shaan Xi Province. It is situated in the northwestern portion of Ziyang County, bordering Artemis Town and Shuang’an Town to the east, Chengguan Town and Xiangyang Town to the south, Hongchun Town and Dongmu Town to the west, and Hanwang Town to the north (as shown in Figure 7). 11 administrative villages govern Huangu Township and have a north-south length of 10.1 kilometers, an east-west breadth of 18.5 kilometers, and a total area of 108.58 square kilometers, with the town covering 102 square kilometers. The Qinling Mountains in the north and the Ba Mountains in the south form a screen, with overlapping mountains and gullies within their territory, which has a typical subtropical humid monsoon climate.
FIGURE 7
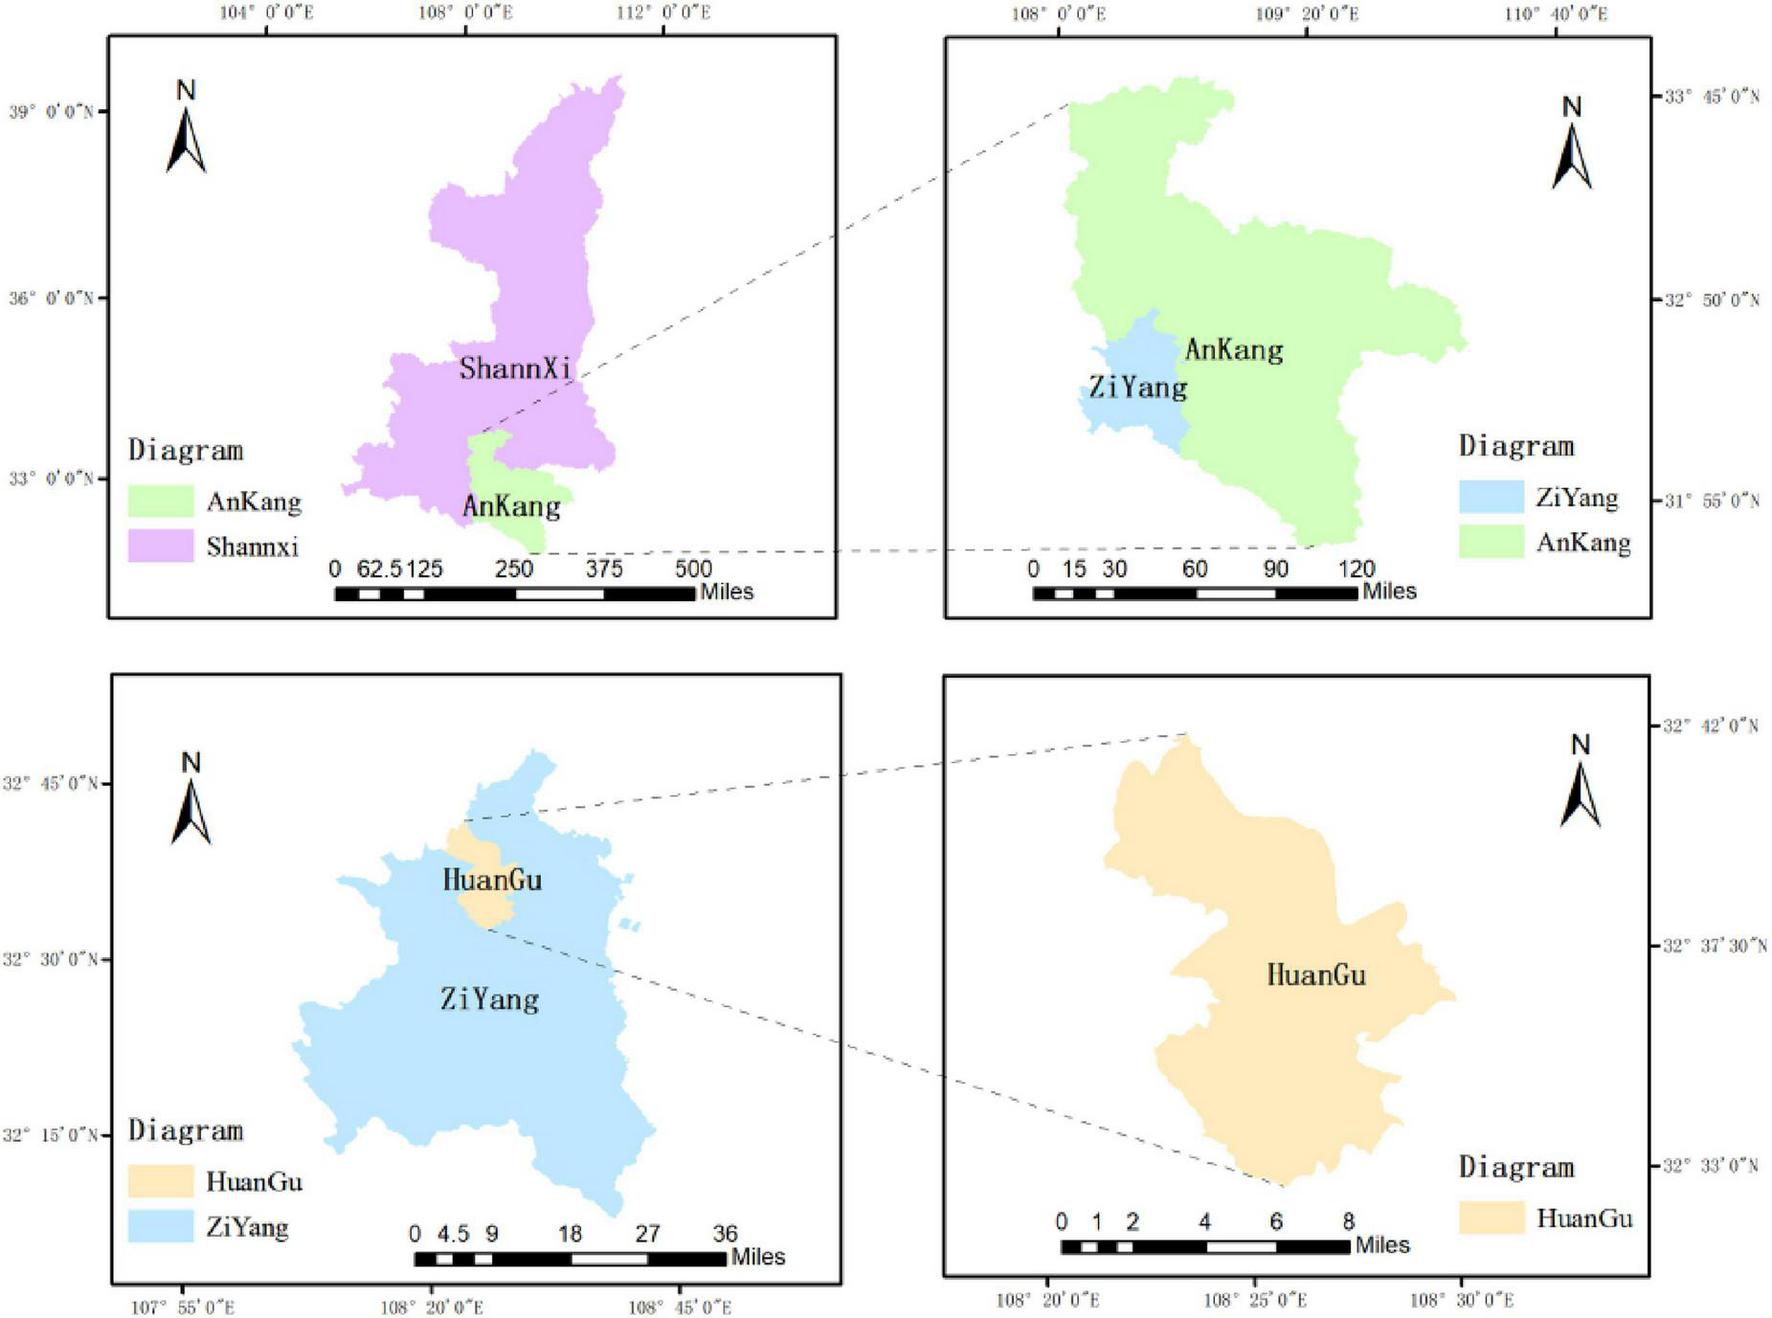
Geographical location of Huangu Town.
The township contains two first-class tributaries of the Han River (Ayu River and Song River), and the Han River runs for 20 kilometers, making it a water resource-rich area (Figure 8b). Mountains and gullies intersect on the land. Figure 8a depicts the geomorphological map of Huangu Town, with the highest point located at Bee Bucket Temple (1,300 m) and the lowest point at Ankang Reservoir (331 m). Huangu’s resources are unique; Huangu tea has a long history, and its mineral-rich soil is abundant. The region has been proven to have mining potential for more than 10 different minerals, making it an essential part of the Han River’s green economic corridor. Since 2000, the town has been actively implementing the “science and technology town, specialty town, mineral town, tourism town” development strategy, optimizing the investment environment and forcefully improving transportation, energy, communications, and other facilities.
FIGURE 8
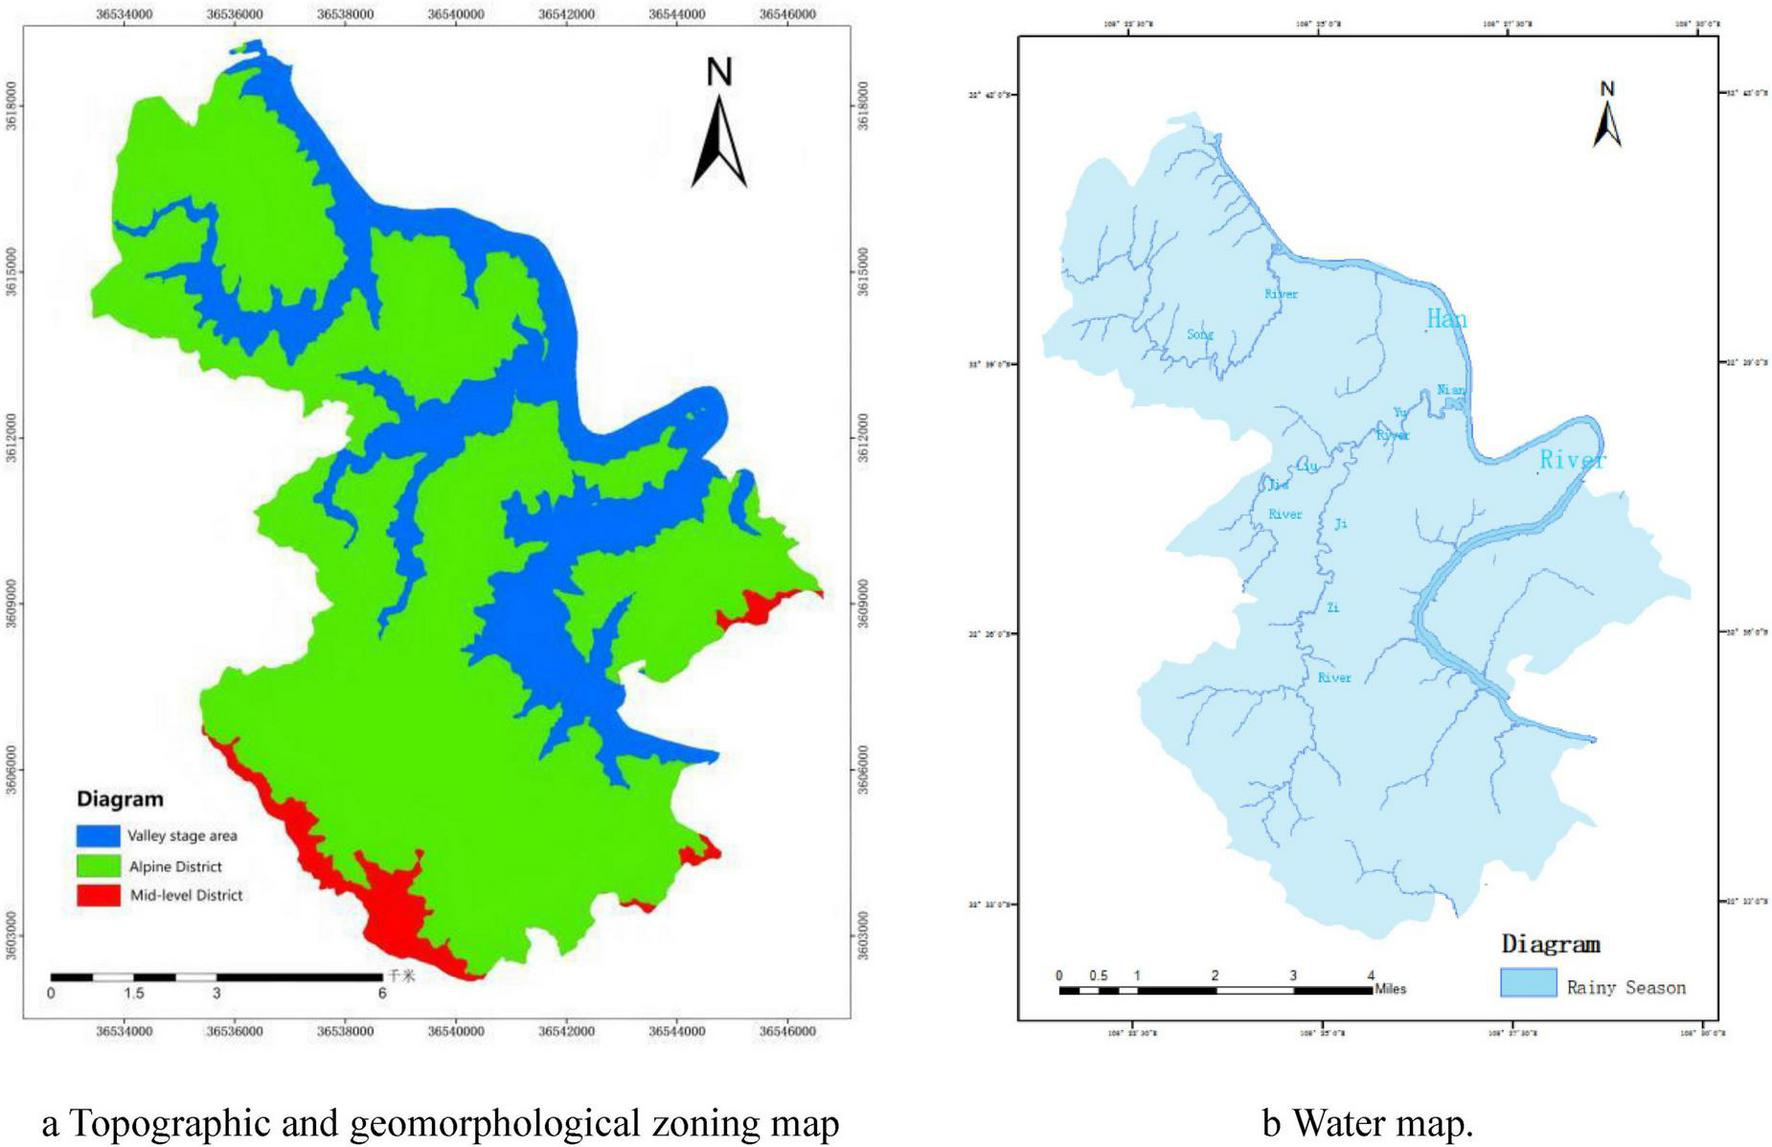
Two thematic maps of Huangu Town. (a) Geomorphological zoning map showing valley terraces (blue), alpine district (green), and mid-level district (red). (b) River system map highlighting watercourses and their names in blue.
3.2 Evaluation of model applications
This study chose 15 quantitative variables from three dimensions to build a forest fire risk assessment model: environmental circumstances, the economic environment, and social elements. This comprehensive indicator approach seeks to systematically reflect the multi-scale driving factors that underpin fire risk creation. All indicators have explicit theoretical foundations and meet the criteria for longitudinal data availability (Han, 2019; Zhang and Wei, 2012).
At the natural dimension, indicator selection is based on three key categories: combustible material, topography, and weather circumstances. Flammable material conditions are quantified using the NDVI, WET, and NDBSI, which together describe the state of flammable material. Terrain conditions are defined by slope gradient, aspect, and DEM. These elements have a direct impact on fire spread behavior because they modify solar radiation reception and topographical dynamic impacts. Meteorological conditions, as measured by average temperature and wind speed, are important environmental variables that influence the drying rate of flammable materials and the rate at which fire fronts progress.
In the economic dimension, the indicators are concerned with a region’s capacity for fire prevention investment and development pressures. The Growth rate of forestry investment and Financial spending on agriculture, forestry, and water directly reflects the government’s financial support for the development of forest fire prevention infrastructure, the formation of professional teams, and the implementation of sophisticated technologies. Higher investment levels usually suggest a more thorough proactive defense strategy (Ager et al., 2020). Gross Domestic Product (GDP) captures the dual effects of economic development: on the one hand, increased economic activity may increase the likelihood of fire sources by increasing the frequency of human effort; on the other hand, developed economies have greater resource allocation capacity, which improves overall disaster prevention capabilities. This two-way influence has been proven in several regional case studies (Zhao, 2022).
In terms of social aspects, the indicator framework focuses on the level of human activity and community understanding of disaster resilience. Human Activity Index and Population Density directly measure the possible distribution frequency of human fire sources. According to spatial analysis studies, these factors have a substantial positive link with the chance of fire incidence (Yang et al., 2021). Urbanization rates, as a composite measure of modifications in land use patterns, affect the distribution of vegetation and population structures in peri-urban fringe zones, resulting in unique fire risk situations. This mechanism is especially pronounced in fast emerging regions (Gong et al., 2023). Education is widely regarded as an important proxy variable for assessing community fire safety knowledge and regulation compliance. Empirical research shows that increased educational levels help to reduce the likelihood of human-caused fires through behavioral change, while also encouraging more active participation in fire prevention activities among community members (Wang et al., 2023).
In summary, this research proposes an indicator system for assessing forest fire risk, which comprises three Level 1 indicators and fifteen Level 2 indicators. The forest fire danger status from June to August 2013-2022 served as the basic unit of assessment, as shown in Table 6.
TABLE 6
| Level 1 indicators | Level 2 indicators | Indicator properties | Source of data | ||
|---|---|---|---|---|---|
| Name | Code | ||||
| Indicator System for Forest Fire Risk Assessment in Huangu Town | Natural indicators | NDVI | X1 | Forward direction | Remote sensing technology |
| WET | X2 | Negative direction | |||
| NDBSI | X3 | Forward direction | |||
| DEM | X4 | Negative direction | |||
| Slpoe Gradient Index | X5 | Negative direction | |||
| Slpoe Aspect Index | X6 | Forward direction | |||
| Average Wind Speed | X7/m⋅s–1 | Forward direction | |||
| Average Temperature | X8/°C | Forward direction | |||
| Economic Indicator | Growth rate of forestry investment | X9/% | Negative direction | Official websites of local government agencies, such as the Shaanxi Provincial Bureau of Statistics, Ankang Municipal People’s Government, and Ankang Municipal Bureau of Statistics, among others | |
| Financial spending on agriculture, forestry, and water | X10//ten thousand | Negative direction | |||
| GDP | X11/billions | Forward direction | |||
| Social Indicators | Education | X12/people | Negative direction | Remote sensing technology | |
| Urbanization Rate | X13/% | Forward direction | |||
| Human Activity Index | X14 | Forward direction | |||
| Population density | X15 | Forward direction | |||
Indicator system for forest fire risk assessment.
Table 7 shows the values of the qualities of each indicator in Huangu. Town.
TABLE 7
| Year | 2013 | 2014 | 2015 | 2016 | 2017 | 2018 | 2019 | 2020 | 2021 | 2022 |
|---|---|---|---|---|---|---|---|---|---|---|
| X1 | 0.7307 | 0.8149 | 0.7739 | 0.8594 | 0.885 | 0.9067 | 0.9035 | 0.8916 | 0.7286 | 0.8254 |
| X2 | 0.4326 | 0.389 | 0.4944 | 0.5913 | 0.3665 | 0.3474 | 0.3497 | 0.5316 | 0.5735 | 0.5418 |
| X3 | 0.4866 | 0.3279 | 0.4676 | 0.6964 | 0.4288 | 0.34 | 0.4589 | 0.4802 | 0.4831 | 0.2886 |
| X4 | 0.6743 | 0.6743 | 0.6743 | 0.6743 | 0.6743 | 0.6743 | 0.6743 | 0.6743 | 0.6743 | 0.6743 |
| X5 | 0.4454 | 0.4454 | 0.4454 | 0.4454 | 0.4454 | 0.4454 | 0.4454 | 0.4454 | 0.4454 | 0.4454 |
| X6 | 0.3092 | 0.3092 | 0.3092 | 0.3092 | 0.3092 | 0.3092 | 0.3092 | 0.3092 | 0.3092 | 0.3092 |
| X7 | 1.1 | 1.1 | 1.1 | 1 | 1 | 1 | 0.9 | 0.8 | 0.8 | 1 |
| X8 | 25.8 | 24.47 | 24.17 | 25.7 | 25.8 | 26.2 | 24.74 | 24.83 | 24.73 | 27.43 |
| X9 | -22.48 | 138.86 | 38.31 | -7.35 | -23.64 | 42.8 | 10.1 | -16.2 | 3.6 | -2.8 |
| X10 | 25,060 | 21,907 | 21,358 | 41,639 | 49,083 | 53,476 | 116,358 | 208,849 | 80,717 | 71,645 |
| X11 | 55.34 | 64.79 | 75 | 81.23 | 90.77 | 103.65 | 109.2869 | 100.6707 | 107.8442 | 108.7844 |
| X12 | 46,085 | 46,564 | 46,857 | 47,476 | 48,417 | 48,106 | 48,242 | 47,478 | 46,028 | 43,381 |
| X13 | 32.54 | 33.91 | 35.22 | 37.03 | 38.08 | 39.91 | 41.76 | 43.64 | 45.3 | 46.07 |
| X14 | 0.1072 | 0.1064 | 0.1059 | 0.105 | 0.103 | 0.1017 | 0.1014 | 0.1004 | 0.0996 | 0.099 |
| X15 | 147.4961 | 146.3954 | 145.7074 | 144.4691 | 141.7173 | 139.9287 | 139.5159 | 138.14 | 137.0393 | 136.2137 |
The attribute values of forest fire risk assessment Indicators in Huangu Town.
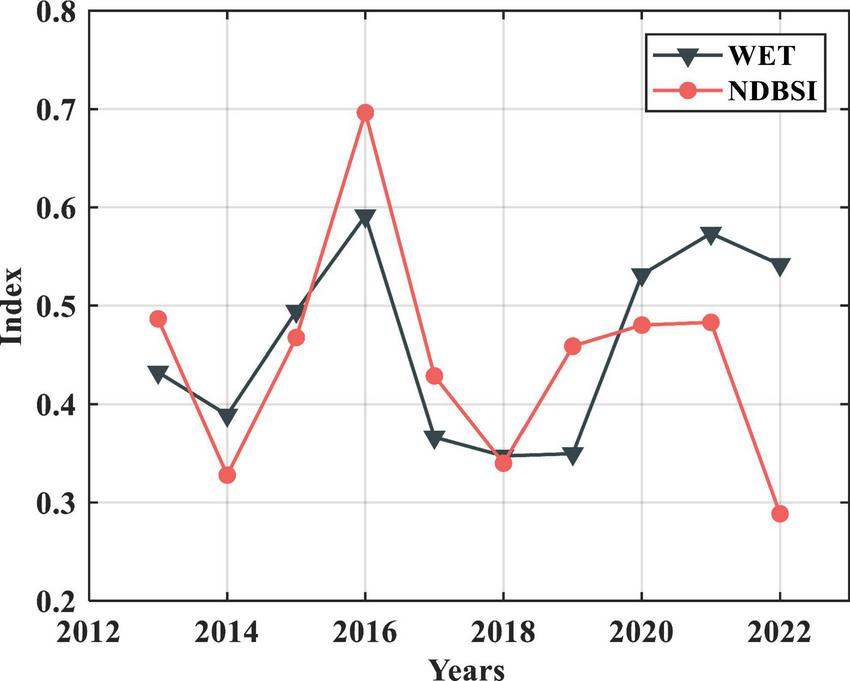
According to research (Lu and Tang, 2018), the WET and NDBSI are negatively correlated, and both have an impact on forest fire danger. Therefore, this paper uses the correlation analysis method to verify the accuracy of the results obtained between these indicators.
Figure 9 shows a significant positive association between the WET and the NDBSI, as they have the same magnitude after data normalization and exert the same influence on the convergence of forest fire threat. This is also consistent with the real-world relationship between WET and NDBSI, suggesting that the deciphering index is right.
FIGURE 9
Correlation of WET and NDBSI.
According to the data in Table 7, the subjective weights of the indicators were computed using the improved G1 method, while the objective weights were derived using the CRITIC method. Finally, using the “Matrix Idea” integration method, subjective and objective weights are combined to generate a comprehensive weight, making the final weight assignment more acceptable and precise. The weight assignment table is presented below (Table 8), and Figure 10 depicts the weight fitting method.
TABLE 8
| Indicators | Subjective weights (%) | Objective weights (%) | Combined weights (%) |
|---|---|---|---|
| X1 | 21.2691 | 8.6238 | 18.1288 |
| X2 | 9.5321 | 8.6580 | 9.3787 |
| X3 | 5.6644 | 6.3900 | 6.2233 |
| X4 | 0.7516 | 0.4425 | 0.5155 |
| X5 | 0.9532 | 3.2163 | 1.7188 |
| X6 | 1.2244 | 6.3412 | 5.6720 |
| X7 | 10.1712 | 7.5582 | 9.3182 |
| X8 | 6.7010 | 5.9418 | 6.5270 |
| X9 | 1.2937 | 6.5250 | 5.8225 |
| X10 | 2.5782 | 6.2181 | 5.2997 |
| X11 | 3.8416 | 8.8578 | 7.5519 |
| X12 | 2.9603 | 6.7644 | 5.7679 |
| X13 | 5.2220 | 8.7687 | 7.6594 |
| X14 | 13.2634 | 7.8291 | 11.5703 |
| X15 | 14.5740 | 7.8651 | 12.5747 |
Assignment of weights to assessment indicators.
FIGURE 10
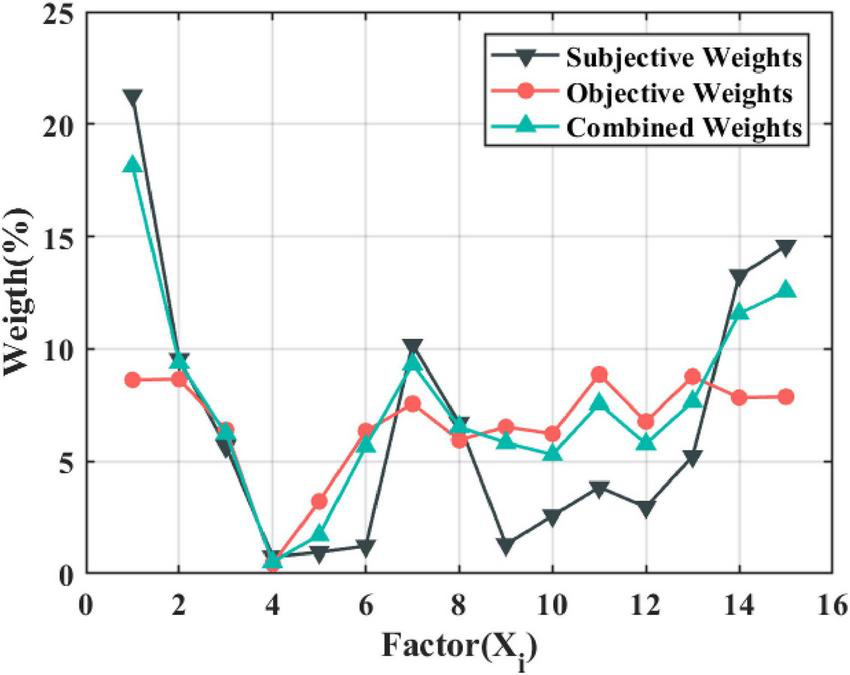
Weight-fitting procedure.
4 Results
4.1 Forest fire risk values
The forest fire risk assessment model established in the previous section, combined with the data in Tables 7, 8, was used to calculate the forest fire risk index of each region within the study area using the ArcGIS raster calculator to assign reasonable weights to each index.
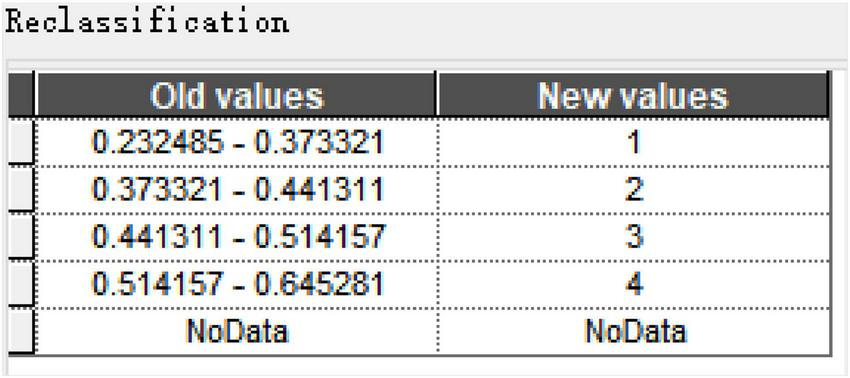
With reference to the The classification for casualty accidents of enterprise staff and workers ( GB/T 6441–1986) and the Rank of the regionalization on nationwide forest fire risk (LY/T 1063–2008), using the standard deviation grading method of ArcGIS raster data analysis, the fire risk values were then categorized into security risk levels from low to high, low risk, general risk, higher risk, and significant risk, respectively, these levels were denoted by the colors blue, yellow, orange, and red. The risk reclassification table is displayed in Figure 11.
FIGURE 11
Reclassification chart.
According to the stages and methods outlined above, a four-color map of forest fire danger in Huangu Town was created for the period from June to August 2013 to 2022. The maps for 2020 and 2021 are shown in Figures 12a, b respectively.
FIGURE 12
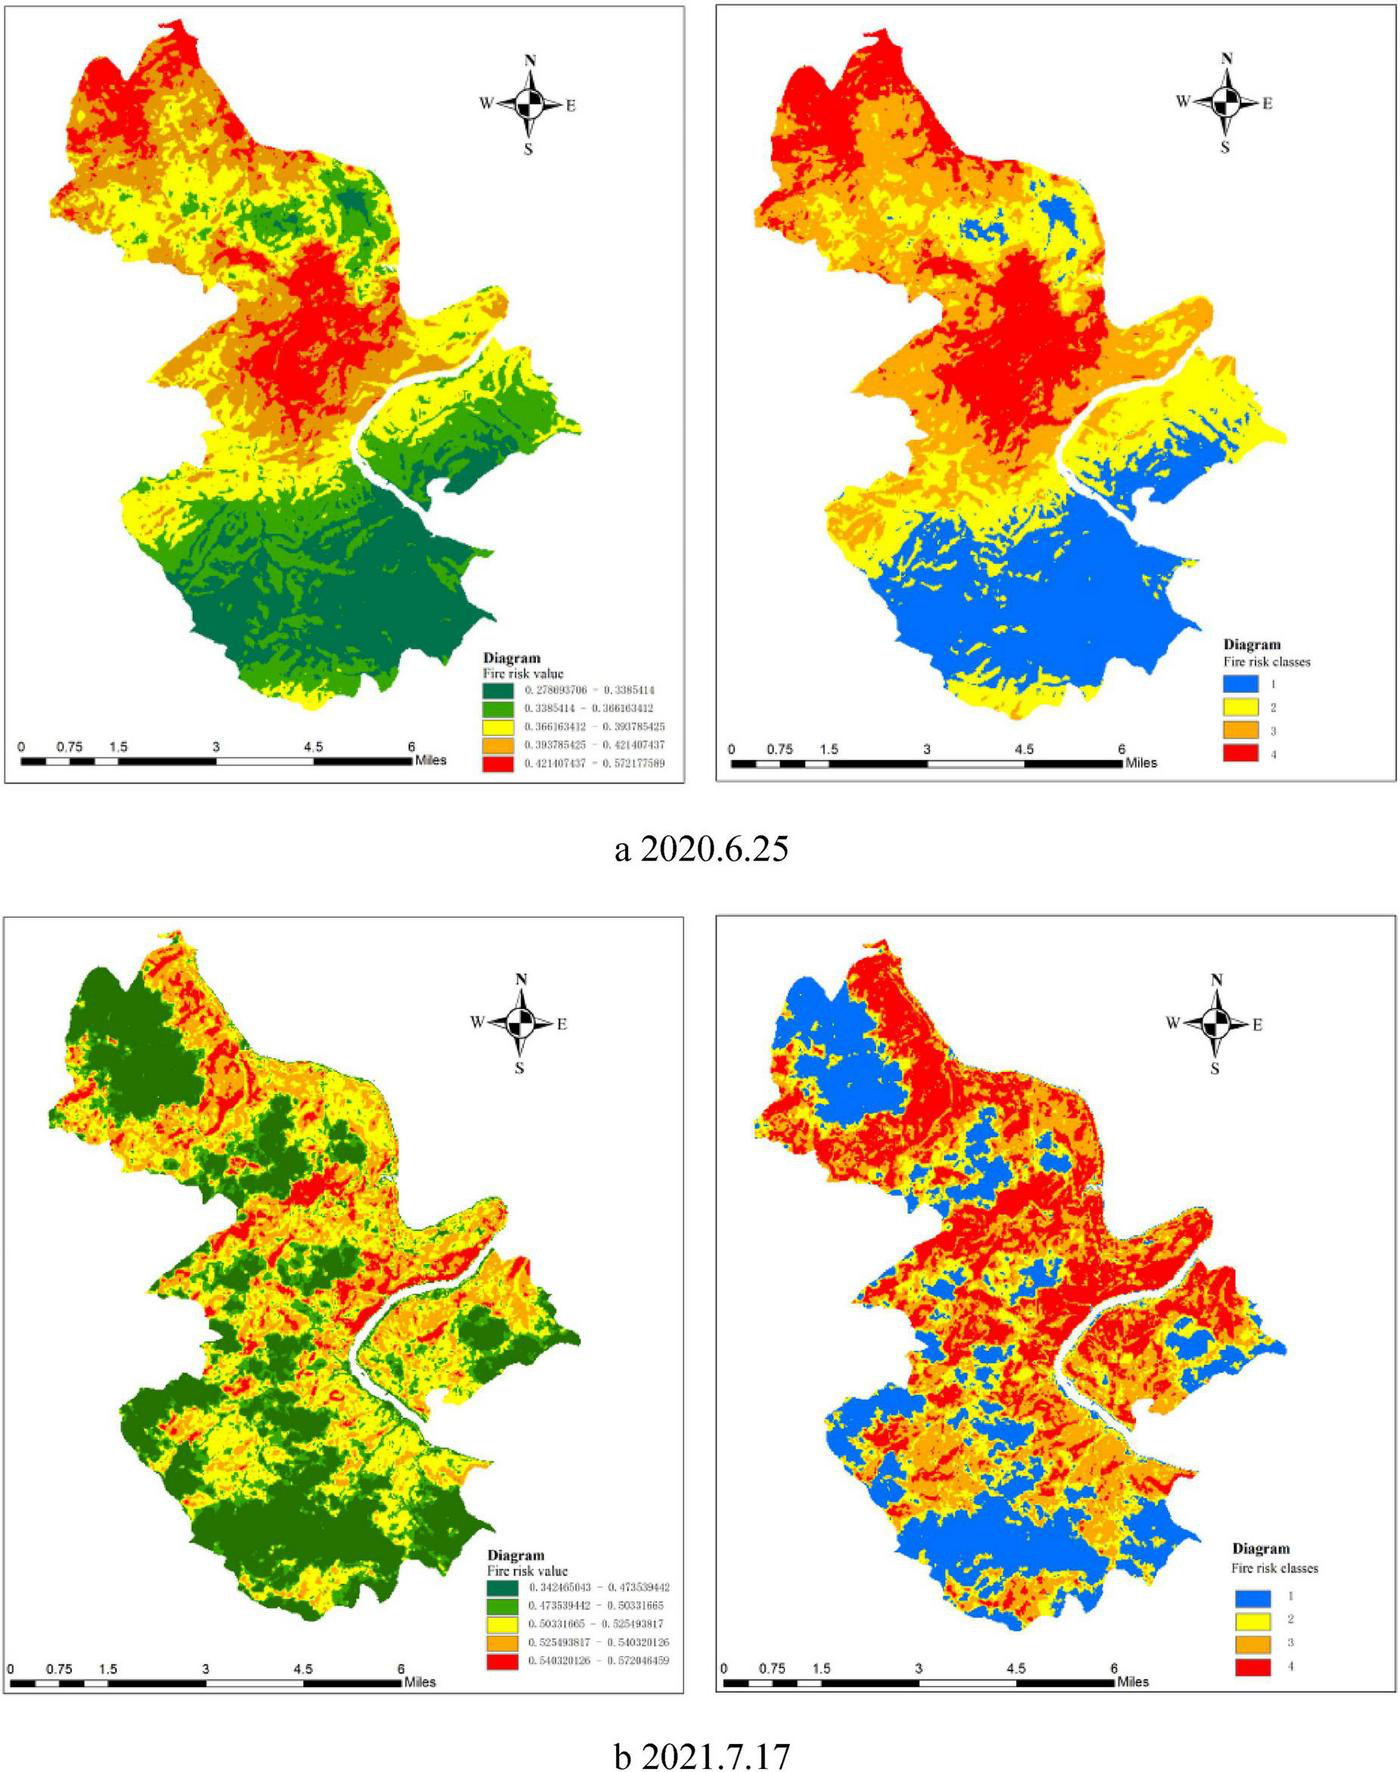
A comparison of fire risk values and their reclassified levels in Huangu Town on two different dates. (a) Fire risk and classification for June 25, 2020. (b) Fire risk and classification for July 17, 2021. The color scale represents risk levels: blue for low risk, yellow for general risk, orange for higher risk, and red for significant risk.
When the risk maps for forest fire risk in the region are compared, it is clear that the four-color map of risk in 2021 has a higher proportion of orange (greater risk) and red (significant risk) within the same season, and that the value of forest fire risk in 2021 is significantly higher than the overall value of forest fire risk in 2020. The analysis of relevant data in the study area reveals that drought yellow warnings were issued several times in 2021, and the risk of forest fires in the region follows a corresponding pattern with the NDBSI and forest vegetation cover, which is consistent with the actual situation.
4.2 Current fire conditions and forest fire hazard index
Using publicly available government data on forest fires from 2015 to 2022, a multiple linear regression model was built with Forest coverage rate, Emergency response efficacy, and Overfire area chosen as multidimensional validation indicators to verify the study’s assessment accuracy. By systematically gathering data on successive fires and employing the least squares method for parameter fitting and optimization (R2 = 0.85), we ultimately derive the expression presented in Equation 17 to characterize the actual fire situation.
The “Forest fire area/Forest cover” ratio is a standardized ratio that assesses the intensity of fire damage per unit of forest resource, with a coefficient of 0.03 reflecting the weighting of this damage’s contribution to the overall fire outcome. “Emergency Response Efficiency” is a composite indication of the quickness and efficacy of firefighting operations, with a negative value of -0.005 indicating a substantial suppression effect on fire as a mitigation factor. The constant term 0.25 indicates the research area’s intrinsic base level of fire risk, which is a background value determined by static elements such as climate, vegetation flammability, and so on, and which persists even when no open fires occur.
Finally, a graph relating the evaluation results to the forest fire condition is created, as illustrated in Figure 13.
FIGURE 13
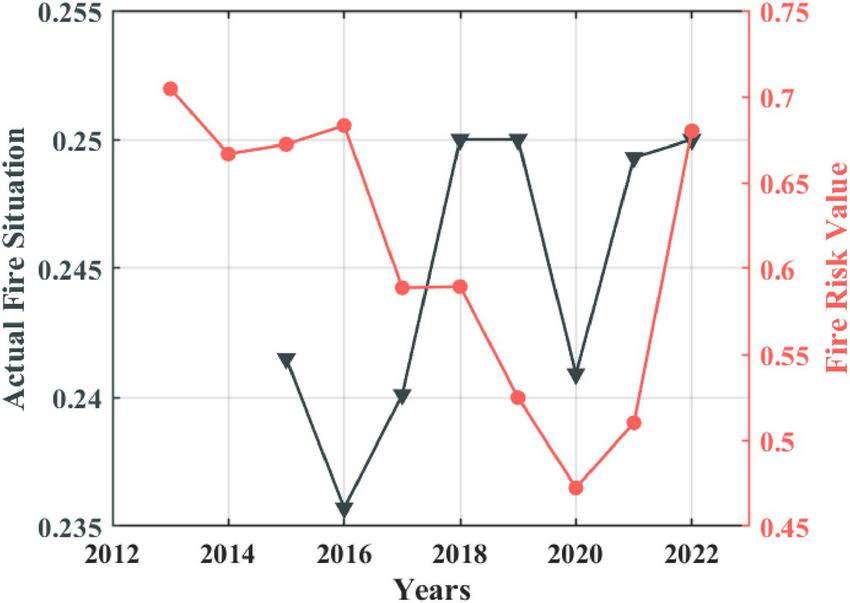
Fire risk values and actual fires.
The graph above indicates that the calculated fire risk values have a strong qualitative association with the real fire scenario in terms of trends. This result preliminarily proves the utility of the risk assessment model in terms of value-at-risk changes and risk rating, as well as providing supporting evidence for the validity of the driving mechanism, laying a solid foundation for the model’s future implementation.
5 Discussion
The paper’s results were presented in the previous section, and this section discusses the relationship with forest fire risk values in terms of correlation analyses, actual fire conditions, and seasonal variations, as well as the substantive reasons in the context of the study area’s actual conditions.
5.1 Correlation analysis
Correlation analysis is an important part of risk modeling since it helps identify key drivers and explain model uncertainty. To evaluate the robustness and sensitivity of this forest fire risk assessment model, as seen in Figure 14, this research conducts an in-depth examination of the correlation between each assessment indicator and the forest fire danger index (H1), as well as their correlation with one another. The results show that the higher weighted indicators have stronger statistical associations with the HI, which is highly consistent with the basic principle of risk modeling that factors that have a greater impact on the output variable are also weighted more.
FIGURE 14
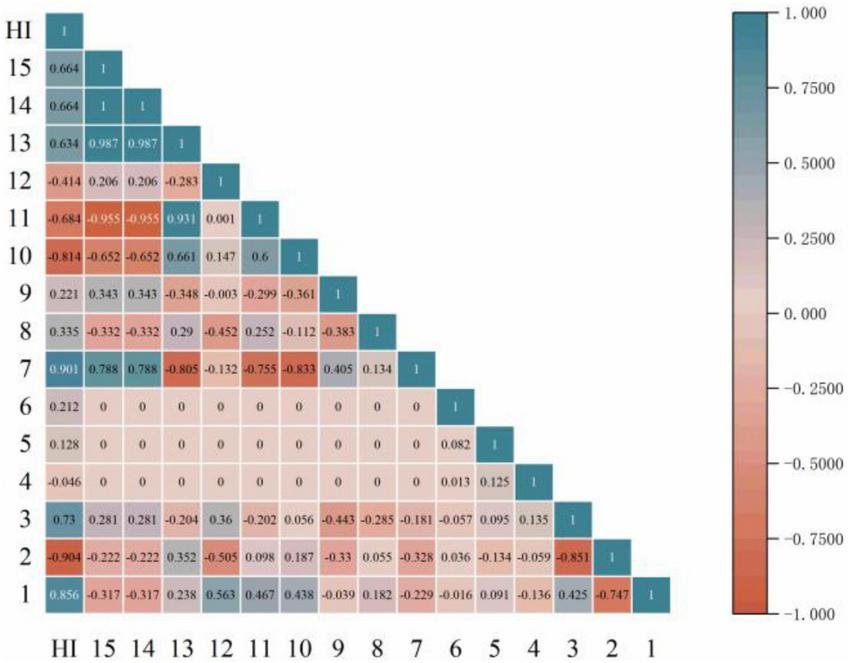
Heatmap of correlation analysis between indicators and HI.
The combined weights (Table 8) revealed a very strong positive association between NDVI and HI, demonstrating that vegetation cover, as a core representation of combustible load, is the most fundamental and important cause of fire risk in the region. Similarly, the more highly weighted social parameters, anthropogenic activity index (HAI) and population density, have strong positive relationships with HI, highlighting the importance of human-caused fires in the creation of high-risk locations. Furthermore, we discover a strong negative association with the HI index, even though WET does not have the largest composite weight. This suggests that humidity is an extremely efficient risk suppressor, and the model is highly sensitive to variations in it, with small increases likely to significantly reduce the potential risk of fire, a finding with important practical implications for early detection, prevention, and control.
To evaluate the logical accuracy of the model development, the internal correlations of this study’s indicator system were examined. In-depth examination demonstrates that the indicator system established in this work accurately reproduces the complex interplay of interrelated and synergistic forces observed in the real world. WET and NDBSI have a high negative association with one another. This equation effectively depicts the inherent link between moisture levels in the natural environment and the wet and dry conditions of the ground surface; the higher the humidity, the less probable the ground surface is to dry up, and the fire danger decreases proportionally. The pair of indicators in the model exhibits the expected antagonistic connection, demonstrating the scientific character of indicator selection. At the same time, there are varying degrees of correlation between topographic indicators and factors such as NDVI and WET, indicating that in the actual geographic environment, topography influences surface runoff and soil moisture retention, indirectly regulating vegetation growth and humidity levels in specific areas.
It should be noted that the correlations and certain collinearities observed between indicators do not constitute model deficiencies, but rather reflect the inherent authenticity of the system. Each indicator has distinct systemic properties, yet the “information redundancy” that occurs when numerous indicators collectively characterize a specific ecological process is an inbuilt resilience mechanism. Such designs effectively mitigate the risk of misjudgment arising from inaccurate single-indicator data or momentary fluctuations, thereby enhancing the overall reliability of the assessment. As a result, when developing models, we prioritize ecological interpretability and structural robustness, retaining factors with a clear theoretical basis and a substantive contribution to fire risk over pursuing complete statistical independence of indicators in isolation.
Furthermore, the current positive correlation between socioeconomic indicators such as the Human Activity Index, Population Density, and Urbanization Rate is consistent with the law of social development, which states that the process of urbanization is accompanied by an increase in the intensity of population agglomeration and human activities. The model identifies synergistic trends in several indicators, increasing the explanatory power of the risk assessment results in the socioeconomic domain. It is worth noting that the correlation between socioeconomic indicators and the three topographic indicators of DEM, Slpoe Gradient Index, and Slpoe Aspect Index is close to zero, implying that the topographic indicators have the natural property of being specific and invariant in the time dimension and are unaffected by socioeconomic indicators such as policies, measures, and investments, which is also perfectly realistic.
These very plausible internal correlation structures suggest that the evaluation indicator system used in this work is more than just a collection of separate variables, but rather an organic whole capable of reflecting the complex interaction mechanisms within the forest fire system. The expected correlations (antagonistic, synergistic) between the indicators are compatible with the findings of prior physical-ecological models and empirical investigations, providing structural evidence of the current model’s accuracy and robustness. Valuable insights were offered for understanding the forest fire risk driving processes in Yan’an, and the resulting model may be employed as a reliable decision support tool for regional fire risk management and resource deployment.
5.2 Seasonal variations and forest fire danger indices
This study extends beyond inter-annual time scales to examine the relationship between seasonal fluctuations and forest fire danger (Jodhani et al., 2024a), with a focus on the high-risk window for forest fires in the study area during the summer months (June–August). This work was used to develop an assessment model that produced a four-color map of the danger of forest fires in the four seasons of 2020.
As shown in Figures 15a–d, the fire risk pattern in the research area varies dramatically with the seasons. A synergistic comparison of the four-color map of dangerous fires across all seasons to the spatial distribution of the NDVI revealed a strong spatial linkage. Low winter temperatures prevent combustible dryness, and NDVI values are generally low in the research area. In contrast, overlap with areas of high soil moisture creates a natural fire retardant barrier, corresponding to the most extensive coverage of fire risk class 1. As the summer and autumn seasons pass, increased solar radiation accelerates surface transpiration and causes the NDBSI to climb dramatically, while increasing spatial variability in NDVI promotes a latitudinal gradient in fire danger. Low-risk areas are retreating north-south, while medium- and high-risk areas are converging in the center, and the fire risk level appears to differ between the north-south and central parts of the phenomenon. It has been verified that the NDVI of this assessment model has a higher weight than all indicators, which is consistent with the real situation and provides a favorable reference for the government to adjust fire prevention and control measures and intensity in a phased and sub-regional manner.
FIGURE 15

Four seasonal maps showing fire risk values and classifications in Huangu Town for winter, spring, summer, and autumn of 2020. (a) Winter (Jan 20, 2020), (b) Spring (Apr 25, 2020), (c) Summer (Jun 25, 2020), (d) Autumn (Oct 18, 2020).
Furthermore, this analysis revealed a strong geographical coupling effect between forest fire riskiness and population density distributions, specifically a correlation between population density and distance from rivers and roadways. The closer the distance and the higher the population density, the more human activities and fire source density rise, resulting in a change in fire risk; the inverse is true for distances.
5.3 Forest fire risk change trend and internal driving mechanism
After calculating and extracting the forest fire risk index (HI) and its natural, social, and economic sub-indices across time for the town of Huangu, this study incorporated them into the fire risk vs. factor change graph in Figure 16. The trajectory of the indicators in the picture with respect to HI shows that its HI dynamics are caused by a combination of intrinsic socioeconomic forces and external triggers from the natural environment.
FIGURE 16
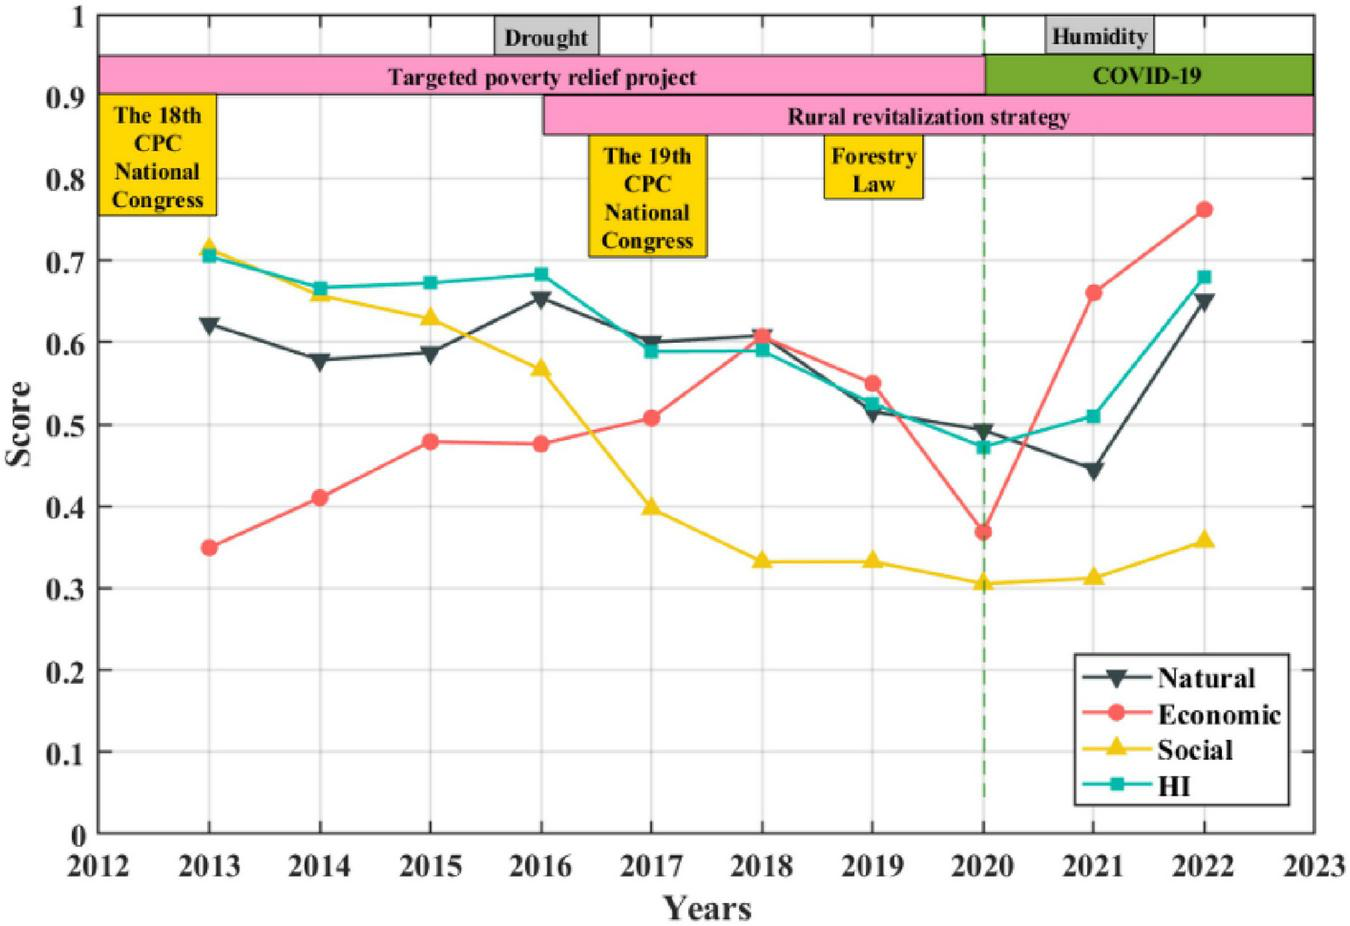
Fire risk and factor changes.
As shown in Figure 16, thanks to the continuous improvement of the ecological environment in the Qinling Mountains, the natural index generally showed a continuous and stable downward trend. Only in 2016, due to a rare drought disaster, the natural index suddenly rose slightly, and then accelerated its decline to the lowest value in 2021, the year with the highest rainfall in Huangu Town over the past 10 years. Due to the indirect impact of the sudden outbreak of the COVID-19 pandemic on the town’s forest environmental protection and disaster emergency management work, and this impact having a certain lag, the natural index rebounded and rose in 2022.
The economic index has shown an overall upward trend. This is attributed not only to the steady development of the national economy as a whole, but also to the influence of economic policies and measures, such as the “Targeted Poverty Relief Project” initiated in 2012 and the “Rural Revitalization Strategy” launched in 2016, etc., With the rapid economic development, the urbanization process accelerated significantly, and investment in various rural industries strengthened markedly. Infrastructure construction rapidly improved. Urban expansion encroached upon forest fringe areas, and the improvement of infrastructure conditions significantly enhanced the accessibility of forest areas, making human activities (such as tourism, camping, agricultural fires, construction projects, etc.) closer to the forest. In these activities, cigarette butts, sacrificial fires, and illegal outdoor fires could all potentially become direct sources of forest fires, increasing the probability of fire occurrence. Due to the external shock of the COVID-19 pandemic in 2020, the economic index suddenly dropped, but it soon recovered in a “V” shape in 2021 and returned to the original upward trajectory.
The social index is mainly influenced by government policies and their implementation effects. With the convening of the 18th National Congress of the Communist Party of China in 2012, the country further strengthened its focus on environmental protection, sustainable development, and green development, and promulgated a series of laws and regulations related to environmental protection. Over the following 10 years, the policy has continued to exert its influence and has been further strengthened after the 19th National Congress of the Communist Party of China in 2017, and then the new revised “Forest Law of the People’s Republic of China” was promulgated by the state in 2019. Because the regulations and policy measures have characteristics such as long-term effectiveness, gradual release, and lag, the social index has been showing a steadily declining trend over time. Although the sudden outbreak of the COVID-19 pandemic in 2020 affected the normal operation of society and its management work, resulting in the social index suddenly rising slightly, this will not affect the overall original downward trend of the social index. Additionally, with the end of the epidemic and the manifestation of the effects of the policies, the social index is expected to show a gradually decreasing trend in the future.
5.4 Internal driving mechanism
In summary, the changes in the forest fire risk index (HI) are the result of the dynamic coupling between the natural system and the socio-economic system.
Summarizing the indicator data in Table 7 and combining with the analysis of the changing trend shown in Figure 16, this paper can further analyze the characteristics of different attribute evaluation indicators, as shown in Figure 17.
FIGURE 17
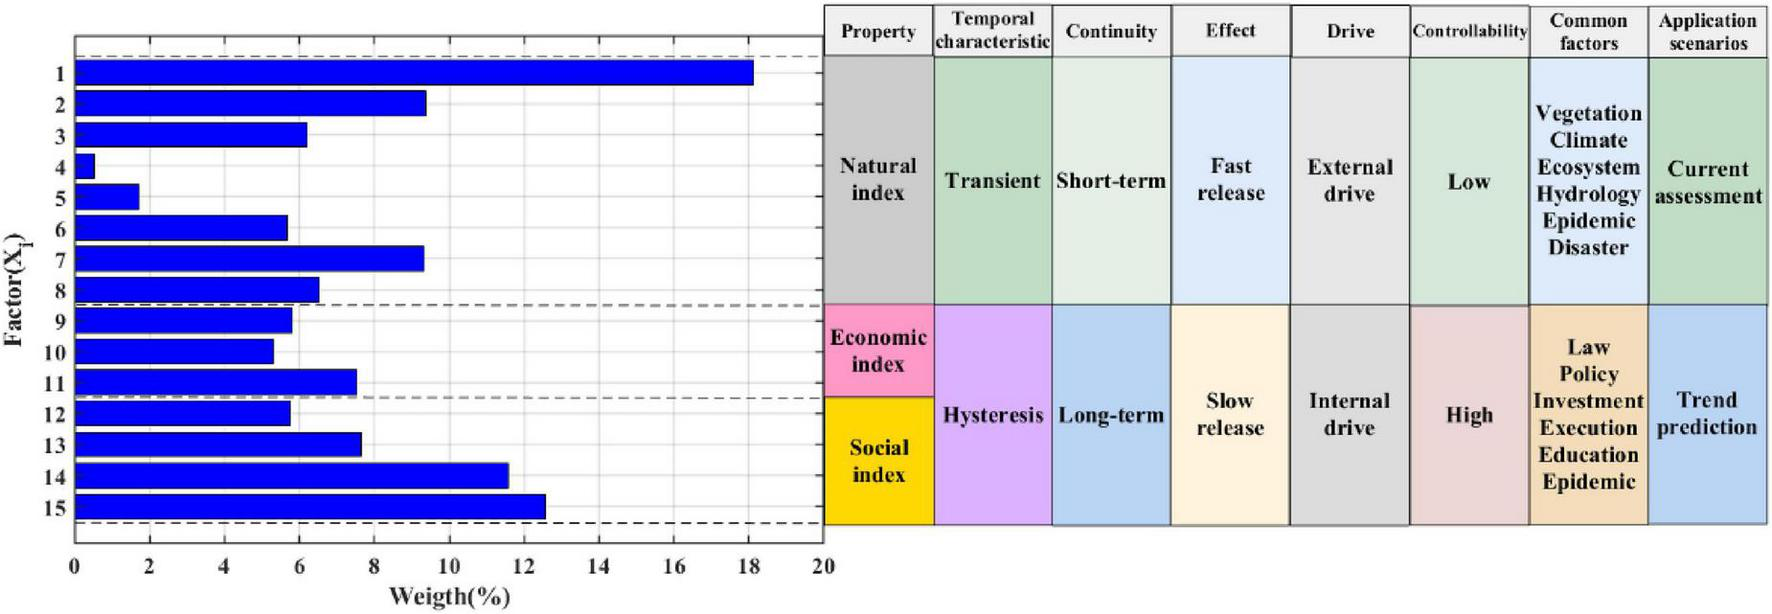
Driving mechanism.
As shown in Figure 17, short-term fluctuations are mainly driven by instantaneous natural factors (such as abnormal climate directly increasing the risk, and the sudden drop in human activities at the beginning of the epidemic briefly suppressing the risk), while long-term trends are deeply regulated by the cumulative reconfiguration of the social-economic system (such as indirect increase in fire source exposure due to economic growth, the long-term and lagging characteristics of the implementation effect of regulations and policies, and the complex impact of the epidemic on economic activities and social operations). This law confirms the driving mechanism of the forest fire system: the natural system directly and instantaneously affects the risk through explicit and instantaneous means, while the social-economic system gradually reconfigures and cumulatively alters the risk base through implicit and cumulative changes. The dynamic feedback of these two systems jointly shapes the phased turning points and non-monotonic trajectory of the HI, highlighting the systematic need for coordinating immediate response and long-term governance.
On the other hand, as shown in Figure 17, the first natural indicator, NDVI, represents the amount of combustible materials, its proportion is significantly higher. However, except for the NDVI indicator, the weights of other indicators are basically similar, indicating that the social and economic indicators play a very important role in the risk assessment results. Secondly, as the internal driving force, social and economic indicators are often directly influenced by factors such as government laws and regulations, policies, investment, implementation intensity, and the efficiency of emergency response to unexpected events. They have certain foresight and long-term effects, not only having a significant impact on the current assessment results, but also having a decisive control effect on the future development trend of risks. Moreover, social economic factors often have the characteristic of controllability, so through the analysis, adjustment and improvement of the internal driving mechanism, it helps relevant departments master the current situation of forest fire risks in the region, predict the trend of risk changes, and formulate reasonable and applicable policies and measures, ultimately achieving the transformation from hazard disposal to “long-term dynamic prevention and control.”
6 Conclusion
1. This paper is based on 15 selected natural, economic, and social indicators, including NDVI, WET, NDBSI, DEM, Slpoe Gradient Index, Slpoe Aspect Index, Average Wind Speed, Average Temperature, Growth rate of forestry investment, Financial expenditures on agriculture, forestry and water, GDP, education, urbanization rates, Human Activity Index and Population Density. The improved G1 method, the CRITIC method, and the matrix idea integration method were combined to create a forest fire risk rating model based on the enhanced ordinal relationship-CRITIC method, as well as the weight sizes of the indicators.
2. This evaluation report focuses on Huangu Town, Ankang City, Shaanxi Province, as the subject of assessment. It utilizes Landsat images from 2013 to 2022, covering 10 years, and employs a comprehensive forest fire assessment system that has been developed. Calculate and visualize the risk of forest fires in the assessment region using ENVI and ArcGIS, following the Technical Regulations for Forest Fire Risk Assessment. The forest fire risk is presented in the form of a four-color diagram, similar to the four-color diagram used to represent the risk of production safety incidents. This diagram effectively evaluates the historical development and evolutionary trend of local forest fire danger.
3. The paper describes the current fire status in the research area, including forest cover, the efficiency of emergency response, and the area affected by forest fires. It is also compared to the evaluation model’s outcomes, confirming that the two are well-coupled and demonstrating the efficiency of this assessment methodology. The model’s correctness and robustness were further structurally shown by examining the correlation between each assessment indicator and the forest fire danger index (HI), as well as amongst themselves.
4. Through exploring and studying the four-season distribution pattern of regional forest fires, this paper discovered that the low-risk level in winter covers uniformly and has the widest distribution, and with the advancement of time to the summer and autumn, the low-risk area retreats to the north and south directions, while the medium and high-risk areas gather in the central part of the country, and the fire risk level appears to be different between the north.
5. Through an in-depth consideration of the four aspects of natural, economic, social, and forest fire risk values, this paper discovers that every major turnaround is accompanied by appropriate policies and social event impacts, demonstrating the paper’s validity in developing a forest fire driving mechanism.
6. Finally, this paper reveals that the forest fire risk index (HI) is driven by both natural and socio-economic systems: natural factors dominate short-term fluctuations, and socio-economic factors regulate long-term trends. The results show that although the weight of natural indicators is high, social-economic factors are more controllable and long-term, providing a key entry point for risk prevention and control. In the future, it is necessary to strengthen the coordinated governance of nature and the social economy, realize the transformation from passive response to active prevention and control, and improve fire resilience.
Statements
Data availability statement
The original contributions presented in the study are included in the article/supplementary material, further inquiries can be directed to the corresponding author.
Author contributions
TY: Data curation, Software, Supervision, Writing – original draft. HC: Funding acquisition, Resources, Supervision, Writing – original draft. RX: Conceptualization, Funding acquisition, Methodology, Writing – review & editing, Writing – original draft. YS: Data curation, Formal analysis, Writing – review & editing. YH: Conceptualization, Data curation, Writing – original draft. LM: Methodology, Software, Supervision, Writing – review & editing. BS: Formal analysis, Investigation, Software, Writing – review & editing.
Funding
The author(s) declared that financial support was received for this work and/or its publication. This work was financially supported by PowerChina Northwest Engineering, Co., Ltd. 2024 Key science and technology projects (Grants No. XBY-KJ-2024–55), the National Natural Science Foundation of China (Grant No. 41572261), the Basic Research Program of Natural Sciences of Shaanxi Province (Grants No. 2022JM-280), China Jikan Research Institute of Engineering Investigations and Design, Co., Ltd. 2022 Scientific Research Fund (Grants No. 11740903120220021), the University Student Innovation and Entrepreneurship Training Programs (Grants No. S202510710414). All supports are gratefully acknowledged.
Conflict of interest
HC was employed by the company PowerChina Northwest Engineering Co. Ltd.
The remaining author(s) declared that this work was conducted in the absence of any commercial or financial relationships that could be construed as a potential conflict of interest.
Generative AI statement
The author(s) declared that generative AI was not used in the creation of this manuscript.
Any alternative text (alt text) provided alongside figures in this article has been generated by Frontiers with the support of artificial intelligence and reasonable efforts have been made to ensure accuracy, including review by the authors wherever possible. If you identify any issues, please contact us.
Publisher’s note
All claims expressed in this article are solely those of the authors and do not necessarily represent those of their affiliated organizations, or those of the publisher, the editors and the reviewers. Any product that may be evaluated in this article, or claim that may be made by its manufacturer, is not guaranteed or endorsed by the publisher.
References
1
Adab H. Atabati A. Oliveira S. Gheshlagh A. M. (2018). Assessing fire hazard potential and its main drivers in Mazandaran province, Iran: A data-driven approach.Environ. Monit. Assess.190:670. 10.1007/s10661-018-7052-1
2
Ager A. A. Barros A. M. G. Houtman R. Sell R. Day M. A. (2020). Modelling the effect of accelerated forest management on long-term wildfire activity.Ecol. Modell.421:108962. 10.1016/j.ecolmodel.2020.108962
3
Bai S. Zhang X. (2008). A review of forest fire prediction and forecasting research.For. Fire Prevent.222–25.
4
Bonazountas M. Kallidromitou D. Kassomenos P. A. Passas N. (2005). Forest fire risk analysis.Hum. Ecol. Risk Assess. Int. J.11617–626. 10.1080/10807030590949717
5
Chen J. Qi Q. Wang B. He S. Li Z. Wang L. et al (2023). Response of ecosystem services to landscape patterns under socio-economic-natural factor zoning: A case study of Hubei Province, China.Ecol. Indicators153:110417. 10.1016/j.ecolind.2023.110417
6
Chen S. Guo Y. Yu Z. (2011). An improved method for rank correlation analysis and its application.Syst. Eng.20352–355.
7
Chen Y. L. Luo Y. M. (2009). Dynamic monitoring on land use change of port based on TM and ETM+ data.Geomatics Spatial Inf. Technol.3285–88. 10.3969/j.issn.1673-8411.2009.03.017
8
Chen Y. Y. You Y. S. Yang Q. Wang Y. B. (2025). Multifactor-based assessment of forest fire risk in Chongqing City, China.Remote Sens. Nat. Resour.37152–161. 10.6046/gyzyyg.2023383
9
Çoban H. O. Özdamar S. (2014). Mapping forest fire in relation to land-cover and topographic characteristics.J. Environ. Biol.35217–224.
10
Fickas K. C. Cohen W. B. Yang Z. (2016). Landsat-based monitoring of annual wetland change in the Willamette Valley of Oregon, USA from 1972 to 2012.Wetlands Ecol. Manag.2473–92. 10.1007/s11273-015-9452-0
11
Gabban A. San-Miguel-Ayanz J. Viegas D. X. (2006). On the suitability of the use of normalized difference vegetation index for forest fire risk assessment.Int. J. Remote Sens.275095–5102. 10.1080/01431160500185656
12
Gong A. Huang Z. Liu L. Yang Y. Ba W. Wang H. (2023). Development of an index for forest fire risk assessment considering hazard factors and the hazard-formative environment.Remote Sens.15:5077. 10.3390/rs15215077
13
Han M. (2019). Customer value analysis and marketing strategy research of R company based on AHP-entropy method. Master’s thesis.Beijing: Beijing University of Chemical Technology, 10.26939/d.cnki.gbhgu.2019.001452
14
Hassan Abedi Gheshlaghi H. Feizizadeh B. Blaschke T. (2020). GIS-based forest fire risk mapping using the analytical network process and fuzzy logic.J. Environ. Plann. Manag.63481–499. 10.1080/09640568.2019.1594726
15
Huang C. Liu X. Zhou G. Li X. (1998). Evaluation method for agricultural natural disaster risk based on historical disaster information.J. Natural Disasters73–5. 10.13577/j.jnd.1998.0201
16
Jodhani K. H. Gupta N. Parmar A. D. Bhavsar J. D. Patel D. Singh S. K. et al (2024a). Unveiling seasonal fluctuations in air quality using google earth engine: A case study for Gujarat, India.Top. Catalysis67961–982. 10.1007/s11244-024-01957-1
17
Jodhani K. H. Patel H. Soni U. Patel R. Valodara B. Gupta N. et al (2024b). Assessment of forest fire severity and land surface temperature using Google Earth Engine: A case study of Gujarat State, India.Fire Ecol.20:23. 10.1186/s42408-024-00254-2
18
Keeping T. Harrison S. P. Prentice I. C. (2024). Modelling the daily probability of wildfire occurrence in the contiguous United States.Environ. Res. Lett.19:024036. 10.1088/1748-9326/ad21b0
19
Konurhan Z. Yucesan M. Gul M. (2025). Investigating forest fire causes through an integrated Bayesian network and geographic information system approach.Nat. Hazards.1212933–12958. 10.1007/s11069-025-07304-1
20
Koulelis P. P. Mitsopoulos I. (2007). A study on the socioeconomic factors influencing wildfire occurrence in Mediterranean basin countries (General Technical Report RMRS-GTR-184).Colorado: USDA Forest Service, Rocky Mountain Research Station.
21
Li W. W. Yang X. Q. Zhang Y. M. Feng X. Wang B. Du J. H. et al (2024). Hazard assessment of forest fire in Miyun District of Beijing based on the subcompartment scale.J. Beijing Forestry Univer.4675–86. 10.12171/j.1000-1522.20230227
22
Li Z. Zhang G. Tan S. Wu X. (2021). Study on forest fire risk early warning based on satellite remote sensing.J. Central South Univer. For. Technol.411–9. 10.14067/j.cnki.1673-923x.2021.07.004
23
Lin Z. Lu H. Luo B. Wang X. (2013). Risk assessment of forest fire disasters on the Tibetan Plateau based on GIS.J. Natural Sci.352318–2324.
24
Liu D. Hu M. X. (2013). The present and future of forest disaster risk zoning.For. Econ.36105–108. 10.13843/j.cnki.lyjj.2013.11.026
25
Liu J. K. Yuan X. Y. Liang D. Wang C. X. (2024). Fire risk evaluation of energy storage power station based on G1-CRITIC combination weighting cloud model.J. Xi’an Univer. Sci. Technol.44447–455. 10.13800/j.cnki.xakjdxxb.2024.0305
26
Liu W. Wang S. Zhou Y. (2016). Lightning-caused forest fire risk rating assessment based on case-based reasoning: A case study in DaXingAn Mountains of China.Natural Hazards81347–363. 10.1007/s11069-015-2083-1
27
Lu J. Tang D. (2018). Evaluation of comprehensive water environment treatment effect based on game theory combination weighting.Hydro Sci. Eng.6105–111. 10.16198/j.cnki.1009-640X.2018.06.014
28
Ma X. (2024). A study on the characteristics and optimization strategies of crowd activity in the waterfront space of Nanfei River.Master’s thesis. Hefei: Anhui Agricultural University, 10.26919/d.cnki.ganmu.2024.001113
29
Maktav D. (2009). “Remote sensing for a changing Europe,” in Proceedings of the 28th Symposium of the European Association of Remote Sensing Laboratories, (Istanbul).
30
Milanović S. Marković N. Pamučar D. Gigović Lj Kostić P. Milanović S. D. (2021). Forest fire probability mapping in eastern Serbia: Logistic regression versus random forest method.Forests12:5. 10.3390/f12010005
31
Ministry of Emergency Management of the People’s Republic of China. (2021). Technical specification for the first national comprehensive risk census of natural disasters: FXPC/LC P-01 Technical specification for forest fire danger assessment.Weston, MA: Emergency Management Press.
32
Moritz M. A. Batllori E. Bradstock R. A. Gill A. M. Handmer J. Hessburg P. F. et al (2014). Learning to coexist with wildfire.Nature51558–66. 10.1038/nature13946
33
Nasiri V. Sadeghi S. M. M. Bagherabadi R. Moradi F. Deljouei A. Borz S. A. (2022). Modeling wildfire risk in western Iran based on the integration of AHP and GIS.Environ. Monit. Assess.194:644. 10.1007/s10661-022-10318-y
34
Nejatiyanpour E. Ghorbanzadeh O. Strobl J. Yousefpour R. Kakhki M. D. Amirnejad H. et al (2025). Assessing Hyrcanian forest fire vulnerability: Socioeconomic and environmental perspectives.J. For. Res.36:35. 10.1007/s11676-025-01832-z
35
Norovsuren B. Mart Z. Natsagdori E. Altanchimeg T. (2023). Developing a multi-variable forest fire risk model and fire risk zone mapping. The international archives of the photogrammetry.Remote Sens. Spatial Information Sci.481485–1490. 10.5194/isprs-archives-XLVIII-1-W2-2023-1485-2023
36
Ruan C. (2024). Financialization of forests and its socio-environmental impacts—An examination of forest land transactions.J. China Agric. Univer.41121–142. 10.13240/j.cnki.caujsse.20241217.001
37
Schoennagel T. Balch J. K. Brenkert-Smith H. Dennison P. E. Harvey B. J. Krawchuk M. A. et al (2017). Adapt to more wildfire in western North American forests as climate changes.Proc. Natl Acad. Sci.1144582–4590. 10.1073/pnas.1617464114
38
Sevinc V. Kucuk O. Goltas M. (2020). A Bayesian network model for prediction and analysis of possible forest fire causes.For. Ecol. Manag.457:117723. 10.1016/j.foreco.2019.117723
39
Shafapourtehrany M. (2023). Geospatial wildfire risk assessment from social, infrastructural and environmental perspectives: A case study in Queensland Australia.Fire6:22. 10.3390/fire6010022
40
Shi D. Lin Q. Hu B. Yan X. (2022). A comprehensive review of comprehensive evaluation methods.Chinese Sci. Technol. Inf.22124–127.
41
Thompson M. P. Vogler K. C. Scott J. H. Miller C. (2022). Comparing risk-based fuel treatment prioritization with alternative strategies for enhancing protection and resource management objectives.Fire Ecol.18:26. 10.1186/s42408-022-00149-0
42
Toledo-Jaime C. Díaz-Avalos C. Chaudhuri S. Serra L. Juan P. (2024). Understanding wildfire occurrence and size in Jalisco, Mexico: A spatio-temporal analysis.For. Ecol. Manag.573:122349. 10.1016/j.foreco.2024.122349
43
Wang M. Jia D. Liang Y. Huang Y. Mo W. (2024). Discussion on forest fire risk assessment and classification—Taking Fangchenggang Fangcheng District in Guangxi as an example.For. Fire Prevent.4253–59. 10.3969/j.issn.1002-2511
44
Wang R. Zhang W. Long T. Wang Q. (2021). A review of forest fire risk assessment methods.Forest Fire Prevent.4644–47. 10.3969/j.issn.1671-3168.2021.06.008
45
Wang X. L. (2021). Study on ecological environment quality of Fuxin based on remote sensing ecological index.J. Liaoning Univer. Technol.21–15. 10.27210/d.cnki.glniju.2019.000515
46
Wang X. Zhao H. Zhang Z. Yin Y. Zhen S. (2023). The relationship between socioeconomic factors at different administrative levels and forest fire occurrence density using a multilevel model.Forests14:391. 10.3390/f14020391
47
Wasserman T. N. Mueller S. E. (2023). Climate influences on future fire severity: A synthesis of climate-fire interactions and impacts on fire regimes, high-severity fire, and forests in the western United States.Fire Ecol.19:43. 10.1186/s42408-023-00200-8
48
Wei K. (2022). Investigation on forest fire risk assessment for Sichuan province based on middle resolution remote sensing images.Master’s thesis. Changsha: Central South University, 10.27661/d.cnki.gzhnu.2022.002174
49
Werth P. A. Potter B. E. Clements C. B. Finney M. A. Goodrick S. L. Alexander M. E. et al (2011). Synthesis of knowledge of extreme fire behavior: Volume I for fire managers (Gen. Tech. Rep. PNW-GTR-854).Washington, DC: U.S. Department of Agriculture, Forest Service, 10.2737/PNW-GTR-854
50
Xu R. Deng J. He Y. Sui G. Li X. Yang W. (2024a). Research on the evaluation model of ecological environment change and its internal driving mechanisms.Geomatics Natural Hazards Risk15:2330514. 10.1080/19475705.2024.2330514
51
Xu R. He Y. Cheng H. Deng J. Wei H. Wang G. et al (2024b). Mechanical mechanism of soil consolidation by plant roots in loess area of northern Shanxi.Sci. Rep.15:8014. 10.1038/s41598-025-02179-2
52
Xu R. Li X. Yang W. Jiang C. Rabiei M. (2019). Use of local plants for ecological restoration and slope stability: A possible application in Yan’an.Geomat. Nat. Hazards Risk102106–2128. 10.1080/19475705.2019.1679891
53
Yang X. Jin X. Zhou Y. (2021). Wildfire Risk Assessment and Zoning by Integrating Maxent and GIS in Hunan Province.China. Forests12:1299. 10.3390/f12101299
54
Yi B. (2024). Spatio-temporal dynamic pattern and burning characteristics of forest and grassland fire in Hulunbuir region.Master’s thesis. Hohhat: Inner Mongolia Agricultural University, 10.27229/d.cnki.gnmnu.2024.000078
55
Zang W. Y. Li Z. Chen L. P. (1997). Comparison and application of several forest fire danger forecasting methods.Forest Firefighting219–20.
56
Zhang W. Y. Li L. L. Liu C. S. Zhang S. (1991). Determination and short-term forecast of forest fire danger rating in Anqing City.Forest Firefighting329–31.
57
Zhang Y. Wei H. (2012). A method for multi-attribute decision making based on CRITIC.Stat. Decis.1675–77. 10.13546/j.cnki.tjyjc.2012.16.009
58
Zhao D. (2022). “Wildfire vulnerability assessment in western Sichuan China based on multi-source spatio-temporal data,” in Proceedings of the 2022 IEEE International Geoscience and Remote Sensing Symposium (IGARSS 2022), (Piscataway, NJ: IEEE), 7930–7933. 10.1109/IGARSS46834.2022.9884285
59
Zheng C. Z. Bian Z. Sang G. Q. (2024). Dynamic monitoring of ecological environment quality in Jinan based on remote sensing ecological index.J. Shandong Normal Univer.3957–64. 10.14108/j.cnki.1008-8873.2024.05.020
Summary
Keywords
forest fire risk assessment, improved G1-CRITIC method, remote sensing, internal driving mechanism, distribution pattern
Citation
Yang T, Cheng H, Xu R, Song Y, He Y, Ma L and Song B (2026) Forest fire risk change assessment model based on the improved G1-CRITIC method. Front. For. Glob. Change 8:1679999. doi: 10.3389/ffgc.2025.1679999
Received
05 August 2025
Revised
19 November 2025
Accepted
28 November 2025
Published
05 January 2026
Volume
8 - 2025
Edited by
Laura Patricia Ponce Calderón, El Colegio de la Frontera Sur (Ecosur), Mexico
Reviewed by
Yasar Selman Gültekin, Duzce University, Türkiye
Padam Jee Omar, Babasaheb Bhimrao Ambedkar University, India
Kunlong Niu, Guangzhou Institute of Geography, China
Updates
Copyright
© 2026 Yang, Cheng, Xu, Song, He, Ma and Song.
This is an open-access article distributed under the terms of the Creative Commons Attribution License (CC BY). The use, distribution or reproduction in other forums is permitted, provided the original author(s) and the copyright owner(s) are credited and that the original publication in this journal is cited, in accordance with accepted academic practice. No use, distribution or reproduction is permitted which does not comply with these terms.
*Correspondence: Rui Xu, firewoodxu@chd.edu.cn
Disclaimer
All claims expressed in this article are solely those of the authors and do not necessarily represent those of their affiliated organizations, or those of the publisher, the editors and the reviewers. Any product that may be evaluated in this article or claim that may be made by its manufacturer is not guaranteed or endorsed by the publisher.