 Mohammad Zamani1
 Naseh Pahlavani2,3Mahlagha Nikbaf-Shandiz4
 Niloufar Rasaei5
 Rasool Ghaffarian-Ensaf6
 Omid Asbaghi7,8
 Farideh Shiraseb5*
 Samira Rastgoo8,9*
- 1Department of Clinical Nutrition, School of Nutritional Sciences and Dietetics, Tehran University of Medical Sciences, Tehran, Iran
- 2Health Sciences Research Center, Torbat Heydariyeh University of Medical Sciences, Torbat-e Heydariyeh, Iran
- 3Behbahan Faculty of Medical Sciences, Behbahan, Iran
- 4Student Research Committee, Tabriz University of Medical Sciences, Tabriz, Iran
- 5Department of Community Nutrition, School of Nutritional Sciences and Dietetics, Tehran University of Medical Sciences (TUMS), Tehran, Iran
- 6Department of Nutrition, Science and Research Branch, Islamic Azad University, Tehran, Iran
- 7Cancer Research Center, Shahid Beheshti University of Medical Sciences, Tehran, Iran
- 8Student Research Committee, Shahid Beheshti University of Medical Sciences, Tehran, Iran
- 9Department of Cellular and Molecular Nutrition, Faculty of Nutrition Science and Food Technology, National Nutrition and Food Technology Research Institute, Shahid Beheshti University of Medical Sciences, Tehran, Iran
Background and aims: Hyperglycemia and insulin resistance are concerns today worldwide. Recently, L-carnitine supplementation has been suggested as an effective adjunctive therapy in glycemic control. Therefore, it seems important to investigate its effect on glycemic markers.
Methods: PubMed, Scopus, Web of Science, and the Cochrane databases were searched in October 2022 for prospective studies on the effects of L-carnitine supplementation on glycemic markers. Inclusion criteria included adult participants and taking oral L-carnitine supplements for at least seven days. The pooled weighted mean difference (WMD) was calculated using a random-effects model.
Results: We included the 41 randomized controlled trials (RCTs) (n = 2900) with 44 effect sizes in this study. In the pooled analysis; L-carnitine supplementation had a significant effect on fasting blood glucose (FBG) (mg/dl) [WMD = −3.22 mg/dl; 95% CI, −5.21 to −1.23; p = 0.002; I2 = 88.6%, p < 0.001], hemoglobin A1c (HbA1c) (%) [WMD = −0.27%; 95% CI, −0.47 to −0.07; p = 0.007; I2 = 90.1%, p < 0.001] and homeostasis model assessment-estimate insulin resistance (HOMA-IR) [WMD = −0.73; 95% CI, −1.21 to −0.25; p = 0.003; I2 = 98.2%, p < 0.001] in the intervention compared to the control group. L-carnitine supplementation had a reducing effect on baseline FBG ≥100 mg/dl, trial duration ≥12 weeks, intervention dose ≥2 g/day, participants with overweight and obesity (baseline BMI 25–29.9 and >30 kg/m2), and diabetic patients. Also, L-carnitine significantly affected insulin (pmol/l), HOMA-IR (%), and HbA1c (%) in trial duration ≥12 weeks, intervention dose ≥2 g/day, and participants with obesity (baseline BMI >30 kg/m2). It also had a reducing effect on HOMA-IR in diabetic patients, non-diabetic patients, and just diabetic patients for insulin, and HbA1c. There was a significant nonlinear relationship between the duration of intervention and changes in FBG, HbA1c, and HOMA-IR. In addition, there was a significant nonlinear relationship between dose (≥2 g/day) and changes in insulin, as well as a significant linear relationship between the duration (weeks) (coefficients = −16.45, p = 0.004) of intervention and changes in HbA1C.
Conclusions: L-carnitine could reduce the levels of FBG, HbA1c, and HOMA-IR.
Systematic review registration: https://www.crd.york.ac.uk/prospero/, identifier: CRD42022358692.
Introduction
Hyperglycemia has increased dramatically in the last two decades. A combination of obesity, reduced activity levels, and aging may have contributed to this disorder (1). Another glycemic disorder is insulin resistance (IR) which muscles, fat, and liver cells do not respond to insulin effectively (2). Among adults worldwide, IR occurs in 15.5–46.5% of cases (3). Glycemic markers including fasting blood glucose (FBG), hemoglobin A1c (HbA1c), insulin, and Homeostatic Model Assessment for Insulin Resistance (HOMA-IR) are used to monitor glycemic control in clinical practice (4). Glycemic markers are associated with chronic and metabolic diseases such as cardiovascular diseases (5–7). In different studies, the rate of poor control of glycemic markers has been estimated as 41.6% (8), 54.8% (9), and 86.2% (10). Various factors are effective in controlling and improving glycemic markers, such as improving lifestyle, physical activity, changing dietary intake, and of course some nutritional supplement consumption (11–14).
L-carnitine is involved in transports long-chain fatty acids from the cytoplasm to the mitochondria, as well as the beta-oxidation of fatty acid indirectly; therefore, it contributes to fat metabolism (15). Moreover; L-carnitine maintains insulin sensitivity and metabolic flexibility (16).
Any L-carnitine deficiency may lead to disturbances in fat and glucose metabolism. L-carnitine affects glycemic markers, hyperglycemia, and insulin resistance (17–20). In summary, L-carnitine may reduce insulin resistance by removing harmful lipids from cells, mending cell membranes, and reducing accumulated acyl CoA derivatives and/or their metabolites (18, 20). L-carnitine influences glycemic control via a number of different pathways, including the following:
(1) Controlling the pyruvate dehydrogenase complex's (PDHC) activity and the intramitochondrial acetyl-CoA/CoA ratio; (2) Modifying the expression of glycolytic and gluconeogenic enzymes; (3) altering the gene expression in the insulin signaling cascade; and (4) activating the IGF-1 axis and cascade of IGF-1 signaling (21).
Several studies have examined the impact of L-carnitine on glycemic markers. For instance, according to a study conducted in 2022 by Nejati et al., taking L-carnitine orally led to a significant decrease in insulin, FBG, HOMA-IR, and insulin sensitivity (22). But, Liang et al. demonstrated that taking L-carnitine daily for 12 weeks did not affect FBG, HbA1c, and insulin (23). A meta-analysis of 37 RCTs conducted by Fathizadeh et al., in 2019 has shown that taking L-carnitine results in a decrease in FBG, HOMA-IR, HbA1c, and insulin (24). Moreover, the meta-analysis of 24 RCTs conducted by Asadi et al., in 2020 has shown that L-carnitine supplementation could reduce glycemic markers like FBG, HbA1c, and HOMA-IR. However, insulin was not investigated in this study (25).
Consequently, studies on the effect of L-carnitine supplementation and glycemic markers have shown different controversial findings based on studies and due to several factors, including dosage, duration, types of carnitines, and use of L-carnitine with other supplements intervention. Although, a meta-analysis appeared in 2019 (24). However, several RCTs have been published since then, so we aimed to update and perform further analysis such as linear and non-linear dose-response and further subgroup analysis to find more data for interpretation. Therefore; we conducted a meta-analysis on the effect of L-carnitine on glycemic markers considering with comprehensive point of view on glycemic markers in adults.
Materials and methods
In the current study, the preferred reporting items for systematic reviews and meta-analyses (PRISMA) declaration was used (26). This study was registered in PROSPERO (CRD42022358692).
Search strategy
As part of our systematic literature search, we searched PubMed, Scopus, Web of Science, and the Cochrane databases for randomized control trials (RCTs) on the effects of L-carnitine supplementation on glycemic markers published up to October 2022. A bibliography of relevant studies, including prior meta-analyses (27), was reviewed to identify potential missing studies. Neither the length nor language of publications were restricted. To search for all items related to L-carnitine supplementation and glycemic markers, we used a search framework, namely, PICO (Participant, Intervention, Comparison/Control, and Outcome) as explained in the study selection. We used Mesh and non-Mesh terms to search the literature as follows: “Vitamin BT” OR “L-carnitine” OR “carnitine” OR “levocarnitine” OR “bicarnesine” OR “L-acetylcarnitine” OR “acetyl-L-carnitine” AND “Intervention” OR “Intervention Study” OR “Intervention Studies” OR “controlled trial” OR randomized OR random OR randomly OR placebo OR “clinical trial” OR Trial OR “randomized controlled trial” OR “randomized clinical trial” OR RCT OR blinded OR “double blind” OR “double blinded” OR trial OR “clinical trial” OR trials OR “Pragmatic Clinical Trial” OR “Cross-Over Studies” OR “Cross-Over” OR “Cross-Over Study” OR parallel OR “parallel study” OR “parallel trial.”
Study selection
We included studies that meet the inclusion criteria as follows: (1) RCTs (parallel or cross-over); (2) used oral intake of L-carnitine; (3) evaluate the effects of L-carnitine supplementation on FBG, HbA1c, insulin, and HOMA-IR; (4) intervention duration was at least seven days (we considered RCTs as separate studies if they were with two or more eligible arms); (5) used adult participants (≥18 years old); (6) used means and standard deviations (SDs) for FBG (mg/dl), HbA1c (%), insulin (pmol/l), and HOMA-IR, or any other effect sizes that were possible for calculating the mean and SD. We searched human studies without any language restrictions. Screening of the title and abstracts of the included studies by extracting the results and assessing the validity of the studies were performed independently by two authors (SR and OA) to determine whether they were eligible or not. Disputes and differences were settled with discussion. Studies were excluded if they met the following exclusion criteria: studies conducted on children, adolescents, or animals, reviews studies, in vitro studies, editorial papers, gray literature, books, conference abstracts, and RCTs conducted without a placebo or control group. Additionally, studies in which L-carnitine was administered by infusion, consumed for <7 days, or combined with vitamins or minerals were excluded.
Data extraction
Separate re-checks were conducted on all eligible RCTs, and two independent investigators (MZ and MN) extracted the following information. Several factors were extracted for further analysis, including the name of the first author, country, publication year, type of clinical trial, participants' characteristics (mean age, BMI, sex), randomization, blinding, sample size, number of interventions, and control group participants, form and dose of L-carnitine supplementation, study duration, and related details. The mg/day L-carnitine dosages were converted to g/day. For both parallel and cross-over trials, we collected the mean and SD for FBG (mg/dl), HbA1c (%), insulin (pmol/l), and HOMA-IR. In the absence of this data, we subtracted the mean value at baseline from the mean value at the end of the study for calculating the mean difference.
Quality assessment
An assessment of the quality of the studies was conducted using the Cochrane Collaboration tool (28). We assessed all studies for several sources of biases such as randomized sequence generation, concealment of allocation, blinding of participants and staff, inadequate outcome data, selective reporting, and others. Finally, three groups of risk of bias were created: high risk of bias, moderate risk of bias, and low risk of bias. We had two reviewers (FS and NP) evaluate the quality of the work independently, and we settled any conflicting opinions through discussion.
Statistical analysis
Stata 11.0 was used to conduct the statistical analysis (Stata Corp, College Station, TX). P-values of 0.05 were deemed statistically significant for all two-tailed tests. The pooled weighted mean difference (WMD) was computed using a random-effects model to take into account any existing heterogeneity (29). We assessed the mean differences in FBG, HbA1c, insulin, and HOMA-IR between the L-carnitine supplementation and control groups from the baseline to the post-intervention. The following equation was used to determine the SD of the mean difference: SD = square root [(SD at baseline)2+(SD at the end of study)2 −(2 r × SD at baseline × SD at the end of study)] (30). In each study that reported standard errors (SE) rather than SD, we converted the SEs, 95 percent confidence intervals (CIs), and interquartile ranges (IQRs) to SDs using the Hozo et al. approach. The SD was calculated using the formula SD = SE × √n (where n is the total number of participants in each group) (31). The correlation coefficient was set at 0.8 for r (32). To identify the cause of heterogeneity, a subgroup analysis was carried out. According to the criteria outlined by Fu et al., where there should be at least 6–10 studies for continuous and a minimum of 4 studies for categorical subgroup variables, subgroups were chosen based on the necessary minimum number of studies (33, 34). Other subgroup analyses were conducted based on baseline BMI [overweight (25–29.9 kg/m2) and obese (>30 kg/m2)] as well as trial duration (<12 and ≥12 weeks), intervention dose (<2 and ≥2 g/day), and health status (diabetic, non-diabetic). The statistical heterogeneity was assessed in the meta-analyses using the I2 or Cochrane's Q test (35), with values higher than 40% indicating strong heterogeneity (36).
The funnel plot test and Egger's test and Begg's test were used to examining publication bias (37, 38). The leave-one-out method (i.e., removing one trail at a time and recalculating the impact size) was used to examine the impact of each study on the pooled effect size. Sensitivity analysis was carried out to determine how many inferences were dependent on a particular sample. In order to identify and mitigate the effects of publication bias, we used the trim-and-fill method (39). The potential impact of L-carnitine (g/d) dosage and duration on FBG, HbA1c, insulin, and HOMA-IR was evaluated using meta-regression. Additionally, we used a non-linear regression model to deal with the synthesis of the correlated dose-response data from various studies for the dose-response analysis between L-carnitine supplementation and FBG, HbA1c, insulin, and HOMA-IR. This model focuses on inverse variance weighted least squares regression and cluster robust error variances (40, 41).
Certainty assessment
Using the GRADE (Grading of Recommendations Assessment, Development, and Evaluation) method, which was previously discussed, the overall degree of evidence certainty across the studies was evaluated and summarized (42).
Results
Study selection
The flow chart of the study was presented in Figure 1 and we described the selection process and the references retrieved from the database in this figure. We identified in the first step of the electronic databases search a total number of 19,292 studies. We excluded duplicated (n = 6,784) and irrelevant studies (n = 12,389) based on titles and abstracts, and 119 full-text relevant articles were reviewed. A total of 78 studies were excluded due to the following reasons: insufficient outcome data reported, acute oral ingestion, or short duration of supplementation (<1 week). Finally, we included a total of 41 studies (16, 17, 23, 43–80) with 44 effect sizes included in the qualitative synthesis.
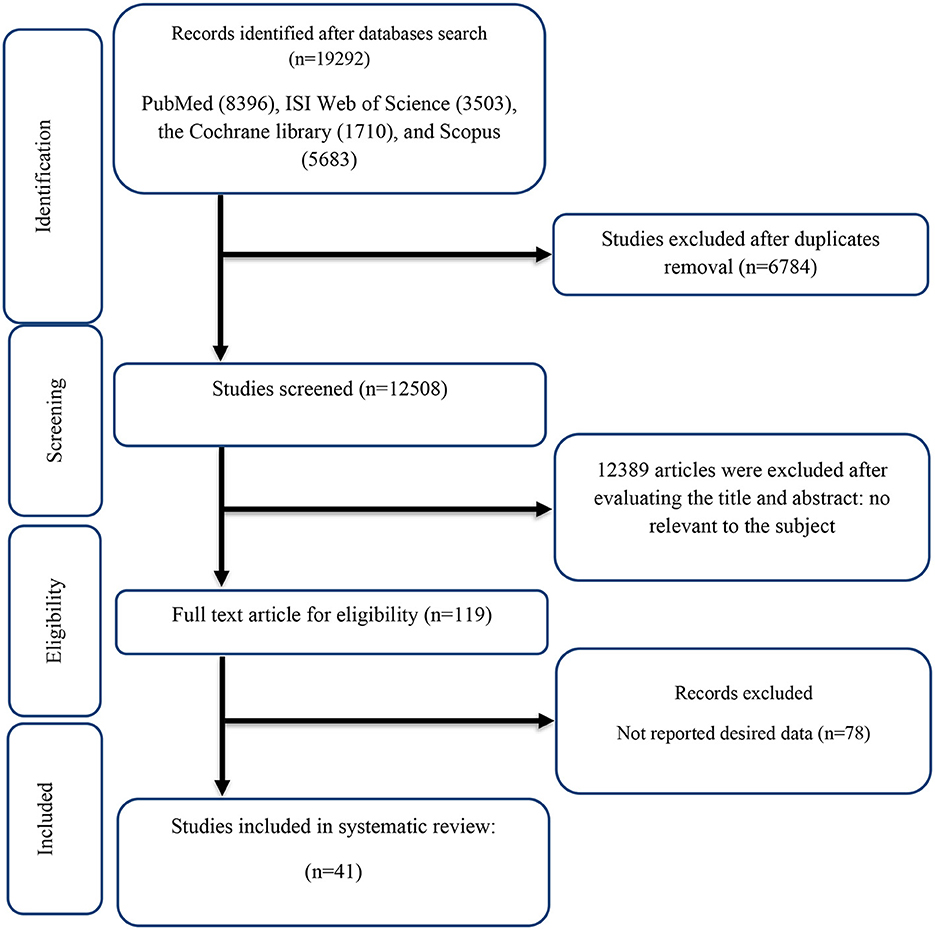
Figure 1. Flow chart of study selection for inclusion trials in the systematic review.
Study characteristics
The study design characteristics showed in Table 1. A summary of the risk of bias assessment of the included studies is presented in Table 2.
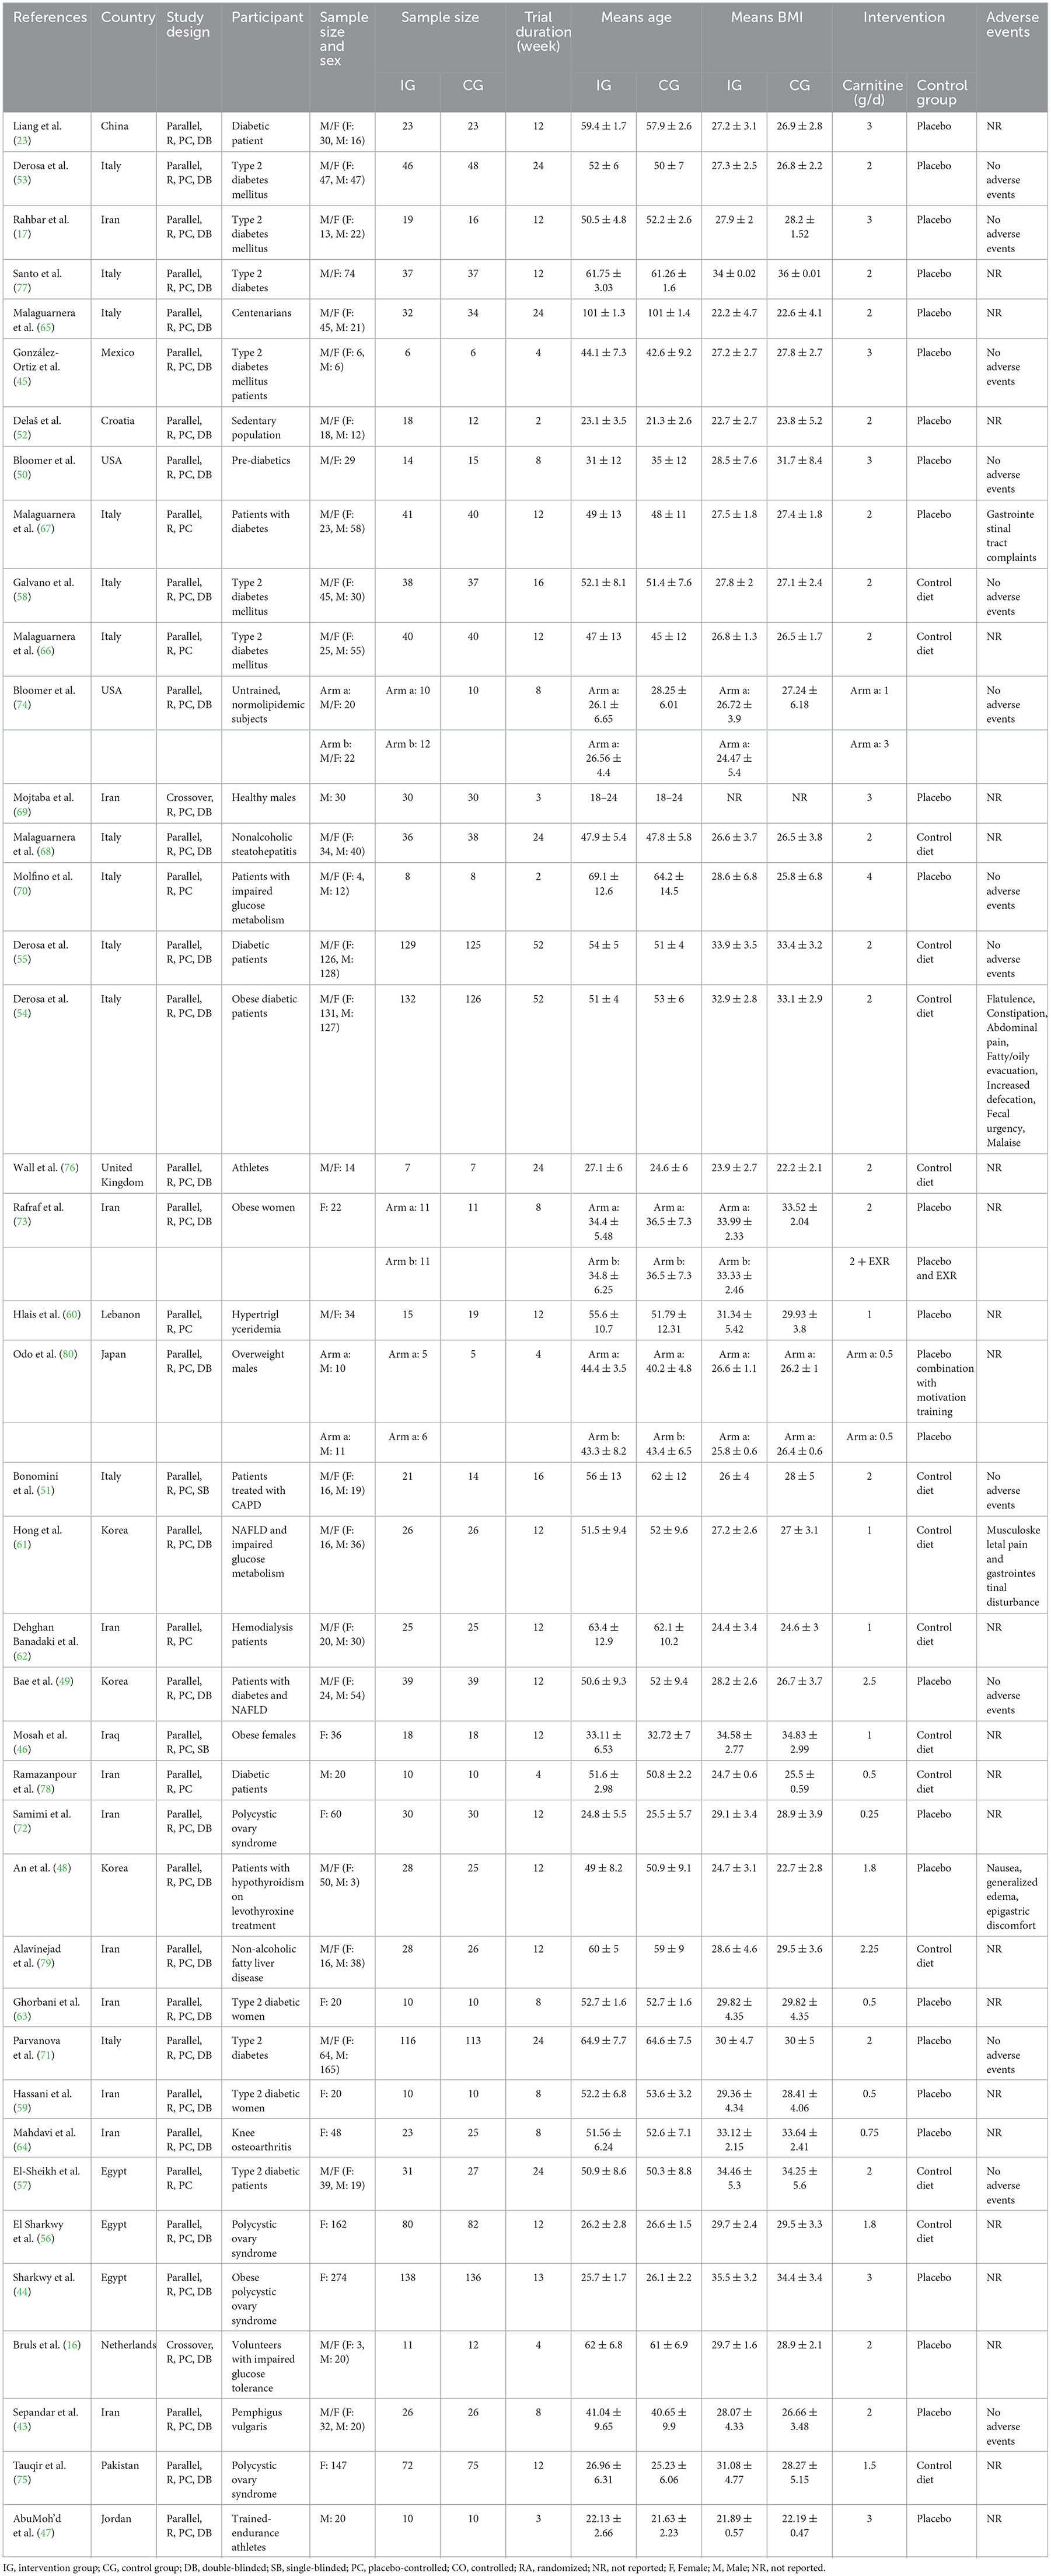
Table 1. Characteristic of included studies in the meta-analysis.
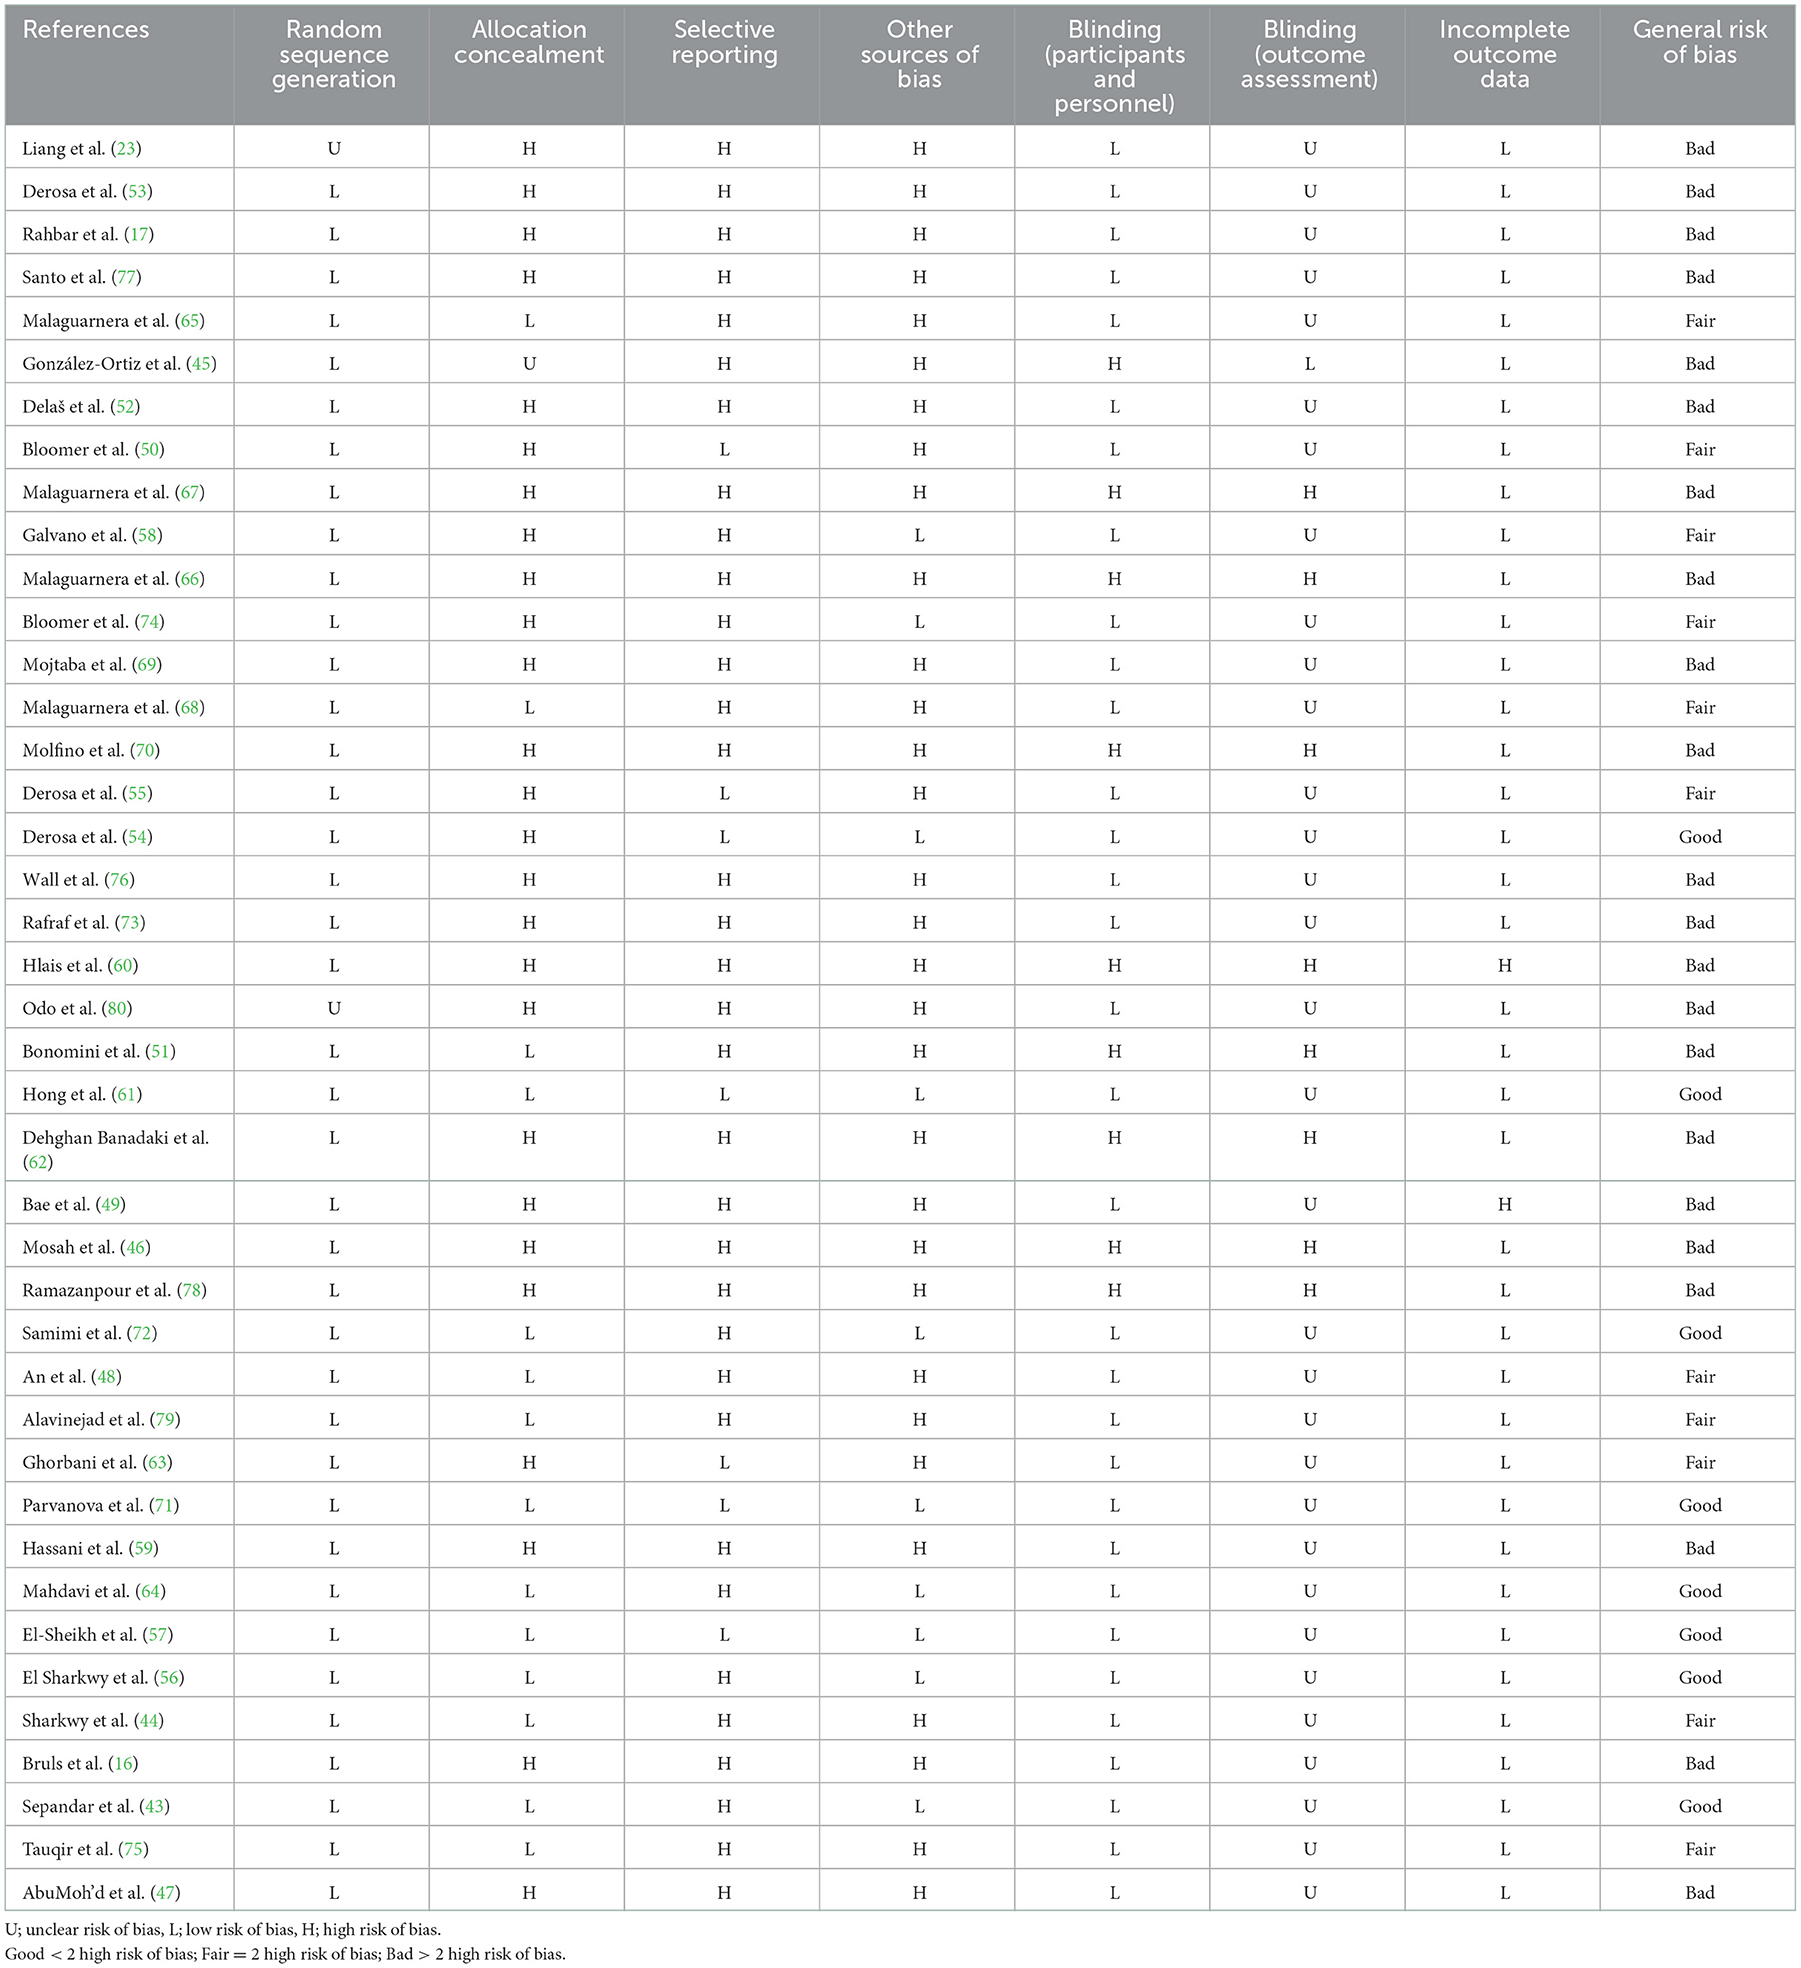
Table 2. Risk of bias assessment.
The supplementation duration of included studies ranged from 2 to 52 weeks. The daily dosage of L-carnitine supplementation ranged from 0.25 to 4 g/day. 39 parallel (17, 23, 43–68, 70–80) and 2 cross-over (16, 69) studies were included in this study. The mean age ranged from 18–101 years and baseline BMI of included studies ranged from 22.19 to 36 kg/m2 in the intervention group, respectively. Thirteen studies included only males or females (46, 56, 59, 63, 64, 69, 72, 73, 78, 80), and 28 included both sexes (16, 17, 23, 43, 45, 48–55, 57, 58, 60–62, 65–68, 70, 71, 74, 76, 77, 79).
The investigation by Liang et al. (23) had two types of participants (outpatients and inpatients with non-insulin-dependent diabetes mellitus) so we considered two arms for this study. The investigation by Bloomer et al. (74) had two types of intervention doses (1 and 3 g/day) so we considered two arms for this study. Also, Rafraf et al. (73) had two types of intervention (L-carnitine supplementation + aerobic training and L-carnitine supplementation) so we considered two arms for this study. In addition, Odo et al. (80) had two types of control groups (Placebo Combination with Motivation Training and Placebo) so we considered two arms for this study.
Out of 41 RCTs, 39 studies have shown a significant lowering effect of L-carnitine supplementation on FBG (mg/dl) (16, 17, 23, 43, 45–69, 71–80), 19 studies on serum insulin (pmol/l) (16, 43, 44, 51, 53–55, 57, 59, 61, 63, 68, 71–76, 80), 20 studies on serum HbA1c (%) (16, 17, 23, 45, 48, 49, 53–55, 57, 58, 61, 63, 66, 67, 71, 74, 77, 79, 80), and 17 studies on HOMA-IR (43, 44, 49, 50, 54–57, 59, 61, 63, 68, 70–73, 75).
Adverse events
Adverse effects were mentioned in the studies by Derosa et al. (Flatulence, Constipation, abdominal pain, fatty/oily evacuation, increased defecation, fecal urgency, malaise), Hong et al. (61) (musculoskeletal pain and gastrointestinal disturbance), Malaguarnera et al. (67) (gastrointestinal tract complaints) and An et al. (48) (nausea, generalized edema, epigastric discomfort).
Qualitative data assessment
The qualitative data based on the Cochrane risk of bias assessment tool were presented in Table 2. Eight studies had low risk of bias (43, 55–57, 61, 64, 71, 72), 11 studies had moderate risk of bias (44, 48, 50, 54, 58, 63, 65, 68, 74, 75, 79) and 22 studies had high risk of bias (16, 17, 23, 45–47, 49, 51–53, 59, 60, 62, 66, 67, 69, 70, 73, 76–78, 80).
Effect of L-carnitine supplementation on FBG (mg/dl) and subgroup analysis
L-carnitine supplementation had a significant effect on FBG in the intervention compared to the placebo group (Figure 2A). Subgroup analyses showed that L-carnitine supplementation had a lowering effect on FBG (mg/dl) in baseline FBG ≥100 mg/dl [WMD = −5.91 mg/dl; 95% CI, −8.84 to −2.99; p < 0.001; I2 = 88.6%, p < 0.001], trial duration ≥12 week [WMD = −5.81 mg/dl; 95% CI, −8.73 to −2.88; p < 0.001; I2 = 92.5%, p < 0.001], intervention dose ≥2 g/day [WMD = −4.73 mg/dl; 95% CI, −7.45 to −2.01; p = 0.001; I2 = 89.5%, p < 0.001], participants with overweight (baselin BMI 25–29.9 kg/m2) [WMD = −4.35 mg/dl; 95% CI, −7.76 to −0.94; p = 0.018; I2 = 90.2%, p < 0.001], participants with obesity (baseline BMI >30 kg/m2) [WMD = −4.83 mg/dl; 95% CI, −8.44 to −1.21; p = 0.021; I2 = 91.9%, p < 0.001], and diabetic patients [WMD = −6.55 mg/dl; 95% CI, −9.92 to −3.18; p < 0.001; I2 = 90.5%, p < 0.001].
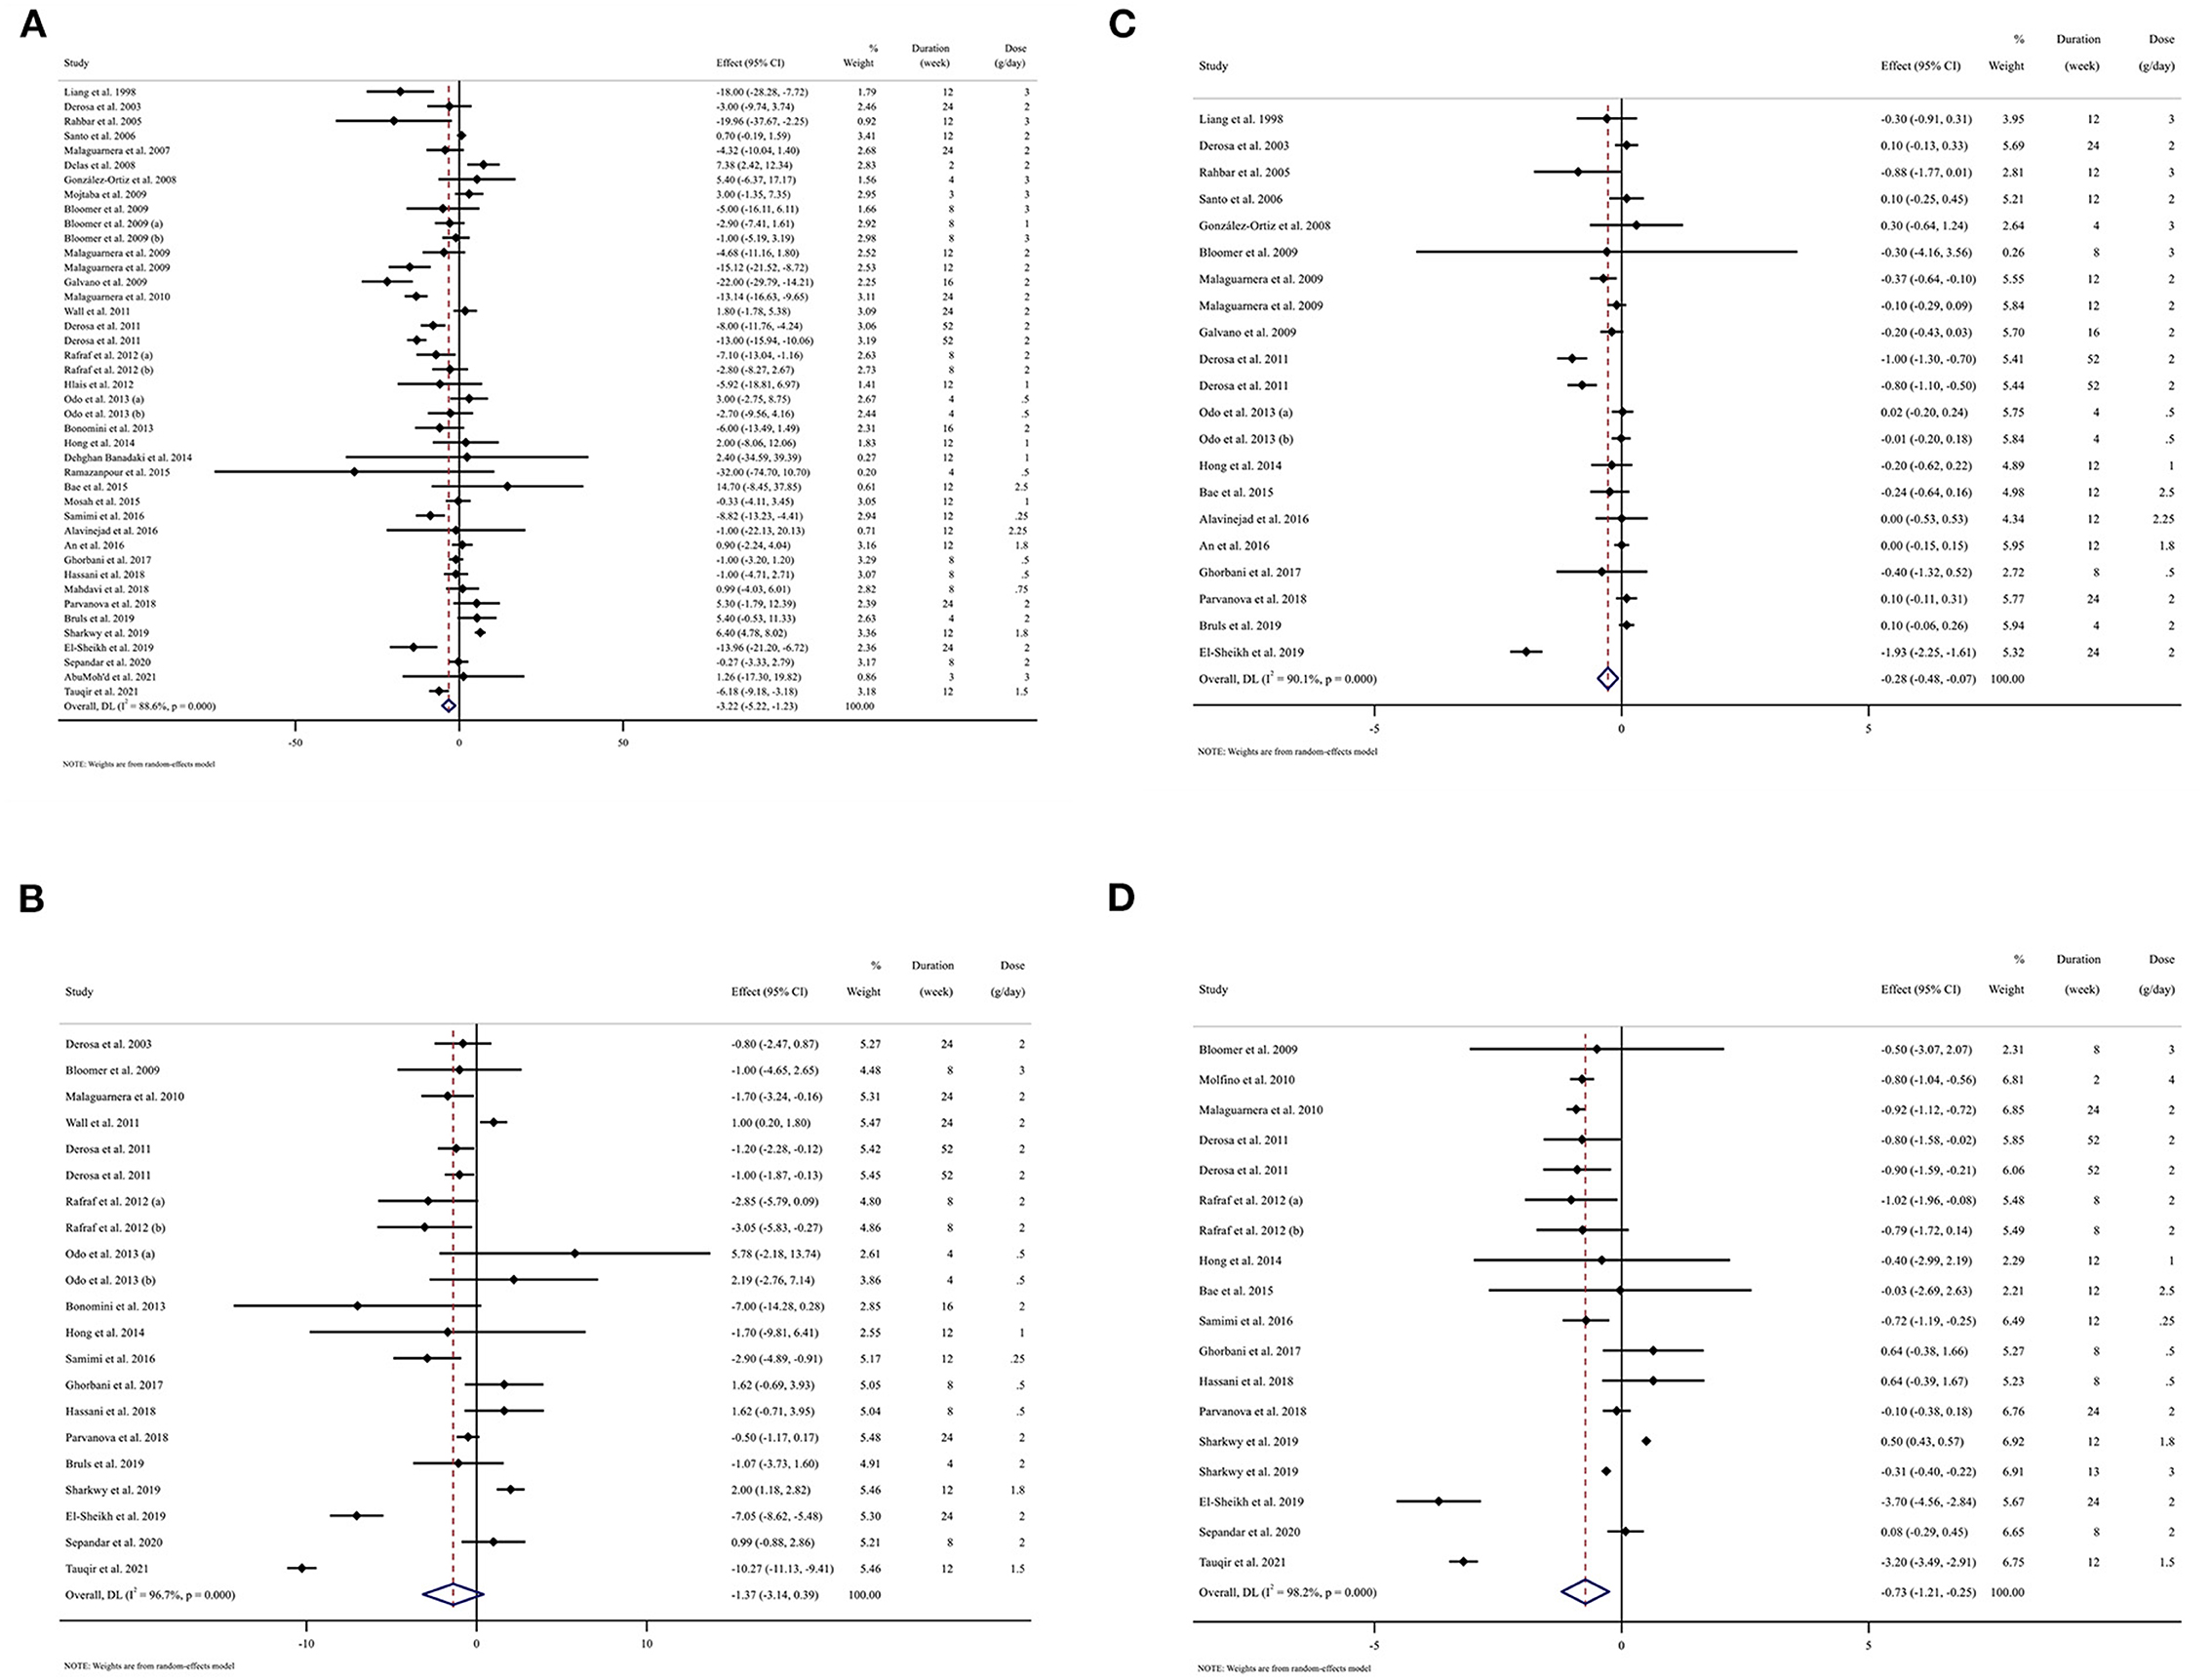
Figure 2. Forest plot detailing weighted mean difference and 95% confidence intervals (CIs) for the effect of L-carnitine consumption on (A) FBG (mg/dl); (B) Insulin (pmol/l); (C) HbA1c (%); (D) HOMA-IR. FBG, fasting blood glucose; HOMA-IR, homeostasis model assessment for insulin resistance; hemoglobin A1C, HbA1C; CI, confidence interval, weighted mean difference; WMD. Horizontal lines represent 95% of CIs. Diamonds represent pooled estimates from the random-effects analysis.
Subgroup analyses indicated significant between-study heterogeneity in studies conducted in all subgroups that were probable sources of heterogeneity, except in normal BMI participants (baseline BMI 18.5–24.9 kg/m2) (I2 = 46.4%, p = 0.071) (Table 3).
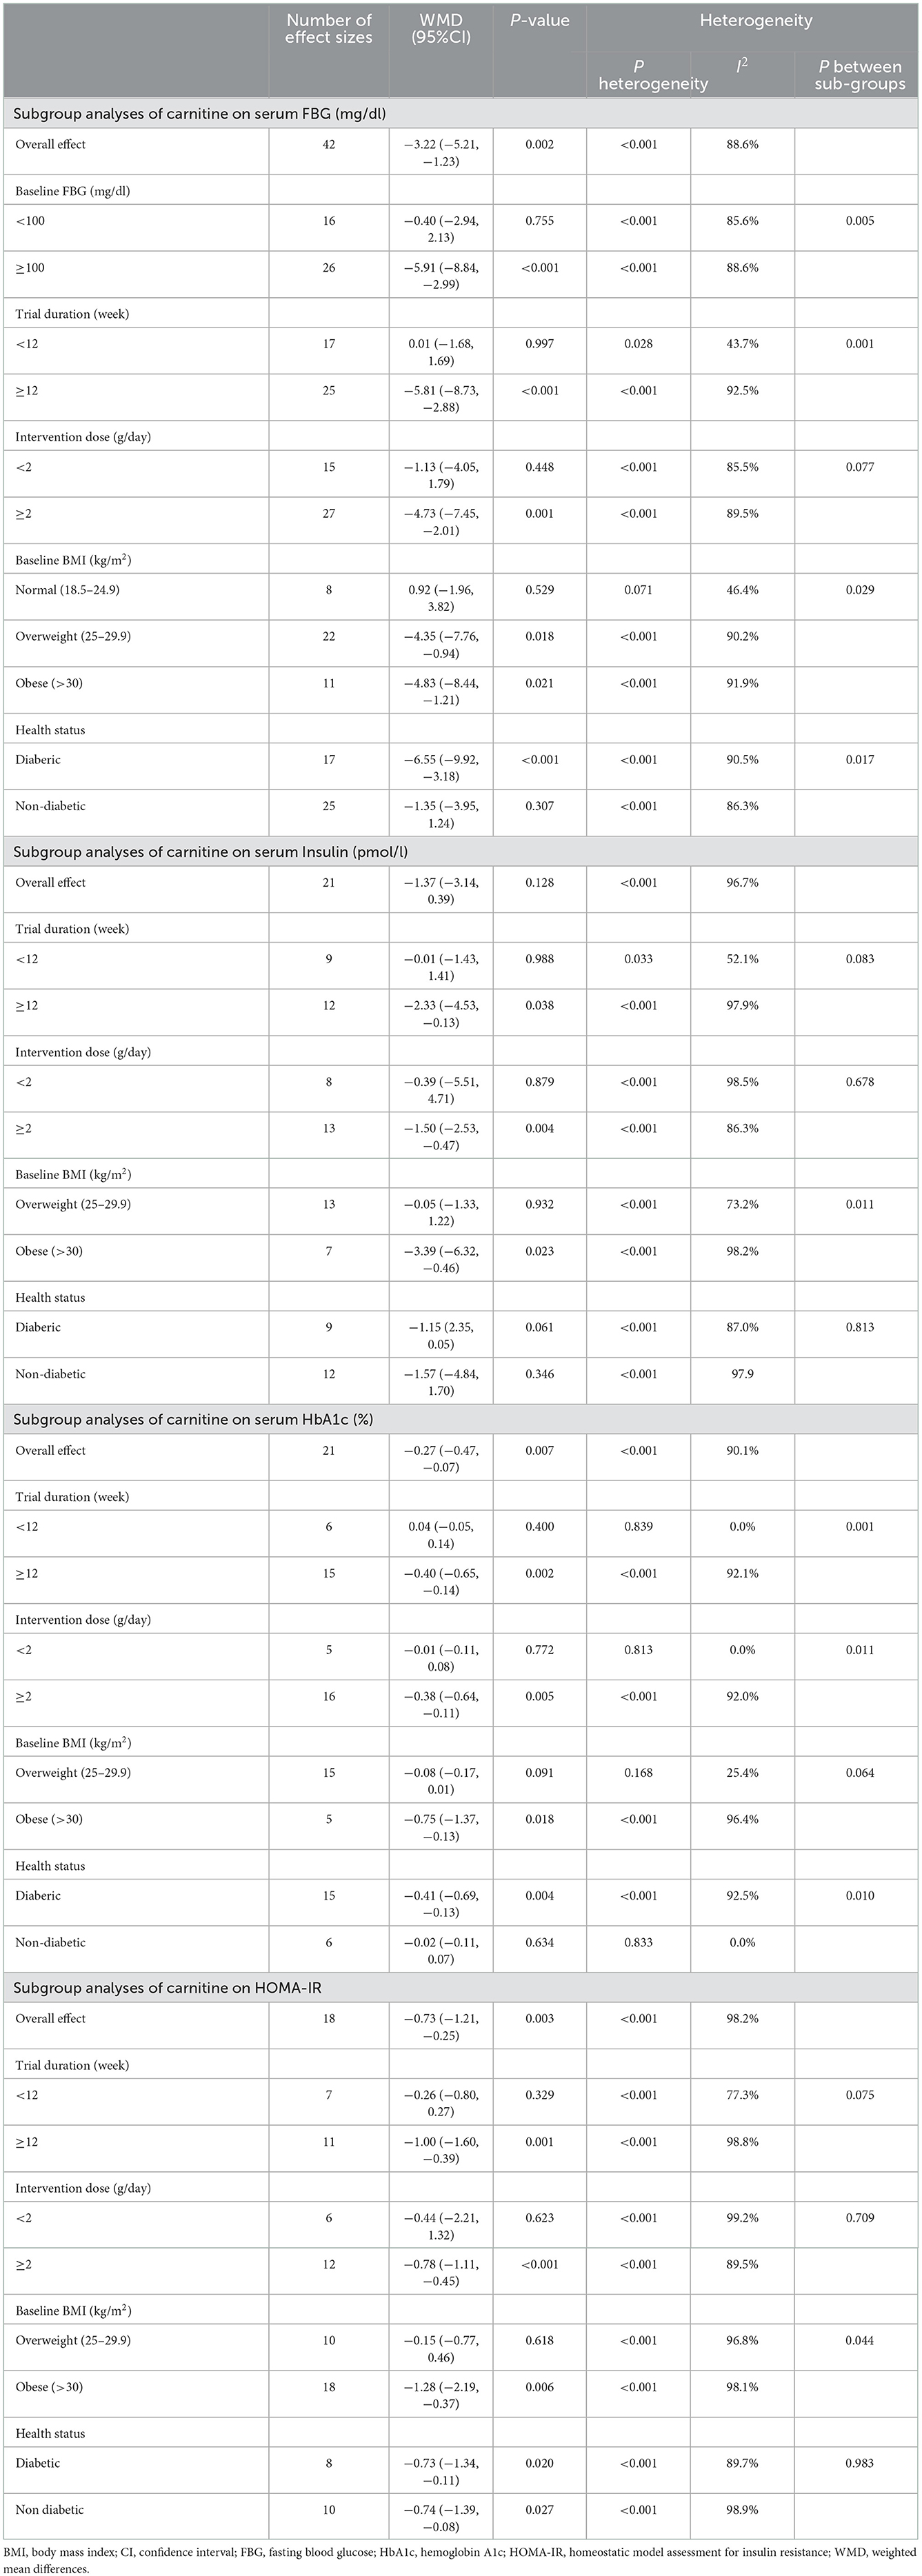
Table 3. Subgroup analyses of L-carnitine on glycemic indices in adults.
Effect of L-carnitine supplementation on serum insulin (pmol/l) and subgroup analysis
L-carnitine supplementation had not a significant effect on insulin (Figure 2B). Subgroup analyses showed that L-carnitine supplementation had a reduction effect on insulin (pmol/l) in trial duration ≥12 week [WMD = −2.33 pmol/l; 95% CI, −4.53 to −0.13; p = 0.038; I2 = 97.9%, p < 0.001], intervention dose ≥2 g/day [WMD = −1.50 pmol/l; 95%CI, −2.53 to −0.47; p = 0.004; I2 = 86.3%, p < 0.001], and participants with obesity (baseline BMI >30 kg/m2) [WMD = −3.39 pmol/l; 95%CI, −6.32 to −0.46; p = 0.023; I2 = 98.2%, p < 0.001].
Subgroup analyses indicated significant between-study heterogeneity in studies conducted in all subgroups that were not probable sources of heterogeneity (Table 3).
Effect of L-carnitine supplementation on serum HbA1c (%) and subgroup analysis
L-carnitine supplementation had a significant effect on HbA1c (Figure 2C). Subgroup analyses showed that L-carnitine supplementation had a lowering effect on HbA1c (%) in trial duration ≥12 week [WMD = −0.40 %; 95% CI, −0.65 to −0.14; p = 0.002; I2 = 92.1%, p < 0.001], intervention dose ≥2 g/day [WMD = −0.38 %; 95% CI, −0.64 to −0.11; p = 0.005; I2 = 92.0%, p < 0.001], participants with obesity (baselin BMI >30 kg/m2) [WMD = −0.75 %; 95% CI, −1.37 to −0.13; p = 0.018; I2 = 96.4%, p < 0.001] and diabetic patients [WMD = −0.41 %; 95% CI, −0.69 to −0.13; p = 0.004; I2 = 92.5%, p < 0.001].
Subgroup analyses indicated no significant between-study heterogeneity in studies conducted in the trial duration <12 week (I2 = 0.0%, p = 0.839), intervention dose <2 g/day (I2 = 0.0%, p = 0.813), participants with overweight (I2 = 25.4%, p = 0.168) and non-diabetic participants (I2 = 0.0%, p = 0.833) that were probable sources of heterogeneity (Table 3).
Effect of L-carnitine supplementation on HOMA-IR and subgroup analysis
Carnitine supplementation had a significant effect on HOMA-IR (Figure 2D). We conducted the subgroup analyses which showed that L-carnitine supplementation had a lowering effect on HOMA-IR in trial duration ≥12 week [WMD = −1.00; 95% CI, −1.60 to −0.39; p = 0.001; I2 = 98.8%, p < 0.001], intervention dose ≥2 g/day [WMD = −0.78; 95% CI, −1.11 to −0.45; p < 0.001; I2 = 89.5%, p < 0.001], participants with obesity (baseline BMI >30 kg/m2) [WMD = −1.28; 95% CI, −2.19 to −0.37; p = 0.006; I2 = 98.1%, p < 0.001], diabetic patients [WMD = −0.73; 95% CI, −1.34 to −0.11; p = 0.020; I2 = 89.7%, p < 0.001] and non-diabetic patients [WMD = −0.74; 95% CI, −1.39 to −0.08; p = 0.028; I2 = 89.9%, p < 0.001].
Subgroup analyses showed significant between-study heterogeneity in studies conducted in all subgroups that were not probable sources of heterogeneity (Table 3).
Publication bias
Although the visual inspection of funnel plots showed slight asymmetries, no significant publication bias was detected for insulin according to Begg ( = 0.204) and Egger's test ( = 0.995; Figure 3B). The statistical test showed evidence of a publication bias for HbA1c ( = 0.027, = 0.129; Figure 3C), and HOMA-IR ( = 0.046, = 0.060; Figure 3D), for FBG ( = 0.599, = 0.014; Figure 3A).
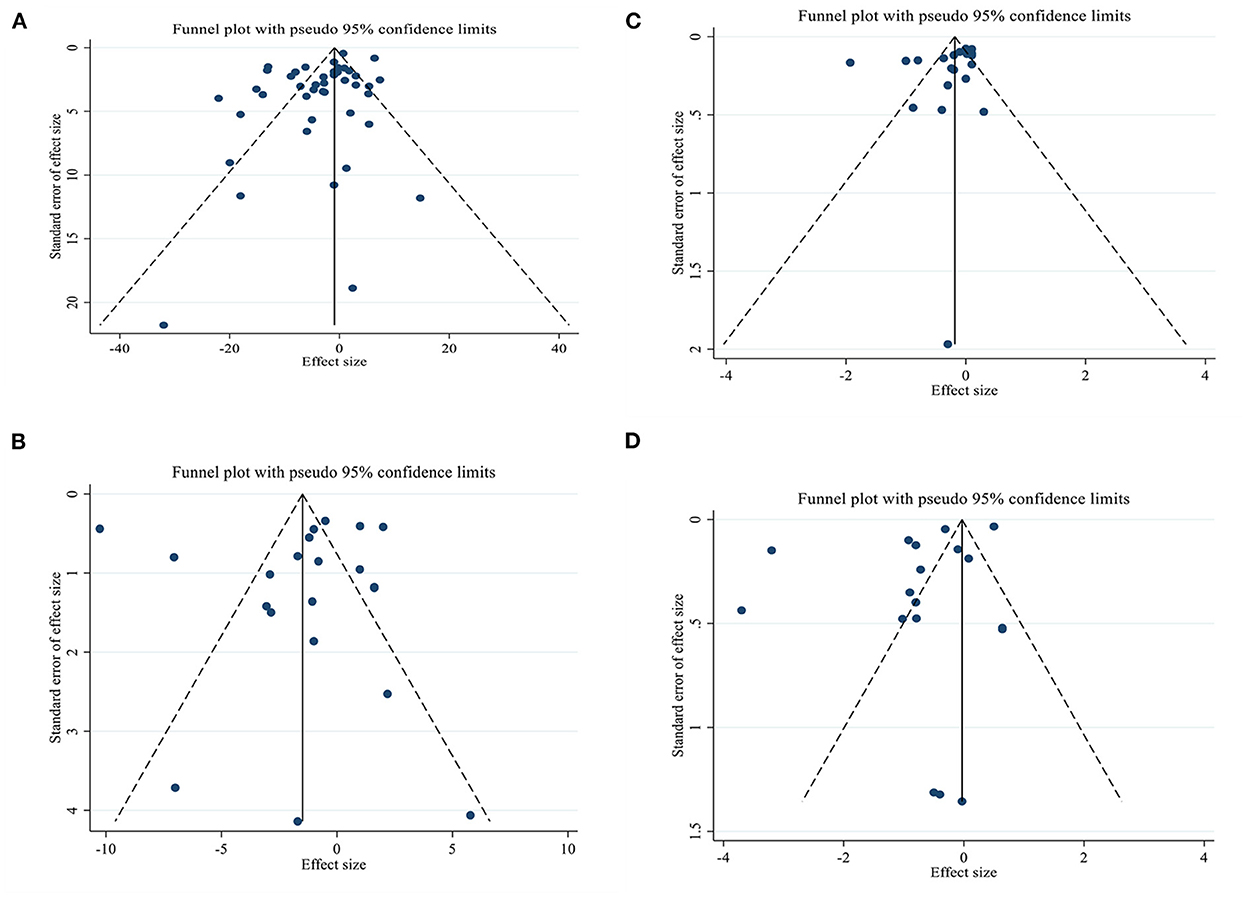
Figure 3. Funnel plots for the effect of L-carnitine consumption on (A) FBG (mg/dl); (B) Insulin (pmol/l); (C) HbA1c (%); (D) HOMA-IR. FBG, fasting blood glucose; HOMA-IR, homeostasis model assessment for insulin resistance; HbA1C, hemoglobin A1C.
Non-linear dose-response analysis
For the dose-response analysis between L-carnitine supplementation and FBG, insulin, HOMA-IR, and HbA1c, we used a one-stage non-linear dose-response analysis. We did not find a significant non-linear relationship between dose (g/day) (coefficients = −1.72, p = 0.154) and changes in FBG, but we found a significant non-linear relationship (coefficients = 7.45, p = 0.020) between duration of intervention and changes in FBG, It seems that the effective duration for decreasing of FBG is 50 weeks (Figures 4A, 5A). In addition, there was a significant non-linear relationship between dose (coefficients = 2.82, p = 0.020) and changes in insulin. Dose ≥2 g/day is more effective for decreasing insulin level, but we did not find a significant non-linear relationship between the duration of the intervention (weeks) (coefficients = 0.74, p = 0.177) and changes in insulin (Figures 4B, 5B). Also, we did not find a significant non-linear relationship between dose (g/day) (coefficients = −7.25, p = 0.140) and changes in HbA1c, although there was a significant non-linear relationship between duration of intervention (coefficients = −0.07, p < 0.001) and changes in HbA1c. It seems that the optimal duration for HbA1c reduction is 50 weeks (Figures 4C, 5C). In addition, we did not find a significant non-linear relationship between dose (g/day) (coefficients = −8.54, p = 0.054) and changes in HOMA-IR, although there was a significant non-linear relationship between duration of the intervention (coefficients = −0.22, p = 0.015) and changes in HOMA-IR; the prominent duration for decreasing of HOMA-IR seems to be 50 weeks (Figures 4D, 5D).
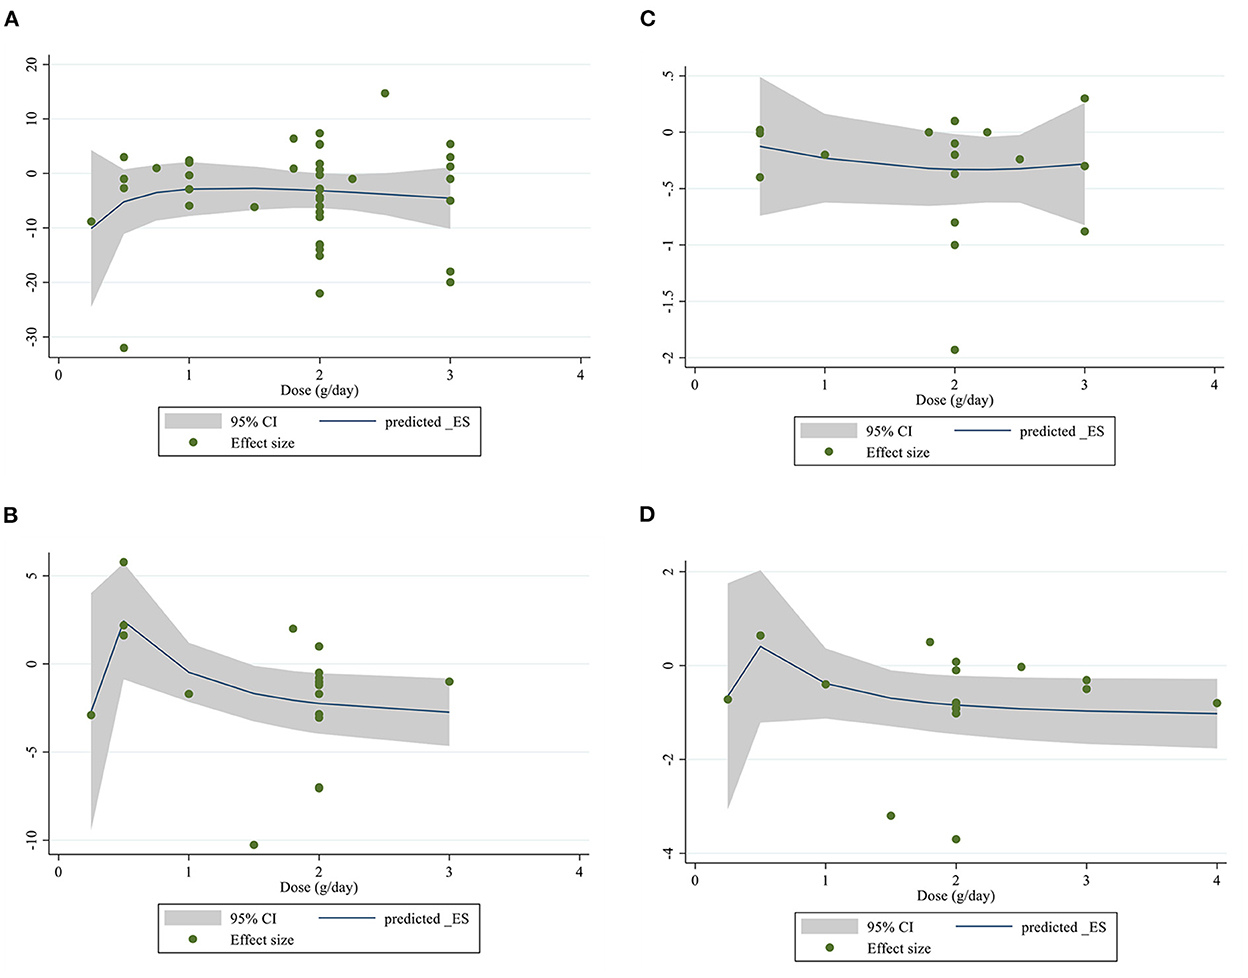
Figure 4. Non-linear dose-response relations between L-carnitine consumption and absolute mean differences. Dose-response relations between dose (mg/day) and absolute mean differences in (A) FBG (mg/dl); (B) Insulin (pmol/l); (C) HbA1c (%); (D) HOMA-IR. FBG, fasting blood glucose; HOMA-IR, homeostasis model assessment for insulin resistance; HbA1C, hemoglobin A1C.
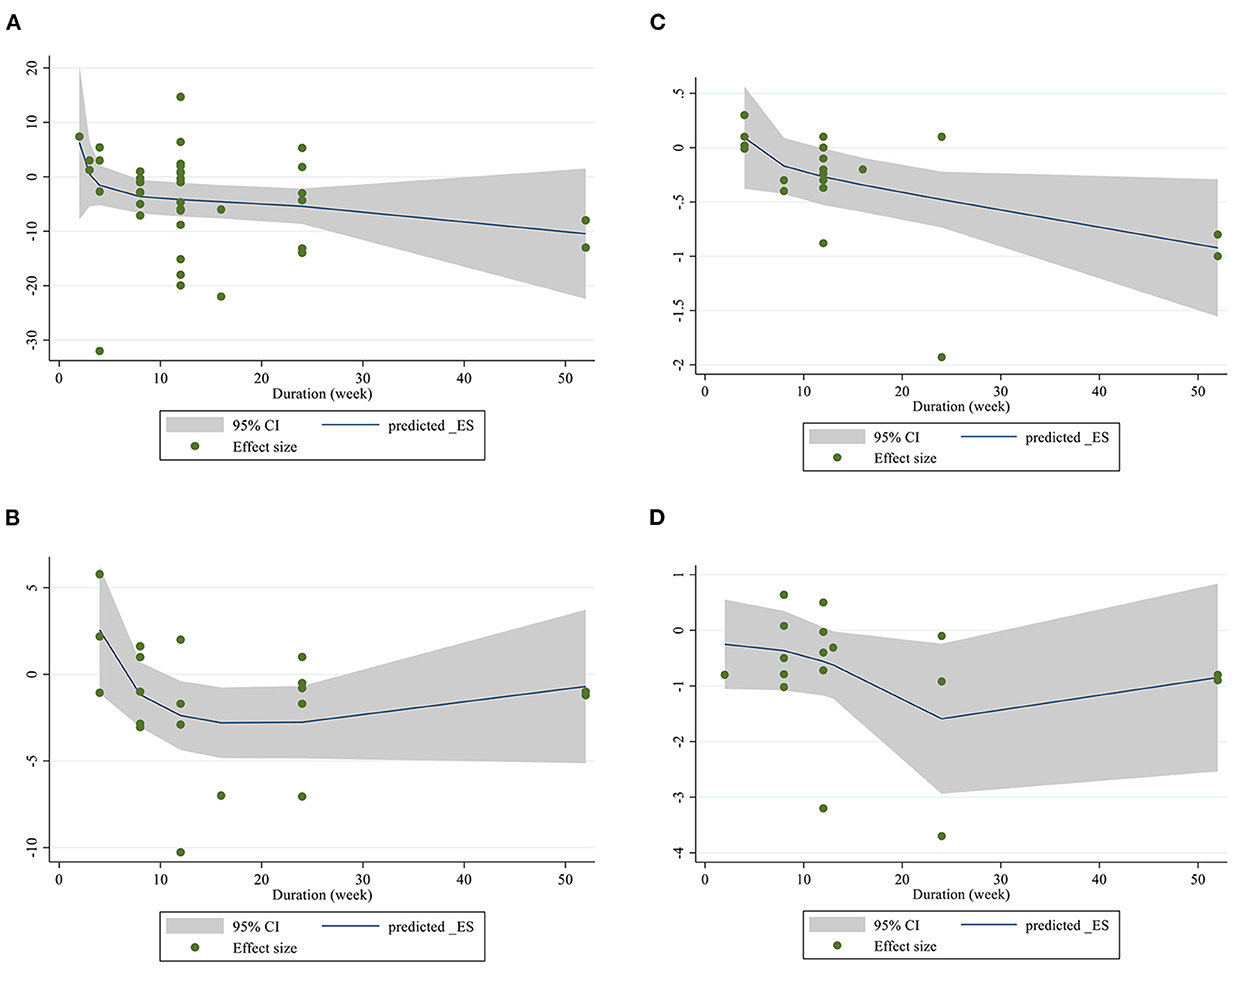
Figure 5. Non-linear dose-response relations between L-carnitine consumption and absolute mean differences. Dose-response relations between duration of intervention (week) and absolute mean differences in (A) FBG (mg/dl); (B) Insulin (pmol/l); (C) HbA1c (%); (D) HOMA-IR. FBG, fasting blood glucose; HOMA-IR, homeostasis model assessment for insulin resistance; HbA1C, hemoglobin A1C.
Meta-regression analysis
Meta-regression analyses were performed to assess whether FBG, insulin, HOMA-IR, and HbA1C was affected by L-carnitine doses and intervention durations. We did not find a significant linear relationship between dose (g/day) (coefficients = 0.01, p = 0.951) and changes in FBG, but there was a significant linear relationship between duration (weeks) (coefficients = −0.53, p = 0.031) of intervention and changes in FBG (Figures 6A, 7A). In addition, there was no significant linear relationship between dose (g/day) (coefficients = 0.02, p = 0.600) and duration of intervention (weeks) (coefficients = −0.54, p = 0.578) and changes in insulin (Figures 6B, 7B). Also, we did not find a significant linear relationship between dose (g/day) (coefficients = −0.16, p = 0.586) and changes in HbA1C, although there was a significant linear relationship between duration (weeks) (coefficients =-16.45, p = 0.016) of intervention and changes in HbA1C (Figures 6C, 7C). We did not find a significant linear relationship between dose (g/day) (coefficients = −0.09, p = 0.652) and duration (weeks) of intervention (coefficients = −2.68, p = 0.433) and changes in HOMA-IR (Figures 6D, 7D).
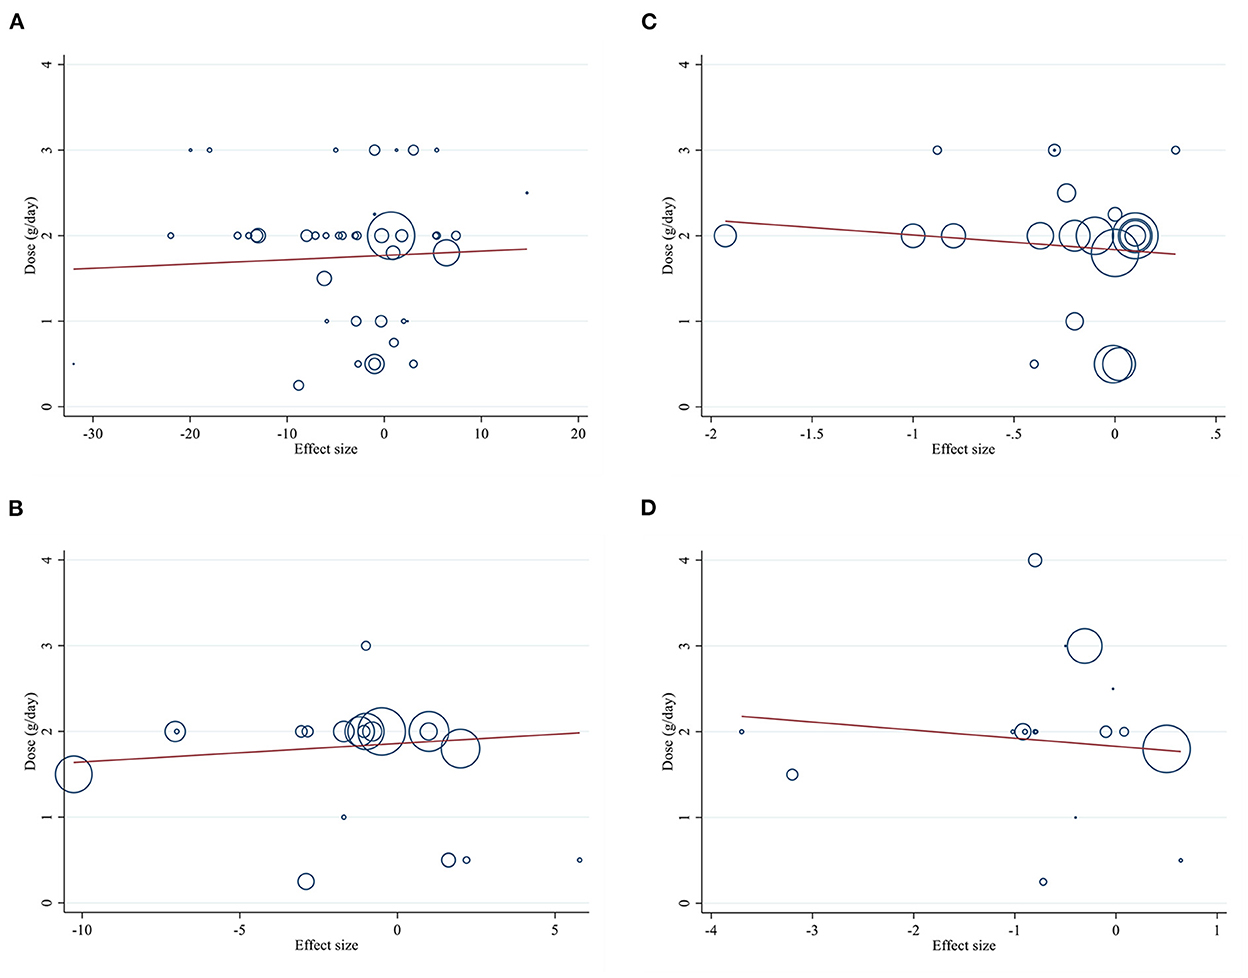
Figure 6. Linear relations between L-carnitine consumption and absolute mean differences. Dose-response relations between dose (mg/day) and absolute mean differences in (A) FBG (mg/dl); (B) Insulin (pmol/l); (C) HbA1c (%); (D) HOMA-IR. FBG, fasting blood glucose; HOMA-IR, homeostasis model assessment for insulin resistance; HbA1C, hemoglobin A1C.
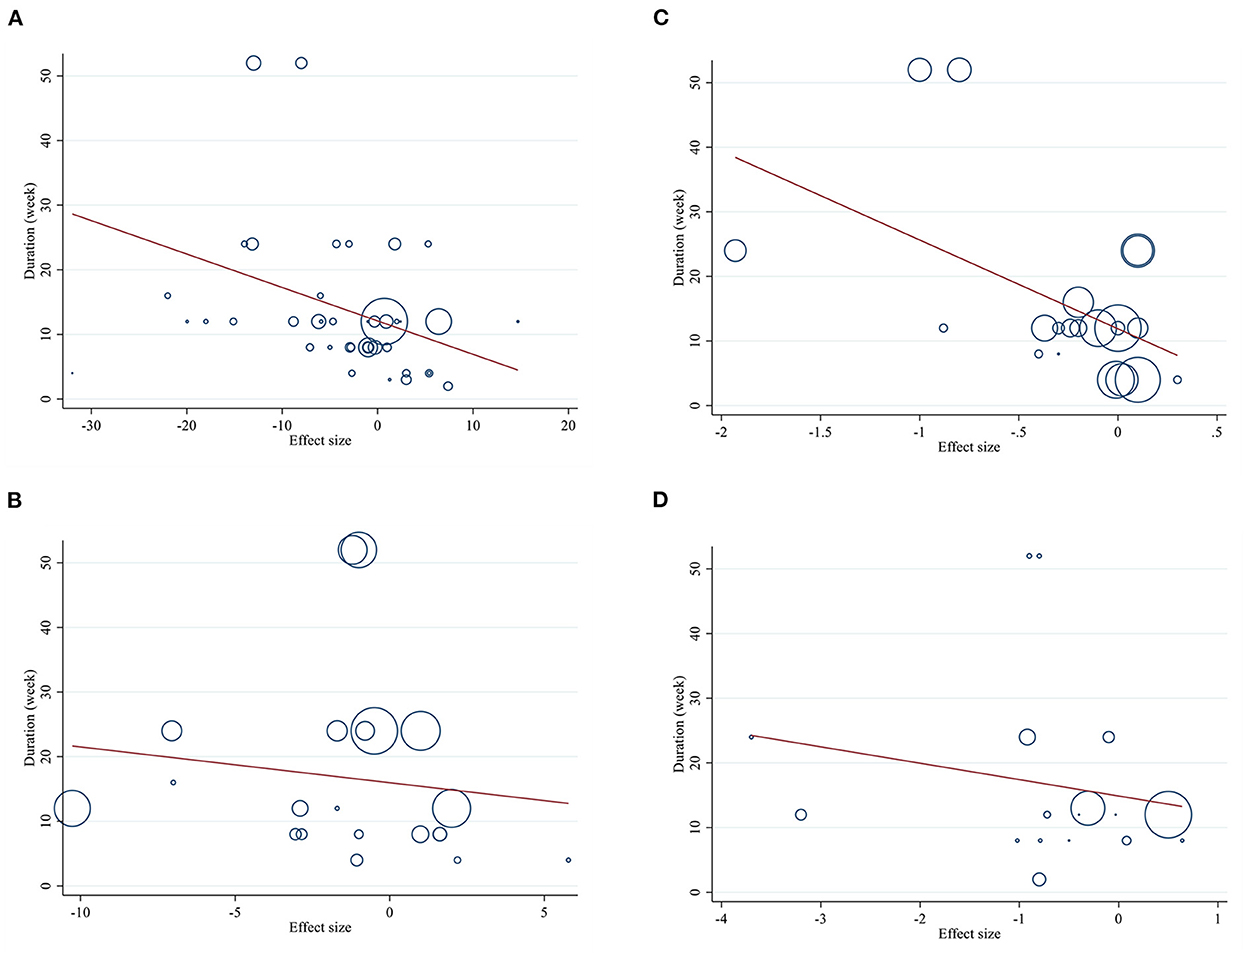
Figure 7. Linear relations between L-carnitine consumption and absolute mean differences. Dose-response relations between duration of intervention (week) and absolute mean differences in (A) FBG (mg/dl); (B) Insulin (pmol/l); (C) HbA1c (%); (D) HOMA-IR. FBG, fasting blood glucose; HOMA-IR, homeostasis model assessment for insulin resistance; HbA1C, hemoglobin A1C.
GRADE assessment
The GRADE evidence profile and the certainty in outcomes of L-carnitine supplementation on FBG, insulin, HOMA-IR, and HbA1c were shown in Table 4. The quality of evidence was low due to severe inconsistencies and risk of bias for FBG, inconsistency, imprecision for insulin, and inconsistency and publication bias for HOMA-IR. Although the quality of evidence was moderate due to inconsistency, the risk of bias and publication bias for HbA1c.
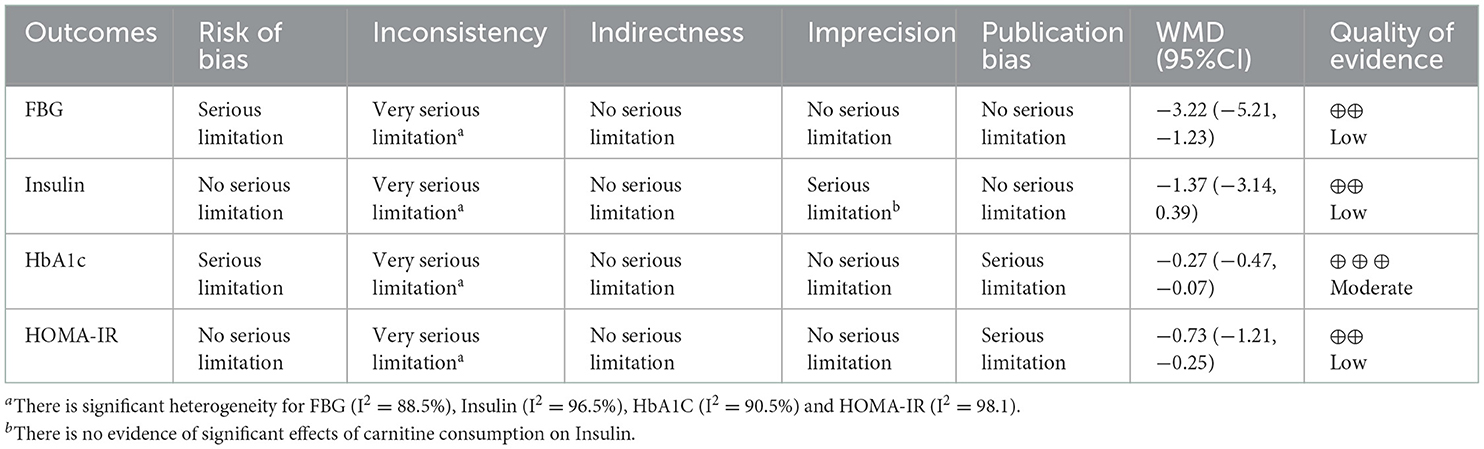
Table 4. GRADE profile of L-carnitine for glycemic indices.
Sensitivity analysis
According to the sensitivity analysis, no study affected the overall results after removing individual study effects.
Discussion
Present dose-response meta-analysis revealed that L-carnitine intake has beneficial effects on glycemic indices by reducing FBG, HbA1c, and HOMA-IR, whereas insulin levels were not changed in the overall analysis. Also; we found significant associations between L-carnitine supplementation and glycemic indices change in the highest vs. lowest duration in the non-linear dose-response analysis.
Our findings identified that the optimal duration for reducing FBG, HbA1c and HOMA-IR is 50 weeks, although this change was not significant for insulin levels. Insulin changes were significant with the increase of L-carnitine in highest vs. lowest doses and results showed that doses higher than 2 mg/day are more effective on reducing insulin levels.
Currently, the decrease in the level of physical activity, sedentary lifestyle, and unhealthy diets have caused an increase in obesity and overweight, as well as glycemic indices disorders and ultimately its progression to type 2 diabetes (T2D) (81, 82). It seems that nutritional supplements can be effective in preventing or treating chronic diseases, especially in subjects who are at risk of deficiency (83, 84).
In Asadi et al., meta-analysis study; L-carnitine intake was related to a significant reduction in fasting plasma glucose, HbA1c, and HOMA-IR in individuals with cardiovascular risk factors in comparison with control groups (25), the results of this study confirm the findings of our meta-analysis. Although Asadi et al.'s study had some differences from the present study including the type of participants that our study was conducted on all healthy and unhealthy individuals, while this study was conducted only on subjects at risk of cardiovascular diseases, the number of included studies was higher in our study (41 studies vs. 24 articles) and also unlike of this study dose-response analysis was done in our meta-analysis. Also, in another meta-analysis, it was shown that L-carnitine can reduce glycemic indices such as FBG, HbA1c, HOMA-IR, and insulin (24), although this study differs from our study in terms of significant changes in insulin levels, this observed controversy may be justified by the different quality and also the number of included studies. An interventional study conducted by Hadadinezhad et al. showed that L-carnitine supplementation with a dose of 3 g/day for 12 weeks in patients with T2D significantly reduced FBG, but had no significant effect on HbA1c and 2-h post-prandial blood glucose (85). It should be kept in mind that one of the reasons for the difference between the results of this study and our research in terms of HbA1c is that our study was conducted on all people with and without diabetes, while this study was conducted on participants with at least 8 years of history of diabetes and, therefore; since HbA1c levels represent blood glucose levels in the last 2–3 months, probably 12 weeks of intervention cannot have a significant effect on HbA1c levels in subjects with a long history of diabetes. Also; the use of different doses of carnitine is another reason for these contradictions (86). A meta-analysis study showed that for L-carnitine to have significant effects on FBG levels in patients with diabetes, 2 grams/day should be taken as a supplement for at least 36 weeks, also it is estimated that 2 g of L-carnitine per day is needed for at least 106 weeks to have a significant effect on HbA1c levels (87). One of the main differences between our study and Wang et al. (87) research was the number of included studies, which was 41 in our study vs. 8 articles, and these studies were only conducted on subjects with diabetes, while the studies included in our research were done on all individuals. Furthermore, in another clinical trial study, Liang et al. (23) showed that L-carnitine supplementation for 12 weeks at dose of 3 grams/day had no significant effect on FBG and HbA1c in diabetic patients. The results of this study do not confirm our findings, because carnitine seems to be taken up by muscles and liver, and this process is regulated by insulin and glucagon hormones, while; this study was conducted in subjects with diabetes, whose levels of these hormones are disturbed (88).
The main function of L-carnitine is probably to increase the fatty acids oxidation by transporting long-chain fatty acids from the cytosol to the mitochondrial matrix. But there are controversial reports regarding the effect of fatty acids oxidation on glucose metabolism. One hypothesis proposes that muscle insulin resistance results from decreased mitochondrial fatty acids oxidation. In such a way that unoxidized fatty acids are rerouted toward the synthesis of diacylglycerol and ceramide, which in turn stimulate stress-induced protein kinases that inhibit insulin signaling (89, 90). While, Randle et al. suggested that increased fatty acid oxidation inhibits glucose utilization in muscle. Inhibition of glucose utilization by fatty acids is a type of glucose intolerance that may lead to insulin resistance. In fact, fatty acid oxidation metabolites inhibit several glycolytic steps such as glucose transport and phosphorylation, 6-phosphofructo-1-kinase (PFK-1), and pyruvate dehydrogenase (91).
Despite these two hypotheses; some study reported that L-carnitine supplementation may affect insulin receptors and increase their sensitivity (92, 93). It is also reported that L-carnitine supplementation can improve the glycemic status and related indices by changing the expression of genes related to glycolytic and gluconeogenic enzymes, modulating the activity of the pyruvate dehydrogenase enzyme complex, and changing the expression of genes involved in insulin metabolism (94, 95).
Also, oxidative stress causes a disturbance in the function of pancreatic beta cells, and L-carnitine can improve the function of these cells and increase their efficiency by reducing the level of oxidative stress (67, 96). However, it seems that long-term L-carnitine intake eventually converts to a metabolite called trimethylamine N-oxide (TMAO) (97–99), and increased circulating levels of this metabolite can increase the prevalence of diabetes (54% per 5 μmol/L increment of plasma TMAO) (100), nonetheless one study showed that increased TMAO plasma level by 30 μmol/L after 24 weeks of L-carnitine supplementation was not related to glucose, insulin and HOMA-IR levels changes (97).
In the subgroup analysis, our results revealed that baseline FBG, trial duration, intervention dose, BMI, and health status had a significant effect on L-carnitine effects on FBG levels. Also, trial duration, intervention dose, individuals with obesity (BMI ≥ 30), and diabetic patients were among the factors that caused significant effects of L-carnitine on HbA1c levels. Effects of L-carnitine on FBG were significant in doses equal to or higher than 2 g/day and 12 weeks or more duration in subjects with overweight and obesity. Based on the results of previous studies, it seems that L-carnitine needs a longer duration of use to have significant effects on glycemic indices-related markers in diabetic patients (87). In an interventional study, it was shown that L-carnitine supplementation with a dose of 3 g/day for 12 weeks significantly reduced FBG, but its effects on HbA1c reduction were not significant in diabetic patients (17), the results of this study confirm our findings in terms of reducing FBG, but from the point of view of the effect on HbA1c, it does not confirm the results of our study. In term of HbA1c, considering that in this study the average BMI of the participants is in the overweight range and our results also showed that the effects of L-carnitine on HbA1c is significant only in subjects with obesity, so it can be said that this study also agrees with our findings.
Subgroup analysis of our findings showed that trial duration, intervention dose, and BMI status significantly affect the insulin level, as well as, it was shown that trial duration, intervention dose, obesity, and health status have a significant effect on the HOMA-IR levels. In line with our findings; A systematic review study conducted by Maleki et al. showed that L-carnitine supplementation in women with polycystic ovary syndrome (PCOs) improves glycemic status and reduces insulin resistance (101) which can be due to the increase in basal metabolic rate and lean body mass, as well as weight loss and improvement of related indices (102, 103). In one meta-analysis study in 2017, Xu et al. confirmed the findings of our study and showed that L-carnitine supplementation can have significant effects on HOMA-IR (104). It seems that serum carnitine levels decrease in individuals with obesity and metabolic syndrome due to insulin resistance, therefore supplement therapy with L-carnitine can help improve glycemic status by reducing insulin resistance (104). The results of Wutzke et al.'s study showed that taking an L-carnitine supplement at a dose of 3 g/day for 10 days, although it increased fat oxidation, did not have a significant effect on body weight and other factors, which in a way confirms the results of our study. Because doses of L-carnitine have mostly had significant effects for more than 12 weeks (105). It seems that L-carnitine can have optimal and significant effects on human health when it is accompanied by increased physical activity, modification of lifestyle, and compliance with a healthy diet (106–109). Therefore, it can be said that L-carnitine should be consumed at a dose of more than 2 g/day for more than 12 weeks and often in individuals with obesity to have significant effects on insulin and HOMA-IR levels.
The non-linear dose-response analysis revealed a significant negative relationship between FBG levels and L-carnitine intervention duration for 4 weeks and more. Moreover, HbA1c and HOMA-IR levels decreased significantly after about ≥12 and ≥8 weeks of L-carnitine supplementation, respectively. But it was not significant for insulin levels. It can be said that the optimal duration for effective reduction of FBG, HOMA-IR, and HbA1c was 50 weeks. Although unlike the other three indices insulin changes were significant with the increase of L-carnitine in highest vs. lowest doses and results showed that an optimal dose of about 2 g/day is more effective for decreasing insulin levels.
Of course, our study has some limitations, including that most of the included articles showed high bias and heterogeneity which makes it difficult to reach a definitive conclusion about the effects of carnitine. Although we tried to find the source of the heterogeneity by performing subgroup analysis. Moreover, we did not evaluate the effects of other glycemic indices such as 2-h post-prandial glucose due to the lack of examination of this outcome in clinical trials.
Although all studies used randomization; information on allocation concealment, randomization efficiency, and withdrawal was not consistently disclosed. Moreover, there are differences in laboratory assessment methods in different trials, as well as differences in intra assay coefficient of variation (intra-assay CV) and inter-assay coefficient of variation (inter-assay CV). Although adverse events were mentioned in some trials, most of them were not reported.
There are also strengths in the present study. To our knowledge, the present study is one of the first comprehensive dose-response meta-analyses to evaluate the L-carnitine effects on glycemic markers in diabetes and non-diabetic adults and we considered all published RCTs that were conducted on the effect of L-carnitine sapplementation on glycemic indices. Furthermore, we performed a dose-response analysis and considered different subgroups to evaluate the effects of L-carnitine on glycemic indices. All trials were included based on inclusion criteria, with varying individuals, which provides the possibility of subgroup analysis.
The randomized and placebo-controlled design of all included trials and the double-blind design of most of them can also be other strengths and due to the RCT nature of the studies, the drugs used by the patients (especially in diabetic patients), the diet and the level of physical activity of the participants were controlled and in fact their effects were considered and it can be said that the pure effects of L-carnitine was evaluated. In the current meta-analysis, there were no time and language restrictions for inclusion of studies. In addition, GRADE assessment, sensitivity tests, and subgroup analysis were used to assess quality of studies, detect publication bias and identify potential sources of heterogeneity among trials, respectively.
Conclusions
The findings of our systematic review and dose-response meta-analysis showed a significant reductions for FBG, HbA1c, and HOMA-IR levels. However, based on our analysis, L-carnitine failed to significantly affect serum insulin. Moreover, dose-response analysis demonstrated that L-carnitine supplementation at doses of equal 2 g/day has an optimal effect on insulin levels. On the other hand; 50 weeks of intervention has beneficial effects on decreasing HOMA-IR, HbA1c, and FBG. Larger, well-designed trials are still required to further evaluation of this association.
Data availability statement
The original contributions presented in the study are included in the article/supplementary material, further inquiries can be directed to the corresponding authors.
Author contributions
MZ designed the study. MZ and OA developed the search strategy and assessed the risk of bias of the meta-analyses. MZ, MN-S, and OA extracted the data and conducted the analyses. NP, RG-E, NR, and SR drafted the manuscript. FS, OA, and MN-S interpreted the results. FS, OA, and SR revised manuscript. All authors read and approved the final manuscript.
Conflict of interest
The authors declare that the research was conducted in the absence of any commercial or financial relationships that could be construed as a potential conflict of interest.
Publisher's note
All claims expressed in this article are solely those of the authors and do not necessarily represent those of their affiliated organizations, or those of the publisher, the editors and the reviewers. Any product that may be evaluated in this article, or claim that may be made by its manufacturer, is not guaranteed or endorsed by the publisher.
Abbreviations
RCTs, randomized clinical trials; FBG, fasting blood glucose; HbA1C, hemoglobin A1C; HOMA-IR, homeostasis model assessment of insulin resistance; WMD, weighted mean differences; CI, confidence intervals; BMI, body mass index; GRADE, Grading of Recommendations Assessment, Development, and Evaluation; T2D; ATP, adenosine triphosphate; PRISMA, preferred reporting items for systematic reviews and meta-analyses; PICO, Participant, Intervention, Comparison/Control, and Outcome.
References
2. Wolosowicz M, Prokopiuk S, Kaminski TW. Recent advances in the treatment of insulin resistance targeting molecular and metabolic pathways: fighting a losing battle? Medicina. (2022) 58:472. doi: 10.3390/medicina58040472
3. Fahed M, Abou Jaoudeh MG, Merhi S, Mosleh JMB, Ghadieh R, Al Hayek S, et al. Evaluation of risk factors for insulin resistance: a cross sectional study among employees at a private university in Lebanon. BMC Endocr Disord. (2020) 20:1–14. doi: 10.1186/s12902-020-00558-9
4. Krhač M, Lovrenčić MV. Update on biomarkers of glycemic control. World J Diabetes. (2019) 10:1–15. doi: 10.4239/wjd.v10.i1.1
5. Einarson TR, Acs A, Ludwig C, Panton UH. Prevalence of cardiovascular disease in type 2 diabetes: a systematic literature review of scientific evidence from across the world in 2007–2017. Cardiovasc Diabetol. (2018) 17:83. doi: 10.1186/s12933-018-0728-6
6. Selvin E, Steffes MW, Zhu H, Matsushita K, Wagenknecht L, Pankow J, et al. Glycated hemoglobin, diabetes, and cardiovascular risk in nondiabetic adults. N Engl J Med. (2010) 362:800–11. doi: 10.1056/NEJMoa0908359
7. Sarwar N, Gao P, Seshasai S, Gobin R, Kaptoge S, Di Angelantonio E, et al. Emerging risk factors collaboration diabetes mellitus, fasting blood glucose concentration, and risk of vascular disease: a collaborative meta-analysis of 102 prospective studies. Lancet. (2010) 375:2215–22. doi: 10.1016/S0140-6736(10)60484-9
8. Shita NG, Iyasu AS. Glycemic control and its associated factors in type 2 diabetes patients at Felege Hiwot and Debre Markos Referral Hospitals. Sci Rep. (2022) 12:1–9. doi: 10.1038/s41598-022-13673-5
9. Yeemard F, Srichan P, Apidechkul T, Luerueang N, Tamornpark R, Utsaha S. Prevalence and predictors of suboptimal glycemic control among patients with type 2 diabetes mellitus in northern Thailand: a hospital-based cross-sectional control study. PLoS ONE. (2022) 17:e0262714. doi: 10.1371/journal.pone.0262714
10. Mansour AA, Alibrahim NT, Alidrisi HA, Alhamza AH, Almomin AM, Zaboon IA, et al. Prevalence and correlation of glycemic control achievement in patients with type 2 diabetes in Iraq: a retrospective analysis of a tertiary care database over a 9-year period. Diabetes Metab Syndr Clin Res Rev. (2020) 14:265–72. doi: 10.1016/j.dsx.2020.03.008
11. Asbaghi O, Moradi S, Kashkooli S, Zobeiri M, Nezamoleslami S, Lazaridi A-V, et al. The effects of oral magnesium supplementation on glycemic control in patients with type 2 diabetes: a systematic review and dose-response meta-analysis of controlled clinical trials. Br J Nutr. (2022) 128:2363–72. doi: 10.1017/S0007114521005201
12. Asbaghi O, Fouladvand F, Gonzalez MJ, Ashtary-Larky D, Choghakhori R, Abbasnezhad A. Effect of green tea on glycemic control in patients with type 2 diabetes mellitus: a systematic review and meta-analysis. Diabetes Metab Syndr Clin Res Rev. (2021) 15:23–31. doi: 10.1016/j.dsx.2020.11.004
13. Asbaghi O, Ashtary-Larky D, Bagheri R, Moosavian SP, Olyaei HP, Nazarian B, et al. Folic acid supplementation improves glycemic control for diabetes prevention and management: a systematic review and dose-response meta-analysis of randomized controlled trials. Nutrients. (2021) 13:2355. doi: 10.3390/nu13072355
14. Uusitupa M, Khan TA, Viguiliouk E, Kahleova H, Rivellese AA, Hermansen K, et al. Prevention of Type 2 diabetes by lifestyle changes: a systematic review and meta-analysis. Nutrients. (2019) 11:2611. doi: 10.3390/nu11112611
15. Evans AM, Fornasini G. Pharmacokinetics of L-carnitine. Clin Pharmacokinet. (2003) 42:941–67. doi: 10.2165/00003088-200342110-00002
16. Bruls YM, de Ligt M, Lindeboom L, Phielix E, Havekes B, Schaart G, et al. Carnitine supplementation improves metabolic flexibility and skeletal muscle acetylcarnitine formation in volunteers with impaired glucose tolerance: a randomised controlled trial. EBioMedicine. (2019) 49:318–30. doi: 10.1016/j.ebiom.2019.10.017
17. Rahbar A, Shakerhosseini R, Saadat N, Taleban F, Pordal A, Gollestan B. Effect of L-carnitine on plasma glycemic and lipidemic profile in patients with type II diabetes mellitus. Eur J Clin Nutr. (2005) 59:592–6. doi: 10.1038/sj.ejcn.1602109
18. Bene J, Hadzsiev K, Melegh B. Role of carnitine and its derivatives in the development and management of type 2 diabetes. Nutr Diabetes. (2018) 8:1–10. doi: 10.1038/s41387-018-0017-1
19. Galloway SD, Craig TP, Cleland SJ. Effects of oral L-carnitine supplementation on insulin sensitivity indices in response to glucose feeding in lean and overweight/obese males. Amino Acids. (2011) 41:507–15. doi: 10.1007/s00726-010-0770-5
20. Bashi AYD, Al-Farha MAA-M. Effect of L-carnitine on certain biochemical parameters in diabetic patients. Tikrit Med J. (2010) 16:146–51.
21. Ringseis R, Keller J, Eder K. Role of carnitine in the regulation of glucose homeostasis and insulin sensitivity: evidence from in vivo and in vitro studies with carnitine supplementation and carnitine deficiency. Eur J Nutr. (2012) 51:1–18. doi: 10.1007/s00394-011-0284-2
22. Nejati M, Abbasi S, Farsaei S, Shafiee F. L-carnitine supplementation ameliorates insulin resistance in critically ill acute stroke patients: a randomized, double-blinded, placebo-controlled clinical trial. Res Pharm Sci. (2022) 17:66. doi: 10.4103/1735-5362.329927
23. Liang Y, Li Y, Shan J, Yu B, Ho Z. The effects of oral L-carnitine treatment on blood lipid metabolism and the body fat content in the diabetic patient. Asia Pac J Clin Nutr. (1998) 7:192–5.
24. Fathizadeh H, Milajerdi A, Reiner Ž, Kolahdooz F, Asemi Z. The effects of L-carnitine supplementation on glycemic control: a systematic review and meta-analysis of randomized controlled trials. EXCLI J. (2019) 18:631. doi: 10.2174/1381612825666190830154336
25. Asadi M, Rahimlou M, Shishehbor F, Mansoori A. The effect of l-carnitine supplementation on lipid profile and glycaemic control in adults with cardiovascular risk factors: a systematic review and meta-analysis of randomized controlled clinical trials. Clin Nutr. (2020) 39:110–22. doi: 10.1016/j.clnu.2019.01.020
26. Page MJ, McKenzie JE, Bossuyt PM, Boutron I, Hoffmann TC, Mulrow CD, et al. The PRISMA 2020 statement: an updated guideline for reporting systematic reviews. BMJ. (2021) 372:n71. doi: 10.1136/bmj.n71
27. Dong J-Y, Qin L-Q, Zhang Z, Zhao Y, Wang J, Arigoni F, et al. Effect of oral L-arginine supplementation on blood pressure: a meta-analysis of randomized, double-blind, placebo-controlled trials. Am Heart J. (2011) 162:959–65. doi: 10.1016/j.ahj.2011.09.012
28. Higgins JP, Green S. Cochrane Handbook for Systematic Reviews of Interventions Version, Vol. 5. Hoboken, NJ: Wiley (2011).
29. DerSimonian R, Laird N. Meta-analysis in clinical trials. Controlled Clin Trials. (1986) 7:177–88. doi: 10.1016/0197-2456(86)90046-2
30. Asbaghi O, Sadeghian M, Mozaffari-Khosravi H, Maleki V, Shokri A, Hajizadeh-Sharafabad F, et al. The effect of vitamin d-calcium co-supplementation on inflammatory biomarkers: a systematic review and meta-analysis of randomized controlled trials. Cytokine. (2020) 129:155050. doi: 10.1016/j.cyto.2020.155050
31. Hozo SP, Djulbegovic B, Hozo I. Estimating the mean and variance from the median, range, and the size of a sample. BMC Med Res Methodol. (2005) 5:1–10. doi: 10.1186/1471-2288-5-13
32. Higgins JP. Cochrane handbook for systematic reviews of interventions version 5.0.1. The Cochrane Collaboration (2008). Available online at: https://www.cochrane-handbook.org/
33. Fu R, Gartlehner G, Grant M, Shamliyan T, Sedrakyan A, Wilt TJ, et al. Conducting quantitative synthesis when comparing medical interventions: AHRQ and the effective health care program. J Clin Epidemiol. (2011) 64:1187–97. doi: 10.1016/j.jclinepi.2010.08.010
34. Agency for Healthcare Research and Quality. Methods Guide for Effectiveness and Comparative Effectiveness Reviews. New York, NY: Agency for Healthcare Research and Quality (2011).
35. Namazi N, Larijani B, Azadbakht L. Low-carbohydrate-diet score and its association with the risk of diabetes: a systematic review and meta-analysis of cohort studies. Hormone Metab Res. (2017) 49:565–71. doi: 10.1055/s-0043-112347
36. Brondani LA, Assmann TS, de Souza BM, Boucas AP, Canani LH, Crispim D. Meta-analysis reveals the association of common variants in the uncoupling protein (UCP) 1–3 genes with body mass index variability. PLoS ONE. (2014) 9:e96411. doi: 10.1371/journal.pone.0096411
37. Begg CB, Mazumdar M. Operating characteristics of a rank correlation test for publication bias. Biometrics. (1994) 50:1088–101. doi: 10.2307/2533446
38. Egger M, Smith GD, Schneider M, Minder C. Bias in meta-analysis detected by a simple, graphical test. BMJ. (1997) 315:629–34. doi: 10.1136/bmj.315.7109.629
39. Duval S. The trim and fill method. In: Publication Bias in Meta-Analysis: Prevention, Assessment and Adjustments. London: Elsevier Ltd. (2005). p. 127–44. doi: 10.1002/0470870168.ch8
40. Xu C, Doi SA. The robust error meta-regression method for dose–response meta-analysis. JBI Evid Implement. (2018) 16:138–44. doi: 10.1097/XEB.0000000000000132
41. Xie Y, Gou L, Peng M, Zheng J, Chen L. Effects of soluble fiber supplementation on glycemic control in adults with type 2 diabetes mellitus: a systematic review and meta-analysis of randomized controlled trials. Clin Nutr. (2021) 40:1800–10. doi: 10.1016/j.clnu.2020.10.032
42. Guyatt GH, Oxman AD, Vist GE, Kunz R, Falck-Ytter Y, Alonso-Coello P, et al. GRADE: an emerging consensus on rating quality of evidence and strength of recommendations. BMJ. (2008) 336:924–6. doi: 10.1136/bmj.39489.470347.AD
43. Sepandar F, Daneshpazhooh M, Djalali M, Mohammadi H, Yaghubi E, Fakhri Z, et al. The effect of l-carnitine supplementation on serum levels of omentin-1, visfatin and SFRP5 and glycemic indices in patients with pemphigus vulgaris: a randomized, double-blind, placebo-controlled clinical trial. Phytother Res. (2020) 34:859–66. doi: 10.1002/ptr.6568
44. El Sharkwy I, Sharaf El-Din M. l-Carnitine plus metformin in clomiphene-resistant obese PCOS women, reproductive and metabolic effects: a randomized clinical trial. Gynecol Endocrinol. (2019) 35:701–5. doi: 10.1080/09513590.2019.1576622
45. Gonzalez-Ortiz M, Hernández-González SO, Hernández-Salazar E, Martínez-Abundis E. Effect of oral L-carnitine administration on insulin sensitivity and lipid profile in type 2 diabetes mellitus patients. Ann Nutr Metab. (2008) 52:335–8. doi: 10.1159/000151488
46. Mosah HA, Khazaal FAK, Sahib HB, Hamdi AS. Effect of L-carnitine and raspberry ketones on metabolic parameters in Iraqi obese females, a comparative study. Int J Pharm Sci Rev Res. (2015) 31:63–8.
47. AbuMoh'd MF, Obeidat G, Alsababha W. Effect of oral supplementation with L-carnitine on performance time in a 5000 m race and responses of free fatty acid and carnitine concentrations in trained-endurance athletes. Montenegrin J Sports Sci Med. (2021) 10:5–11. doi: 10.26773/mjssm.210901
48. An JH, Kim YJ, Kim KJ, Kim SH, Kim NH, Kim HY, et al. L-carnitine supplementation for the management of fatigue in patients with hypothyroidism on levothyroxine treatment: a randomized, double-blind, placebo-controlled trial. Endocr J. 2016:EJ16–0109. doi: 10.1507/endocrj.EJ16-0109
49. Bae JC, Lee WY, Yoon KH, Park JY, Son HS, Han KA, et al. Improvement of nonalcoholic fatty liver disease with carnitine-orotate complex in type 2 diabetes (CORONA): a randomized controlled trial. Diabetes Care. (2015) 38:1245–52. doi: 10.2337/dc14-2852
50. Bloomer RJ, Fisher-Wellman KH, Tucker PS. Effect of oral acetyl L-carnitine arginate on resting and postprandial blood biomarkers in pre-diabetics. Nutr Metab. (2009) 6:1–11. doi: 10.1186/1743-7075-6-25
51. Bonomini M, Di Liberato L, Del Rosso G, Stingone A, Marinangeli G, Consoli A, et al. Effect of an L-carnitine–containing peritoneal dialysate on insulin sensitivity in patients treated with CAPD: a 4-month, prospective, multicenter randomized trial. Am J Kidney Dis. (2013) 62:929–38. doi: 10.1053/j.ajkd.2013.04.007
52. Delaš I, Dražić T, Cačić-Hribljan M, Sanković K. Effect of L-carnitine supplementation on some biochemical parameters in blood serum of sedentary population. Croatica Chem Acta. (2008) 81:163–8.
53. Derosa G, Cicero AF, Gaddi A, Mugellini A, Ciccarelli L, Fogari R. The effect of L-carnitine on plasma lipoprotein (a) levels in hypercholesterolemic patients with type 2 diabetes mellitus. Clin Ther. (2003) 25:1429–39. doi: 10.1016/S0149-2918(03)80130-3
54. Derosa G, Maffioli P, Ferrari I, D'Angelo A, Fogari E, Palumbo I, et al. Comparison between orlistat plus l-carnitine and orlistat alone on inflammation parameters in obese diabetic patients. Fundament Clin Pharmacol. (2011) 25:642–51. doi: 10.1111/j.1472-8206.2010.00888.x
55. Derosa G, Maffioli P, Salvadeo SA, Ferrari I, Gravina A, Mereu R, et al. Effects of combination of sibutramine and L-carnitine compared with sibutramine monotherapy on inflammatory parameters in diabetic patients. Metabolism. (2011) 60:421–9. doi: 10.1016/j.metabol.2010.03.010
56. El Sharkwy IA, Abd El Aziz WM. Randomized controlled trial of N-acetylcysteine versus l-carnitine among women with clomiphene-citrate-resistant polycystic ovary syndrome. Int J Gynecol Obstetr. (2019) 147:59–64. doi: 10.1002/ijgo.12902
57. El-Sheikh HM, El-Haggar SM, Elbedewy TA. Comparative study to evaluate the effect of l-carnitine plus glimepiride versus glimepiride alone on insulin resistance in type 2 diabetic patients. Diabetes Metab Syndrome Clin Res Rev. (2019) 13:167–73. doi: 10.1016/j.dsx.2018.08.035
58. Galvano F, Li Volti G, Malaguarnera M, Avitabile T, Antic T, Vacante M, et al. Effects of simvastatin and carnitine versus simvastatin on lipoprotein (a) and apoprotein (a) in type 2 diabetes mellitus. Expert Opin Pharmacother. (2009) 10:1875–82. doi: 10.1517/14656560903081745
59. Hassani A, Ghorbani M. Effects of combined exercises beside consumption of omega-3, L-carnitine supplements on the serum level of irisin, resistance insulin, profile lipid of type 2 diabetic women. J Knowl Health. (2018) 13:55–64.
60. Hlais S, Abou Reslan DR, Sarieddine HK, Nasreddine L, Taan G, Azar S, et al. Effect of lysine, vitamin B6, and carnitine supplementation on the lipid profile of male patients with hypertriglyceridemia: a 12-week, open-label, randomized, placebo-controlled trial. Clin Ther. (2012) 34:1674–82. doi: 10.1016/j.clinthera.2012.06.019
61. Hong ES, Kim EK, Kang SM, Khang AR, Choi SH, Park KS, et al. Effect of carnitine-orotate complex on glucose metabolism and fatty liver: a double-blind, placebo-controlled study. J Gastroenterol Hepatol. (2014) 29:1449–57. doi: 10.1111/jgh.12536
62. Dehghan Banadaki S, Mozaffari-Khosravi H, Ahmadi S, Hajimirzadeh MK, Lotfi MH. Effects of oral L-carnitine supplementation on C-reactive protein and blood sugar in hemodialysis patients: a randomized clinical controlled trial. Iran J Diabetes Obesity. (2014) 6:157–62.
63. Ghorbani M, Hassani A, Donyai A, Qadiri M. The effect of 8-weeks compound exercises training with omega-3 and l-carnitine supplementation intake on serum levels of visfatin in type 2 diabetic women. Iran J Endocrinol Metab. (2017) 19:18–25.
64. Mahdavi A, Attari R. Cardiometabolic responses to L-carnitine in obese women with knee osteoarthritis: a randomized, double-blind, placebo-controlled pilot study. Prog Nutr. (2018) 20:337–44. doi: 10.23751/pn.v20i1-S.6120
65. Malaguarnera M, Cammalleri L, Gargante MP, Vacante M, Colonna V, Motta M. L-Carnitine treatment reduces severity of physical and mental fatigue and increases cognitive functions in centenarians: a randomized and controlled clinical trial. Am J Clin Nutr. (2007) 86:1738–44. doi: 10.1093/ajcn/86.5.1738
66. Malaguarnera M, Vacante M, Motta M, Malaguarnera M, Volti GL, Galvano F. Effect of L-carnitine on the size of low-density lipoprotein particles in type 2 diabetes mellitus patients treated with simvastatin. Metabolism. (2009) 58:1618–23. doi: 10.1016/j.metabol.2009.05.014
67. Malaguarnera M, Vacante M, Avitabile T, Malaguarnera M, Cammalleri L, Motta M. L-Carnitine supplementation reduces oxidized LDL cholesterol in patients with diabetes. Am J Clin Nutr. (2009) 89:71–6. doi: 10.3945/ajcn.2008.26251
68. Malaguarnera M, Gargante MP, Russo C, Antic T, Vacante M, Malaguarnera M, et al. L-carnitine supplementation to diet: a new tool in treatment of nonalcoholic steatohepatitis—a randomized and controlled clinical trial. Off J Am Coll Gastroenterol. (2010) 105:1338–45. doi: 10.1038/ajg.2009.719
69. Mojtaba I, Maryam C, Davood K, Fatemeh K. The effect of chronic L-carnitine L-tartarate supplementation on glucose and lactate concentration and aerobic capacity. Proc Soc Behav Sci. (2009) 1:2692–5. doi: 10.1016/j.sbspro.2009.01.476
70. Molfino A, Cascino A, Conte C, Ramaccini C, Fanelli FR, Laviano A. Caloric restriction and L-carnitine administration improves insulin sensitivity in patients with impaired glucose metabolism. J Parent Enteral Nutr. (2010) 34:295–9. doi: 10.1177/0148607109353440
71. Parvanova A, Trillini M, Podestà MA, Iliev IP, Aparicio C, Perna A, et al. Blood pressure and metabolic effects of acetyl-L-carnitine in type 2 diabetes: DIABASI randomized controlled trial. J Endocr Soc. (2018) 2:420–36. doi: 10.1210/js.2017-00426
72. Samimi M, Jamilian M, Ebrahimi FA, Rahimi M, Tajbakhsh B, Asemi Z. Oral carnitine supplementation reduces body weight and insulin resistance in women with polycystic ovary syndrome: a randomized, double-blind, placebo-controlled trial. Clin Endocrinol. (2016) 84:851–7. doi: 10.1111/cen.13003
73. Rafraf M, Karimi M, Jafari A. Effect of l-carnitine supplementation in comparison with moderate aerobic training on insulin resistance and anthropometric indices in obese women. J Adv Med Biomed Res. (2012) 20:17–30.
74. Bloomer RJ, Tschume LC, Smith WA. Glycine propionyl-L-carnitine modulates lipid peroxidation and nitric oxide in human subjects. Int J Vitamin Nutr Res. (2009) 79:131–41. doi: 10.1024/0300-9831.79.3.131
75. Tauqir S, Israr M, Rauf B, Malik MO, Habib SH, Shah FA, et al. Acetyl-L-carnitine ameliorates metabolic and endocrine alterations in women with PCOS: a double-blind randomized clinical trial. Adv Ther. (2021) 38:3842–56. doi: 10.1007/s12325-021-01789-5
76. Wall BT, Stephens FB, Constantin-Teodosiu D, Marimuthu K, Macdonald IA, Greenhaff PL. Chronic oral ingestion of L-carnitine and carbohydrate increases muscle carnitine content and alters muscle fuel metabolism during exercise in humans. J Physiol. (2011) 589:963–73. doi: 10.1113/jphysiol.2010.201343
77. Santo SS, Sergio N, Giuseppe M, Margherita F, Gea OC, Roberto F, et al. Effect of PLC on functional parameters and oxidative profile in type 2 diabetes-associated PAD. Diabetes Res Clin Pract. (2006) 72:231–7. doi: 10.1016/j.diabres.2005.10.007
78. Ramezanpour M, Matboo M, Hejazi EM. The effect of four weeks aerobic training with using L-carnitine supplement on lipid profile and blood glucose in diabetic men. Med J Mashhad Univ Med Sci. (2015) 58:316–21.
79. Alavinejad P, Zakerkish M, Hajiani E, Hashemi SJ, Chobineh M, Moghaddam EK. Evaluation of L-carnitine efficacy in the treatment of non-alcoholic fatty liver disease among diabetic patients: a randomized double blind pilot study. J Gastroenterol Hepatol Res. (2016) 5:2191–5. doi: 10.17554/j.issn.2224-3992.2016.05.662
80. Odo S, Tanabe K, Yamauchi M. A pilot clinical trial on l-carnitine supplementation in combination with motivation training: effects on weight management in healthy volunteers. Food Nutr Sci. (2013) 4:222–31. doi: 10.4236/fns.2013.42030
81. Hu FB. Sedentary lifestyle and risk of obesity and type 2 diabetes. Lipids. (2003) 38:103–8. doi: 10.1007/s11745-003-1038-4
82. Lim MA, Pranata R. The danger of sedentary lifestyle in diabetic and obese people during the COVID-19 pandemic. Clin Med Insights Endocrinol Diabetes. (2020) 13:1179551420964487. doi: 10.1177/1179551420964487
83. Stranges S. Nutritional supplements and chronic disease: bridging the gap between myth and reality. Eur J Public Health. (2020) 30:ckaa165. 1408. doi: 10.1093/eurpub/ckaa165.1408
84. Fairfield KM, Fletcher RH. Vitamins for chronic disease prevention in adults: scientific review. JAMA. (2002) 287:3116–26. doi: 10.1001/jama.287.23.3116
85. Hadadinezhad S, Ghazaleh N, Razavi Z. Effects of l-carnitine on glycemic control and C-peptide levels in patients with type 2 diabetes mellitus. Turk Jem. (2008) 12:1–3.
86. Islam MS, Qaraqe MK, Belhaouari S, Petrovski G. Long Term HbA1c prediction using multi-stage CGM data analysis. IEEE Sensors J. (2021) 21:15237–47. doi: 10.1109/JSEN.2021.3073974
87. Wang D-D, Mao Y-Z, He S-M, Yang Y, Chen X. Quantitative efficacy of L-carnitine supplementation on glycemic control in type 2 diabetes mellitus patients. Expert Rev Clin Pharmacol. (2021) 14:919–26. doi: 10.1080/17512433.2021.1917381
88. Kispal G, Melegh B, Sandor A. Effect of insulin and glucagon on the uptake of carnitine by perfused rat liver. Biochim Biophys Acta Mol Cell Res. (1987) 929:226–8. doi: 10.1016/0167-4889(87)90180-7
89. Morino K, Petersen KF, Shulman GI. Molecular mechanisms of insulin resistance in humans and their potential links with mitochondrial dysfunction. Diabetes. (2006) 55:S9–15. doi: 10.2337/db06-S002
90. Savage DB, Petersen KF, Shulman GI. Disordered lipid metabolism and the pathogenesis of insulin resistance. Physiol Rev. (2007) 87:507–20. doi: 10.1152/physrev.00024.2006
91. Hue L, Taegtmeyer H. The Randle cycle revisited: a new head for an old hat. Am J Physiol Endocrinol Metab. (2009) 297:E578-E91. doi: 10.1152/ajpendo.00093.2009
92. Mingrone G, Greco AV, Capristo E, Benedetti G, Giancaterini A, Gaetano AD, et al. L-carnitine improves glucose disposal in type 2 diabetic patients. J Am Coll Nutr. (1999) 18:77–82. doi: 10.1080/07315724.1999.10718830
93. Zhang Z, Zhao M, Wang J, Ding Y, Dai X, Li Y. Effect of acetyl-L-carnitine on the insulin resistance of L6 cells induced by tumor necrosis factor-alpha. Wei Sheng Yan Jiu. (2010) 39:152–4.
94. Steiber A, Kerner J, Hoppel CL. Carnitine: a nutritional, biosynthetic, and functional perspective. Mol Aspects Med. (2004) 25:455–73. doi: 10.1016/j.mam.2004.06.006
95. Chaleshtori MH, Taheripanah R, Shakeri A. Clomiphene citrate (CC) plus L-Carnitine improves clinical pregnancy rate along with glycemic status and lipid profile in clomiphene-resistant polycystic ovary syndrome patients: a triple-blind randomized controlled clinical trial. Obesity Med. (2022) 100400. doi: 10.1016/j.obmed.2022.100400
96. Kajimoto Y, Kaneto H. Role of oxidative stress in pancreatic β-cell dysfunction. In: Mitochondrial Pathogenesis. New York, NY: Springer (2004). p. 168–76. doi: 10.1007/978-3-662-41088-2_17
97. Samulak JJ, Sawicka AK, Hartmane D, Grinberga S, Pugovics O, Lysiak-Szydlowska W, et al. L-carnitine supplementation increases trimethylamine-N-oxide but not markers of atherosclerosis in healthy aged women. Ann Nutr Metab. (2019) 74:11–7. doi: 10.1159/000495037
98. Rebouche CJ. Quantitative estimation of absorption and degradation of a carnitine supplement by human adults. Metabolism. (1991) 40:1305–10. doi: 10.1016/0026-0495(91)90033-S
99. Olek RA, Samulak JJ, Sawicka AK, Hartmane D, Grinberga S, Pugovics O, et al. Increased trimethylamine N-oxide is not associated with oxidative stress markers in healthy aged women. Oxid Med Cell Longev. (2019) 2019:6247169. doi: 10.1155/2019/6247169
100. Zhuang R, Ge X. Gut microbe-generated metabolite trimethylamine N-oxide and the risk of diabetes: a systematic review and dose-response meta-analysis. Obesity Rev. (2019) 20:883–94. doi: 10.1111/obr.12843
101. Maleki V, Jafari-Vayghan H, Kashani A, Moradi F, Vajdi M, Kheirouri S, et al. Potential roles of carnitine in patients with polycystic ovary syndrome: a systematic review. Gynecol Endocrinol. (2019) 35:463–9. doi: 10.1080/09513590.2019.1576616
102. Pooyandjoo M, Nouhi M, Shab-Bidar S, Djafarian K, Olyaeemanesh A. The effect of (L-) carnitine on weight loss in adults: a systematic review and meta-analysis of randomized controlled trials. Obesity Rev. (2016) 17:970–6. doi: 10.1111/obr.12436
103. Cha Y-S. Effects of L-carnitine on obesity, diabetes, and as an ergogenic aid. Asia Pac J Clin Nutr. (2008) 17(Suppl 1.):306–8.
104. Xu Y, Jiang W, Chen G, Zhu W, Ding W, Ge Z, et al. L-carnitine treatment of insulin resistance: A systematic review and meta-analysis. Adv Clin Exp Med. (2017) 26:333–8. doi: 10.17219/acem/61609
105. Wutzke KD, Lorenz H. The effect of l-carnitine on fat oxidation, protein turnover, and body composition in slightly overweight subjects. Metabolism. (2004) 53:1002–6. doi: 10.1016/j.metabol.2004.03.007
106. Bernard A, Rigault C, Mazue F, Borgne FL, Demarquoy J. L-carnitine supplementation and physical exercise restore age-associated decline in some mitochondrial functions in the rat. J Gerontol Ser A Biol Sci Med Sci. (2008) 63:1027–33. doi: 10.1093/gerona/63.10.1027
107. Adeva-Andany MM, Calvo-Castro I, Fernández-Fernández C, Donapetry-García C, Pedre-Piñeiro AM. Significance of l-carnitine for human health. IUBMB Life. (2017) 69:578–94. doi: 10.1002/iub.1646
108. Shipelin VA, Trusov NV, Apryatin SA, Shumakova AA, Timonin AN, Riger NA, et al. Comprehensive assessment of the effectiveness of l-carnitine and transresveratrol in rats with diet-induced obesity. Nutrition. (2022) 95:111561. doi: 10.1016/j.nut.2021.111561
Keywords: L-carnitine, glycemic markers, systematic review, meta-analysis, adult, diabetes mellitus type 2
Citation: Zamani M, Pahlavani N, Nikbaf-Shandiz M, Rasaei N, Ghaffarian-Ensaf R, Asbaghi O, Shiraseb F and Rastgoo S (2023) The effects of L-carnitine supplementation on glycemic markers in adults: A systematic review and dose-response meta-analysis. Front. Nutr. 9:1082097. doi: 10.3389/fnut.2022.1082097
Received: 27 October 2022; Accepted: 21 December 2022;
Published: 10 January 2023.
Edited by:
Sandro Massao Hirabara, Universidade Cruzeiro Do Sul, BrazilReviewed by:
Elisabetta Camajani, Sapienza University of Rome, ItalyRafael Lambertucci, Federal University of São Paulo, Brazil
Copyright © 2023 Zamani, Pahlavani, Nikbaf-Shandiz, Rasaei, Ghaffarian-Ensaf, Asbaghi, Shiraseb and Rastgoo. This is an open-access article distributed under the terms of the Creative Commons Attribution License (CC BY). The use, distribution or reproduction in other forums is permitted, provided the original author(s) and the copyright owner(s) are credited and that the original publication in this journal is cited, in accordance with accepted academic practice. No use, distribution or reproduction is permitted which does not comply with these terms.
*Correspondence: Farideh Shiraseb,  ZmFyaWRlaF9zaGlyYXNlYkB5YWhvby5jb20=; Samira Rastgoo, c2FtaXJhYS5yYXN0Z29vQGdtYWlsLmNvbQ==