 Yen-Chun Fan
 Chia-Chi Chou
 Bagas Suryo Bintoro
 Wen-Harn Pan
 Chyi-Huey Bai
- 1School of Public Health, College of Public Health, Taipei Medical University, Taipei, Taiwan
- 2Institute of Epidemiology and Preventive Medicine, National Taiwan University, Taipei, Taiwan
- 3School of Medicine, Chang Gung University, Taoyuan, Taiwan
- 4Department of Internal Medicine, Chang Gung Memorial Hospital, Keelung, Taiwan
- 5International Master/Ph.D. Program in Medicine, College of Medicine, Taipei Medical University, Taipei, Taiwan
- 6Department of Health Behavior, Environment, and Social Medicine, Faculty of Medicine, Public Health and Nursing, Universitas Gadjah Mada, Yogyakarta, Indonesia
- 7Center of Health Behavior and Promotion, Faculty of Medicine, Public Health and Nursing, Universitas Gadjah Mada, Yogyakarta, Indonesia
- 8Institute of Biomedical Sciences, Academia Sinica, Taipei, Taiwan
- 9Department of Public Health, College of Medicine, Taipei Medical University, Taipei, Taiwan
- 10Nutrition Research Center, Taipei Medical University Hospital, Taipei, Taiwan
Background: Previous studies have demonstrated that C-reactive protein (CRP) and glycated hemoglobin (HbA1c) levels are independently associated with neurodegenerative diseases, which can be improved by altering dietary patterns. This study investigates the combined effect of CRP and HbA1c, as well as the influence of dietary patterns, on the risk of dementia.
Methods: A cross-sectional study was conducted with 536 participants aged ≥65 years who were recruited from the Nutrition and Health Survey in Taiwan between 2014 and 2016. The high levels of inflammation and glycation were defined as a CRP level of >0.21 mg/dl and a HbA1c level of ≥6.50%, respectively. Mild cognitive impairment (MCI) was evaluated using the Mini-Mental State Examination (MMSE) score. The dietary patterns associated with CRP and HbA1c levels were assessed using the reduced rank regression (RRR). Multivariate logistic regression analysis of both complete and imputed datasets was performed.
Results: Participants with high levels of both CRP and HbA1c were associated with the highest odds ratio (OR) of MCI (adjusted OR [aOR] = 3.52; 95% CI = 3.48, 3.56; p < 0.001), followed by a high level of only HbA1c (aOR = 1.73; p < 0.001) and a high level of CRP (aOR = 1.49; p < 0.001). Using the reduced rank regression, an inverse relationship between higher consumption nuts and seeds and lower levels of CRP and HbA1c was found (both factors loading < −0.2). Concerning the combined effect of tertiles among the factor 1 and factor 2 analyzed by dietary patterns, group 1 with both T3 (high tertiles) was associated with the greatest OR of MCI (aOR = 4.38; 95% CI = 4.34, 4.42; p < 0.001) using multiple imputation.
Conclusions: The combined effect of high levels of inflammation and hyperglycemia was associated with an increased likelihood of MCI. Moreover, dietary patterns positively related to inflammation and hyperglycemia were associated with MCI, while eating nuts and seeds promoted better cognition.
Introduction
The incidence and prevalence of dementia and Alzheimer's disease (AD) have increased in recent years (1, 2), leading to critical socioeconomic burdens (3, 4) that will inevitably worsen in the future as the population ages (5, 6). Therefore, it is crucial to understand the potential factors affected by cognitive impairment.
Among cardiovascular risk factors, the main factor leading to the development of dementia is diabetes mellitus (DM) due to the pathophysiology of insulin resistance (IR) (7, 8). Glycated hemoglobin (HbA1c) might be treated as a surrogate marker or diagnostic criterion for the glycemic status that is related to IR in DM (9, 10), which still does not completely explain its presentation in DM (11, 12). In addition, uncontrolled inflammation may result in the progression of neurodegenerative diseases (NGDs) through damage to brain neurons; however, a well-controlled inflammatory status could slow the process (13). A strong positive correlation between high-sensitivity C-reactive protein (hs-CRP) levels and HbA1c levels was noted in patients with type 2 DM (14).
Exploring the enhanced effects of both inflammation and glycation on the development of mild cognitive impairment (MCI) might provide clinically relevant insights. Previous studies have shown that the combined effects of HbA1c and hs-CRP are associated with advanced subclinical carotid atherosclerosis progression (15), cardiovascular risks (16), and coronary artery diseases (17). However, no studies have examined the association between the combined effect of glycated status and inflammation on the risk of cognitive dysfunction. Furthermore, glycemic control due to dietary improvements was demonstrated to be beneficial for patients with type 2 DM (18). However, inconsistent relationships between inflammatory biomarkers and dietary patterns have been reported (19). Therefore, it would be helpful to identify particular dietary patterns that decrease the adverse impacts of inflammation and hyperglycemia.
Using a nationwide population-based survey, this study investigates the combined effect of glycemic metabolic disorders and inflammation, expressed as high levels of CRP and HbA1c, on MCI. To determine the dietary patterns related to inflammation and hyperglycemia, we attempted to explore dietary patterns related to higher CRP and HbA1c levels and to express the effects of dietary patterns and particular food groups on MCI.
Methods
Study Design and Subjects
A cross-sectional study was performed using the Nutrition and Health Survey in Taiwan (NAHSIT) between 2014 and 2016. A nationwide population-based survey is conducted on a regular yearly basis to explore the relationships between dietary nutritional patterns and MCI in non-institutionalized Taiwanese people. Demographic data regarding the sociodemographic characteristics, lifestyle factors, self-reported medical history, and dietary intake were obtained through face-to-face interviews conducted by well-trained personnel. Subsequently, the physical examination information included anthropometric data, and biochemical parameters were collected at a temporary health examination station. Detailed information regarding the characteristics of the participants and the research design of recruitment for the NAHSIT have been previously described (20, 21).
A total of 4,323 participants were recruited from NAHSIT between 2014 and 2016. Among them, 1,440 eligible older adults aged ≥65 years were included in the study. After excluding those without the Mini-Mental State Examination (MMSE) scores, the remaining 1,250 eligible older adults with MMSE data were obtained. Those with missing demographic data (N = 169) and biochemical indicators of CRP and HbA1c (N = 545) were also excluded. Finally, a total of 536 older adults aged 65 years and older were included in the final analysis. Additionally, those with missing data were then imputed to construct an analytical sample of 1,250 older participants. A flowchart of the participants' selection is presented in Figure 1. The Joint Institutional Review Board of Taipei Medical University reviewed and approved the study.
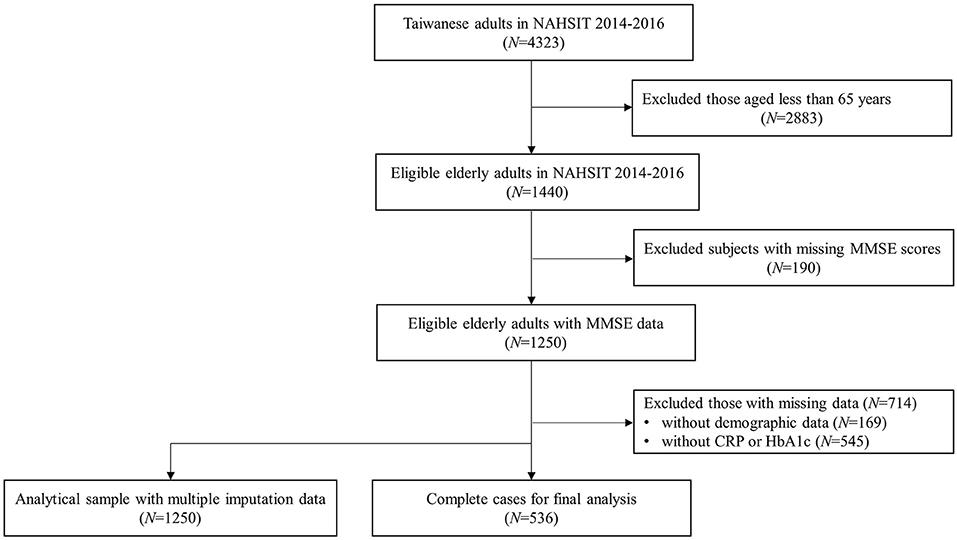
Figure 1. The flowchart of participants' selection.
Definition of High Levels of CRP and HbA1c
In NAHSIT 2014–2016, the biomarker of inflammation was only available for CRP but not for high-sensitivity C-reactive protein (hs-CRP). The biomarker of HbA1c was tested by high-performance liquid chromatography (HPLC); additionally, the particle-enhanced immunoturbidimetric test was used to detect the level of CRP. During the period between 2014 and 2016, 8-h fasting blood samples were obtained from the participants to measure the CRP and HbA1c concentrations.
High levels of inflammation and glycation were defined as a CRP level of >0.21 mg/dl (22) and a HbA1c level of ≥6.50% (23), respectively, in the final sample and in the analytical sample with multiple imputation. Therefore, the study sample was divided into three groups based on the status of CRP and HbA1c: participants with high levels of both inflammation and glycation (IG, N = 43), participants with high levels of either inflammation or glycation (EIG, N = 179), and participants with high levels of neither inflammation nor glycation (NN, N = 314). In addition, those with a high level of either inflammation or glycation were subsequently categorized into two groups: participants with high levels of inflammation but not glycation (IN, N = 86) and participants without high levels of inflammation but with glycation (NG, N = 93).
Dietary Assessment
The NAHSIT 2014–2016 contained a 79-item food-frequency questionnaire (FFQ) to investigate the dietary information. Detailed information has been previously published (24). This dietary food questionnaire was divided into 23 food groups, such as vegetables, fresh fruits, whole grains, rice, noodle and their products, breakfast cereals, roots and tubers, nuts and seeds, dairies, flavored milk, soybean products, eggs, fish, shellfish, seafood products, poultry, red meat, processed meat products, organ meats, fried foods, snacks, coffee, tea, and sweetened beverages. The reliability of a similar simplified FFQ has been validated in the Elderly Nutrient and Health Survey in Taiwan (25). Moreover, rice, noodles and their products, breakfast cereals, and roots and tubers are the common staple foods for most Taiwanese people and are treated as everyday habitual foods. To understand the relationships between particular eating behaviors associated with inflammation and glycation, expressed as CRP and HbA1c, respectively, on MCI, these three food groups were excluded from the analysis.
Study Outcome
In the NAHSIT 2014–2016, the cognitive function was evaluated using the MMSE score in the participants aged ≥65 years. The MMSE includes 30 questions with different perspectives of orientation to time and place, registration, recall, attention, calculation, language, and visuospatial function; the total MMSE score ranges from 0 to 30. Participants with a score ≤ 18 for illiterate individuals, participants with a score ≤ 21 for those with only an elementary education, and participants with a score of ≤ 25 for those with a middle school or higher education were defined as having MCI.
Statistical Analysis
Complete-case analyses were first conducted to investigate the combined effect of inflammation and glycation with MCI and its associated dietary patterns. Continuous variables are expressed as the mean and SD. Dichotomous variables are presented as numbers and percentages. The Kruskal–Wallis H and chi-square tests were performed to compare the differences in the distributions of sample characteristics between groups. Spearman's correlations among MMSE scores, CRP, and HbA1c were calculated. Moreover, the likelihood of MCI was examined using the logistic regression with odds ratios (ORs) and 95% CIs. In addition, a multivariate logistic regression was used to explore the relationships between a combination of CRP and HbA1c with MCI after adjusting for potential confounders that might cause a predisposition to cognitive decline, which included age, sex, systolic blood pressure (SBP), diastolic blood pressure (DBP), body mass index (BMI), smoking status, alcohol consumption, physical activity, stroke, depression, and sampling strata.
A reduced rank regression (RRR) can be used to derive the dietary patterns for food groups based on the dependent variables of interest in nutritional epidemiology (26). The aim of RRR was to identify the dietary patterns that explain as much response variation as possible by applying the PROC PLS procedure. Therefore, a RRR was performed to calculate two factors (CRP and HbA1C) with their factor loadings based on the predictors of 20 food groups and response variables of CRP and HbA1C. Therefore, the factor loadings for the two factors were separately divided into tertiles: high (T3), medium (T2), and low (T1). The combined effect based on the tertiles for the two factors was then classified into three groups: group 1 with both T3, group 2 with mixed type, and group 3 with both T1. In addition, multivariate logistic regressions were adjusted for the aforementioned associated factors and were conducted to explore the associations of dietary patterns based on the tertiles in combined groups with MCI as well as the specific food group with the two factor loadings >0.2 or < −0.2 and were shown in the same directions.
The imputed datasets to deal with missing values were used to assess the robustness of the study results from complete-case analyses. The fully conditional specification (FCS) multiple imputation techniques by PROC MI and PROC MIANALYZE procedures were performed to avoid the non-response bias with regard to the missing data in CRP, HbA1c, and associated confounders, and five imputations were created. All the statistical analyses were performed using the Statistical Analysis System software (SAS System for Windows, vs. 9.4; SAS Institute, Cary, NC, USA). The statistical significance was defined as p < 0.05.
Results
Combined Effect of CRP and HbA1c on MCI
In total, 536 participants with complete data were included in the final analysis. They were divided into four groups, IG group (43 subjects), IN group (86 subjects), NG group (93 subjects), and NN group (314 subjects), of which 93 dementia cases were identified.
There were significant differences in the distribution of demographic characteristics based on the status of combined high levels of CRP or HbA1c, except for SBP (p = 0.197), DBP (p = 0.192), sex (p = 0.460), smoking status (p = 0.603), alcohol consumption (p = 0.179), stroke (p = 0.905), and depression (p = 0.170). As shown in Table 1, the IG and IN groups were older (p = 0.012) and had lower proportions of variables of physical activity (p = 0.002). In addition, a negative correlation between HbA1c and MMSE scores was observed (rho = −0.098, p = 0.023), whereas CRP was not negatively correlated with cognitive scores (rho = −0.074, p = 0.086, Figure 2).
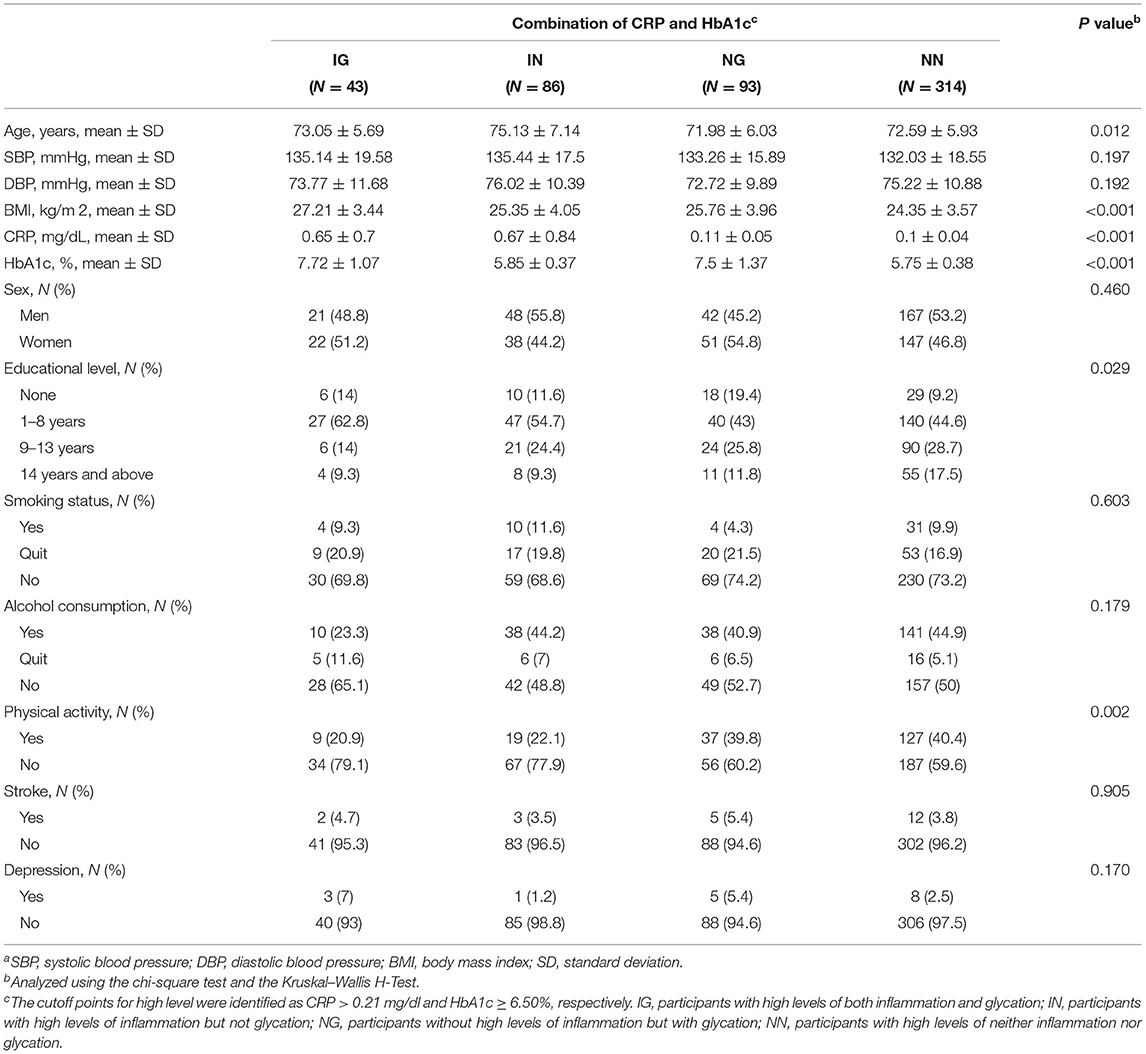
Table 1. The distributions of demographic characteristics according to a combination of C-reactive protein (CRP) and glycated hemoglobin (HbA1c)a.
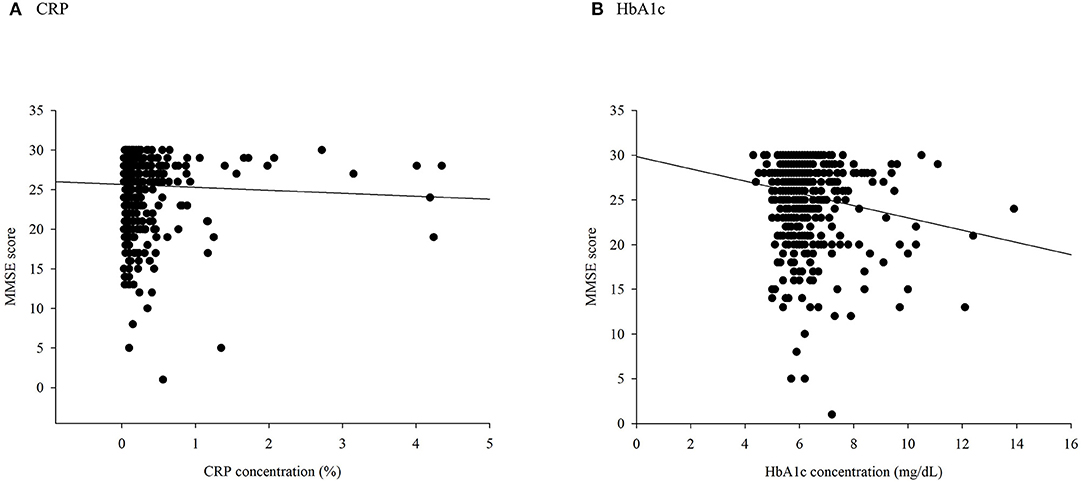
Figure 2. A scatter plot of Mini-Mental State Examination (MMSE) scores based on (A) C-reactive protein (CRP) and (B) glycated hemoglobin (HbA1c).
As presented in Table 2, the IG group (adjusted OR [aOR] = 3.51; 95% CI = 3.47, 3.55; p < 0.001) and the EIG group (aOR = 1.61; 95% CI = 1.60, 1.62; p < 0.001) were associated with higher odds of MCI than the NN group after controlling for age, sex, SBP, DBP, BMI, smoking status, alcohol consumption, physical activity, stroke, depression, and sampling strata in all cases. Moreover, when excluding the effects of the potential confounding factors in the multivariate logistic regression using multiple imputation, the findings of the effect of the IG group and EIG group on the odds of MCI remained largely unchanged (both p < 0.001).
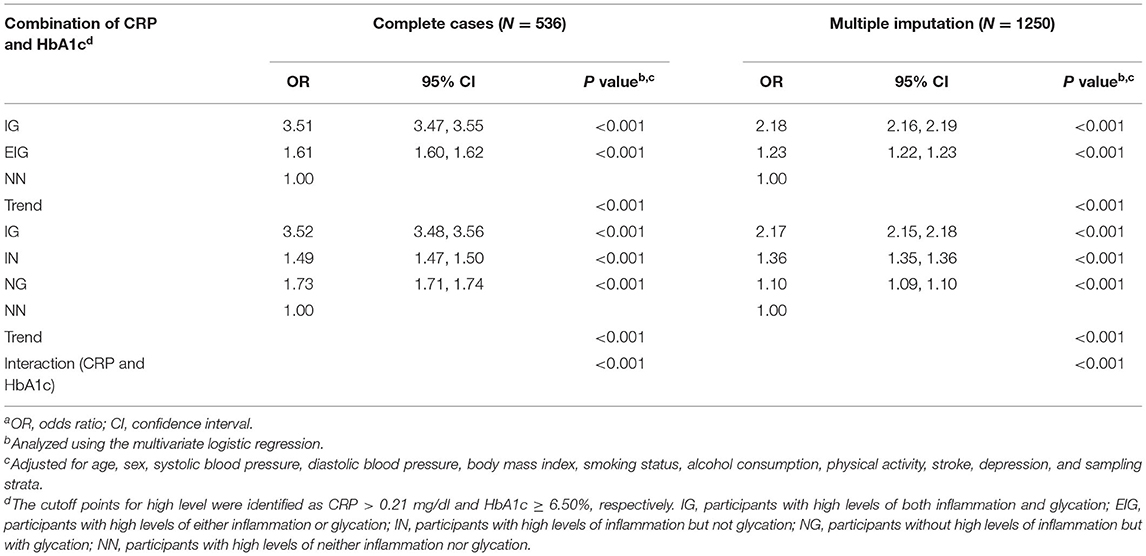
Table 2. Associations of the combined effect of CRP and HbA1c with mild cognitive impairment (MCI)a.
After the adjustment, the results showed that the highest odds of MCI were found in the IG group (aOR = 3.52; 95% CI = 3.48, 3.56; p < 0.001), followed by the NG group (aOR = 1.73; 95% CI = 1.71, 1.74; p < 0.001), and the IN group (aOR = 1.49; 95% CI = 1.47, 1.50; p < 0.001; Table 2) compared with the NN group from complete-case analysis. In addition, the IG group still showed a significant result with the highest OR by multiple imputation (p < 0.001).
Dietary Patterns and Mild Cognitive Dysfunction
In the NAHSIT 2014–2016, 536 participants were included in the reduced rank regression analysis. The dietary patterns explained 2.208 and 1.146% of the variation in the response variables of CRP and HbA1c in the factors 1 and 2, respectively. The factor loadings for food groups with a value of ≥0.2 and ≤ −0.2 are marked in boldface type (Table 3). The findings showed that the food groups for factor 1 were represented by fresh fruits, nuts and seeds, soybean products, processed meat products, and organ meats. In addition, the results showed that the composition of factor 2 greatly differed, with food groups described by vegetables, whole grains, nuts and seeds, flavored milk, soybean products, eggs, fish, poultry, organ meats, and tea. Moreover, the factor loadings of dietary patterns by multiple imputation reported similar findings. In general, in terms of the loadings of factor 1 and factor 2 using complete cases and multiple imputation, the food group of nuts and seeds was expressed in the same directions.
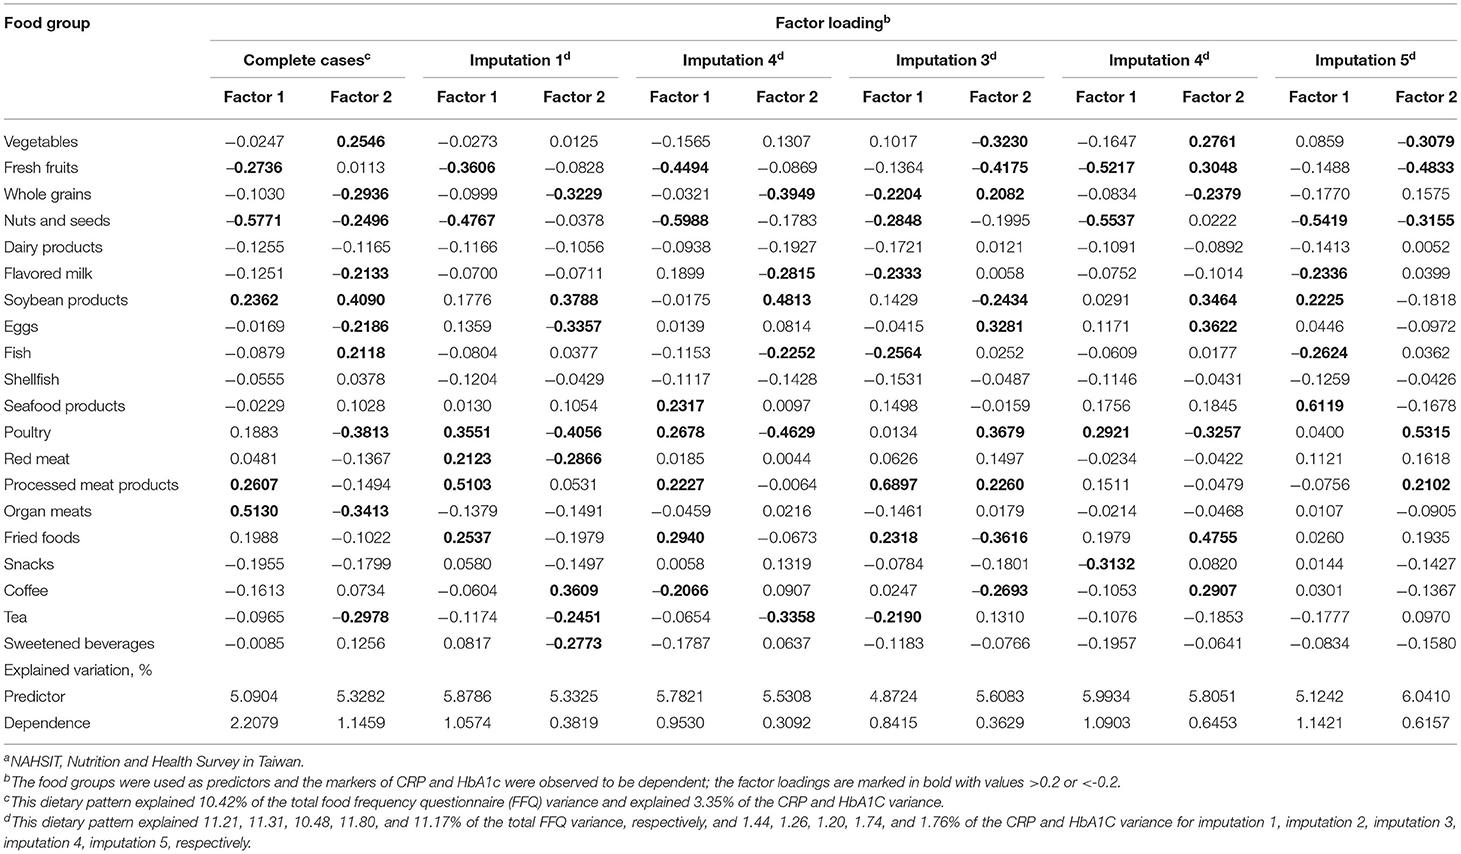
Table 3. Factor loadings for the combination of 20 food frequencies for explaining the effects of CRP and HbA1c, respectively, as derived by a reduced rank regression using the data source of the Nutrition and Health Survey in Taiwan (NAHSIT) 2014–2016a.
Table 4 presents the relationships of tertiles for both factor loadings and the combined effects of factor loadings of dietary patterns on MCI, both in complete cases and multiple imputation. After adjusting for age, sex, sampling strata, and associated confounders, the ORs for MCI were higher in T3 (aOR = 1.38; 95% CI = 1.37, 1.39; p < 0.001) and T2 (aOR = 2.13; 95% CI = 2.11, 2.15; p < 0.001) of the factor loadings in factor 1 compared with T1. Similar results were found for factor 2, which exhibited the highest OR for MCI in T2 with statistically significant trend tests (all p < 0.001). Concerning the combined effect of tertiles among factor 1 and factor 2, group 1 with both T3 was associated with increased OR for MCI (aOR = 1.49; 95% CI = 1.47, 1.51; p < 0.001), while the results of group 2 with a mixed type also presented a higher aOR of 1.64 (95% CI = 1.62, 1.65; p < 0.001), compared with group 3 with both at T1 after considering factors that might affect the relationship. Moreover, slightly different results from multiple imputation were obtained. The group 1 with both in T3 had the highest OR for MCI (aOR = 4.38; 95% CI = 4.34, 4.42; p < 0.001; Table 4).
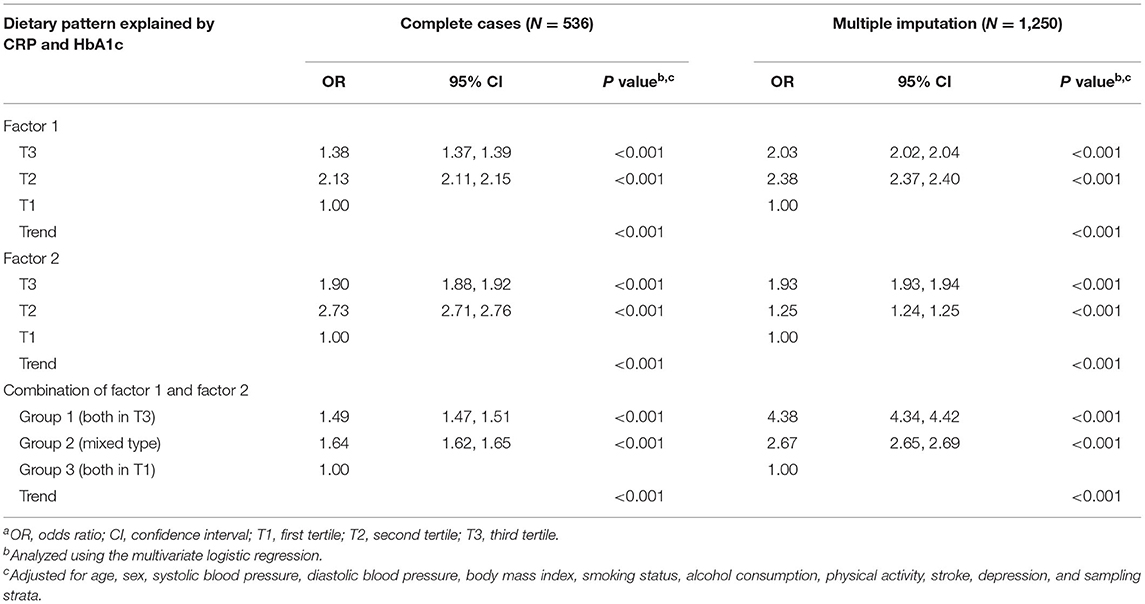
Table 4. Odds ratios and 95% CIs for mild cognitive impairment, by tertiles of the dietary pattern and the combined effecta.
Regarding single food groups, the results from the factor loadings presented the same pattern for both factors, but negative factor loadings for CRP and HbA1c were revealed for older adults who consumed higher frequencies than those of other food groups, such as nuts and seeds. Furthermore, significantly decreasing trends (all p < 0.001) and protective effect in the occurrence of MCI were observed with an increased intake frequency of nuts and seeds (four or more times per week: aOR = 0.27, p < 0.001; one to three times per week: aOR = 0.57, p < 0.001; Figure 3).
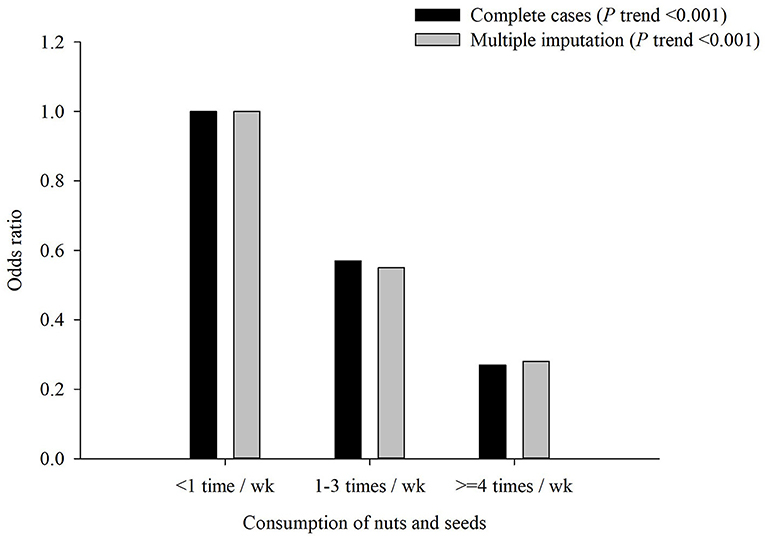
Figure 3. Adjusted odds ratio (aOR) of mild cognitive impairment (MCI) by consumption of nuts and seeds. Test for trend: p < 0.001.
Discussion
Using a nationwide population-based survey, our results demonstrated that the integration of high levels of inflammation, such as CRP, and hyperglycemia, such as HbA1c, showed higher odds of MCI. The dietary patterns related to inflammation and hyperglycemia were associated with MCI. Therefore, better cognitive performance should be a benefit due to an increased consumption of nuts and seeds.
To the best of our knowledge, this is the first study to explore the associations between a combination of inflammation and hyperglycemia and the related dietary patterns with cognitive dysfunction. Previous research only focused on the relationship between the combination of CRP and HbA1c with subsequent outcomes, such as carotid atherosclerosis progression (15), cardiovascular risk (16), severe coronary artery disease (17), and DM (27). Previous epidemiologic studies reported that hyperglycemia, diabetes status, and higher CRP levels were independently associated with the incidence of dementia (28, 29).
Inflammation, as assessed by hs-CRP, was demonstrated to reduce the cognitive function through an acute phase affecting tissue damage (30) by stimulating the deposition of amyloid β (31) or developing cerebral atherosclerosis that can harm the brain function (32). Hyperglycemia is associated with worse cognitive performance, resulting from insulin dysregulation (33), expression of insulin-degrading enzymes (34), and severe hypoglycemic events (35) that might damage the structure of the brain. Furthermore, increased CRP production in the liver might be related to abnormal glucose metabolism (36). Advanced cognitive decline possibly being affected by the combination of these two biomarkers might be a possible explanation.
A recent study of the NAHSIT 2014–2016 examined the dietary patterns related to cognitive function using a RRR (21). It should be noted that the classification of the dietary patterns was based on the MMSE score, not on the biomarkers of inflammation and glycation. Better MMSE scores were correlated with the dietary patterns of higher intake of some foods, such as fresh fruits, nuts and seeds, whole grains, seafood products, and fish. However, the influence of diet on glycemic disorders or inflammation has not been discussed, which might play an important role in the cognitive dysfunction. Moreover, the participants without CRP and HbA1c were excluded, resulting in a smaller sample size than the aforementioned study of the same survey years.
In our study, we alternatively used CRP and HbA1c as the response variables. Subsequently, the tertiles of factor scores related to HbA1c and CRP were treated as the predictors of MCI. Some foods have been reported to be related to hyperglycemia (37–39). Several studies have focused on an inflammatory diet (40), a cognitive diet (21), and a Mediterranean-type diet (41). However, no study has simultaneously discussed the diets corresponding to both CRP and HbA1c; additionally, our observations highlight the importance of nuts and seeds by considering a reduction in glycemic metabolism and inflammation. Furthermore, although the tertiles of T2 in factor 1 and factor 2 showed the highest risk in complete-case analyses, group 1 with both in T3 reached statistical significance with highest ORs when the findings were obtained by multiple imputation. A possible explanation for this result might be the small sample size.
Our study indicated that the consumption of more nuts and seeds decreased the odds of cognitive dysfunction. The higher intake of nuts and seeds were associated with reduced inflammatory levels, which might be explained by the inverse relationship of nut consumption with risks of metabolic syndrome, cardiovascular disease, and diabetes (42). Moreover, the dietary consumption of nuts has beneficial effects on inflammation and glucose control in patients with DM (43). An explanation of the mechanism for maintaining better cognitive performance might be folate (44), which can reduce the risk of dementia (45, 46).
Our study has several strengths. First, to the best of our knowledge, no previous studies have discussed the association between inflammation and hyperglycemia associated with MCI. Second, the correlation of the dietary patterns associated with CRP and HbA1c levels was assessed in this study. Therefore, the combination of CRP and HbA1c levels and dietary patterns on cognitive function was simultaneously addressed. Third, the data source of NAHSIT 2014–2016 was a community-based survey. Thus, this study provides high representativeness. Moreover, the robustness of our study was confirmed by using a much larger sample size when generalizing the findings compared with other analyses in Western countries (47, 48).
However, there are several limitations that should be discussed. First, the participants were obtained from community-based samples. Thus, the questionnaires in NAHSIT 2014–2016 might be subject to recall bias. Second, the patients with MCI were identified using MMSE scores in this population-based survey. The identification of MCI might have been underestimated because of the characteristics of the education level, in which literacy was used to define the cognitive decline. Third, causal inferences could not be examined in the relationship between dietary patterns and MCI as this was a cross-sectional study. Finally, there were several important biomarkers of inflammation and hyperglycemia that were not available in NAHSIT 2014–2016, such as inflammatory cytokines, leukocyte ratio, monocyte ratio, and 2-h post-load plasma glucose during the oral glucose tolerance test. Moreover, although fasting plasma glucose could be used in this community-based survey, the purpose of our study was to evaluate the association between long-term glycemic control over 2–3 months and current dietary patterns by using HbA1c as a biomarker of hyperglycemia.
In conclusion, the results of this nationwide population-based survey showed that the combined effect of high levels of inflammation and hyperglycemia was associated with increased odds of MCI, which was true for a high level of only CRP or a high level of only HbA1c. Furthermore, a positive relationship between the dietary patterns and inflammation and hyperglycemia with MCI was found in this cross-sectional study, while eating nuts and seeds was associated with better cognition.
Data Availability Statement
The data described in the article, code book, and analytic code will not be made available because the data source used in this study was managed by Health Promotion Administration. The researchers were required to submit an application to use the data for scientific purposes, and these data were not publicly accessed.
Ethics Statement
The studies involving human participants were reviewed and approved by The Joint Institutional Review Board of Taipei Medical University and Institutional Review Board on Biomedical Science Research, Academia Sinica, Taiwan. The patients/participants provided their written informed consent to participate in this study.
Author Contributions
Y-CF conceived the idea, performed the statistical analysis, and drafted the manuscript. C-CC, BB, and W-HP contributed to providing clinical knowledge and reviewing the manuscript. C-HB reviewed and revised the idea and study design, supported the grants, and helped to edit the manuscript. Y-CF and C-HB are the guarantors of this work to take responsibility for this study. All authors read and approved the final manuscript.
Funding
This work was funded by the Health Promotion Administration, Ministry of Health and Welfare (MOHW109-HPA-H-114-144702; D1060103) and the Ministry of Science and Technology of Taiwan (MOST-103-2314-B038-033-MY3).
Conflict of Interest
The authors declare that the research was conducted in the absence of any commercial or financial relationships that could be construed as a potential conflict of interest.
Publisher's Note
All claims expressed in this article are solely those of the authors and do not necessarily represent those of their affiliated organizations, or those of the publisher, the editors and the reviewers. Any product that may be evaluated in this article, or claim that may be made by its manufacturer, is not guaranteed or endorsed by the publisher.
Acknowledgments
The authors would like to thank the Health Promotion Administration, Ministry of Health and Welfare, Taiwan. The interpretation and conclusions of this research may not represent the opinion of the Health Promotion Administration, Ministry of Health and Welfare, Taiwan.
References
1. Wolters FJ, Chibnik LB, Waziry R, Anderson R, Berr C, Beiser A, et al. Twenty-seven-year time trends in dementia incidence in Europe and the United States: The Alzheimer Cohorts Consortium. Neurology. (2020) 95:e519–e31. doi: 10.1212/WNL.0000000000010022
2. Association As. 2020 Alzheimer's disease facts and figures. Alzheimer's & Dementia. (2020) doi: 10.1002/alz.12068 [Epub ahead of print].
3. Han EJ, Lee J, Cho E, Kim H. Socioeconomic costs of dementia based on utilization of health care and long-term-care services: a retrospective cohort study. Int J Environ Res Public Health. (2021) 18:376. doi: 10.3390/ijerph18020376
4. Zhu CW, Ornstein KA, Cosentino S, Gu Y, Andrews H, Stern Y. Medicaid Contributes Substantial Costs to Dementia Care in an Ethnically Diverse Community. J Gerontol B Psychol Sci Soc Sci. (2020) 75:1527–37. doi: 10.1093/geronb/gbz108
5. Li L, Du T, Hu Y. The effect of population aging on healthcare expenditure from a healthcare demand perspective among different age groups: evidence from Beijing City in the People's Republic of China. Risk Manag Healthc Policy. (2020) 13:1403–12. doi: 10.2147/RMHP.S271289
6. Chang AY, Skirbekk VF, Tyrovolas S, Kassebaum NJ, Dieleman JL. Measuring population ageing: an analysis of the Global Burden of Disease Study 2017. Lancet Public Health. (2019) 4:e159–e67. doi: 10.1016/S2468-2667(19)30019-2
7. Fan YC, Hsu JL, Tung HY, Chou CC, Bai CH. Increased dementia risk predominantly in diabetes mellitus rather than in hypertension or hyperlipidemia: a population-based cohort study. Alzheimers Res Ther. (2017) 9:7. doi: 10.1186/s13195-017-0236-z
8. Barbiellini Amidei C, Fayosse A, Dumurgier J, Machado-Fragua MD, Tabak AG, van Sloten T, et al. Association between age at diabetes onset and subsequent risk of dementia. JAMA. (2021) 325:1640–9. doi: 10.1001/jama.2021.4001
9. Lyons TJ, Basu A. Biomarkers in diabetes: hemoglobin A1c, vascular and tissue markers. Transl Res. (2012) 159:303–12. doi: 10.1016/j.trsl.2012.01.009
10. Saha S, Schwarz PE. Impact of glycated hemoglobin (HbA1c) on identifying insulin resistance among apparently healthy individuals. J Public Health. (2017) 25:505–12. doi: 10.1007/s10389-017-0805-4
11. Wright LA, Hirsch IB. Metrics beyond hemoglobin A1C in diabetes management: time in range, hypoglycemia, and other parameters. Diabetes Technol Ther. (2017) 19:S16–s26. doi: 10.1089/dia.2017.0029
12. Chehregosha H, Khamseh ME, Malek M, Hosseinpanah F, Ismail-Beigi F. A view beyond HbA1c: role of continuous glucose monitoring. Diabetes Ther. (2019) 10:853–63. doi: 10.1007/s13300-019-0619-1
13. Yang Q, Wang G, Zhang F. Role of peripheral immune cells-mediated inflammation on the process of neurodegenerative diseases. Front Immunol. (2020) 11:582825. doi: 10.3389/fimmu.2020.582825
14. Elimam H, Abdulla AM, Taha IM. Inflammatory markers and control of type 2 diabetes mellitus. Diabetes Metab Syndr. (2019) 13:800–4. doi: 10.1016/j.dsx.2018.11.061
15. Sander D, Schulze-Horn C, Bickel H, Gnahn H, Bartels E, Conrad B. Combined effects of hemoglobin A1c and C-reactive protein on the progression of subclinical carotid atherosclerosis: the INVADE study. Stroke. (2006) 37:351–7. doi: 10.1161/01.STR.0000199034.26345.bc
16. Schillinger M, Exner M, Amighi J, Mlekusch W, Sabeti S, Rumpold H, et al. Joint effects of C-reactive protein and glycated hemoglobin in predicting future cardiovascular events of patients with advanced atherosclerosis. Circulation. (2003) 108:2323–8. doi: 10.1161/01.CIR.0000095267.24234.00
17. Ahmed M, Islam MM, Rahman MA, Rubaiyat KA, Khuda CKE, Ferdous KAF, et al. Association of C-Reactive Protein and HbA1c in the Severity of Coronary Artery Disease in Patients with Ischemic Heart Disease. Cardiovasc J. (2018) 11:53–8. doi: 10.3329/cardio.v11i1.38243
18. Pan B, Wu Y, Yang Q, Ge L, Gao C, Xun Y, et al. The impact of major dietary patterns on glycemic control, cardiovascular risk factors, and weight loss in patients with type 2 diabetes: a network meta-analysis. J Evid Based Med. (2019) 12:29–39. doi: 10.1111/jebm.12312
19. Hart MJ, Torres SJ, McNaughton SA, Milte CM. Dietary patterns and associations with biomarkers of inflammation in adults: a systematic review of observational studies. Nutr J. (2021) 20:24. doi: 10.1186/s12937-021-00674-9
20. Tu SH, Chen C, Hsieh YT, Chang HY, Yeh CJ, Lin YC, et al. Design and sample characteristics of the 2005-2008 Nutrition and Health Survey in Taiwan. Asia Pac J Clin Nutr. (2011) 20:225–37.
21. Chuang SY, Lo YL, Wu SY, Wang PN, Pan WH. Dietary patterns and foods associated with cognitive function in taiwanese older adults: the cross-sectional and longitudinal studies. J Am Med Dir Assoc. (2019) 20:544–50.e4. doi: 10.1016/j.jamda.2018.10.017
22. Sin DD, Man SP. Why are patients with chronic obstructive pulmonary disease at increased risk of cardiovascular diseases? The potential role of systemic inflammation in chronic obstructive pulmonary disease. Circulation. (2003) 107:1514–9. doi: 10.1161/01.CIR.0000056767.69054.B3
23. Liu J, Ludwig T, Ebraheim NA. Effect of the blood HbA1c level on surgical treatment outcomes of diabetics with ankle fractures. Orthop Surg. (2013) 5:203–8. doi: 10.1111/os.12047
24. Lee MMs, Pan WH, Yu SL, Huang PC. Foods predictive of nutrient intake in Chinese diet in Taiwan: I. Total calories, protein, fat and fatty acids. Int J Epidemiol. (1992) 21:922–8. doi: 10.1093/ije/21.5.922
25. Huang YC, Lee MS, Pan WH, Wahlqvist ML. Validation of a simplified food frequency questionnaire as used in the Nutrition and Health Survey in Taiwan (NAHSIT) for the elderly. Asia Pac J Clin Nutr. (2011) 20:134–40.
26. Hoffmann K, Schulze MB, Schienkiewitz A, Nöthlings U, Boeing H. Application of a new statistical method to derive dietary patterns in nutritional epidemiology. Am J Epidemiol. (2004) 159:935–44. doi: 10.1093/aje/kwh134
27. Yan Y, Li S, Liu Y, Bazzano L, He J, Mi J, et al. Temporal relationship between inflammation and insulin resistance and their joint effect on hyperglycemia: the Bogalusa Heart Study. Cardiovasc Diabetol. (2019) 18:109. doi: 10.1186/s12933-019-0913-2
28. Rawlings AM, Sharrett AR, Albert MS, Coresh J, Windham BG, Power MC, et al. The association of late-life diabetes status and hyperglycemia with incident mild cognitive impairment and dementia: the ARIC study. Diabetes Care. (2019) 42:1248–54. doi: 10.2337/dc19-0120
29. Hsu PF, Pan WH, Yip BS, Chen RC, Cheng HM, Chuang SY. C-reactive protein predicts incidence of dementia in an elderly asian community cohort. J Am Med Dir Assoc. (2017) 18:277.e7–.e11. doi: 10.1016/j.jamda.2016.12.006
30. Yasojima K, Schwab C, McGeer EG, McGeer PL. Human neurons generate C-reactive protein and amyloid P: upregulation in Alzheimer's disease. Brain Res. (2000) 887:80–9. doi: 10.1016/S0006-8993(00)02970-X
31. Bi BT, Lin HB, Cheng YF, Zhou H, Lin T, Zhang MZ, Li TJ, et al. Promotion of beta-amyloid production by C-reactive protein and its implications in the early pathogenesis of Alzheimer's disease. Neurochem Int. (2012) 60:257–66. doi: 10.1016/j.neuint.2011.12.007
32. Libby P, Ridker PM. Inflammation and atherosclerosis: role of C-reactive protein in risk assessment. Am J Med. (2004) 116:9–16. doi: 10.1016/j.amjmed.2004.02.006
33. Craft S, Cholerton B, Baker LD. Insulin and Alzheimer's disease: untangling the web. J Alzheimers Dis. (2013) 33:S263–S75. doi: 10.3233/JAD-2012-129042
34. Mayeda ER, Whitmer RA, Yaffe K. Diabetes and cognition. Clin Geriatr Med. (2015) 31:101–15. doi: 10.1016/j.cger.2014.08.021
35. Whitmer RA, Karter AJ, Yaffe K, Quesenberry CP, Selby JV. Hypoglycemic episodes and risk of dementia in older patients with type 2 diabetes mellitus. JAMA. (2009) 301:1565–72. doi: 10.1001/jama.2009.460
36. Ahmadi-Abhari S, Kaptoge S, Luben RN, Wareham NJ, Khaw KT. Longitudinal association of C-reactive protein and Haemoglobin A 1c over 13 years: the European Prospective Investigation into Cancer-Norfolk study. Cardiovasc Diabetol. (2015) 14:61. doi: 10.1186/s12933-015-0224-1
37. Tatsumi Y, Morimoto A, Deura K, Mizuno S, Ohno Y, Watanabe S. Effects of soybean product intake on fasting and postload hyperglycemia and type 2 diabetes in Japanese men with high body mass index: the Saku Study. J Diabetes Investig. (2013) 4:626–33. doi: 10.1111/jdi.12100
38. Shi Z, Riley M, Taylor A, Noakes M. Meal-specific food patterns and the incidence of hyperglycemia in a Chinese adult population. Br J Nutr. (2017) 118:53–9. doi: 10.1017/S000711451700174X
39. Maghsoudi Z, Azadbakht L. How dietary patterns could have a role in prevention, progression, or management of diabetes mellitus? Review on the current evidence. J Res Med Sci. (2012) 17:694–709.
40. Ozawa M, Shipley M, Kivimaki M, Singh-Manoux A, Brunner EJ. Dietary pattern, inflammation and cognitive decline: the Whitehall II prospective cohort study. Clin Nutr. (2017) 36:506–12. doi: 10.1016/j.clnu.2016.01.013
41. Tangney CC, Kwasny MJ, Li H, Wilson RS, Evans DA, Morris MC. Adherence to a Mediterranean-type dietary pattern and cognitive decline in a community population–. Am J Clin Nutr. (2011) 93:601–7. doi: 10.3945/ajcn.110.007369
42. Jiang R, Jacobs Jr DR, Mayer-Davis E, Szklo M, Herrington D, Jenny NS, et al. Nut and seed consumption and inflammatory markers in the multi-ethnic study of atherosclerosis. Am J Epidemiol. (2006) 163:222–31. doi: 10.1093/aje/kwj033
43. Parham M, Heidari S, Khorramirad A, Hozoori M, Hosseinzadeh F, Bakhtyari L, et al. Effects of pistachio nut supplementation on blood glucose in patients with type 2 diabetes: a randomized crossover trial. Rev Diabet Stud. (2014) 11:190–6. doi: 10.1900/RDS.2014.11.190
45. Ma F, Wu T, Zhao J, Song A, Liu H, Xu W, et al. Folic acid supplementation improves cognitive function by reducing the levels of peripheral inflammatory cytokines in elderly Chinese subjects with MCI. Sci Rep. (2016) 6:37486. doi: 10.1038/srep37486
46. Jiang X, Huang J, Song D, Deng R, Wei J, Zhang Z. Increased consumption of fruit and vegetables is related to a reduced risk of cognitive impairment and dementia: meta-analysis. Front Aging Neurosci. (2017) 9:18. doi: 10.3389/fnagi.2017.00018
47. Wesselman LMP, van Lent DM, Schröder A, van de Rest O, Peters O, Menne F, et al. Dietary patterns are related to cognitive functioning in elderly enriched with individuals at increased risk for Alzheimer's disease. Eur J Nutr. (2021) 60:849–60. doi: 10.1007/s00394-020-02257-6
Keywords: joint effect, CRP, HbA1c, cognitive function, dietary pattern
Citation: Fan Y-C, Chou C-C, Bintoro BS, Pan W-H and Bai C-H (2022) Combined Effect of Inflammation and Hyperglycemia on Mild Cognitive Impairment and Associated Dietary Patterns in an Older Taiwanese Population. Front. Nutr. 9:791929. doi: 10.3389/fnut.2022.791929
Received: 09 October 2021; Accepted: 20 January 2022;
Published: 18 February 2022.
Edited by:
Marwan El Ghoch, Beirut Arab University, LebanonReviewed by:
Yinghua Yu, Xuzhou Medical University, ChinaMallikarjuna Korivi, Zhejiang Normal University, China
John Anthony Bauer, University of Kentucky, United States
Copyright © 2022 Fan, Chou, Bintoro, Pan and Bai. This is an open-access article distributed under the terms of the Creative Commons Attribution License (CC BY). The use, distribution or reproduction in other forums is permitted, provided the original author(s) and the copyright owner(s) are credited and that the original publication in this journal is cited, in accordance with accepted academic practice. No use, distribution or reproduction is permitted which does not comply with these terms.
*Correspondence: Chyi-Huey Bai, YmFpY2hAdG11LmVkdS50dw==