 Omid Asbaghi1,2
 Damoon Ashtary-larky3
 Kaveh Naseri4
 Saeede Saadati5Mohammad Zamani6Mahnaz Rezaei Kelishadi7Maryam Nadery8
 Saeid Doaei9*
 Neda Haghighat10*
- 1Cancer Research Center, Shahid Beheshti University of Medical Sciences, Tehran, Iran
- 2Student Research Committee, Shahid Beheshti University of Medical Sciences, Tehran, Iran
- 3Nutrition and Metabolic Diseases Research Center, Ahvaz Jundishapur University of Medical Sciences, Ahvaz, Iran
- 4Gastroenterology and Liver Diseases Research Center, Research Institute for Gastroenterology and Liver Diseases, Shahid Beheshti University of Medical Sciences, Tehran, Iran
- 5Department of Medicine, School of Clinical Sciences, Monash University, Melbourne, VIC, Australia
- 6Department of Clinical Nutrition, School of Nutritional sciences and Dietetics, Tehran University of Medical Sciences, Tehran, Iran
- 7Department of Community Nutrition, School of Nutrition and Food Science, Isfahan University of Medical Sciences, Isfahan, Iran
- 8Department of Dietetics and Nutrition, Robert Stempel College of Public Health & Social Work, Florida International University, Miami, FL, United States
- 9Reproductive Health Research Center, Department of Obstetrics and Gynecology, Al-Zahra Hospital, School of Medicine, Guilan University of Medical Sciences, Rasht, Iran
- 10Laparoscopy Research Center, Shiraz University of Medical Sciences, Shiraz, Iran
Background: The findings of trials investigating the effect of conjugated linoleic acid (CLA) administration on lipid profile are controversial. This meta-analysis of randomized controlled trials (RCTs) was performed to explore the effects of CLA supplementation on lipid profile.
Methods: Two authors independently searched electronic databases including PubMed, Web of Science, and Scopus until March 2022, in order to find relevant RCTs. The random effects model was used to evaluate the mean and standard deviation.
Results: In total, 56 RCTs with 73 effect sizes met the inclusion criteria and were eligible for the meta-analysis. CLA supplementation significantly alter triglycerides (TG) (WMD: 1.76; 95% CI: −1.65, 5.19), total cholesterols (TC) (WMD: 0.86; 95% CI: −0.42, 2.26), low-density lipoprotein cholesterols (LDL-C) (WMD: 0.49; 95% CI: −0.75, 2.74), apolipoprotein A (WMD: −3.15; 95% CI: −16.12, 9.81), and apolipoprotein B (WMD: −0.73; 95% CI: −9.87, 8.41) concentrations. However, CLA supplementation significantly increased the density lipoprotein cholesterol (HDL-C) (WMD: −0.40; 95% CI: −0.72, −0.07) concentrations.
Conclusion: CLA supplementation significantly improved HDL-C concentrations, however, increased concentrations of TG, TC, LDL-C, apolipoprotein A, and apolipoprotein B.
Systematic review registration: https://www.crd.york.ac.uk/prospero/#recordDetails, identifier: CRD42022331100.
Introduction
Dyslipidemia has been shown to be a major predictor of cardiovascular disease (CVD), atherosclerosis, and type 2 diabetes mellitus (T2DM) (1–3), characterized by either one or a combination of the elevated serum concentration of total cholesterol (TC), total triglyceride (TG), low-density lipoprotein cholesterol (LDL-C), and the reduced serum concentration of high-density lipoprotein cholesterol (HDL-C) (1, 4). An imbalance between LDL-C and HDL-C can lead to increasing the incidence rate of myocardial infarction (MI) and stroke (5). Additionally, as result of the accumulation of plaque within the arteries, atherosclerotic CVD can be raised when LDL-C level is higher than normal (5). However, HDL-C has a protective role against atherosclerotic CVD (6).
Hypercholesterolemia is the most prevalent form of dyslipidemia, being the 15th leading cause of death in 1990, growing to 11th in 2007 and 8th in 2019 (7). According to the latest reports, the prevalence of hypercholesterolemia among adults was as follows: in Europe (53.7%), America (47.7%), South East Asia (30.3%), and Africa (23.1%) (8). The worldwide burden of dyslipidemia has raised over the previous 30 years (7), accounting for more than 4 million deaths annually (4). Accordingly, CVD as one of the primary outcomes of dyslipidemia presents a tremendous economic burden on the healthcare system (9), and T2DM has also been demonstrated to raise health care costs (10).
The major risk factors related to the development of dyslipidemia are poor dietary habits and sedentary lifestyle, overweight and obesity (11, 12), and alcohol consumption and cigarette smoking (13, 14). Over the past few years, although dietary interventions have been carried out to control dyslipidemia, adherence to strict long-term dietary restrictions can be challenging. Thus, dietary supplements can be an efficient approach in addition to lifestyle interventions (15–19).
Conjugated linoleic acid (CLA) is a collective term that refers to a heterogeneous group of geometric isomers of linoleic acid; up to 28 isomer forms are detected, of them “c9,t11” and “t10,c12” are especially important (20). CLA is naturally found in the fat, milk, and meat of ruminant animals such as cow, sheep, and goat (20, 21). Accumulating studies have shown the effects of CLA on the management of lipid abnormalities related to CVD and T2DM (22). The underlying mechanisms of action of CLA are through lipid metabolism, modifying enzyme activity, and hormonal profile (23). CLA can increase lipolysis in adipocytes, diminish fatty acids synthesis, and reduce lipogenesis. Moreover, CLA can increase beta-oxidation of mitochondrial fatty acids and as a result decreases triacylglycerol synthesis (23–25).
Apolipoprotein A (Apo A) is considered as a major structural protein of high-density lipoprotein, and Apolipoprotein B (Apo B) is the primary protein constituted of low-density lipoprotein (26). Apo B is an independent risk predictor for the severity of coronary artery disease (CAD) (26). In a study on the effect of CLA supplementation on serum level of Apo A and Apo B, there were no changes in these factors in healthy female young individuals (27). A review and meta-analysis study, included 23 randomized controlled trial (RCT), showed that CLA supplements caused a significant reduction in LDL-C level (28). In line with this study, Santurino et al. demonstrated that the consumption of PUFA n-3 and CLA naturally enriched goat cheese on 68 overweight and obese subjects for 12 weeks significantly increase the HDL-C (29). However, in a double-blind, randomized, placebo-controlled trial on 401 overweight or obese participants investigating the effect of 6-month CLA supplementation (2.5 g/day c9, t11 CLA + 0.6 g/day c12 t10 CLA) on the clinical parameters related to atherosclerosis like plasma lipids, there were no significant effects of CLA on serum concentrations of TG, TC, LDL-C, and HDL-C (30). In another small trial, 2-month of 3 g/day mixed CLA supplementation on patients with coronary artery disease (CAD) had no effect on the plasma TG, LDL-C, or HDL-C (31). Also, Fouladi et al. showed that a 12-week CLA plus exercise intervention among overweight adults has no effects on serum concentration of TG and LDL-C (32). Thus, a large number of human trials have failed to demonstrate a protective effect of CLA against CVD risk factors focusing on lipid profile.
According to previous findings, the general impact of CLA on lipid profile is equivocal, thereby demonstrating the need for a comprehensive systematic review and meta-analysis of clinical trials on this topic. Therefore, given the unclear impact of CLA on plasma lipid concentration, the aim of the current meta-analysis was to investigate the effects of CLA on lipid profile in adults.
Methods and materials
This study was carried out according to Preferred Reporting Items for Systematic Reviews and Meta-Analyses (PRISMA) protocol for reporting systematic reviews and meta-analysis (33). And also, the research question of the systematic review is clearly defined in terms of populations (adults), interventions (CLA), comparators (control-group), outcomes (lipid profile), and study designs (RCTs) (PICOS).
Search strategy
We conducted a comprehensive literature search in the online databases of PubMed/MEDLINE, Scopus, Web of Science, and Cochrane library up to 22 March. We applied the following MeSH and non-MeSH terms in the search strategy:
(“Conjugated linoleic acid” OR “conjugated fatty acid” OR “bovic acid” OR “rumenic acid” OR “CLA”) AND (Intervention OR “Intervention Study” OR “Intervention Studies” OR “controlled trial” OR randomized OR randomized OR random OR randomly OR placebo OR “clinical trial” OR Trial OR “randomized controlled trial” OR “randomized clinical trial” OR RCT OR blinded OR “double blind” OR “double blinded” OR trial OR “clinical trial” OR trials OR “Pragmatic Clinical Trial” OR “Cross-Over Studies” OR “Cross-Over” OR “Cross-Over Study” OR parallel OR “parallel study” OR “parallel trial”).
There were no restrictions on time and language of publications. Additionally, to prevent missing any publications, all the references of the related papers were checked. All searched studies were included in the Endnote software for screening; consequently, duplicate citations and unpublished manuscripts were removed.
Inclusion criteria and exclusion criteria
The inclusion criteria for the current study were: (1) randomized controlled clinical trials, (2) studies on adult population (age >18 y), (3) studies that administered CLA in different forms including “c9, t11” and “t10,c12” isomers supplement and food enriched CLA, (4) RCTs with at least 1 week's duration of trial, and (5) controlled trials that reported mean changes and their standard deviations (SDs) of lipid profile throughout the trial for both intervention and control groups or presented required information for calculation of those effect sizes. If there was more than 1 published article for one dataset, the more complete set was included. Clinical trials with an extra intervention group were considered as 2 separate studies. The exclusion criteria in the current meta-analysis were experimental studies, those with a cohort, cross-sectional, and case–control design, review articles, and ecological studies. Also, trials without a placebo or control group and those which were not randomized, and/or performed on children and adolescents, were excluded.
Data extraction
Two independent reviewers (MR and DA) completed data extraction from each qualified RCTs. Extracted data contain the name of the first author; publication year; location of the study; study design; sample size in each group; individuals' characteristics such as mean age, sex, and BMI; the CLA dose used for intervention; duration of intervention; mean changes; and SDs of lipid profile markers throughout the trial for both intervention and control groups, and the confounding variables adjusted in the analysis. If data were reported in different units, we converted them to the most frequently used unit.
Quality assessment
The quality of qualified studies was measured by two independent researchers (OA and DA) by using the Cochrane Collaboration modified risk of bias tool, in which the risk of bias in RCTs is assessed in seven domains, including random sequence generation, allocation concealment, reporting bias, performance bias, detection bias, attrition bias, and other sources of bias (34). As a result, terms as “Low,” “High,” or “Unclear” were used to evaluate each domain (Table 1).
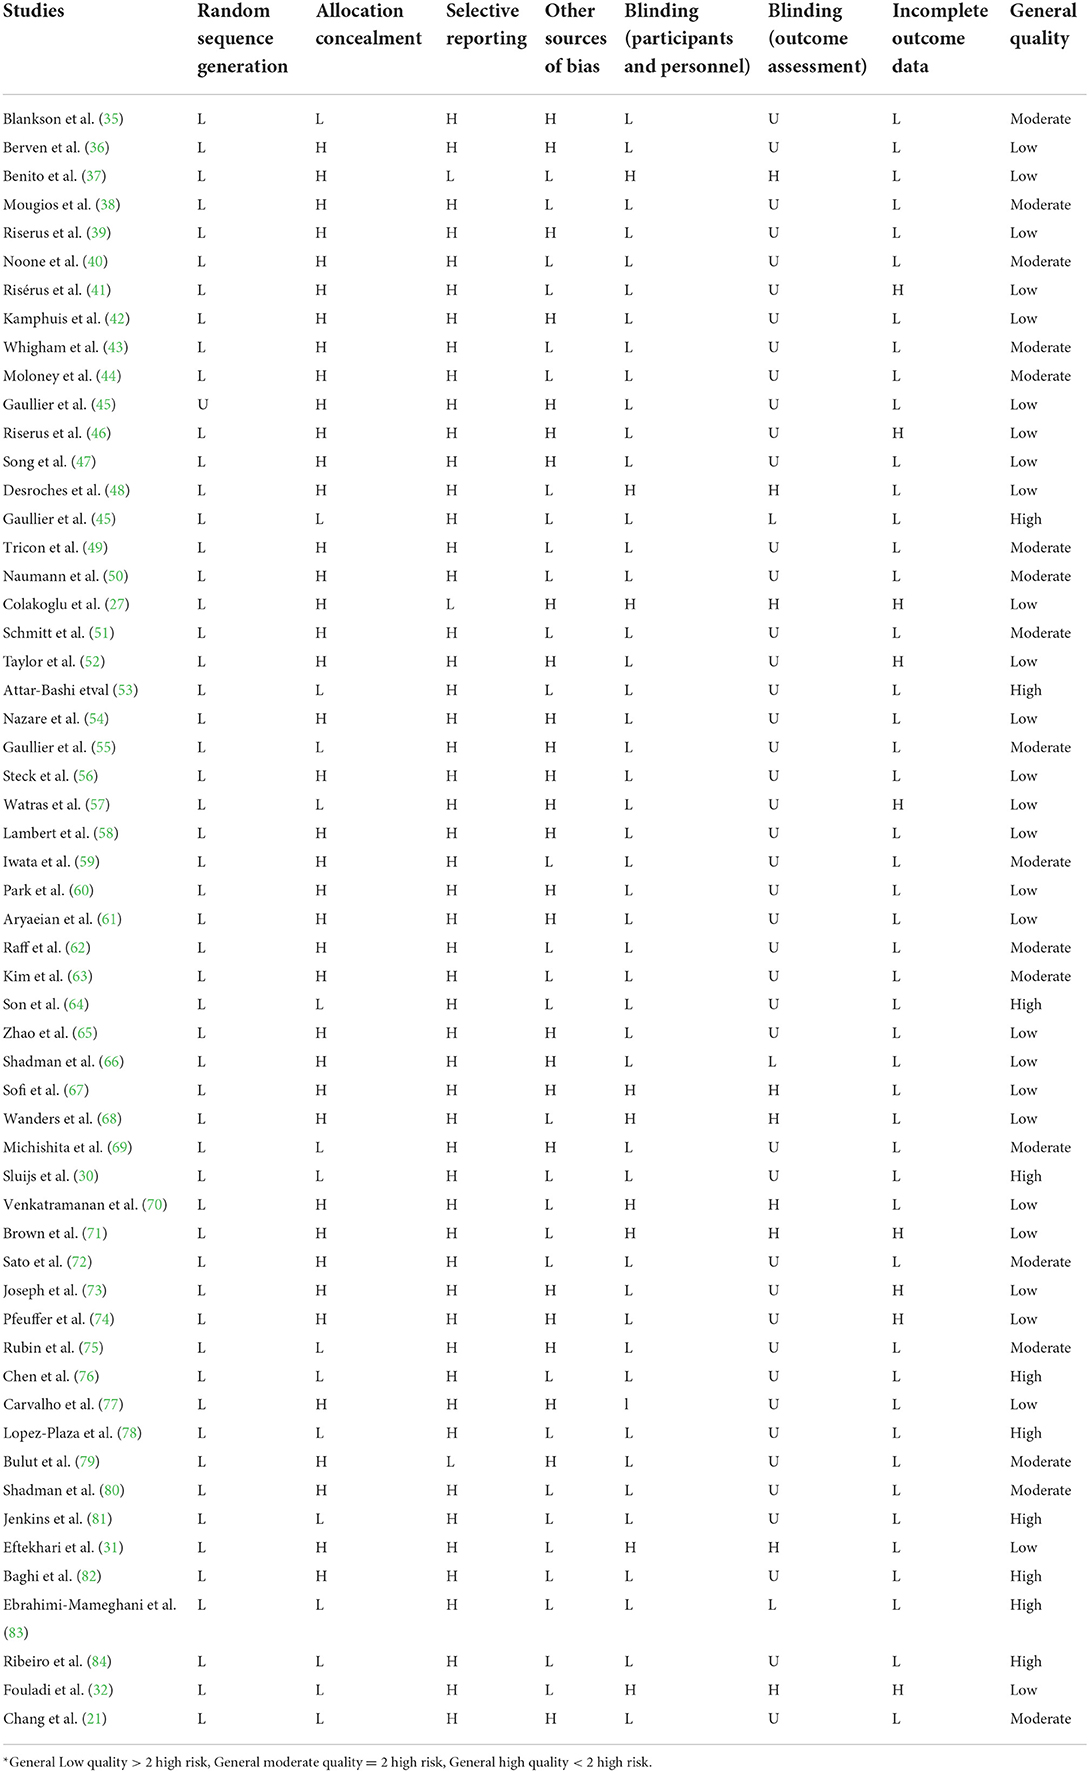
Table 1. Risk of bias assessment.
Statistical analysis
For obtaining the overall effect sizes, mean changes and their SDs of each variable in the CLA and control groups were applied. In case mean changes were not reported, we calculated them by considering changes in each outcome's values during the intervention. We also converted standard errors (SEs), 95% confidence intervals (CIs), and interquartile ranges (IQRs) to SDs using the method of Hozo et al. (85) to acquire the overall effect sizes, we used a random-effects model that takes between-study variations into account. Heterogeneity was determined by the I2 statistic and Cochrane's Q test. I2 value >50% or p <0.05 for the Q-test was characterized as significant between-study heterogeneity (86, 87). Subgroup analyses were carried out to find probable sources of heterogeneity based on the predefined variables including duration of intervention (≥12 vs. <12 weeks), intervention dose (≥3 vs. <3 g/day), participants' health condition (healthy and unhealthy), baseline serum levels of TG (≥150 vs. <150 mg/dl), TC (≥200 vs. <200 mg/dl), LDL-C (≥100 vs. <100 mg/dl), and HDL-C (≥50 vs. <50 mg/dl), and baseline levels of BMI (normal, overweight, and obese). To determine the non-linear effects of CLA dosage (g/day) on each variable concentration, fractional polynomial modeling was used. Sensitivity analysis was applied to detect the dependency of the overall effect size on a specific study. The possibility of publication bias was investigated by Egger's regression test and the formal test of Begg. The meta-analysis was conducted by the use of the STATA® version 14.0 (StataCorp., College Station, Lakeway, TX, USA). P-value <0.05 was considered as significant level.
Certainty assessment
The overall certainty of evidence across the studies was graded based on the guidelines of the GRADE (Grading of Recommendations Assessment, Development, and Evaluation) Working Group. The quality of evidence was classified into four categories, according to the corresponding evaluation criteria: high, moderate, low, and very low (88).
Results
Study selection
We found a total of 632 studies from our initial search in databases. After duplicate publications removal, 327 records remained, out of which 253 articles were identified as unrelated when screening based on title and abstract. Next, 74 suitable articles were candidate for full-text assessment. Out of these, 11 records due to not-reported lipid profile components, 4 records for not having control group, and 3 co-supplementation records were excluded. Finally, 56 eligible RCTs were included in our systematic review and meta-analysis. Figure 1 illustrates a summary of the study selection.
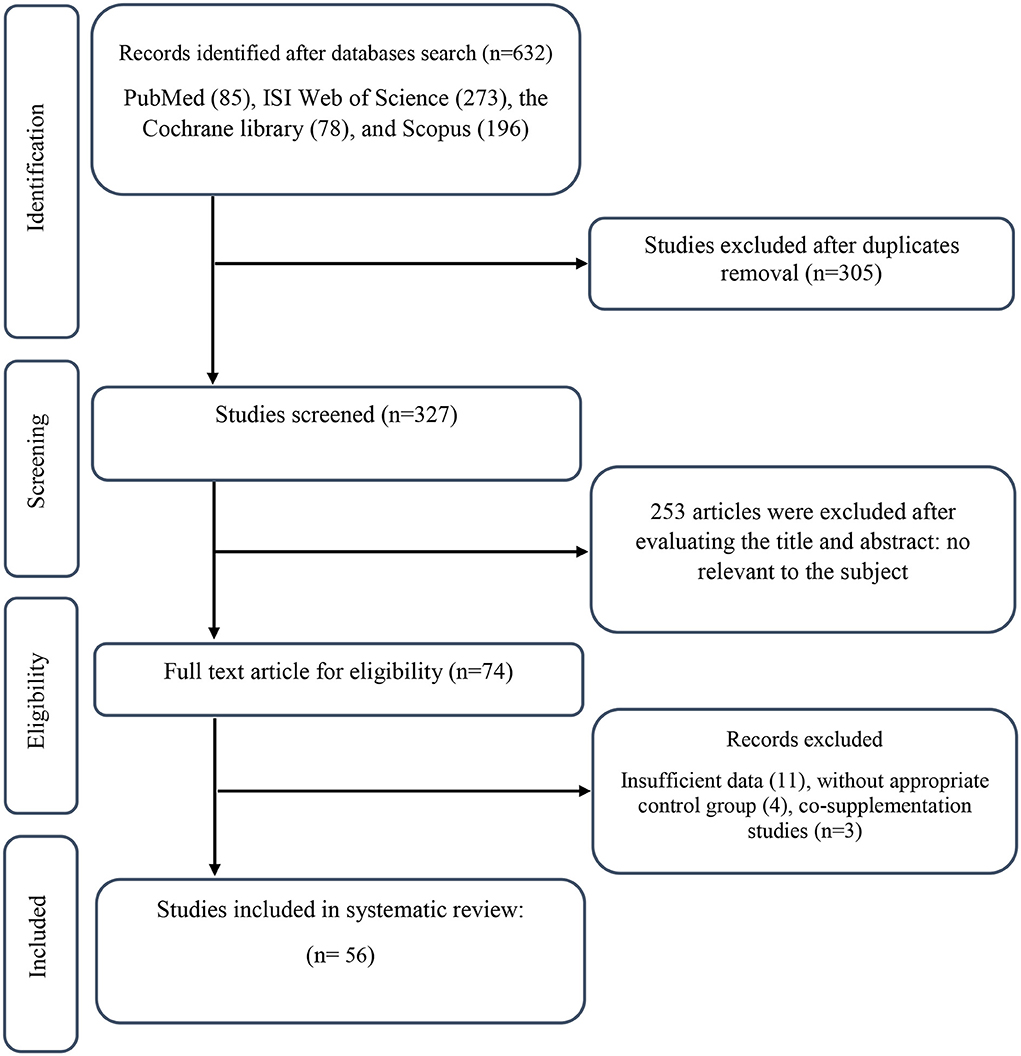
Figure 1. PRISMA flow diagram.
Characteristics of the included studies
The characteristics of 56 RCTs included in the current systematic review and meta-analysis are shown in Table 2. In total, 73 effect sizes were extracted from 56 RCTs, including a total of 3,262 participants (1,773 participants in the CLA group and 1,738 ones in the placebo group). These RCTs were published between 2000 and 2020, from Asia (n = 18) (21, 27, 31, 32, 59–61, 63–66, 69, 72, 76, 79, 80, 82, 83), Europe (n = 26) (30, 35, 36, 38–42, 44–47, 49–52, 54–56, 62, 67, 68, 74, 75, 78, 89), America (n = 10) (37, 43, 48, 57, 70, 71, 73, 77, 81, 84), Africa (n = 1) (58), and Oceania (n = 1) (53). All RCTs enrolled both genders except 13 studies that were conducted exclusively on male (39, 41, 46, 48, 49, 59, 62, 73–75, 79, 81, 82) and 7 studies were performed on female (27, 37, 63, 64, 71, 77, 84). The mean age of individuals was between 18 and 68 years old with BMI range of 19–35.27 kg/m2. The dosage of CLA varied from 1.17 to 28.9 g/day and duration of intervention differed from 2 to 104 weeks across included RCTs. These studies were conducted in T2DM (44, 51, 66, 80), hypertension (65), metabolic syndrome (41, 77), hyperlipidemia (70, 73), rheumatoid arthritis (61), atherosclerosis (31), and others in healthy individuals. All studies employed a parallel design except 7 studies that applied cross-over design (48, 49, 67, 68, 70, 73, 75).
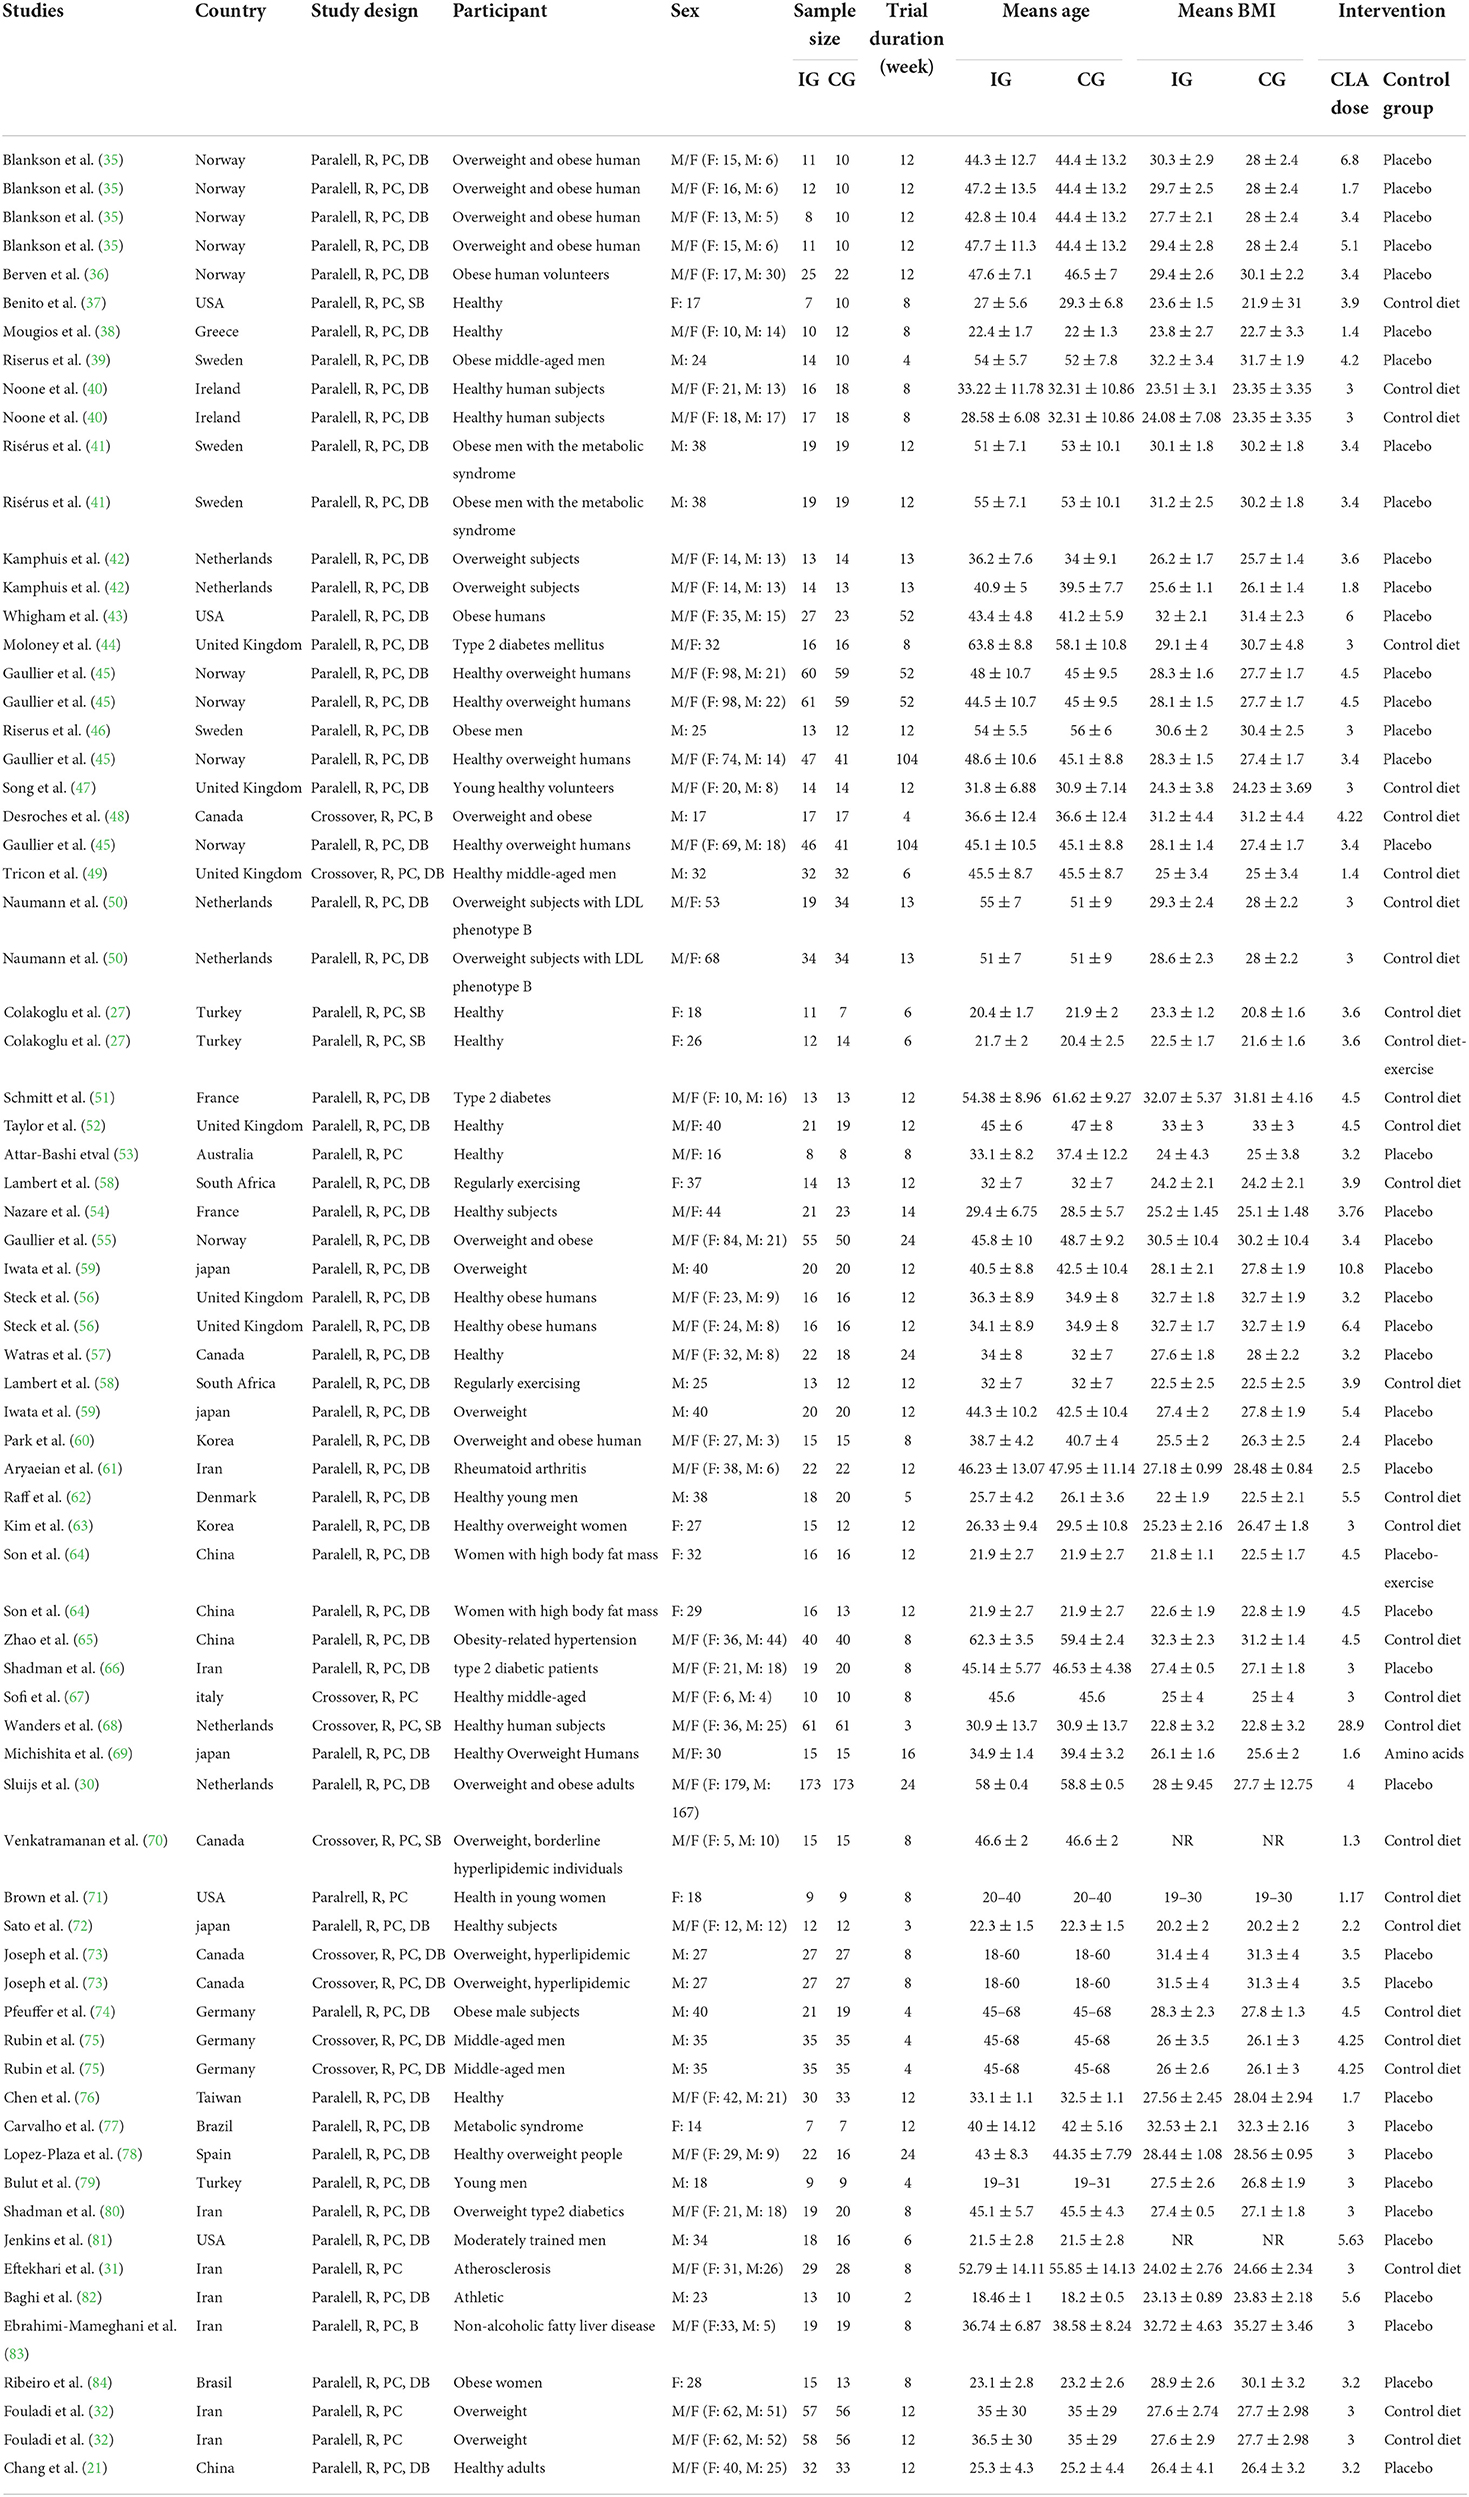
Table 2. Characteristics of the included studies.
Meta-analysis results
Effects of CLA supplementation on TG concentration
Overall, 73 effect sizes with a total sample size of 3,511 participants (1,773 cases and 1,738 control subjects) were included in the analysis. After combining effect sizes, we found that there was no significant effect of CLA supplementation on TG levels (WMD: 1.76, 95% CI: −1.65, 5.19 mg/dL, p = 0.312) (Figure 2A). However, there was a high between-study heterogeneity (I2: 99.8%, p < 0.001). To detect the sources of between-study heterogeneity, we performed subgroup analyses according to baseline levels of TG (≥150 vs. <150 mg/dL), length of intervention (≥8 vs. <8 weeks), health status of participants (healthy, unhealthy), supplementation dose (≥3 vs. <3 g/day), and baseline BMI (normal, overweight, and obese) (Table 3). Subgroup analysis showed that CLA supplementation did not significantly reduce TG concentrations across none of the subgroups.
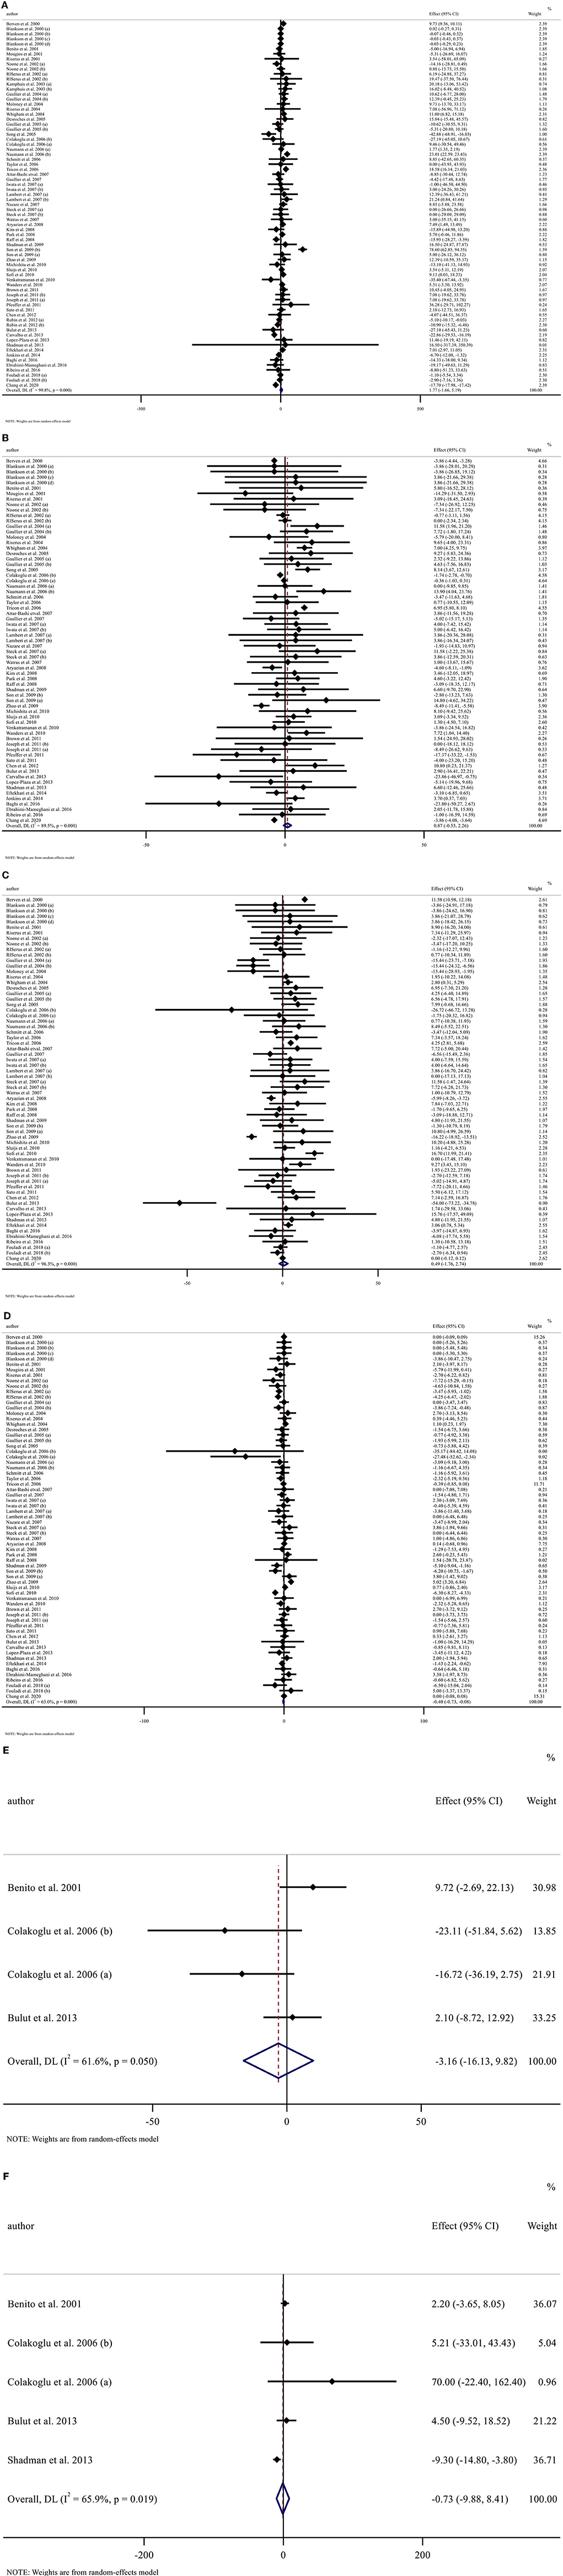
Figure 2. Forest plot presenting mean difference (MD) and 95% confidence intervals for the impact of CLA supplementation on (A) TG (mg/dl), (B) TC (mg/dl), (C) LDL-C (mg/dl), (D) HDL-C (mg/dl), (E) Apo A (mg/dl), and (F) Apo B (mg/dl).
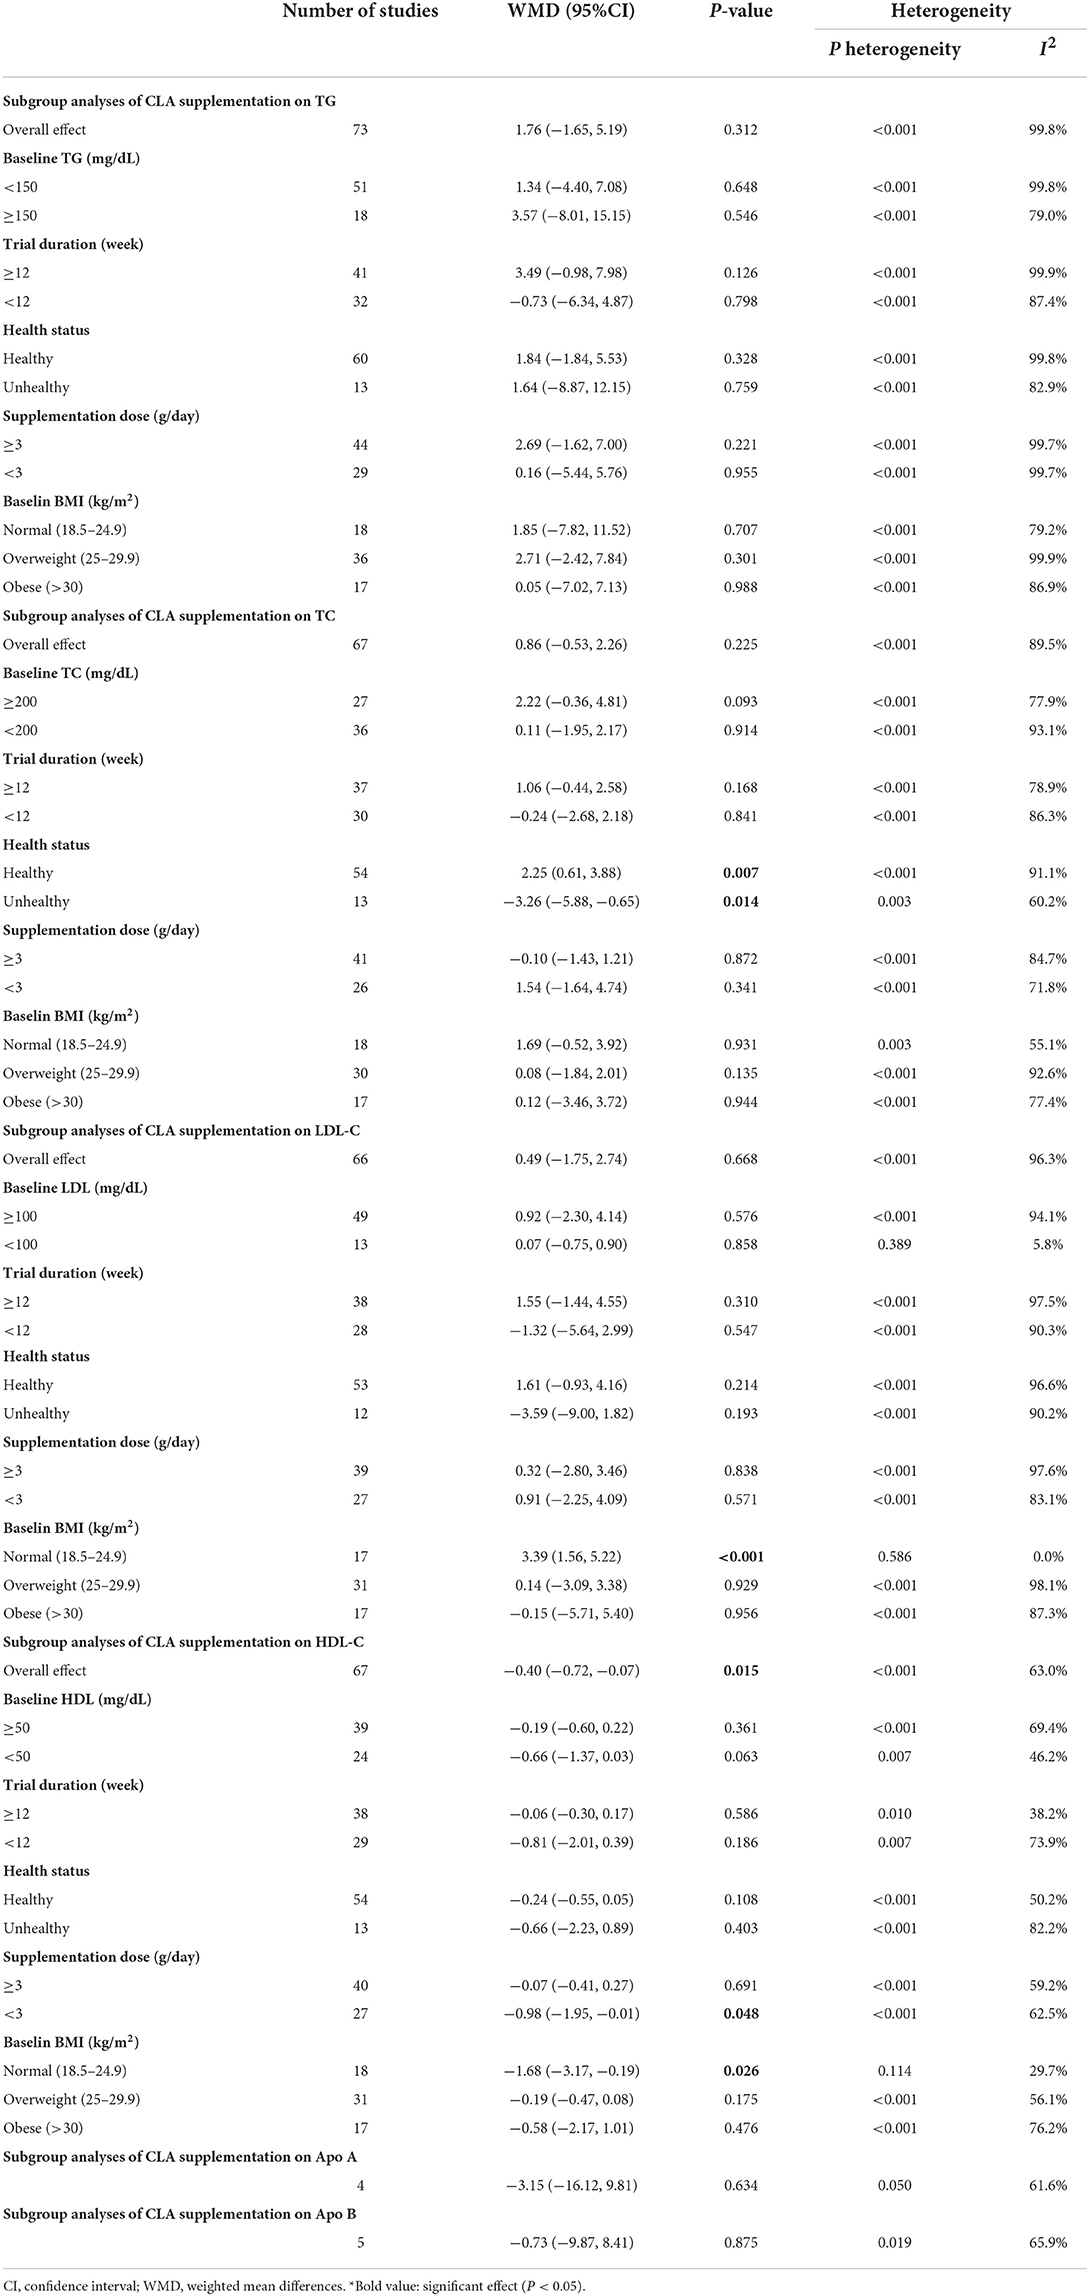
Table 3. Subgroup analyses of CLA supplementation on lipid profile in adults.
Effects of CLA supplementation on TC concentration
Sixty-seven arms of RCTs (1,561 cases and 1,529 control subjects) reported the effects of CLA supplementation on TC levels, and combining effect sizes from these studies showed a non-significant effect of CLA intake on TC concentrations (WMD: 0.86, 95% CI: −0.53, 2.26 mg/dL, p = 0.225), with a considerable between-study heterogeneity (I2: 89.5%, p < 0.001) (Figure 2B). To find the probable source of heterogeneity, subgroup analysis was applied. All of the abovementioned subgroup analysis indicated that health status subgroups could explain study heterogeneity (Table 3).
Effects of CLA supplementation on LDL-C concentration
Considering 66 effect sizes that included 3,217 participants (1,627 cases and 1,590 control subjects), no significant effect of CLA supplementation on serum concentrations of LDL-C was found (WMD: 0.49, 95% CI: −1.75, 2.74 mg/dL, p = 0.668). However, there was a considerable between-study heterogeneity (I2: 96.3%, p < 0.001) (Figure 2C). Subgroup analysis also revealed that CLA supplementation significantly increased serum LDL-C level across the individuals with normal BMI (p < 0.001) (Table 3).
Effects of CLA supplementation on HDL-C concentration
Totally, 67 effect sizes with a sample size of 3,283 participants (1,658 cases and 1,625 control subjects) were included in the analysis. Combining these effect sizes, a significant reduction was seen in serum concentrations of HDL-C following CLA supplementation (WMD: −0.40, 95% CI: −0.72, −0.07 mg/dL, p = 0.015) (Figure 2D). There was evidence of moderate between-study heterogeneity (I2: 63%, p < 0.001). In the subgroup analysis, we found that the effect of CLA supplementation on serum HDL-C concentrations strengthened in studies performed on individuals with normal BMI and when the supplementation dose of CLA is <3 g/day (Table 3).
Effects of CLA supplementation on Apo A
Four effect sizes including 79 participants (39 cases and 40 control subjects) provided information on Apo A as an outcome measure. Pooled results showed that CLA intake did not significantly affect Apo A (WMD: −3.15, 95% CI: −16.12, 9.81, p = 0.634) (Figure 2E), with a moderate heterogeneity among studies (I2: 61.6%, p = 0.050) (Table 3).
Effects of CLA supplementation on Apo B
Five effect sizes including a total of 118 participants (58 cases and 60 control subjects) indicated the effects of CLA intake on Apo B. CLA supplementation did not significantly decrease Apo B (WMD: −0.73, 95% CI: −9.87, 8.41, p = 0.875), without significant heterogeneity between studies (I2: 65.9%, p = 0.019) (Figure 2F and Table 3).
Publication bias
Publication bias assessment was performed based on visual inspection of funnel plot, Begg's and Egger's linear regression test. Results revealed no publication bias for TG (p = 0.646), LDL-C (p = 0.578), Apo A (p = 0.148), and Apo B (p = 0.340) based on Egger's test. However, there was publication bias for TC (p = 0.001, Begg's test) (p = 0.002, Egger's test). Furthermore, there was no evidence of a substantial publication bias for HDL-C (p = 0.858) based on Begg's test (Figure 3).
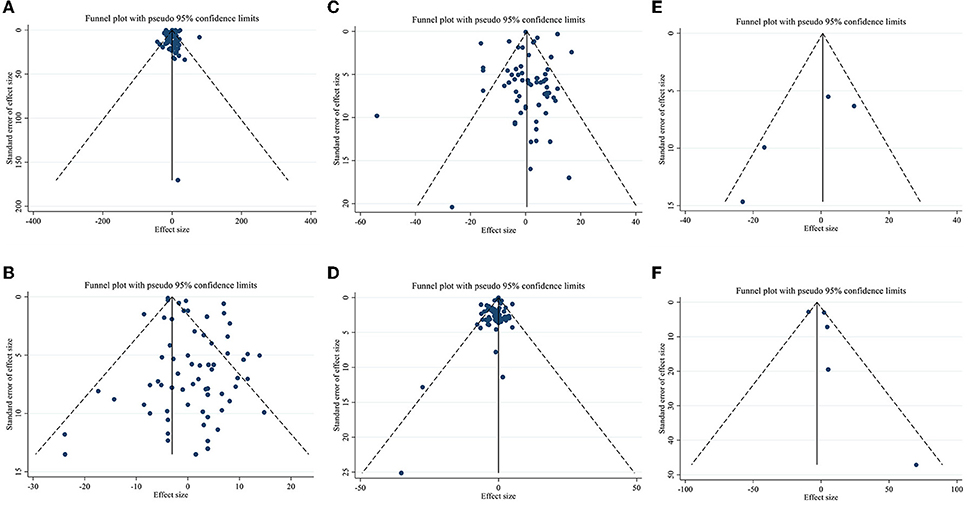
Figure 3. Funnel plots for (A) TG (mg/dl), (B) TC (mg/dl), (C) LDL-C (mg/dl), (D) HDL-C (mg/dl), (E) Apo A (mg/dl), and (F) Apo B (mg/dl).
Linear and non-linear dose-responses between dose and duration of CLA supplementation and lipid profile components
Meta-regression using the random-effects model was undertaken to investigate the potential association between a change in lipid profile and dose of CLA (g/day) and duration of intervention. Meta-regression analysis indicated that there was not a linear association between absolute changes in all the factors and duration and dose (Figures 4, 5).
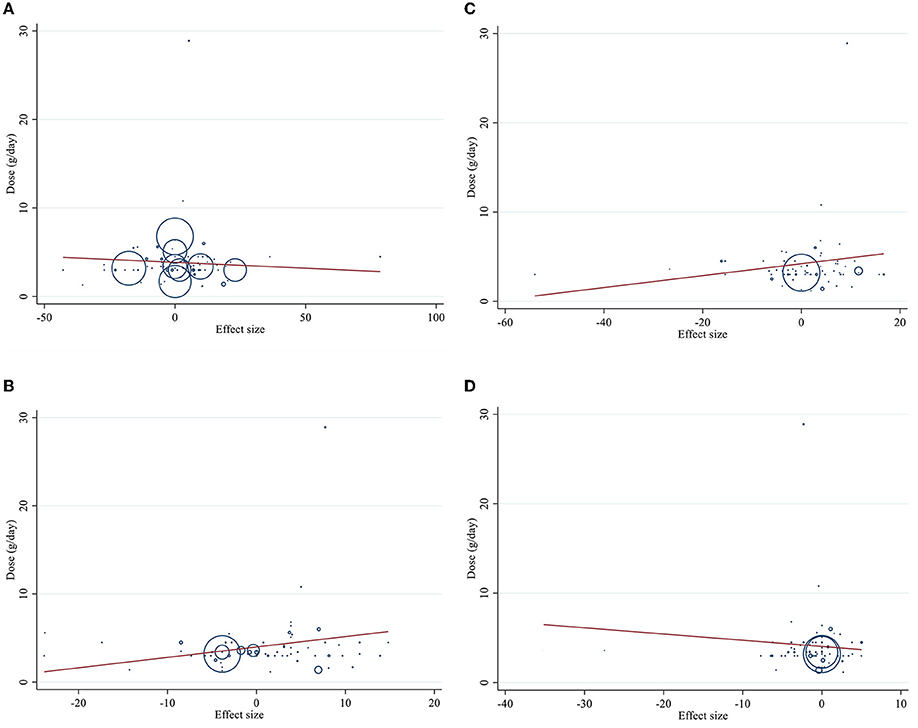
Figure 4. Linear meta regression plots based on dose (g/d) of intervention for (A) TG (mg/dl), (B) TC (mg/dl), (C) LDL-C (mg/dl), and (D) HDL-C (mg/dl).
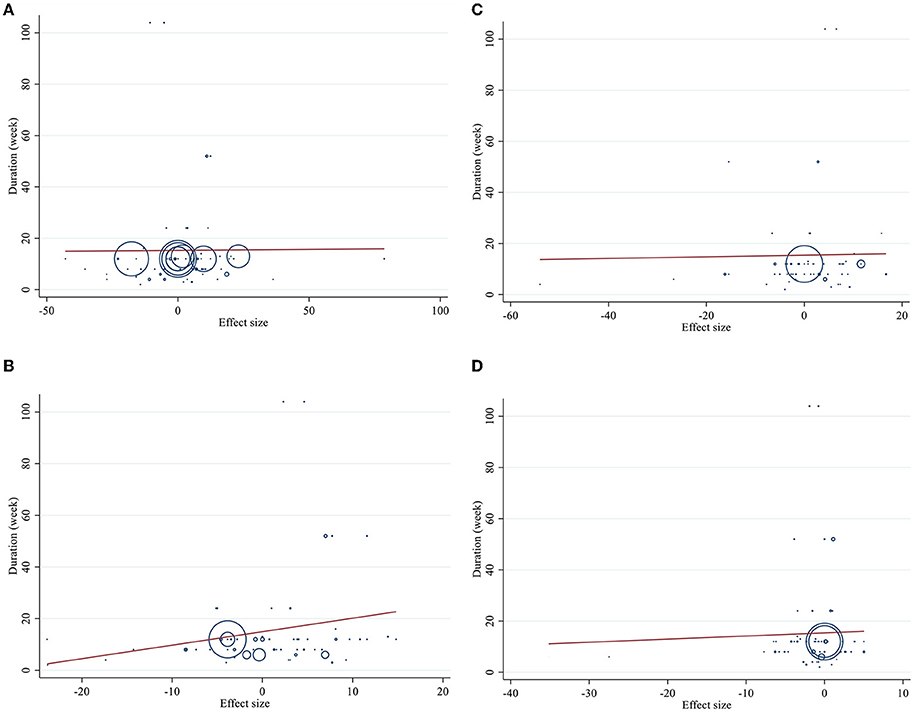
Figure 5. Linear meta regression plots based on duration (week) of intervention for (A) TG (mg/dl), (B) TC (mg/dl), (C) LDL-C (mg/dl), and (D) HDL-C (mg/dl).
Dose–response analysis showed that CLA supplementation changed TC significantly based on duration (r = −0.006, P-non-linearity = 0.009) in non-linear fashion. Additionally, significant associations were not observed for other outcomes in non-linear dose–responses (Figures 6, 7).
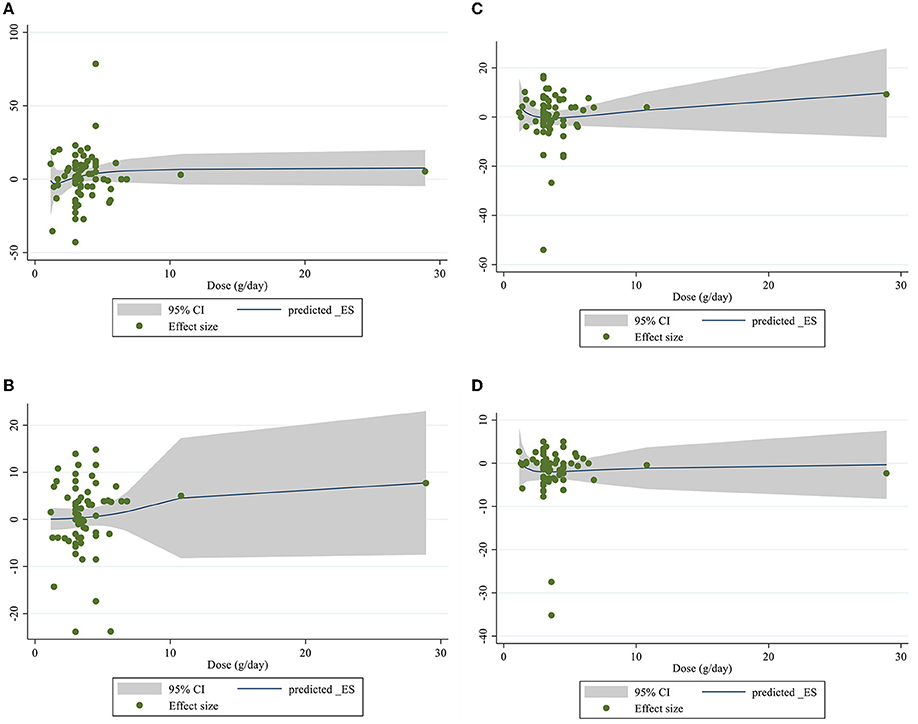
Figure 6. Non-linear dose-respons plots based on dose (g/d) of intervention for (A) TG (mg/dl), (B) TC (mg/dl), (C) LDL-C (mg/dl), and (D) HDL-C (mg/dl).
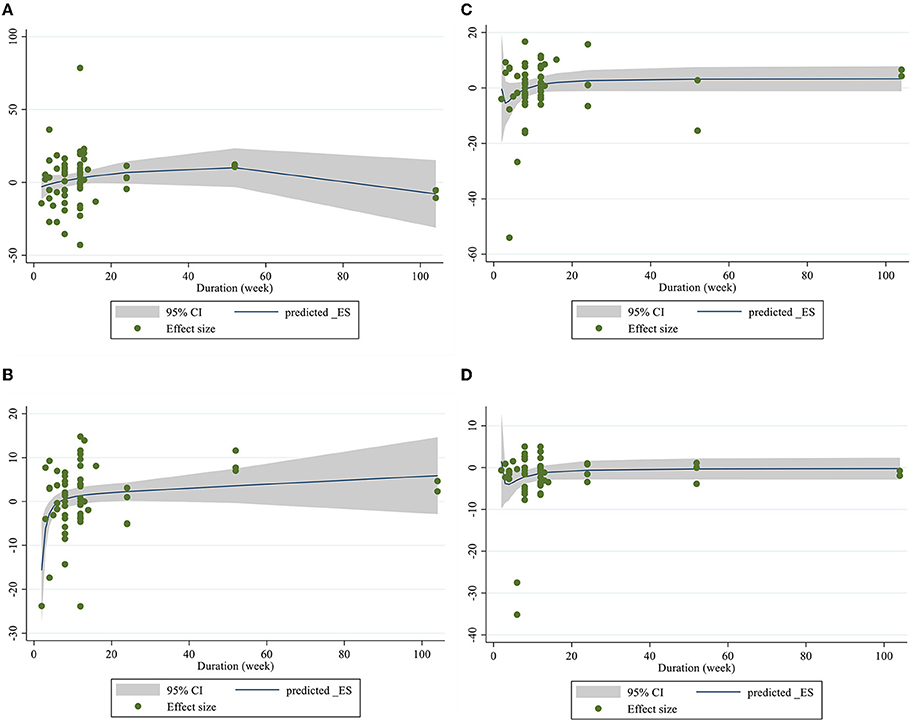
Figure 7. Non-linear dose-respons plots based on duration (week) of intervention for (A) TG (mg/dl), (B) TC (mg/dl), (C) LDL-C (mg/dl), and (D) HDL-C (mg/dl).
Grading of evidence
The GRADE protocol was applied for the assessment of the certainty of the evidence (Table 4) and determined the evidence regarding HDL-C to be of moderate quality, owing to serious inconsistency and TG, LDL-C, Apo A, and Apo B to be of low quality for a serious imprecision and inconsistency reason. However, the evidence relating to TC was downgraded to very low quality, because of the serious inconsistency, imprecision, and publication bias.
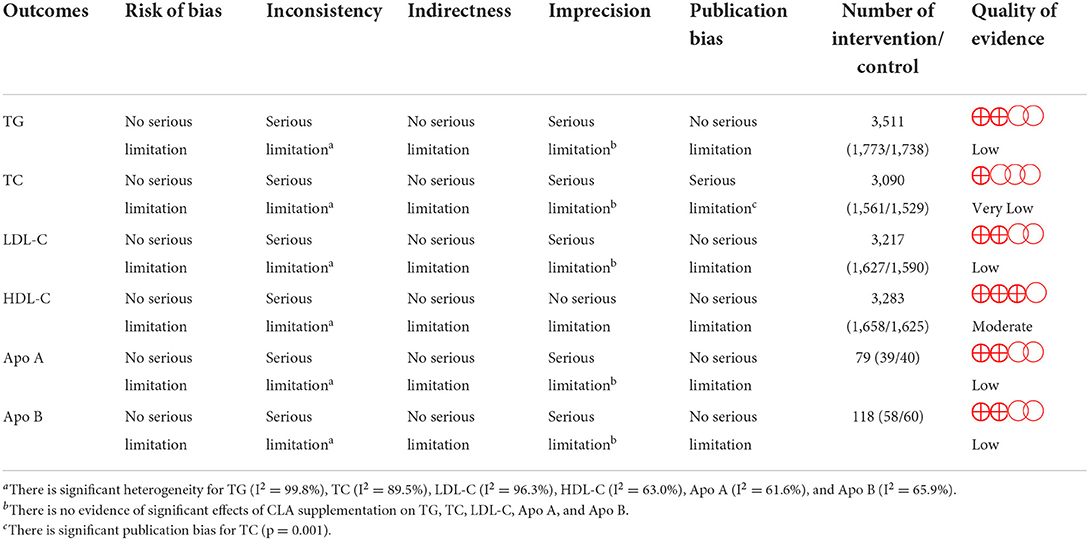
Table 4. GRADE profile of CLA supplementation for on lipid profile.
Sensitivity analysis
The sensitivity analysis was also carried out to examine the impact of each individual study on the pooled effect size by removing each study in turn. The sensitivity analysis showed that the result was not significantly influenced by any of the studies assessing the TG, TC, and LDL-C levels. However, the effect of CLA on HDL-C was significantly changed after removing studies by Risérus et al. (41) (WMD: −0.31, 95% CI: −0.63, 0.00) (41), Sofi et al. (67) (WMD: −0.22, 95% CI: −0.52, 0.06) (67), and Eftekhari et al. (31) (WMD: −0.30, 95% CI: −0.63, 0.02) (31).
Discussion
In this systematic review and meta-analysis, we aimed to evaluate the effects of CLA supplementation on lipid profile. The results derived from this study suggest that the administration of CLA has non-significant effects on serum levels of TG, TC, LDL, Apo A, and Apo B. However, CLA supplementation decreases HDL statistically but not clinically.
Initial animal studies suggested that CLA promotes significant changes to lipid metabolism in vivo. In mice, it has been reported that CLA decreases cholesterol levels (90–93) and increases HDL levels (92, 94, 95), suggesting that CLA could impact cholesterol efflux. It should be noted that mice inherently have a much different lipoprotein profile than humans, where the majority of the cholesterol is carried on HDL rather than both LDL and HDL (96). However, the proven effects of CLA administration on lipid profile are unclear, as clinical studies on this topic have produced inconsistent results. A meta-analysis of 23 studies by Derakhshande-Rishehri et al. showed that CLA supplementation has favorable effects on LDL cholesterol levels without any changes in TC, TG, and HDL (28). They also reported that consumption of foods enriched with CLA has similar effects. In a more recent meta-analysis of 13 studies by Moreno et al. they showed that CLA was associated with a reduction in HDL-C levels and an increase in triglyceride levels (97). However, our results of 56 studies CLA supplementation not only cannot improve LDL but also it can decrease HDL, in inconsistence with their findings. Differences in the different number of studies, the use of different doses and type of supplementation can be the explanations for inconsistencies between our findings and Derakhshande-Rishehri et al. findings.
HDL-lowering effects of CLA are in contrast with the previously mentioned findings from mechanistic studies. Therefore, the possible mechanisms underlying the negative effects of CLA supplementation on HDL concentrations remain unclear. Because low HDL levels are an independent risk factor for cardiovascular events (98), the current reduction of 0.4 mg/dl with CLA is of clinical concern. Riserus et al. hypnotized that HDL-lowering effect of CLA may be related to its leptin-lowering effect (41). According to their findings, the decrease in HDL cholesterol following CLA supplementation was correlated with a change in leptin. Because of the importance of HDL-decrement which is reported in our study as well as some previous studies, further mechanistic studies are needed to the possible mechanism underlying the effects of CLA supplementation on lipid profile.
The present meta-analysis contains some strengths and limitations. The main strength of this study is the relatively acceptable number of studies (N = 56) and high sample size compared with previous meta-analyses (N = 13 and 23). Moreover, we analyzed a wider range of lipid profile biomarkers (TC, TG, LDL, HDL, and apo A and apo B). Another advantage is the lack of publication bias in almost all analyses (all except for TC). Furthermore, we performed a dose–response analysis to evaluate the association between pooled effect size, dosage, and duration of CLA supplementation.
Another strength of this study relates to the inclusion of several long-term studies, which certainly has the advantage of documenting the long-term effects of CLA administration on lipid profile and allowing comparisons to shorter duration designs. Finally, we graded the overall certainty of evidence across the studies according to the GRADE guidelines. Regarding limitations, statistical heterogeneity is apparent in our analysis. This may be attributed to methodological diversity (different study designs) and/or differences in treatment regimens (doses/durations) or the intervention type. In addition, the quality of evidence regarding all markers was identified as very low to moderate quality.
Overall, the results of the current systematic review and meta-analysis demonstrate that supplementation of CLA statistically decreases HDL but not clinically. However, CLA may not affect serum levels of TG, TC, LDL, apo-A, and apo-B. However, given the low quality of some of the included studies, further studies are needed to support the veracity of our findings.
Data availability statement
The original contributions presented in the study are included in the article/supplementary material, further inquiries can be directed to the corresponding author/s.
Author contributions
OA contributed in conception and design of the study, data analysis, and supervised the study. DA-l and KN contributed to data extraction. MZ contribute to correct the proof of manuscript. SS and MR screened articles for inclusion criteria. SD and NH contributed in manuscript drafting. MN contributed to edit English language. All authors approved the final version of the manuscript.
Funding
This work was supported by Shiraz University of Medical Sciences (grant number: 26331).
Conflict of interest
The authors declare that the research was conducted in the absence of any commercial or financial relationships that could be construed as a potential conflict of interest.
Publisher's note
All claims expressed in this article are solely those of the authors and do not necessarily represent those of their affiliated organizations, or those of the publisher, the editors and the reviewers. Any product that may be evaluated in this article, or claim that may be made by its manufacturer, is not guaranteed or endorsed by the publisher.
References
1. Cheng Y-C, Sheen J-M, Hu WL, Hung Y-C. (2017). Polyphenols and oxidative stress in atherosclerosis-related ischemic heart disease and stroke. Oxid Med Cell Longevity. (2017) 2017:8526438. doi: 10.1155/2017/8526438
2. Narindrarangkura P, Bosl W, Rangsin R, Hatthachote P. Prevalence of dyslipidemia associated with complications in diabetic patients: a nationwide study in Thailand. Lipids Health Dis. (2019) 18:1–8. doi: 10.1186/s12944-019-1034-3
3. Beverly JK, Budoff MJ. Atherosclerosis: pathophysiology of insulin resistance, hyperglycemia, hyperlipidemia, and inflammation. J Diabetes. (2020) 12:102–4. doi: 10.1111/1753-0407.12970
4. Gebreegziabiher G, Belachew T, Mehari K, Tamiru D. Prevalence of dyslipidemia and associated risk factors among adult residents of Mekelle City, Northern Ethiopia. PLoS ONE. (2021) 16:e0243103. doi: 10.1371/journal.pone.0243103
5. Cooney M, Dudina A, De Bacquer D, Wilhelmsen L, Sans S, Menotti A, et al. HDL cholesterol protects against cardiovascular disease in both genders, at all ages and at all levels of risk. Atherosclerosis. (2009) 206:611–6. doi: 10.1016/j.atherosclerosis.2009.02.041
6. Natarajan P, Ray KK, Cannon CP. High-density lipoprotein and coronary heart disease: current and future therapies. J Am Coll Cardiol. (2010) 55:1283–99. doi: 10.1016/j.jacc.2010.01.008
7. Pirillo A, Casula M, Olmastroni E, Norata GD, Catapano AL. Global epidemiology of dyslipidaemias. Nat Rev Cardiol. (2021) 18:689–700. doi: 10.1038/s41569-021-00541-4
8. Mohamed-Yassin M-S, Baharudin N, Abdul-Razak S, Ramli AS, Lai NM. Global prevalence of dyslipidaemia in adult populations: a systematic review protocol. BMJ Open. (2021) 11:e049662. doi: 10.1136/bmjopen-2021-049662
9. Mozaffarian D, Benjamin EJ, Go AS, Arnett DK, Blaha MJ, Cushman M, et al. Heart disease and stroke statistics-−2015 update: a report from the American Heart Association. Circulation. (2015) 131:e29–322. doi: 10.1161/CIR.0000000000000152
10. Bansal V, Mottalib A, Pawar TK, Abbasakoor N, Chuang E, Chaudhry A, et al. Inpatient diabetes management by specialized diabetes team versus primary service team in non-critical care units: impact on 30-day readmission rate and hospital cost. BMJ Open Diabetes Res Care. (2018) 6:e000460. doi: 10.1136/bmjdrc-2017-000460
11. Leroith D. Dyslipidemia and glucose dysregulation in overweight and obese patients. Clin Cornerstone. (2007) 8:38–52. doi: 10.1016/S1098-3597(07)80027-5
12. Enani S, Bahijri S, Malibary M, Jambi H, Eldakhakhny B, Al-Ahmadi J, et al. The association between dyslipidemia, dietary habits and other lifestyle indicators among non-diabetic attendees of primary health care centers in Jeddah, Saudi Arabia. Nutrients. (2020) 12:2441. doi: 10.3390/nu12082441
13. Tan X, Jiao G, Ren Y, Gao X, Ding Y, Wang X, et al. Relationship between smoking and dyslipidemia in western Chinese elderly males. J Clin Lab Anal. (2008) 22:159–63. doi: 10.1002/jcla.20235
14. Moradinazar M, Pasdar Y, Najafi F, Shahsavari S, Shakiba E, Hamzeh B, et al. Association between dyslipidemia and blood lipids concentration with smoking habits in the Kurdish population of Iran. BMC Public Health. (2020) 20:673. doi: 10.1186/s12889-020-08809-z
15. Cicero AFG, Fogacci F, Colletti A. Food and plant bioactives for reducing cardiometabolic disease risk: an evidence based approach. Food Funct. (2017) 8:2076–88. doi: 10.1039/C7FO00178A
16. Asbaghi O, Kashkooli S, Choghakhori R, Hasanvand A, Abbasnezhad A. Effect of calcium and vitamin D co-supplementation on lipid profile of overweight/obese subjects: a systematic review and meta-analysis of the randomized clinical trials. Obesity Med. (2019) 100124. doi: 10.1016/j.obmed.2019.100124
17. Asbaghi O, Sadeghian M, Mozaffari-Khosravi H, Maleki V, Shokri A, Hajizadeh-Sharafabad F, et al. The effect of vitamin d-calcium co-supplementation on inflammatory biomarkers: a systematic review and meta-analysis of randomized controlled trials. Cytokine. (2020) 129:155050. doi: 10.1016/j.cyto.2020.155050
18. Ashtary-Larky D, Rezaei Kelishadi M, Bagheri R, Moosavian SP, Wong A, Davoodi SH, et al. The effects of nano-curcumin supplementation on risk factors for cardiovascular disease: a GRADE-assessed systematic review and meta-analysis of clinical trials. Antioxidants. (2021) 10:1015. doi: 10.3390/antiox10071015
19. Cicero AFG, Fogacci F, Stoian AP, Vrablik M, Al Rasadi K, Banach M, et al. Nutraceuticals in the management of dyslipidemia: which, when, and for whom? Could nutraceuticals help low-risk individuals with non-optimal lipid levels? Curr Atheroscler Rep. (2021) 23:57. doi: 10.1007/s11883-021-00955-y
20. Hegazy M, Elsayed NM, Ali HM, Hassan HG, Rashed L. Diabetes mellitus, nonalcoholic fatty liver disease, and conjugated linoleic acid (omega 6): what is the link? J Diabetes Res. (2019) 2019:5267025. doi: 10.1155/2019/5267025
21. Chang H, Gan W, Liao X, Wei J, Lu M, Chen H, et al. Conjugated linoleic acid supplements preserve muscle in high-body-fat adults: a double-blind, randomized, placebo trial. Nutr Metab Cardiovasc Dis. (2020) 30:1777–84. doi: 10.1016/j.numecd.2020.05.029
22. Klok MD, Jakobsdottir S, Drent M. The role of leptin and ghrelin in the regulation of food intake and body weight in humans: a review. Obesity Rev. (2007) 8:21–34. doi: 10.1111/j.1467-789X.2006.00270.x
23. Lehnen TE, Da Silva MR, Camacho A, Marcadenti A, Lehnen AM. A review on effects of conjugated linoleic fatty acid (CLA) upon body composition and energetic metabolism. J Int Soc Sports Nutr. (2015) 12:1–11. doi: 10.1186/s12970-015-0097-4
24. Botelho AP, Santos-Zago LF, Reis SMPM, Oliveira ACD. Conjugated linoleic acid suplementation decreased the body fat in Wistar rats. Revista de Nutrição. (2005) 18:561–5. doi: 10.1590/S1415-52732005000400011
25. Martins SV, Madeira A, Lopes PA, Pires VM, Alfaia CM, Prates JA, et al. Adipocyte membrane glycerol permeability is involved in the anti-adipogenic effect of conjugated linoleic acid. Biochem Biophys Res Commun. (2015) 458:356–61. doi: 10.1016/j.bbrc.2015.01.116
26. Yaseen RI, El-Leboudy MH, El-Deeb HM. The relation between ApoB/ApoA-1 ratio and the severity of coronary artery disease in patients with acute coronary syndrome. Egyptian Heart J. (2021) 73:1–9. doi: 10.1186/s43044-021-00150-z
27. Colakoglu S, Colakoglu M, Taneli F, Cetinoz F, Turkmen M. Cumulative effects of conjugated linoleic acid and exercise on endurance development, body composition, serum leptin and insulin levels. J Sports Med Phys Fitness. (2006) 46:570–7.
28. Derakhshande-Rishehri S-M, Mansourian M, Kelishadi R, Heidari-Beni M. Association of foods enriched in conjugated linoleic acid (CLA) and CLA supplements with lipid profile in human studies: a systematic review and meta-analysis. Public Health Nutr. (2015) 18:2041–54. doi: 10.1017/S1368980014002262
29. Santurino C, López-Plaza B, Fontecha J, Calvo MV, Bermejo LM, Gómez-Andrés D, et al. Consumption of goat cheese naturally rich in omega-3 and conjugated linoleic acid improves the cardiovascular and inflammatory biomarkers of overweight and obese subjects: a randomized controlled trial. Nutrients. (2020) 12:1315. doi: 10.3390/nu12051315
30. Sluijs I, Plantinga Y, De Roos B, Mennen LI, Bots ML. Dietary supplementation with cis-9, trans-11 conjugated linoleic acid and aortic stiffness in overweight and obese adults. Am J Clin Nutr. (2010) 91:175–83. doi: 10.3945/ajcn.2009.28192
31. Eftekhari MH, Aliasghari F, Beigi MAB, Hasanzadeh J. The effect of conjugated linoleic acids and omega-3 fatty acids supplementation on lipid profile in atherosclerosis. Adv Biomed Res. (2014) 3:15. doi: 10.4103/2277-9175.124644
32. Fouladi H, Peng LS, Mohaghehgi A. Effects of conjugated linoleic acid supplementation and exercise on body fat mass and blood lipid profiles among overweight Iranians. Malays J Nutr. (2018) 24:203–13. Available online at: https://nutriweb.org.my/mjn/publication/24-2/f.pdf
33. Page MJ, Mckenzie JE, Bossuyt PM, Boutron I, Hoffmann TC, Mulrow CD, et al. The PRISMA 2020 statement: an updated guideline for reporting systematic reviews. Syst Rev. (2021) 10:1–11. doi: 10.1186/s13643-021-01626-4
34. Higgins JP, Altman DG, Gøtzsche PC, Jüni P, Moher D, Oxman AD, et al. The Cochrane Collaboration's tool for assessing risk of bias in randomised trials. BMJ. (2011) 343:d5928. doi: 10.1136/bmj.d5928
35. Blankson H, Stakkestad JA, Fagertun H, Thom E, Wadstein J, Gudmundsen O. Conjugated linoleic acid reduces body fat mass in overweight and obese humans. J Nutr. (2000) 130:2943–8. doi: 10.1093/jn/130.12.2943
36. Berven G, Bye A, Hals O, Blankson H, Fagertun H, Thom E, et al. Safety of conjugated linoleic acid (CLA) in overweight or obese human volunteers. Eur J Lipid Sci Technol. (2000) 102:455–62. doi: 10.1002/1438-9312(200008)102:7andlt;455::AID-EJLT455andgt;3.0.CO;2-V
37. Benito P, Nelson GJ, Kelley DS, Bartolini G, Schmidt PC, Simon V. The effect of conjugated linoleic acid on plasma lipoproteins and tissue fatty acid composition in humans. Lipids. (2001) 36:229–36. doi: 10.1007/s11745-001-0712-x
38. Mougios V, Matsakas A, Petridou A, Ring S, Sagredos A, Melissopoulou A, et al. Effect of supplementation with conjugated linoleic acid on human serum lipids and body fat. J Nutr Biochem. (2001) 12:585–94. doi: 10.1016/S0955-2863(01)00177-2
39. Risérus U, Berglund L, Vessby B. Conjugated linoleic acid (CLA) reduced abdominal adipose tissue in obese middle-aged men with signs of the metabolic syndrome: a randomised controlled trial. Int J Obes Relat Metab Disord. (2001) 25:1129–35. doi: 10.1038/sj.ijo.0801659
40. Noone EJ, Roche HM, Nugent AP, Gibney MJ. The effect of dietary supplementation using isomeric blends of conjugated linoleic acid on lipid metabolism in healthy human subjects. Br J Nutr. (2002) 88:243–51. doi: 10.1079/BJN2002615
41. Risérus U, Arner P, Brismar K, Vessby B. Treatment with dietary trans10cis12 conjugated linoleic acid causes isomer-specific insulin resistance in obese men with the metabolic syndrome. Diabetes Care. (2002) 25:1516–21. doi: 10.2337/diacare.25.9.1516
42. Kamphuis MM, Lejeune MP, Saris WH, Westerterp-Plantenga MS. The effect of conjugated linoleic acid supplementation after weight loss on body weight regain, body composition, and resting metabolic rate in overweight subjects. Int J Obes Relat Metab Disord. (2003) 27:840–7. doi: 10.1038/sj.ijo.0802304
43. Whigham LD, O'shea M, Mohede IC, Walaski HP, Atkinson RL. Safety profile of conjugated linoleic acid in a 12-month trial in obese humans. Food Chem Toxicol. (2004) 42:1701–9. doi: 10.1016/j.fct.2004.06.008
44. Moloney F, Yeow TP, Mullen A, Nolan JJ, Roche HM. Conjugated linoleic acid supplementation, insulin sensitivity, and lipoprotein metabolism in patients with type 2 diabetes mellitus. Am J Clin Nutr. (2004) 80:887–95. doi: 10.1093/ajcn/80.4.887
45. Gaullier JM, Halse J, Høye K, Kristiansen K, Fagertun H, Vik H, et al. Conjugated linoleic acid supplementation for 1 y reduces body fat mass in healthy overweight humans. Am J Clin Nutr. (2004) 79:1118–25. doi: 10.1093/ajcn/79.6.1118
46. Risérus U, Vessby B, Arnlöv J, Basu S. Effects of cis-9, trans-11 conjugated linoleic acid supplementation on insulin sensitivity, lipid peroxidation, and proinflammatory markers in obese men. Am J Clin Nutr. (2004) 80:279–83. doi: 10.1093/ajcn/80.2.279
47. Song HJ, Grant I, Rotondo D, Mohede I, Sattar N, Heys SD, et al. Effect of CLA supplementation on immune function in young healthy volunteers. Eur J Clin Nutr. (2005) 59:508–17. doi: 10.1038/sj.ejcn.1602102
48. Desroches S, Chouinard PY, Galibois I, Corneau L, Delisle J, Lamarche B, et al. Lack of effect of dietary conjugated linoleic acids naturally incorporated into butter on the lipid profile and body composition of overweight and obese men. Am J Clin Nutr. (2005) 82:309–19. doi: 10.1093/ajcn/82.2.309
49. Tricon S, Burdge GC, Jones EL, Russell JJ, El-Khazen S, Moretti E, et al. Effects of dairy products naturally enriched with cis-9, trans-11 conjugated linoleic acid on the blood lipid profile in healthy middle-aged men. Am J Clin Nutr. (2006) 83:744–53. doi: 10.1093/ajcn/83.4.744
50. Naumann E, Carpentier YA, Saebo A, Lassel TS, Chardigny JM, Sébédio JL, et al. Cis-9, trans- 11 and trans-10, cis-12 conjugated linoleic acid (CLA) do not affect the plasma lipoprotein profile in moderately overweight subjects with LDL phenotype B. Atherosclerosis. (2006) 188:167–74. doi: 10.1016/j.atherosclerosis.2005.10.019
51. Schmitt B, Ferry C, Daniel N, Weill P, Kerhoas N, Legrand P. Effet d'un régime riche en acides gras ω3 et en CLA 9-cis, 11-trans sur l'insulinorésistance et les paramètres du diabète de type 2. Oléagineux Corps Gras Lipides. (2006) 13:70–5. doi: 10.1051/ocl.2006.0070
52. Taylor JS, Williams SR, Rhys R, James P, Frenneaux MP. Conjugated linoleic acid impairs endothelial function. Arterioscler Thromb Vasc Biol. (2006) 26:307–12. doi: 10.1161/01.ATV.0000199679.40501.ac
53. Attar-Bashi NM, Weisinger RS, Begg DP, Li D, Sinclair AJ. Failure of conjugated linoleic acid supplementation to enhance biosynthesis of docosahexaenoic acid from alpha-linolenic acid in healthy human volunteers. Prostaglandins Leukot Essent Fatty Acids. (2007) 76:121–30. doi: 10.1016/j.plefa.2006.11.002
54. Nazare JA, De La Perrière AB, Bonnet F, Desage M, Peyrat J, Maitrepierre C, et al. Daily intake of conjugated linoleic acid-enriched yoghurts: effects on energy metabolism and adipose tissue gene expression in healthy subjects. Br J Nutr. (2007) 97:273–80. doi: 10.1017/S0007114507191911
55. Gaullier JM, Halse J, Høivik HO, Høye K, Syvertsen C, Nurminiemi M, et al. Six months supplementation with conjugated linoleic acid induces regional-specific fat mass decreases in overweight and obese. Br J Nutr. (2007) 97:550–60. doi: 10.1017/S0007114507381324
56. Steck SE, Chalecki AM, Miller P, Conway J, Austin GL, Hardin JW, et al. Conjugated linoleic acid supplementation for twelve weeks increases lean body mass in obese humans. J Nutr. (2007) 137:1188–93. doi: 10.1093/jn/137.5.1188
57. Watras AC, Buchholz AC, Close RN, Zhang Z, Schoeller DA. The role of conjugated linoleic acid in reducing body fat and preventing holiday weight gain. Int J Obes. (2007) 31:481–7. doi: 10.1038/sj.ijo.0803437
58. Lambert EV, Goedecke JH, Bluett K, Heggie K, Claassen A, Rae DE, et al. Conjugated linoleic acid versus high-oleic acid sunflower oil: effects on energy metabolism, glucose tolerance, blood lipids, appetite and body composition in regularly exercising individuals. Br J Nutr. (2007) 97:1001–11. doi: 10.1017/S0007114507172822
59. Iwata T, Kamegai T, Yamauchi-Sato Y, Ogawa A, Kasai M, Aoyama T, et al. Safety of dietary conjugated linoleic acid (CLA) in a 12-weeks trial in healthy overweight Japanese male volunteers. J Oleo Sci. (2007) 56:517–25. doi: 10.5650/jos.56.517
60. Park E-J, Kim J-M, Kim K-T, Paik H-D. Conjugated linoleic acid (CLA) supplementation for 8 weeks reduces body weight in healthy overweight/obese Korean subjects. Food Sci Biotechnol. (2008) 17:1261–4.
61. Aryaeian N, Shahram F, Djalali M, Eshragian MR, Djazayeri A, Sarrafnejad A, et al. Effect of conjugated linoleic acid, vitamin E and their combination on lipid profiles and blood pressure of Iranian adults with active rheumatoid arthritis. Vasc Health Risk Manag. (2008) 4:1423–32. doi: 10.2147/VHRM.S3822
62. Raff M, Tholstrup T, Basu S, Nonboe P, Sørensen MT, Straarup EM. A diet rich in conjugated linoleic acid and butter increases lipid peroxidation but does not affect atherosclerotic, inflammatory, or diabetic risk markers in healthy young men. J Nutr. (2008) 138:509–14. doi: 10.1093/jn/138.3.509
63. Kim J-H, Kim O-H, Ha Y-L, Kim J-O. Supplementation of conjugated linoleic acid with γ-oryzanol for 12 weeks effectively reduces body fat in healthy overweight Korean women. Prev Nutr Food Sci. (2008) 13:146–56. doi: 10.3746/jfn.2008.13.3.146
64. Son S-J, Lee J-E, Park E-K, Paik E-Y, Lee J-E, Kim Y-J, et al. The effects of conjugated linoleic acid and/or exercise on body weight and body composition in college women with high body fat mass. Korean J Food Sci Technol. (2009) 41:307–12. doi: 10.1093/nutrit/nuac060/6680451
65. Zhao WS, Zhai JJ, Wang YH, Xie PS, Yin XJ, Li LX, et al. Conjugated linoleic acid supplementation enhances antihypertensive effect of ramipril in Chinese patients with obesity-related hypertension. Am J Hypertens. (2009) 22:680–6. doi: 10.1038/ajh.2009.56
66. Shadman Z, Rastmanesh R, Taleban F, Hedayati M. Effects of conjugated linoleic acid on serum Apo B and MDA in type II diabetic patients. Iranian J Endocrinol Metab. (2009) 11:377–83.
67. Sofi F, Buccioni A, Cesari F, Gori AM, Minieri S, Mannini L, et al. Effects of a dairy product (pecorino cheese) naturally rich in cis-9, trans-11 conjugated linoleic acid on lipid, inflammatory and haemorheological variables: a dietary intervention study. Nutr Metab Cardiovasc Dis. (2010) 20:117–24. doi: 10.1016/j.numecd.2009.03.004
68. Wanders AJ, Brouwer IA, Siebelink E, Katan MB. Effect of a high intake of conjugated linoleic acid on lipoprotein levels in healthy human subjects. PLoS ONE. (2010) 5:e9000. doi: 10.1371/journal.pone.0009000
69. Michishita T, Kobayashi S, Katsuya T, Ogihara T, Kawabuchi K. Evaluation of the antiobesity effects of an amino acid mixture and conjugated linoleic acid on exercising healthy overweight humans: a randomized, double-blind, placebo-controlled trial. J Int Med Res. (2010) 38:844–59. doi: 10.1177/147323001003800311
70. Venkatramanan S, Joseph SV, Chouinard PY, Jacques H, Farnworth ER, Jones PJ. Milk enriched with conjugated linoleic acid fails to alter blood lipids or body composition in moderately overweight, borderline hyperlipidemic individuals. J Am Coll Nutr. (2010) 29:152–9. doi: 10.1080/07315724.2010.10719829
71. Brown AW, Trenkle AH, Beitz DC. Diets high in conjugated linoleic acid from pasture-fed cattle did not alter markers of health in young women. Nutr Res. (2011) 31:33–41. doi: 10.1016/j.nutres.2010.12.003
72. Sato K, Shinohara N, Honma T, Ito J, Arai T, Nosaka N, et al. The change in conjugated linoleic acid concentration in blood of Japanese fed a conjugated linoleic acid diet. J Nutr Sci Vitaminol. (2011) 57:364–71. doi: 10.3177/jnsv.57.364
73. Joseph SV, Jacques H, Plourde M, Mitchell PL, Mcleod RS, Jones PJ. Conjugated linoleic acid supplementation for 8 weeks does not affect body composition, lipid profile, or safety biomarkers in overweight, hyperlipidemic men. J Nutr. (2011) 141:1286–91. doi: 10.3945/jn.110.135087
74. Pfeuffer M, Fielitz K, Laue C, Winkler P, Rubin D, Helwig U, et al. CLA does not impair endothelial function and decreases body weight as compared with safflower oil in overweight and obese male subjects. J Am Coll Nutr. (2011) 30:19–28. doi: 10.1080/07315724.2011.10719940
75. Rubin D, Herrmann J, Much D, Pfeuffer M, Laue C, Winkler P, et al. Influence of different CLA isomers on insulin resistance and adipocytokines in pre-diabetic, middle-aged men with PPARγ2 Pro12Ala polymorphism. Genes Nutr. (2012) 7:499–509. doi: 10.1007/s12263-012-0289-3
76. Chen SC, Lin YH, Huang HP, Hsu WL, Houng JY, Huang CK. Effect of conjugated linoleic acid supplementation on weight loss and body fat composition in a Chinese population. Nutrition. (2012) 28:559–65. doi: 10.1016/j.nut.2011.09.008
77. Carvalho RF, Uehara SK, Rosa G. Microencapsulated conjugated linoleic acid associated with hypocaloric diet reduces body fat in sedentary women with metabolic syndrome. Vasc Health Risk Manag. (2012) 8:661–7. doi: 10.2147/VHRM.S37385
78. López-Plaza B, Bermejo LM, Koester Weber T, Parra P, Serra F, Hernández M, et al. Effects of milk supplementation with conjugated linoleic acid on weight control and body composition in healthy overweight people. Nutr Hosp. (2013) 28:2090–8. doi: 10.3305/nh.2013.28.6.7013
79. Bulut S, Bodur E, Colak R, Turnagol H. Effects of conjugated linoleic acid supplementation and exercise on post-heparin lipoprotein lipase, butyrylcholinesterase, blood lipid profile and glucose metabolism in young men. Chem Biol Interact. (2013) 203:323–9. doi: 10.1016/j.cbi.2012.09.022
80. Shadman Z, Taleban FA, Saadat N, Hedayati M. Effect of conjugated linoleic acid and vitamin E on glycemic control, body composition, and inflammatory markers in overweight type2 diabetics. J Diabetes Metab Disord. (2013) 12:42. doi: 10.1186/2251-6581-12-42
81. Jenkins ND, Buckner SL, Cochrane KC, Bergstrom HC, Goldsmith JA, Weir JP, et al. CLA supplementation and aerobic exercise lower blood triacylglycerol, but have no effect on peak oxygen uptake or cardiorespiratory fatigue thresholds. Lipids. (2014) 49:871–80. doi: 10.1007/s11745-014-3929-0
82. Baghi AN, Mazani M, Nemati A, Amani M, Alamolhoda S, Mogadam RA. Anti-inflammatory effects of conjugated linoleic acid on young athletic males. J Pak Med Assoc. (2016) 66:280–4.
83. Ebrahimi-Mameghani M, Jamali H, Mahdavi R, Kakaei F, Abedi R, Kabir-Mamdooh B. Conjugated linoleic acid improves glycemic response, lipid profile, and oxidative stress in obese patients with non-alcoholic fatty liver disease: a randomized controlled clinical trial. Croat Med J. (2016) 57:331–42. doi: 10.3325/cmj.2016.57.331
84. Ribeiro AS, Pina FL, Dodero SR, Silva DR, Schoenfeld BJ, Sugihara Júnior P, et al. Effect of conjugated linoleic acid associated with aerobic exercise on body fat and lipid profile in obese women: a randomized, double-blinded, and placebo-controlled trial. Int J Sport Nutr Exerc Metab. (2016) 26:135–44. doi: 10.1123/ijsnem.2015-0236
85. Hozo SP, Djulbegovic B, Hozo I. Estimating the mean and variance from the median, range, and the size of a sample. BMC Med Res Methodol. (2005) 5:13. doi: 10.1186/1471-2288-5-13
86. Brondani LA, Assmann TS, De Souza BM, Boucas AP, Canani LH, Crispim D. Meta-analysis reveals the association of common variants in the uncoupling protein (UCP) 1–3 genes with body mass index variability. PLoS ONE. (2014) 9:e96411. doi: 10.1371/journal.pone.0096411
87. Zahedi H, Djalalinia S, Sadeghi O, Asayesh H, Noroozi M, Gorabi AM, et al. Dietary inflammatory potential score and risk of breast cancer: systematic review and meta-analysis. Clin Breast Cancer. (2018) 18:e561–70. doi: 10.1016/j.clbc.2018.01.007
88. Guyatt GH, Oxman AD, Vist GE, Kunz R, Falck-Ytter Y, Alonso-Coello P, et al. GRADE: an emerging consensus on rating quality of evidence and strength of recommendations. BMJ. (2008) 336:924–6. doi: 10.1136/bmj.39489.470347.AD
89. Gaullier JM, Halse J, Høye K, Kristiansen K, Fagertun H, Vik H, et al. Supplementation with conjugated linoleic acid for 24 months is well tolerated by and reduces body fat mass in healthy, overweight humans. J Nutr. (2005) 135:778–84. doi: 10.1093/jn/135.4.778
90. Franczyk-Zarów M, Kostogrys RB, Szymczyk B, Jawień J, Gajda M, Cichocki T, et al. Functional effects of eggs, naturally enriched with conjugated linoleic acid, on the blood lipid profile, development of atherosclerosis and composition of atherosclerotic plaque in apolipoprotein E and low-density lipoprotein receptor double-knockout mice (apoE/LDLR–/–). Br J Nutr. (2008) 99:49–58. doi: 10.1017/S0007114507793893
91. Moon H-S, Lee H-G, Seo J-H, Chung C-S, Kim T-G, Choi Y-J, et al. Antiobesity effect of PEGylated conjugated linoleic acid on high-fat diet-induced obese C57BL/6J (ob/ob) mice: attenuation of insulin resistance and enhancement of antioxidant defenses. J Nutri Biochem. (2009) 20:187–94. doi: 10.1016/j.jnutbio.2008.02.001
92. Baraldi F, Dalalio F, Teodoro B, Prado I, Curti C, Alberici L. Body energy metabolism and oxidative stress in mice supplemented with conjugated linoleic acid (CLA) associated to oleic acid. Free Red Biol Med. (2014) 75:S21. doi: 10.1016/j.freeradbiomed.2014.10.733
93. Kanter JE, Goodspeed L, Wang S, Kramer F, Wietecha T, Gomes-Kjerulf D, et al. 10, 12 conjugated linoleic acid-driven weight loss is protective against atherosclerosis in mice and is associated with alternative macrophage enrichment in perivascular adipose tissue. Nutrients. (2018) 10:1416. doi: 10.3390/nu10101416
94. ArbonéS-Mainar JM, Navarro MAA, AcíN S, Guzmán MA, Arnal C, Surra JC, et al. Trans-10, cis-12-and cis-9, trans-11-conjugated linoleic acid isomers selectively modify HDL-apolipoprotein composition in apolipoprotein E knockout mice. J Nutri. (2006) 136:353–9. doi: 10.1093/jn/136.2.353
95. Nestel P, Fujii A, Allen TJA. The cis-9, trans-11 isomer of conjugated linoleic acid (CLA) lowers plasma triglyceride and raises HDL cholesterol concentrations but does not suppress aortic atherosclerosis in diabetic apoE-deficient mice. Atherosclerosis. (2006) 189:282–7. doi: 10.1016/j.atherosclerosis.2005.12.020
96. Daugherty A. Mouse models of atherosclerosis. Am J Med Sci. (2002) 323:3–10. doi: 10.1097/00000441-200201000-00002
97. Moreno RMC, Marquez RC, Oberg A, Papatheodorou SJJOCL. Effects of Conjugated Linoleic Acid (CLA) on HDL-C and triglyceride levels in subjects with and without the metabolic syndrome: a systematic review and meta-analysis. Neuroimage. (2019) 13:e45–6. doi: 10.1016/j.jacl.2019.04.076
Keywords: conjugated linoleic acid, lipid profile, systematic review, meta-analysis, CLA
Citation: Asbaghi O, Ashtary-larky D, Naseri K, Saadati S, Zamani M, Rezaei Kelishadi M, Nadery M, Doaei S and Haghighat N (2022) The effects of conjugated linoleic acid supplementation on lipid profile in adults: A systematic review and dose–response meta-analysis. Front. Nutr. 9:953012. doi: 10.3389/fnut.2022.953012
Received: 25 May 2022; Accepted: 28 July 2022;
Published: 03 November 2022.
Edited by:
Rohith Thota, Macquarie University, AustraliaReviewed by:
Federica Fogacci, University of Bologna, ItalyArrigo Francesco Cicero, University of Bologna, Italy
Copyright © 2022 Asbaghi, Ashtary-larky, Naseri, Saadati, Zamani, Rezaei Kelishadi, Nadery, Doaei and Haghighat. This is an open-access article distributed under the terms of the Creative Commons Attribution License (CC BY). The use, distribution or reproduction in other forums is permitted, provided the original author(s) and the copyright owner(s) are credited and that the original publication in this journal is cited, in accordance with accepted academic practice. No use, distribution or reproduction is permitted which does not comply with these terms.
*Correspondence: Saeid Doaei, c2RvYWVpQHNibXUuYWMuaXI=; Neda Haghighat, bmVkYS5oYWdAZ21haWwuY29t