 Yiqun Guo
 Yuxiao Xia3†
- 1School of Innovation and Entrepreneurship Education, Chongqing University of Posts and Telecommunications, Chongqing, China
- 2Research Center of Biomedical Engineering, Chongqing University of Posts and Telecommunications, Chongqing, China
- 3The Second Affiliated Hospital of Guangzhou Medical University, Guangzhou, China
The reward system has been proven to be contributed to the vulnerability of obesity. Previous fMRI studies have shown abnormal functional connectivity of the reward system in obesity. However, most studies were based on static index such as resting-state functional connectivity (FC), ignoring the dynamic changes over time. To investigate the dynamic neural correlates of obesity susceptibility, we used a large, demographically well-characterized sample from the Human Connectome Project (HCP) to determine the relationship of body mass index (BMI) with the temporal variability of FC from integrated multilevel perspectives, i.e., regional and within- and between-network levels. Linear regression analysis was used to investigate the association between BMI and temporal variability of FC, adjusting for covariates of no interest. We found that BMI was positively associated with regional FC variability in reward regions, such as the ventral orbitofrontal cortex and visual regions. At the intra-network level, BMI was positively related to the variability of FC within the limbic network (LN) and default mode network (DMN). At the inter-network level, variability of connectivity of LN with DMN, frontoparietal, sensorimotor, and ventral attention networks showed positive correlations with BMI. These findings provided novel evidence for abnormal dynamic functional interaction between the reward network and the rest of the brain in obesity, suggesting a more unstable state and over-frequent interaction of the reward network and other attention and cognitive networks. These findings, thus, provide novel insight into obesity interventions that need to decrease the dynamic interaction between reward networks and other brain networks through behavioral treatment and neural modulation.
1. Introduction
Long-term sedentary office and high-calorie food consumption lead to excessive fat accumulation, which has become a primary contributing reason for weight gain in modern society (1). WHO criteria define overweight in adults as a body mass index (BMI) of 25–29.9 kg/m2 and obesity as a BMI of 30 kg/m2 or higher (2). Obesity is the biggest worldwide health problem and is associated with chronic diseases such as type 2 diabetes, stroke, cancer, depression, and anxiety (3). More than 1.9 billion adults are overweight, among whom 650 million are obese. If these trends continue, global obesity prevalence will surpass 18% in adults by 2025 (4). However, treatments for obesity have been sub-optimal, which is partly because understanding of its neurobiological correlates remains to be limited.
Obesity and related overeating are associated with hyperactivity in the limbic network (LN) such as the orbitofrontal cortex [OFC (5)], which is hedonically driven and involved in the control of food intake, even in the presence of satiety (6). Relative to those with normal weight, obese people had higher responses to the limbic reward system and its connections to visual food cues (7, 8). Resting-state functional magnetic resonance imaging (rs-fMRI) can measure the intrinsic functional organization of the brain, of which functional connectivity (FC) is widely used as an indicator of synchronization between regions (9). A number of rs-fMRI studies showed that BMI was associated with abnormal FC across networks, such as LN, attention network, sensory motor network (SMN), default mode network (DMN), and frontoparietal network (FPN) (10–12). Nevertheless, some studies did not find these correlations (13, 14). One possible reason for these inconsistent results is that the majority of earlier studies have applied a “static” FC, which ignored the variability of FC between regions over time (15).
Using dynamic, rather than static, connectivity analysis could best explain the variability of neurobiological correlates in obese individuals (16). It sheds new insights on the dynamic spatiotemporal organization of resting brain activity and captures FC related to obesity. Recently, some studies adopt this method to capture FC abnormality related to obesity. For instance, Tan et al. (17) found that obese individuals showed disrupted dynamic FC between basal ganglia and salience network involving visceral sensory and autonomic information. In addition, Park et al. (16) found that abnormal obesity showed aberrant dynamic FC across different networks including FPN, SMN, DMN, basal ganglia, and visual network (VN). However, these studies used the k-means clustering method to investigate the connectivity state changes of the whole brain, ignoring the dynamic connectivity profile of particular brain regions and networks (18).
A recent approach allows to measure the temporal variability of FC of a specific brain region and network over time and reflects the flexibility and adaptability of brain function, which have been applied in many diseases by showing significant variability changes between groups and regions, showing significant variability correlated with behavior (18–20). This method provides a dynamic insight into the understanding of the underlying neuroimaging basis of obesity. To date, evidence on the temporal variability of FC of individual differences in BMI remains limited. This approach can fill this knowledge gap to reveal the abnormality of regional and network-level dynamics of functional connectivity related to BMI. In this study, we aimed to investigate the relationship of BMI with the temporal variability of FC at integrated multilevel perspectives (regional, intra-network, and inter-network), in adults from the Human Connectome Project (HCP) dataset. First, we constructed the temporal variability of regional FC architecture (20). Similarly, the within- and between-network temporal variabilities of FC architecture were constructed using the method introduced by Sun et al. (19). Linear regression analysis was used to investigate the association between BMI and temporal variability of FC, adjusting for covariates of no interest. Given that LN involved in reward processing contributing to the vulnerability of obesity and that obese individuals showed higher FC in reward-related regions (21), we hypothesized that BMI was positively associated with the regional and network-level variability of FC in LN.
2. Materials and methods
2.1. Participants
Participants were selected from the 1,200 Subjects Release of the Human Connectome Project (HCP) from the Washington University–University of Minnesota (WU–Minn HCP) Consortium (22). Detailed information about the HCP database is provided in the 1,200 Subjects Data Release Reference Manual (https://www.humanconnectome.org/, accessed on 10 March 2021). In this study, the exclusion criteria of participants indicated as follows: (1) participants with missing demographic variables such as age, sex, education, and race or family information; (2) participants with a history of hyper/hypothyroidism or other endocrine problems; (3) women who had recently given birth; and (4) participants with mean frame-wise displacement [FD (23)] >0.25. To this end, we obtained a total of 954 participants from 428 families. Considering the BMI is highly heritable [ranging from 0.47 to 0.90 (24)], we randomly selected one participant from one family to eliminate the heritability influence, as conducted by other studies, employing the HCP dataset (25). Finally, 428 participants for which fMRI images and BMI were used for the current analyses were included (see Table 1 for details). Full informed consent from each participant was obtained by WU–Minn HCP Consortium, and research procedures and ethical guidelines were followed in compliance with WU institutional review board approval.
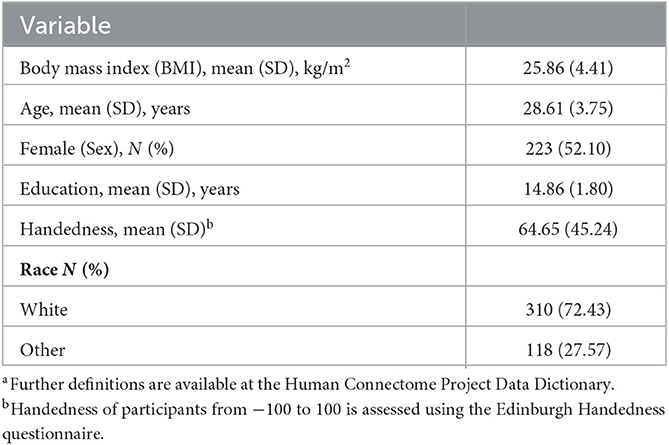
Table 1. Demographic characteristics of participantsa.
2.2. MRI scanning protocols
Rs-fMRI data were collected in four runs of ~15 min, each on a Siemens 3T Tim Trios MRI scanner using the multi-band EPI pulse sequence. For the maximum number of available data, only the left-to-right phase encoding direction was utilized (26, 27). During scanning, participants were required to keep their eyes open with relaxed fixation, think of nothing, and not fall asleep. The rs-fMRI scanning parameters were as follows: a resolution of 2 mm2 isotropic; TR = 720 ms; TE = 33 ms; flip angle = 52°; FOV = 208 × 180; 72 slices. T1-weighted images were collected by using the MPRAGE sequence with the following scanning parameters: TR = 2,400 ms; TE = 2.14 ms; flip angle = 8°; FOV = 224 × 224; voxel size = 0.7 × 0.7 × 0.7 mm3; 256 slices.
2.3. MRI preprocessing
Rs-fMRI data were preprocessed by the minimal preprocessing pipeline, including fMRIVolume and fMRISurface pipelines. The first pipeline removed spatial distortions, realigns volumes to compensate for subject motion, registers the fMRI data to the structural, reduces the bias field, normalizes the 4D image to a global mean, and masks the data with the final brain mask. The second pipeline aimed to take a volume timeseries and map it to the standard CIFTI grayordinate space used for subsequent resting-state analyses [see Glasser et al. (28) for more details]. To reduce the biophysical noise, we regressed our linear trend and further used CompCor to regress out nuisance covariates including five principal components of white matter and cerebrospinal fluid signals, and Friston 24 head motion parameters. Volumes that FD exceeded 0.5 mm were scrubbed. All images were filtered using a band-pass filter [1/w−0.1 Hz, high pass filtering using 1/w is suggested to remove spurious fluctuations in dynamic FC, when a certain window size w is given (29)].
2.4. Temporal variability of FC
2.4.1. Regional-level variability
We used the 300 ROI set from Greene lab as nodes of the whole brain functional network (30) because it further added additional nodes from subcortical and cerebellar structures based on Power 264 atlas (31). To characterize the temporal variability of a specific brain region, all BOLD time series were first segmented into n overlapping windows with length l (19, 20, 32). Within the ith window, a q × q Pearson correlation matrix (q = the number of nodes) describes the FC architecture of the whole brain (Fi). The FC architecture of ROI k at time window i is denoted by F(i,k), which represents the whole-brain functional architecture of region k. Then, the variability of FC architecture for a brain region k is defined as follows:
Similarly, we computed Vk at different window lengths [l = 20, 22, 24, … 40 s, (19, 20, 32)] and then took the arithmetic average value as the final variability to avoid the arbitrary choice of time window length. Notable, higher Vk of a region indicates that more functional communities of this region will be involved across time (20).
2.4.2. Within- or between-networks variability
In order to assess the dynamic interactions within- and between-networks, we divided the 300 ROIs into nine prior brain networks, which are consisted of seven networks defined by Yeo et al. (33), including VN, dorsal attention network (DAN), ventral attention network (VAN), SMN, FPN, DMN, and LN. The basal ganglia and cerebellum were treated as a single network, given it was poorly defined into different resting-state FC networks as well as its special role in understanding pathophysiologic mechanisms in obesity (34, 35). Then, we defined variability of functional architecture within- or between-networks in a similar method adopted in the regional variability above (19). For a given brain network m, all FCs within this network in window i were reshaped as 1D vector, Fmi; similarly, for all FCs' between-network, I and p in window i were denoted as 1D vector, Fmi, lmi, p. Then, the variability of FC architecture within-network m across n windows (which is shortened as within-network variability in the follow-up sections) is defined as follows:
The variability of FC architecture between-network l and p is defined as follows:
A high value of within- or between-network variability means the FC architecture within the network, or the interaction between networks, has frequent information communication across different time windows but does not maintain a stable pattern (19).
2.5. Statistical analysis
For each regional node or network, the association between the variability of FC and BMI was investigated using linear regression analyses. We first examined the relationships between BMI and basic demographic variables. We found that BMI did not show a significant correlation with age (r = 0.0009, p = 0.85), sex (t = 1.86, p = 0.063), handedness (r = −0.077, p = 0.113), and race (t = 0.261, p = 0.795). However, BMI was significantly correlated with years of education (r = −0.165, p = 0.001). To rule out the potential effect of these basic demographic variables on the relationship between BMI and dynamic FC, age, sex, years of education, handedness, race (categorized as white or other), and mean FD were considered as covariates of no interest in the regression model. Considering the distribution of BMI did not follow the normal distribution (Kolmogorov–Smirnov test, p < 0.05), we used a permutation analysis of linear models (36), to determine the significance for all association analyses. The fundamental advantage of permutation inference is its reliance on weak assumptions regarding the data. By simply rearranging the observations, a null hypothesis can be tested in a straightforward manner. Despite the existence of nuisance effects or apparent outliers in the data, permutation inference retains its potency and effectively maintains type I error rate control (36). False discovery rate (FDR) correction was used to correct for multiple comparisons (37). We considered an FDR-corrected value of p < 0.05 to be significant.
3. Results
3.1. Demographics characteristic
Demographics and other behavioral characteristics of the final sample are shown in Table 1. The sample comprised 205 men and 223 women, had a mean age of 28.61 ± 3.75 years, was predominantly Caucasian (72.43%), and had a mean BMI of 25.86 ± 4.41 kg/m2.
3.2. Associations between BMI and variability of regional FC
The variability of FC in ventral OFC and the regions of VN (such as bilateral superior and middle occipital gyrus and lingual gyrus) were found to be positively associated with BMI (Figure 1 and Table 2).
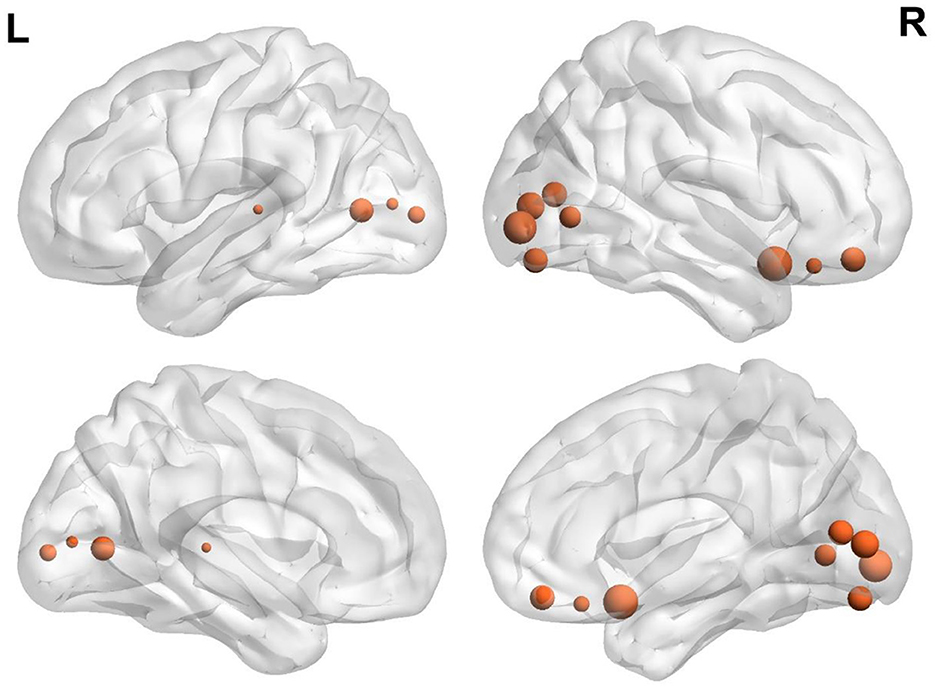
Figure 1. Brain regions demonstrate a significant correlation between BMI and regional temporal variability of FC architecture. The size was weighted by the partial correlation value. All results were shown after FDR corrected (p < 0.05).
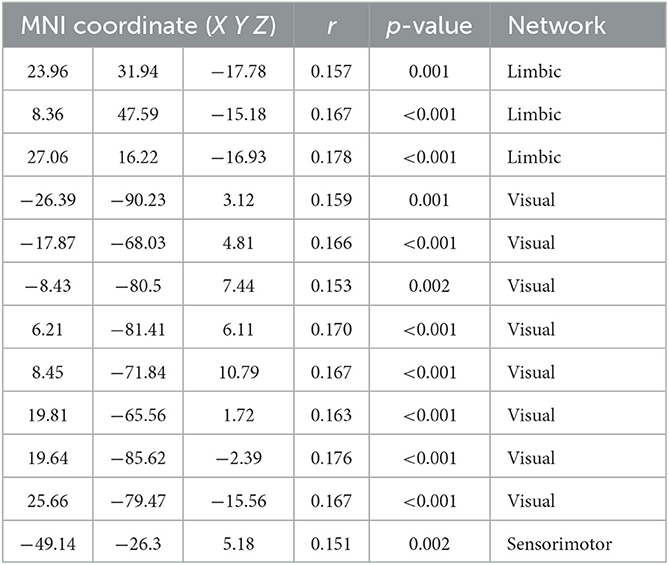
Table 2. Significant associations between BMI and variability of regional FC.
3.3. Associations between BMI and within-network variability of FC
At the within-network level, BMI was positively related to within-network variability in LN (partial r = 0.18, p < 0.001) and DMN (partial r = 0.12, p = 0.01, Figure 2).
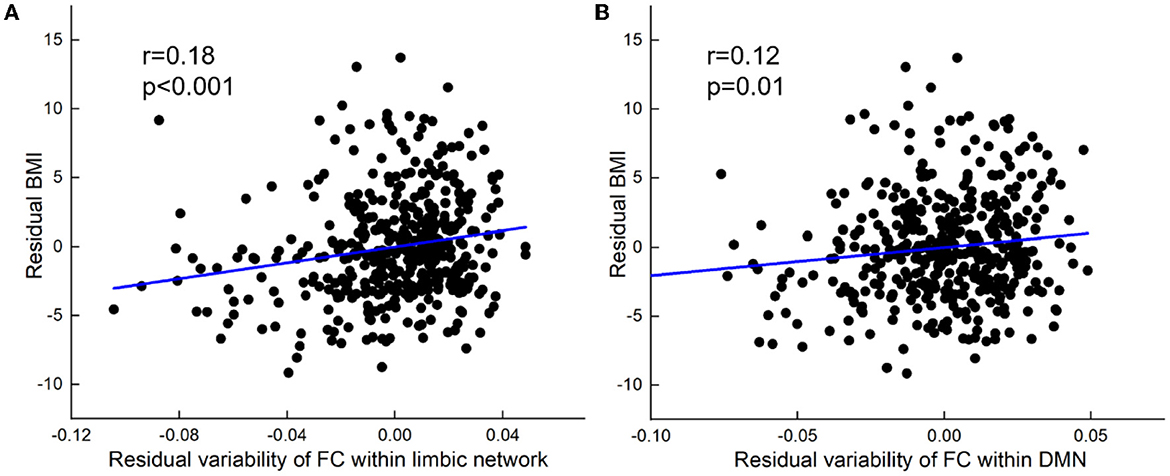
Figure 2. BMI relations to increased variability of FC within network-level. (A) Positive correlation between BMI and variability of FC within the limbic network. (B) Positive correlation between BMI and variability of FC within DMN. All results were shown after FDR corrected (p < 0.05).
3.4. Associations between BMI and between-networks variability of FC
At the inter-network level, variability of FC between LN and SMN (partial r = 0.14, p = 0.004), VAN (partial r = 0.141, p = 0.003), DMN (partial r = 0.16, p = 0.001), and FPN (partial r = 0.15, p = 0.002) showed positive correlations with BMI (Figure 3).
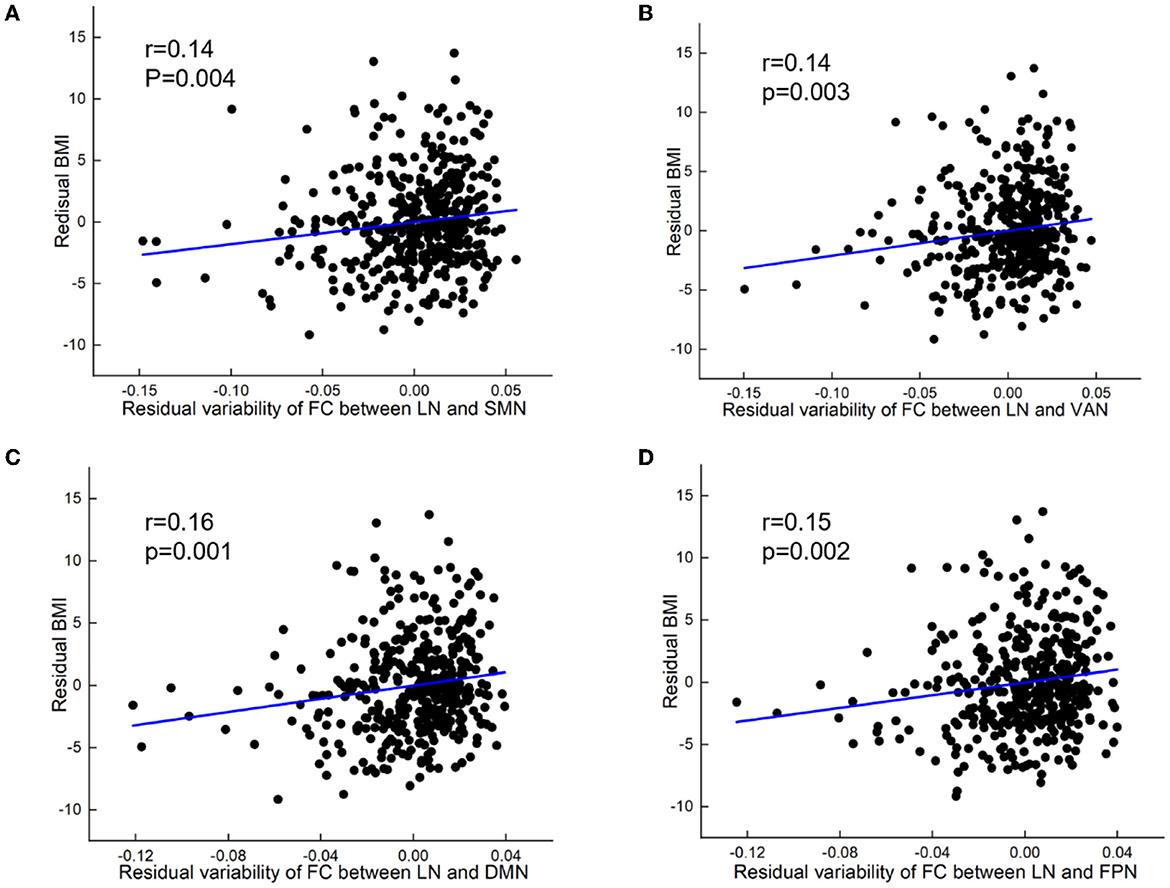
Figure 3. BMI relations to increased variability of FC between networks. (A) Positive correlation between BMI and variability of FC between limbic network and sensorimotor network (SMN). (B) Positive correlation between BMI and variability of FC between limbic network (LN) and ventral attention network (VAN). (C) Positive correlation between BMI and variability of FC between limbic network and default mode network (DMN). (D) Positive correlation between BMI and variability of FC between limbic network and frontoparietal network (FPN). All results were shown after FDR corrected (p < 0.05).
4. Discussion
In this current study, we investigated the association between BMI and variability of the dynamic functional brain network at regional, within-network, and between-network levels. At the regional level, we found that BMI was correlated with the temporal variability of FC in ventral OFC and visual regions. At the network level, the within-network variability of FC in LN and DMN showed a significantly positive association with BMI. In addition, the between-network variability of FC in LN with FPN, SMN, VAN, and DMN was also positively correlated with BMI. These findings provided novel evidence for abnormal dynamic functional interaction between the reward network (LN) and the rest of the brain in obesity, suggesting a more unstable state and over-frequent interaction of the reward network and other attention and cognitive networks. These findings provided novel evidence for the neurobiology theory of obesity that highlights the critical role of brain regions related to reward in susceptibility to obesity (5). These findings also provide novel insight into obesity interventions that need to decrease the dynamic interaction between reward network and other brain networks through behavioral treatment and neural modulation.
4.1. BMI associated with variability of regional FC in ventral OFC and visual regions
The variability of FC architecture in ventral OFC and the regions of VN (such as bilateral superior and middle occipital gyrus and lingual gyrus) was found to be positively associated with BMI. OFC involves in food reward processing and is most important for eating and obesity (12, 38, 39). Occipital and lingual gyrus are important in discriminating high- from low-caloric foods and have greater response to high-caloric foods (40, 41). Neuroimaging studies exploring the relationship between food cue-reactivity and obesity in adults have consistently found reward regions (e.g., OFC) and VN (42–44). Individuals with higher BMI had altered resting-state FC in OFC and visual areas (45), which was correlated with food bias (46). It should be noted that the variability of FC for a given region measures the temporal variability of FC between this given region and the rest of the regions of the brain across time windows. Therefore, higher BMI was linked to greater variability of FC in OFC and visual areas, which possibly indicated that high BMI may be related to more frequent information interaction between regions involving in food reward and attention and the rest of the brain.
4.2. BMI associated with within-network variability of FC
We found that BMI was positively related to within-network variability in LN and DMN. This result indicated that FC within LN and DMN network is changing synchronously across different time windows in individuals with higher BMI. Recent studies also found that obese individuals had disrupted dynamic FC in reward and default mode networks (17, 47). It is known that LN is the brain region most associated with food motivation (48, 49). Relative to children with normal weight, obese children had hyper-responsive to food stimuli in LN whether satiety or hunger (50). In addition, a previous resting-state fMRI found that obesity had stronger FC within LN than lean subjects (51). Our result of higher variability of FC in LN revealed that the unstable state of reward function at rest may be the neural correlates of individuals with higher BMI. DMN is a self-reflection and task-negative network that is anticorrelated with areas involved in executive control (52, 53). A previous study found that obese individuals showed altered spontaneous synchronicity within DMN (54). The higher variability of FC within DMN may suggest that abnormal self-integration is associated with higher BMI. Taken together, the higher variability within LN and DMN suggested an unstable pattern within LN and DMN, which provides dynamic neural interaction evidence related to obese vulnerability.
4.3. BMI associated with between-network variability of FC
Notably, between-networks variability of LN with FPN, SMN, VAN, and DMN showed a positive correlation with BMI. Similarly, the limbic reward system and its connections showed greater response to visual food cues in obese people, relative to those with normal weight (7, 8). Several neuroimaging studies have been proven that the stable and dynamic connections between these networks represented BMI variability (17, 45, 55–58). Dysfunctional FPN is widely considered the neural basis of obesity and overeating (59), which is indicative of executive control function (16). SMN is considered to govern the translation from goal-directed action to habitual behavior in obese individuals (60, 61). The activation of VAN mainly detects an attention bias to energy-dense and palatable food and over-consumption in disinhibited individuals (62). DMN involves self-reflection and integrating internal and external information (63). Evidence from fMRI studies manifested that the interaction between LN and this network was responsible for food reward processing (64, 65). We speculate these findings that individuals with high BMI may have more frequent information changes between LN and these cortical networks (involved in executive control, habitual behaviors, attention bias, and self-reflection), which further demonstrates that the limbic reward network plays a core role in the vulnerability of obesity from the perspective of temporal variability of FC.
4.4. Future directions and limitations
First, this was a cross-sectional study and therefore cannot indicate causal directionality, which requires a longitudinal study to further explore whether alterations in dynamic functional connectivity occur before or after weight gain. Second, this study used self-reported BMI. Future studies may consider the use of a medical body composition analyzer to measure BMI, which is more accurate than self-reported. Third, although several key covariates were considered in the analyses, the possible influence of other unmeasured variables such as genetics and personality on associations cannot be ignored. Finally, all participants in the study were selected from a young adult group. Caution is needed when generalizing our findings.
5. Conclusion
This current study reported alterations of temporal variability associated with BMI at regional, within-network, and between-network levels. Our results showed that high BMI was associated with greater regional variability in the ventral OFC and visual regions and higher temporal variability within LN as well as between LN and FPN, SMN, VAN, and DMN networks. These findings provided novel dynamic neural interaction evidence for the neurobiology theory of obesity that highlights the critical role of the brain system related to reward in susceptibility to obesity, which highlights that obesity interventions need to decrease the dynamic interaction between reward network and other brain networks through behavioral treatment and neural modulation.
Data availability statement
The datasets presented in this study can be found in online repositories. The names of the repository/repositories and accession number(s) can be found at: https://db.humanconnectome.org/app/template/Login.vm;jsessionid=7D797B490A8CCC42F73CECCCEC8AABCE.
Ethics statement
The study was approved by the Ethical Committee of Chongqing University of Posts and Telecommunications (protocol code: No. CQUPT2022057 and data of approval: 21 September 2021). The patients/participants provided their written informed consent to participate in this study. Written informed consent was obtained from the individual(s) for the publication of any potentially identifiable images or data included in this article.
Author contributions
YG: project administration, conceptualization, formal analysis, investigation, methodology, validation, visualization, writing—original draft, and writing—reviewing and editing. YX: writing—original draft and writing—reviewing and editing. KC: writing—reviewing and editing.
Funding
This study was funded by the National Natural Science Foundation of China (32000777), the National Natural Science Foundation of Chongqing (CSTB2022NSCQ-MSX0511), the Scientific Research Funds of Chongqing University of Posts and Telecommunications (E010A2018130), the Science and Technology Research Project of Chongqing Municipal Education Committee (KJQN202100631), and the Social Science Fund Project of Chongqing University of Posts and Telecommunications (K2019-18).
Acknowledgments
We are grateful for the open access dataset provided by the Human Connectome Project, Wu-Minn Consortium (Principal investigators: David Van Essen and Kamil Ugurbil; 1U54MH091657).
Conflict of interest
The authors declare that the research was conducted in the absence of any commercial or financial relationships that could be construed as a potential conflict of interest.
Publisher's note
All claims expressed in this article are solely those of the authors and do not necessarily represent those of their affiliated organizations, or those of the publisher, the editors and the reviewers. Any product that may be evaluated in this article, or claim that may be made by its manufacturer, is not guaranteed or endorsed by the publisher.
References
1. Swinburn BA, Sacks G, Hall KD, McPherson K, Finegood DT, Moodie ML, et al. The global obesity pandemic: shaped by global drivers and local environments. Lancet. (2011) 378:804–14. doi: 10.1016/S0140-6736(11)60813-1
2. World Health Organization. Obesity: Preventing and Managing the Global Epidemic. Geneva: WHO (2000).
3. Blüher M. Obesity: global epidemiology and pathogenesis. Nat Rev Endocrinol. (2019) 15:288–98. doi: 10.1038/s41574-019-0176-8
4. NCD Risk Factor Collaboration. Trends in adult body-mass index in 200 countries from 1975 to 2014: a pooled analysis of 1698 population-based measurement studies with 19· 2 million participants. Lancet. (2016) 387:1377–96. doi: 10.1016/S0140-6736(16)30054-X
5. Berridge KC, Ho CY, Richard JM, DiFeliceantonio AG. The tempted brain eats: pleasure and desire circuits in obesity and eating disorders. Brain Res. (2010) 1350:43–64. doi: 10.1016/j.brainres.2010.04.003
6. Batterham RL, Ffytche DH, Rosenthal JM, Zelaya FO, Barker GJ, Withers DJ, et al. PYY modulation of cortical and hypothalamic brain areas predicts feeding behaviour in humans. Nature. (2007) 450:106–9. doi: 10.1038/nature06212
7. Dimitropoulos A, Tkach J, Ho A, Kennedy J. Greater corticolimbic activation to high-calorie food cues after eating in obese vs. normal-weight adults. Appetite. (2012) 58:303–12. doi: 10.1016/j.appet.2011.10.014
8. Makaronidis JM, Batterham RL. Obesity, body weight regulation and the brain: insights from fMRI. Br J Radiol. (2018) 91:20170910. doi: 10.1259/bjr.20170910
9. Fox MD, Raichle ME. Spontaneous fluctuations in brain activity observed with functional magnetic resonance imaging. Nat Rev Neurosci. (2007) 8:700–11. doi: 10.1038/nrn2201
10. Hogenkamp PS, Zhou W, Dahlberg LS, Stark J, Larsen AL, Olivo G, et al. Higher resting-state activity in reward-related brain circuits in obese versus normal-weight females independent of food intake. Int J Obes. (2016) 40:1687–92. doi: 10.1038/ijo.2016.105
11. Kupis L, Goodman ZT, Kornfeld S, Romero C, Dirks B, Kircher L, et al. Body mass index moderates brain dynamics and executive function: a structural equation modeling approach. Aperture Neuro. (2022) 2021:1–22. doi: 10.52294/8944e106-c54b-40d7-a620-925f7b074f99
12. Rolls ET, Feng R, Cheng W, Feng J. Orbitofrontal cortex connectivity is associated with food reward and body weight in humans. Soc Cogn Affect Neurosci. (2023) 18:nsab083. doi: 10.1093/scan/nsab083
13. Beyer F, Kharabian Masouleh S, Huntenburg JM, Lampe L, Luck T, Riedel-Heller SG, et al. Higher body mass index is associated with reduced posterior default mode connectivity in older adults. Hum Brain Mapp. (2017) 38:3502–15. doi: 10.1002/hbm.23605
14. Faul L, Fogleman ND, Mattingly KM, Depue BE. Inhibitory control mediates a negative relationship between body mass index and intelligence: a neurocognitive investigation. Cogn Affect Behav Neurosci. (2019) 19:392–408. doi: 10.3758/s13415-019-00695-2
15. Hutchison RM, Womelsdorf T, Allen EA, Bandettini PA, Calhoun VD, Corbetta M, et al. Dynamic functional connectivity: promise, issues, and interpretations. Neuroimage. (2013) 80:360–78. doi: 10.1016/j.neuroimage.2013.05.079
16. Park BY, Lee MJ, Kim M, Kim SH, Park H. Structural and functional brain connectivity changes between people with abdominal and non-abdominal obesity and their association with behaviors of eating disorders. Front Neurosci. (2018) 12:741. doi: 10.3389/fnins.2018.00741
17. Tan Z, Li G, Zhang W, Wang J, Hu Y, Li H, et al. Obese individuals show disrupted dynamic functional connectivity between basal ganglia and salience networks. Cerebral Cortex. (2021) 31:5676–85. doi: 10.1093/cercor/bhab190
18. Zhu H, Huang J, Deng L, He N, Cheng L, Shu P, et al. Abnormal dynamic functional connectivity associated with subcortical networks in Parkinson's disease: a temporal variability perspective. Front Neurosci. (2019) 13:80. doi: 10.3389/fnins.2019.00080
19. Sun J, Liu Z, Rolls ET, Chen Q, Yao Y, Yang W, et al. Verbal creativity correlates with the temporal variability of brain networks during the resting state. Cereb Cortex. (2019) 29:1047–58. doi: 10.1093/cercor/bhy010
20. Zhang J, Cheng W, Liu Z, Zhang K, Lei X, Yao Y, et al. Neural, electrophysiological and anatomical basis of brain-network variability and its characteristic changes in mental disorders. Brain. (2016) 139:2307–21. doi: 10.1093/brain/aww143
21. Wijngaarden M, Veer I, Rombouts S, Van Buchem M, Van Dijk KW, Pijl H, et al. Obesity is marked by distinct functional connectivity in brain networks involved in food reward and salience. Behav Brain Res. (2015) 287:127–34. doi: 10.1016/j.bbr.2015.03.016
22. Van Essen DC, Smith SM, Barch DM, Behrens TE, Yacoub E, Ugurbil K, et al. The WU-Minn human connectome project: an overview. Neuroimage. (2013) 80:62–79. doi: 10.1016/j.neuroimage.2013.05.041
23. Power JD, Barnes KA, Snyder AZ, Schlaggar BL, Petersen SE. Spurious but systematic correlations in functional connectivity MRI networks arise from subject motion. Neuroimage. (2012) 59:2142–54. doi: 10.1016/j.neuroimage.2011.10.018
24. Elks CE, Den Hoed M, Zhao JH, Sharp SJ, Wareham NJ, Loos RJ, et al. Variability in the heritability of body mass index: a systematic review and meta-regression. Front Endocrinol. (2012) 3:29. doi: 10.3389/fendo.2012.00029
25. Sabuncu MR, Ge T, Holmes AJ, Smoller JW, Buckner RL, Fischl B, et al. Morphometricity as a measure of the neuroanatomical signature of a trait. Proc Natl Acad Sci. (2016) 113:E5749–56. doi: 10.1073/pnas.1604378113
26. Cai B, Zhang G, Zhang A, Xiao L, Hu W, Stephen JM, et al. Functional connectome fingerprinting: identifying individuals and predicting cognitive functions via autoencoder. Hum Brain Mapp. (2021) 42:2691–705. doi: 10.1002/hbm.25394
27. Cui Z, Gong G. The effect of machine learning regression algorithms and sample size on individualized behavioral prediction with functional connectivity features. Neuroimage. (2018) 178:622–37. doi: 10.1016/j.neuroimage.2018.06.001
28. Glasser MF, Sotiropoulos SN, Wilson JA, Coalson TS, Fischl B, Andersson JL, et al. The minimal preprocessing pipelines for the Human Connectome Project. Neuroimage. (2013) 80:105–24. doi: 10.1016/j.neuroimage.2013.04.127
29. Leonardi N, Van De Ville D. On spurious and real fluctuations of dynamic functional connectivity during rest. Neuroimage. (2015) 104:430–6. doi: 10.1016/j.neuroimage.2014.09.007
30. Seitzman BA, Gratton C, Marek S, Raut RV, Dosenbach NU, Schlaggar BL, et al. A set of functionally-defined brain regions with improved representation of the subcortex and cerebellum. Neuroimage. (2020) 206:116290. doi: 10.1016/j.neuroimage.2019.116290
31. Power JD, Cohen AL, Nelson SM, Wig GS, Barnes KA, Church JA, et al. Functional network organization of the human brain. Neuron. (2011) 72:665–78. doi: 10.1016/j.neuron.2011.09.006
32. Dong D, Duan M, Wang Y, Zhang X, Jia X, Li Y, et al. Reconfiguration of dynamic functional connectivity in sensory and perceptual system in schizophrenia. Cerebral Cortex. (2019) 29:3577–89. doi: 10.1093/cercor/bhy232
33. Yeo BT, Krienen FM, Sepulcre J, Sabuncu MR, Lashkari D, Hollinshead M, et al. The organization of the human cerebral cortex estimated by intrinsic functional connectivity. J Neurophysiol. (2011) 106:1125–65. doi: 10.1152/jn.00338.2011
34. Mueller K, Sacher J, Arelin K, Holiga Š, Kratzsch J, Villringer A, et al. Overweight and obesity are associated with neuronal injury in the human cerebellum and hippocampus in young adults: a combined MRI, serum marker and gene expression study. Transl Psychiatry. (2012) 2:e200. doi: 10.1038/tp.2012.121
35. Tan Z, Hu Y, Ji G, Li G, Ding Y, Zhang W, et al. Alterations in functional and structural connectivity of basal ganglia network in patients with obesity. Brain Topogr. (2022) 35:453–63. doi: 10.1007/s10548-022-00906-z
36. Winkler AM, Ridgway GR, Webster MA, Smith SM, Nichols TE. Permutation inference for the general linear model. Neuroimage. (2014) 92:381–97. doi: 10.1016/j.neuroimage.2014.01.060
37. Benjamini Y, Hochberg Y. Controlling the false discovery rate: a practical and powerful approach to multiple testing. J R Stat Society Series B. (1995) 57:289–300. doi: 10.1111/j.2517-6161.1995.tb02031.x
38. Dong D, Wang Y, Long Z, Jackson T, Chang X, Zhou F, et al. The association between body mass index and intra-cortical myelin: findings from the human connectome project. Nutrients. (2021) 13:3221. doi: 10.3390/nu13093221
39. Kringelbach ML. The human orbitofrontal cortex: linking reward to hedonic experience. Nat Rev Neurosci. (2005) 6:691–702. doi: 10.1038/nrn1747
40. Killgore WD, Young AD, Femia LA, Bogorodzki P, Rogowska J, Yurgelun-Todd DA, et al. Cortical and limbic activation during viewing of high-versus low-calorie foods. Neuroimage. (2003) 19:1381–94. doi: 10.1016/S1053-8119(03)00191-5
41. Toepel U, Knebel JF, Hudry J, le Coutre J, Murray MM. The brain tracks the energetic value in food images. Neuroimage. (2009) 44:967–74. doi: 10.1016/j.neuroimage.2008.10.005
42. García-García I, Jurado MA, Garolera M, Segura B, Marques-Iturria I, Pueyo R, et al. Functional connectivity in obesity during reward processing. Neuroimage. (2013) 66:232–9. doi: 10.1016/j.neuroimage.2012.10.035
43. Kullmann S, Pape AA, Heni M, Ketterer C, Schick F, Häring HU, et al. Functional network connectivity underlying food processing: disturbed salience and visual processing in overweight and obese adults. Cereb Cortex. (2013) 23:1247–56. doi: 10.1093/cercor/bhs124
44. Rapuano KM, Huckins JF, Sargent JD, Heatherton TF, Kelley WM. Individual differences in reward and somatosensory-motor brain regions correlate with adiposity in adolescents. Cereb Cortex. (2016) 26:2602–11. doi: 10.1093/cercor/bhv097
45. Sadler JR, Shearrer GE, Burger KS. Body mass variability is represented by distinct functional connectivity patterns. Neuroimage. (2018) 181:55–63. doi: 10.1016/j.neuroimage.2018.06.082
46. Osimo SA, Piretti L, Ionta S, Rumiati RI, Aiello M. The neural substrates of subliminal attentional bias and reduced inhibition in individuals with a higher BMI: a VBM and resting state connectivity study. Neuroimage. (2021) 229:117725. doi: 10.1016/j.neuroimage.2021.117725
47. Park BY, Moon T, Park H. Dynamic functional connectivity analysis reveals improved association between brain networks and eating behaviors compared to static analysis. Behav Brain Res. (2018) 337:114–21. doi: 10.1016/j.bbr.2017.10.001
48. Hinton EC, Parkinson JA, Holland AJ, Arana FS, Roberts C, Owen A, et al. Neural contributions to the motivational control of appetite in humans. Eur J Neurosci. (2004) 20:1411–8. doi: 10.1111/j.1460-9568.2004.03589.x
49. Smith KS, Berridge KC. Opioid limbic circuit for reward: interaction between hedonic hotspots of nucleus accumbens and ventral pallidum. J Neurosci. (2007) 27:1594–605. doi: 10.1523/JNEUROSCI.4205-06.2007
50. Bruce AS, Holsen LM, Chambers RJ, Martin LE, Brooks WM, Zarcone JR, et al. Obese children show hyperactivation to food pictures in brain networks linked to motivation, reward and cognitive control. Int J Obes. (2010) 34:1494–500. doi: 10.1038/ijo.2010.84
51. Lips MA, Wijngaarden MA, van der Grond J, van Buchem MA, de Groot G, Rombouts SA, et al. Resting-state functional connectivity of brain regions involved in cognitive control, motivation, and reward is enhanced in obese females. Am J Clin Nutr. (2014) 100:524–31. doi: 10.3945/ajcn.113.080671
52. Fox MD, Snyder AZ, Vincent JL, Corbetta M, Van Essen DC, Raichle ME, et al. The human brain is intrinsically organized into dynamic, anticorrelated functional networks. Proc Nat Acad Sci. (2005) 102:9673–8. doi: 10.1073/pnas.0504136102
53. Whitfield-Gabrieli S, Ford JM. Default mode network activity and connectivity in psychopathology. Annu Rev Clin Psychol. (2012) 8:49–76. doi: 10.1146/annurev-clinpsy-032511-143049
54. Ding Y, Ji G, Li G, Zhang W, Hu Y, Liu L, et al. Altered interactions among resting-state networks in individuals with obesity. Obesity. (2020) 28:601–8. doi: 10.1002/oby.22731
55. Borowitz MA, Yokum S, Duval ER, Gearhardt AN. Weight-related differences in salience, default mode, and executive function network connectivity in adolescents. Obesity. (2020) 28:1438–46. doi: 10.1002/oby.22853
56. Li G, Hu Y, Zhang W, Wang J, Ji W, Manza P, et al. Brain functional and structural magnetic resonance imaging of obesity and weight loss interventions. Mol Psychiatry. (2023) 28:1466–79. doi: 10.1038/s41380-023-02025-y
57. Mokhtari F, Rejeski WJ, Zhu Y, Wu G, Simpson SL, Burdette JH, et al. Dynamic fMRI networks predict success in a behavioral weight loss program among older adults. Neuroimage. (2018) 173:421–33. doi: 10.1016/j.neuroimage.2018.02.025
58. Syan SK, McIntyre-Wood C, Minuzzi L, Hall G, McCabe RE, MacKillop J, et al. Dysregulated resting state functional connectivity and obesity: a systematic review. Neurosci Biobehav Rev. (2021) 131:270–92. doi: 10.1016/j.neubiorev.2021.08.019
59. Wang Y, Dong D, Chen X, Gao X, Liu Y, Xiao M, et al. Individualized morphometric similarity predicts body mass index and food approach behavior in school-age children. Cereb Cortex. (2022) 33:4794–805. doi: 10.1093/cercor/bhac380
60. Balleine BW, O'doherty JP. Human and rodent homologies in action control: corticostriatal determinants of goal-directed and habitual action. Neuropsychopharmacology. (2010) 35:48–69. doi: 10.1038/npp.2009.131
61. Horstmann A, Dietrich A, Mathar D, Pössel M, Villringer A, Neumann J, et al. Slave to habit? Obesity is associated with decreased behavioural sensitivity to reward devaluation. Appetite. (2015) 87:175–83. doi: 10.1016/j.appet.2014.12.212
62. Hege MA, Stingl KT, Veit R, Preissl H. Modulation of attentional networks by food-related disinhibition. Physiol Behav. (2017) 176:84–92. doi: 10.1016/j.physbeh.2017.02.023
63. Nair J, Klaassen A-L, Arato J, Vyssotski AL, Harvey M, Rainer G, et al. Basal forebrain contributes to default mode network regulation. Proc Natl Acad Sci. (2018) 115:1352–7. doi: 10.1073/pnas.1712431115
64. Nummenmaa L, Hirvonen J, Hannukainen JC, Immonen H, Lindroos MM, Salminen P, et al. Dorsal striatum and its limbic connectivity mediate abnormal anticipatory reward processing in obesity. PLoS ONE. (2012) 7:e31089. doi: 10.1371/journal.pone.0031089
65. Olivo G, Wiemerslage L, Swenne I, Zhukowsky C, Salonen-Ros H, Larsson EM, et al. Limbic-thalamo-cortical projections and reward-related circuitry integrity affects eating behavior: a longitudinal DTI study in adolescents with restrictive eating disorders. PLoS ONE. (2017) 12:e0172129. doi: 10.1371/journal.pone.0172129
Keywords: obesity, body mass index, resting-state connectivity, temporal variability, reword network
Citation: Guo Y, Xia Y and Chen K (2023) The body mass index is associated with increased temporal variability of functional connectivity in brain reward system. Front. Nutr. 10:1210726. doi: 10.3389/fnut.2023.1210726
Received: 23 April 2023; Accepted: 24 May 2023;
Published: 14 June 2023.
Edited by:
Qinghua He, Southwest University, ChinaReviewed by:
Fali Li, University of Electronic Science and Technology of China, ChinaShaoqiang Han, First Affiliated Hospital of Zhengzhou University, China
Copyright © 2023 Guo, Xia and Chen. This is an open-access article distributed under the terms of the Creative Commons Attribution License (CC BY). The use, distribution or reproduction in other forums is permitted, provided the original author(s) and the copyright owner(s) are credited and that the original publication in this journal is cited, in accordance with accepted academic practice. No use, distribution or reproduction is permitted which does not comply with these terms.
*Correspondence: Yiqun Guo, Z3VveXFAY3F1cHQuZWR1LmNu
†These authors have contributed equally to this work
‡ORCID: Yiqun Guo orcid.org/0000-0003-3167-6348