 Alexia Geny
 Maité Petitjean1
 Virginie Van Wymelbeke-Delannoy
 Claire Sulmont-Rossé
- 1Centre des Sciences du Goût et de l'Alimentation, CNRS, INRAE, Institut Agro, Université de Bourgogne, Dijon, France
- 2CHU Dijon Bourgogne, Unité de recherche Pôle Personnes Âgées, Dijon, France
Background: “Do it yourself” (DIY) food-based fortification involves adding fortificants into everyday foods. It is a flexible solution that allows older people with reduced appetite to meet their nutritional needs.
Objectives: The aims of the systematic review are (a) to describe DIY fortified recipes, (b) to evaluate their acceptability, and (c) to evaluate whether they are effective levers to improve nutritional outcomes in older people.
Methods: A systematic search of 3 databases (Web of Science, PubMed, Scopus, last searched on January 2022) was undertaken. Main eligibility criteria include older adults aged ≥60 years living at home, in an institution or in hospital. Studies carried out for a specific medical condition or targeting only micronutrient fortification were excluded. After reviewing all titles/abstracts then full-text papers, key data were extracted and synthesized narratively. The quality of included studies was assessed using Kmet et al.
Results: Of 21,493 papers extracted, 44 original studies were included (3,384 participants), with 31 reporting nutritional outcomes, 3 reporting acceptability outcomes and 10 reporting both nutritional and acceptability outcomes. The review highlighted a wide variety of DIY fortified recipes, with additional energy ranging from 23 to 850 kcal/d (M = 403; SE = 62) and/or protein ranging from 4 to 40 g/d (M = 19; SE = 2). Compared to a standard diet, DIY fortification seems to be a valuable strategy for increasing energy and protein intake in older people. However, no strong evidence was observed on the nutritional status.
Implication for future: Further acceptability studies are crucial to ensure that DIY fortified foods are palatable and thus have a significant impact on the nutritional status. In addition, it would be useful for studies to better describe DIY recipes. This information would result in a better understanding of the factors that maximize the impact of DIY fortification on nutritional outcomes. Study registration: PROSPERO no. CRD42021244689.
Systematic review registration: PROSPERO: https://www.crd.york.ac.uk/prospero/display_record.php?ID=CRD42021244689.
1. Introduction
Contrary to common beliefs, our nutritional needs decrease little with age and are sometimes higher in late adulthood than in early adulthood. With regard to caloric intake, the European Food Safety Authority (1) recommends a daily allowance from 2000 to 2,500 Kcal for people aged 50 to 59 and from 1800 to 2,300 Kcal for people aged 70 to 79. More recently Volkert et al. (2) established that recommended energy intake should reach 30 Kcal per kg of body weight per day. With regard to protein intake, recent works carried out by the PROT-AGE consortium (3) and by the European Society for Clinical Nutrition and Metabolism (EPSEN) (4) show that older people need to ingest more protein than younger people to stay healthy, to maintain their abilities and to fight infections. As a result, the daily protein intake should be 1 to 1.2 g protein per kg of body weight per day for a healthy person over 60 versus 0.8 to 1 g per kg of body weight in younger adults. The literature review by Shad et al. (5) highlighted the importance of a constant distribution of protein intake over the main meals of the day at amounts of 25–30 g/meal to avoid catabolic protein status [see also (3, 6)].
At the same time, a decline in appetite can appear with aging (7). Various studies have reported that 31 to 56% of the aged population are “small eaters” (8–10). Small eaters are characterized by a low consumption of every food category compared to the overall population – they eat foods in small or even very small amounts (8–11). A recent French survey carried out by CREDOC (“Centre de Recherche pour l’Observation et les Conditions de Vie”) showed that 87% of adults aged 18–54 met the recommendations for protein intake compared with only 56% of those over 65 (12). This situation is even worse when older adults are frail and dependent. In an aged population receiving a Home-Delivery Meal (HDM) service or living in nursing homes, Sulmont-Rossé and Van Wymelbeke (13) observed that 7–8 out of 10 people did not meet their energy and/or protein needs. This study also showed that 55% of home-delivery meal recipients and 46% of people living in nursing homes had energy and/or protein intake lower than 2/3 of the recommendations. In addition to age, many factors can be at the origin of this decline in appetite, such as physiological changes, sensory decline and eating/swallowing difficulties, which appear during aging. It also can be related to “life-breaking moments” (e.g., widowhood, illness, dependence) that can amplify iatrogenic factors correlated with medications and affect sociological/psychological aspects (13). Thus, poor appetite in older adults leads to a decrease in food and nutrient intake, which increases the risk of undernutrition (14, 15). Undernutrition, a recognized pathology in the older population, corresponds to an imbalance between nutritional intake and the body’s needs. This imbalance leads to weight loss, a decrease in muscle reserves and an alteration of the body’s defences. In older people, undernutrition increases the risk of falls and therefore fractures. It contributes to the increase in infectious morbidity (16), nosocomial infections (17) and the appearance of pressure ulcers (18). If left untreated, undernutrition can induce or aggravate a state of fragility and dependence, which affects the quality of life and life expectancy of our elders (16, 19).
Understanding the factors responsible for appetite decline is certainly important, but a major challenge is to get older people with reduced appetite to fulfill their nutritional needs in order to prevent undernutrition and the associated consequences. Food-based fortification, which consists in incorporating ingredients of nutritional interest (namely “fortificants”) in commonly consumed foods (20) in order to deliberately increasing the content of an essential nutrient in a diet without increasing (too much) the volume to be ingested, is acknowledged to be a relevant approach for older adults with reduced appetite (21). Fortificants can be: (a) regular food products (e.g., semolina, oils, butter, cream, pureed nuts, egg), or (b) macronutrients extracts (e.g., whey protein isolate, milk protein concentrate, caseinate, maltodextrin) (22, 23). Besides the numerous fortified foods developed and marketed by the food industry, “do it yourself” (DIY) fortification recipes empower older adults and their carers to take a personalized approach to their nutrition and current diet. DIY fortification is a flexible strategy that may fit better with older people’s food habits and preferences: older people (or their carers) add fortificants to the food they usually eat, during the preparation of daily meals. This constitutes a significant advantage in the older population, which is often reluctant to change their consumption habits. However, DIY fortification remains largely unknown and underused by older adults as well as by caregivers and healthcare professionals although it is now known to be a relevant approach to counterbalance appetite decline and to adjust to nutritional needs (24).
The goal of the present study was to conduct a systematic review of all studies related to the nutritional and acceptability aspects of DIY food-based fortification in older people. The aims of this review are (a) to describe the DIY food-based fortification solutions and recipes that have been developed, (b) to evaluate the acceptability of these solutions in older people, and (c) to evaluate whether these solutions can be relevant and effective levers to preserve or improve nutritional outcomes in older people.
2. Materials and methods
The present systematic review followed the approach proposed by Xiao and Watson (25), which summarizes the evidence available on a topic to convey the breadth and depth of that topic. The protocol was written using the Preferred Reporting Items for Systematic Reviews and Meta-analysis Protocols (PRISMA-P, (26), see Supplementary material). The protocol was deposited on the HAL website1 and on PROSPERO with the registration number CRD42021244689. The PRISMA checklist is available on the Supplementary material.
2.1. Research question
The research question is: “What are the objectives, characteristics and results of existing research conducted on the nutritional issues and/or on acceptability among older people receiving DIY fortified foods?”
2.2. Inclusion and exclusion criteria
The PICOS (Population, Intervention, Comparator, Outcome, Study design) eligibility criteria was as follows (27):
Population: Any studies focusing on adults aged 60 years and older living either at home, in an institution or in hospital was eligible for inclusion. Older adults of all nutritional status, cognitive status and oral ability (e.g., chewing, swallowing) were eligible for inclusion. Studies carried out in the context of a specific medical condition (e.g., cardiac rehabilitation, renal failure, cancers, diabetes) were excluded.
Intervention: Any DIY food-based fortification intervention was eligible for inclusion (e.g., incorporating ingredients of nutritional interest in food products). Fortification in energy and/or macronutrients was eligible for inclusion. Studies without an intervention (e.g., observational studies) were relevant for inclusion. Were excluded from the review: (a) studies targeting only micronutrient fortification, non-food dietary supplement or bio-fortification (genetically modified crop), (b) studies using only fortified food developed and marketed by the Food Industry, and (c) interventions targeting artificial nutrition (e.g., tube feeding, parenteral feeding, enteral feeding).
Comparators: As the present review aimed at compiling DIY food-based fortification recipes and reporting their acceptability, any comparator was eligible for inclusion (e.g., studies comparing food-based fortification versus Oral Nutritional Supplements (ONS), or studies comparing two types of fortified food). In addition, studies without a comparator were eligible for inclusion.
Outcomes: Three categories of outcomes were considered: (a) characterization of the nutritional intake (e.g., dietary pattern, nutrient intake), (b) characterization of the nutritional status (e.g., body mass index (BMI), weight, undernutrition) and (c) characterization of the acceptability (e.g., liking, preference, pleasure).
Study design: All types of study design including interventional and observational design were eligible. All period of times and duration of follow-up were eligible.
Other: No restriction was set for the publication date. Only publications written in English were included because of the uncertainty surrounding the words used to refer to the concept of “DIY food-based fortification” in foreign languages. Narrative review, conference abstracts, editorials, and grey literature were excluded.
2.3. Information sources and search strategy
A search strategy with both thesaurus and free-text terms was developed – after repeated attempts and adjustments – to retrieve relevant articles in the following databases: Web of Science (WOS), PubMed and Scopus (Supplementary material). Separate title, abstract and keywords searches were conducted for older people, food-based fortification and outcomes in February 2021. An update was performed in January 2022. The results for the three separate search strings were combined to identify relevant articles. Afterwards, for further screening, references from selected articles and systematic reviews were checked manually in case they were not identified during the whole search process. After duplicates removal, titles and abstracts in the first step and full texts in a second step were screened by two independent reviewers (AG and MP) according to the agreed inclusion and exclusion criteria. For each screening level, a training exercise was conducted before the starting of the screening process on a random sample of 100 titles and abstracts and 10 full texts to ensure high inter-reviewer reliability. Disagreements between reviewers were resolved by consensus or by consulting a third reviewer (CSR or VVW). The reasons for exclusion were recorded at the full-text stage (the list of excluded studies at the full-text stage and the reasons of exclusion are presented on Supplementary material).
2.4. Charting the data
A standardized data summarization form was developed a priori and revised, as needed, after the completion of a training exercise completed on a sample of 5 articles. All included studies were summarized by two reviewers (AG and MP), independently, with conflicts resolved by a third reviewer (CSR or VVW). The data summarization included the following items:
- Article identifiers (authors, year of publication)
- Study identifiers (objective, design, country)
- Population (age, gender, sample size, inclusion and exclusion criteria)
- Intervention (description of the DIY fortification recipes)
- Comparator (if applicable)
- Outcomes (endpoints, measurement method, main results)
2.5. Quality assessments
All included studies were independently assessed for quality by two reviewers (AG and MP); conflicts were resolved by consensus. The articles’ quality was assessed with the quality assessment criteria developed by Kmet et al. (28). The criteria are presented in Supplementary material. In addition, the description quality of the DIY fortification recipes (fortificants, food matrices, concentration) was assessed (but not included in the quality score).
2.6. Collating, summarizing and reporting the results
A descriptive numerical summary of the characteristics of the included studies was performed. Tables and graphs were created to reflect the number of studies included, study designs and settings, publication years, the characteristics of the study populations, the outcomes reported, and the countries where the studies were conducted. In line with systematic literature review guidelines, the quality of the included studies was assessed (25, 29).
3. Results
3.1. Characteristics of the included studies
On the 21,493 articles retrieved, 253 records were kept for full text screening and 49 studies were included in the systematic review: 44 original studies (Figure 1; 3,384 participants) and 5 systematic literature reviews (21–24, 30). The reasons for excluding papers were: no original research (n = 18), wrong population (n = 18), no DIY food-based fortification (n = 135), fortification with micronutrients only (n = 15), wrong outcomes (n = 18). Wrong outcomes included functional outcomes (muscle strength), gastric emptying, glycemia, gut hormones, bone mineral density, quality of life. Two articles (31, 32) were excluded because they did not provide enough information about the nutritional strategy used.
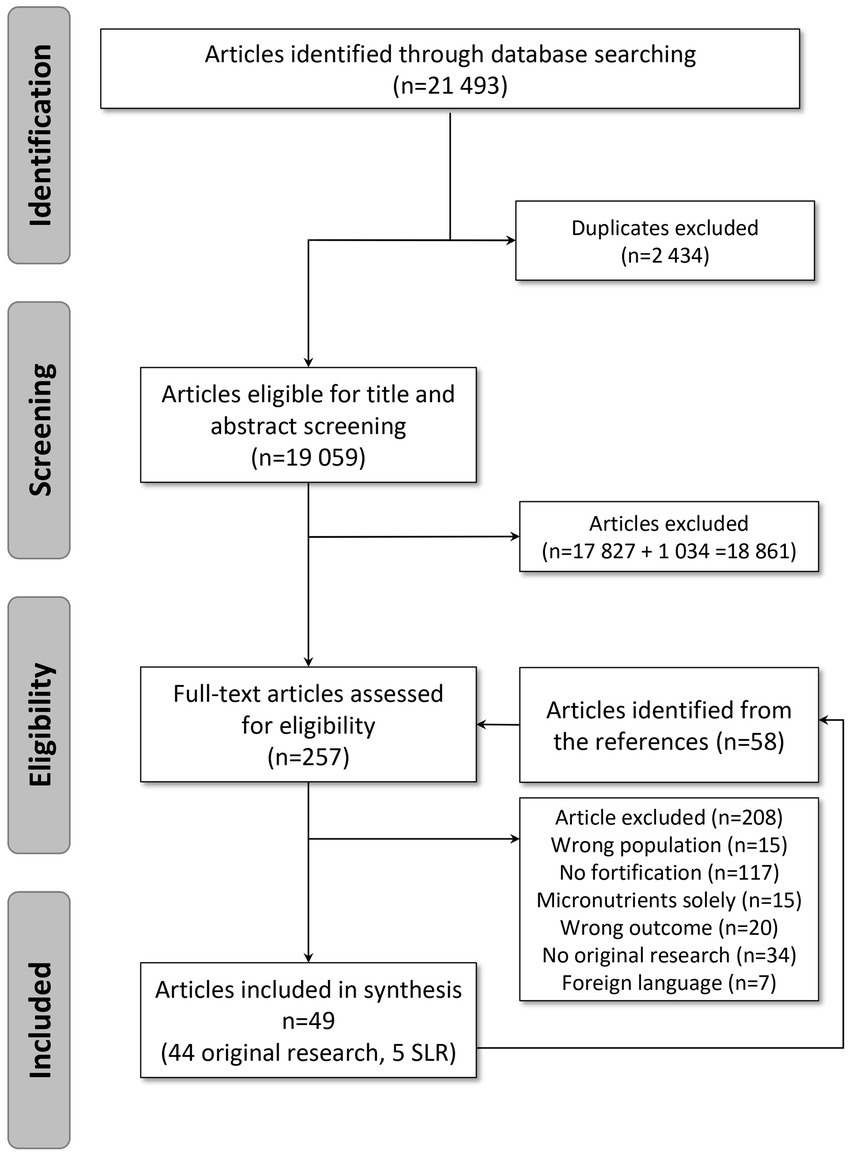
Figure 1. PRISMA flow diagram.
The included articles were published between 1996 and 2021, and most were published after 2011 (n = 34) (Table 1). The studies mainly took place in Europe (n = 33). The rest took place in Australia (n = 4), North America (n = 4) or Asia (n = 3). The setting was most often the hospital (n = 20) followed by nursing homes (n = 13) and home setting (n = 13). Twenty-seven studies of the selection were longitudinal with follow-up times between 10 days to 12 months and 16 studies were cross-sectional (Table 1). In addition, 30 studies used a between-subject design while 13 studies used a within-subject design; only 1 study was observational. Finally, sample sizes varied (ranging from 7 to 320 participants), but most studies recruited 20 to 49 subjects (n = 17).
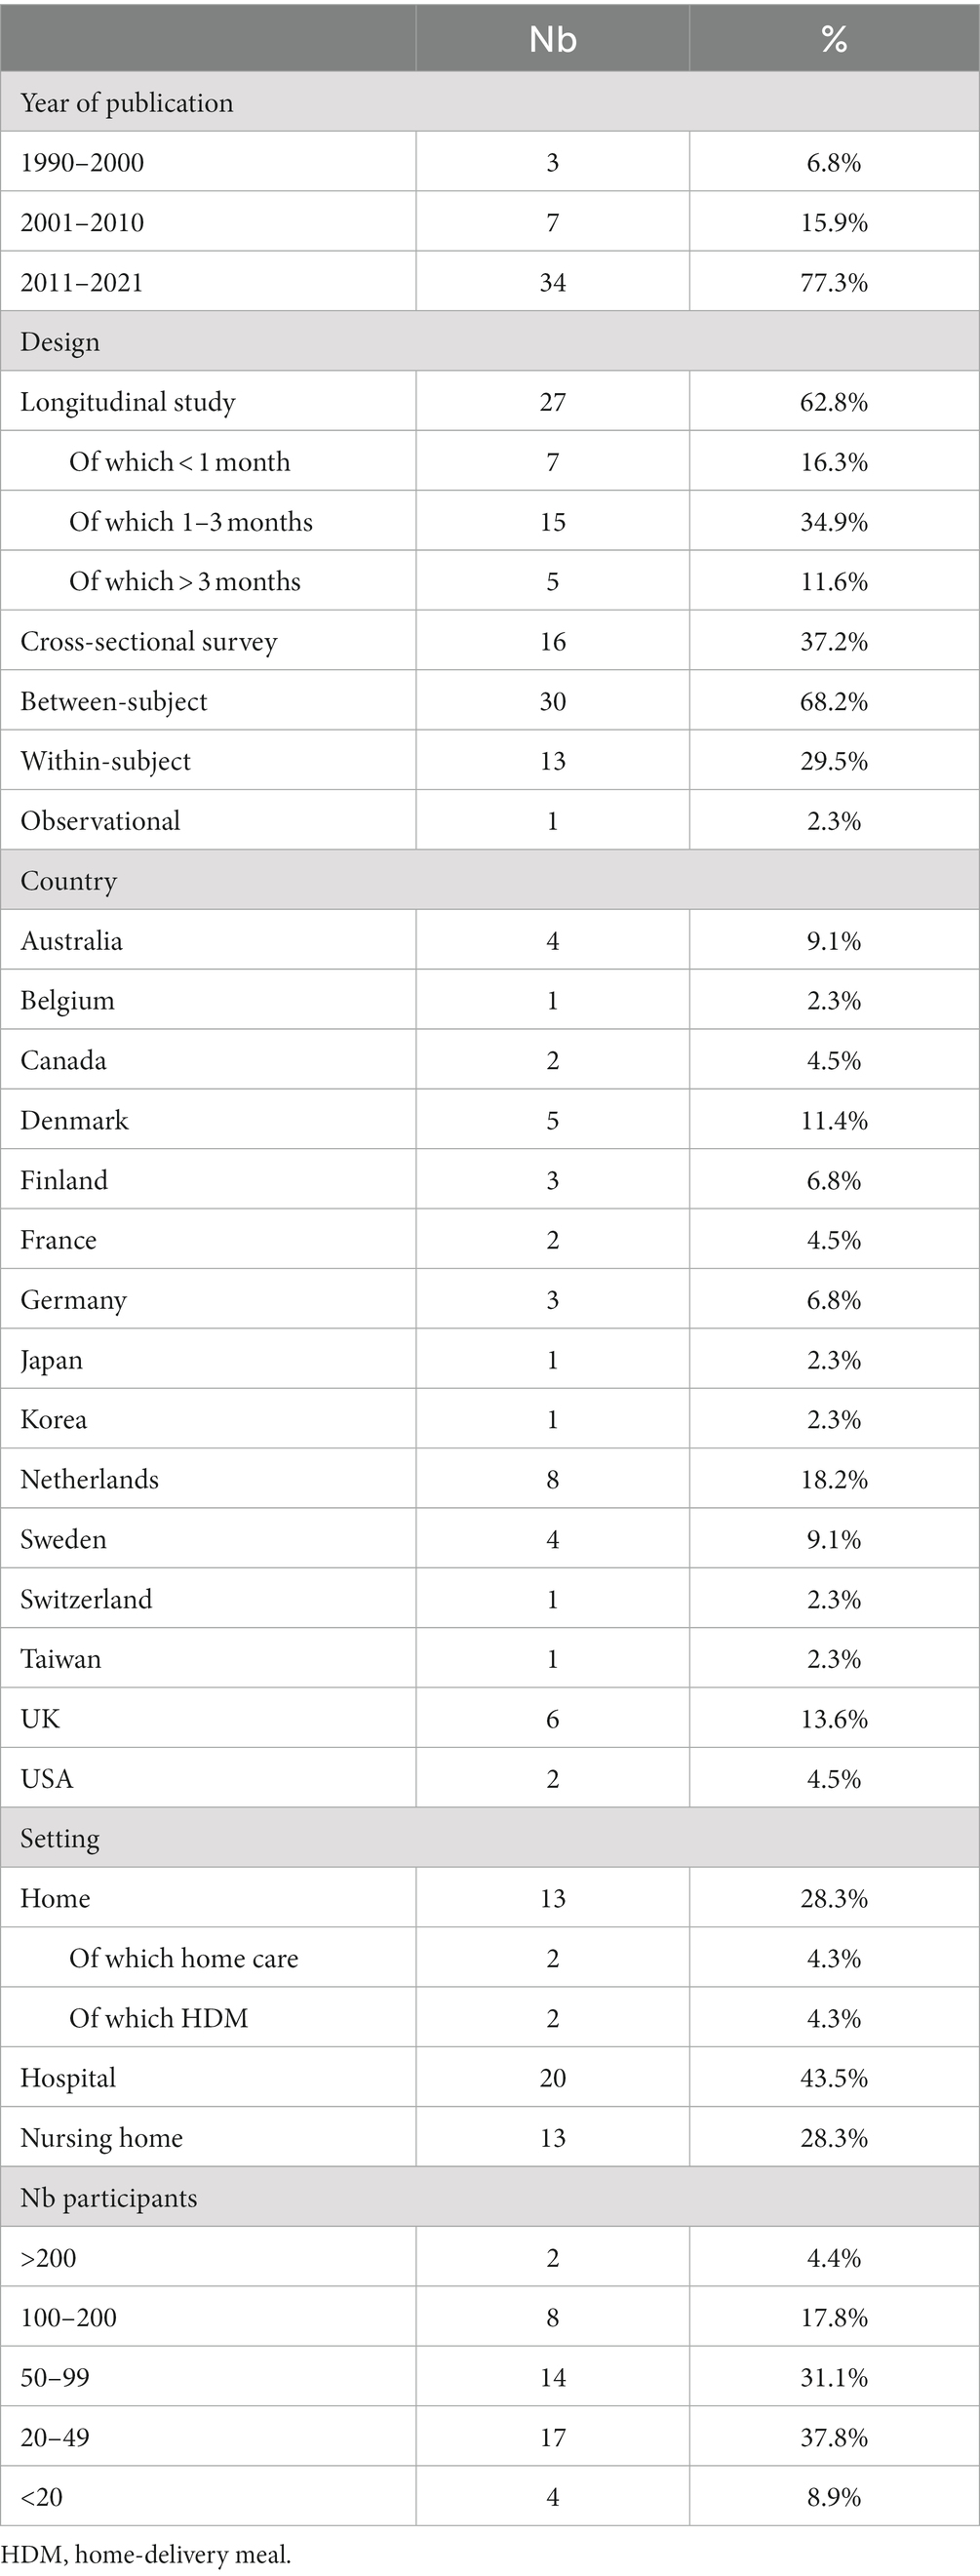
Table 1. Characteristics of the systematic literature review articles.
Among the 44 original research studies, 3 were fully focused on the acceptability outcome (33–35). Among the 41 remaining articles, the majority (n = 31) were entirely dedicated to nutritional outcomes. Finally, 10 articles were “mixed” and assessed both nutritional and acceptability outcomes.
A descriptive summary of the included studies yielded the four following topics:
- Description of DIY fortification recipes: which types of food are fortified? Which nutrients are added? In what form? At which concentration?
- Assessment of DIY fortified foods acceptability: to which extent do older people like fortified food? Do the sensory characteristics of fortified foods fulfil older people’ sensory expectations and preferences?
- Assessment of the nutritional impact of DIY food-based fortification: did older people who received fortified food improve their nutritional intake and nutritional status compared to a standard diet?
- Comparison of DIY food-based fortification with other alternatives (e.g., dietary counseling, Oral Nutritional Supplement – ONS): is fortified food more acceptable and/or does it provide a nutritional benefit compared to other alternatives?
3.2. Quality assessment
A quality assessment was performed for each outcome, i.e., nutritional outcome and acceptability outcome (Supplementary material). In fact, in mixed articles, different panels and designs were often used for nutritional and acceptability outcomes.
Regarding nutritional outcomes, the methodological quality of the studies was in general good with an average quality score of 0.92 (standard deviation: 0.09) ranging from 0.62 (36) to 1 (37–54) (Supplementary material). Overall, recruitment of participants was the variable that was the most poorly rated in the selected studies. This was because the majority of studies did not detail the recruitment procedure nor the precise localization where the study took place. Sample size and control for confounding factors were badly rated because a large number of studies did not reach an appropriate sample size or did not consider confounding variables (e.g., age, gender, Body Mass Index (BMI), weight, nutrition status) in data analysis. Study design and subject description factors were moderately rated due to insufficient/incoherent information preventing clear understanding of concerned articles.
The methodological quality of the 13 studies related to acceptability outcomes was on the whole lower than for the nutritional outcomes, with an average quality score of 0.75 (standard deviation: 0.23) ranging from 0.33 (37) to 1 (33, 43, 44) (Supplementary material). Usually, recruitment of participants, sample size, analytic methods and results were the lowest rated factors. As for the nutritional quality assessment, the majority of studies did not detail the recruitment procedure nor the precise localization where the study took place. Moreover, most studies did not clearly describe the analytic method used when it was mentioned. For 4 criteria (sample size, results, outcomes measures and study design) the poor quality is related to the fact that the acceptability measure was not the main outcome of the article.
Finally, the description of the DIY fortification recipes was also poorly rated: very few studies provided precise information about food matrices, fortificants and recipes.
3.3. Description of DIY fortified recipes
Table 2 shows the description of the DIY fortified recipes. On the whole, 7 articles implemented energy fortification, 18 implemented protein fortification and 19 implemented a combination of protein and energy fortification. It should be noted that 10 articles did not specify the nature of food matrices (38, 44, 55, 58, 61, 64, 65, 67, 72, 74) and 5 articles did not specify the nature of the fortificants (50, 53, 56, 57, 74). Only 8 articles provided enough details about the recipes for them to be reproduced by a third party (33–35, 39, 46, 49, 54, 73).

Table 2. Description of DIY fortified recipes.
Overall, 137 DIY fortified recipes were listed: 75 savory and 62 sweet. Among these recipes, 64 were meant to be eaten cold and 67 were meant to be eaten hot (6 can be eaten cold or hot). The food matrices included desserts (n = 20 articles; mousse, pie, muffin, cake, biscuit, ice-cream…), meat and fish dishes (n = 18; meatball, chicken sticks, marinated duck, baked salmon…), side dishes (n = 17; purée, sautéed vegetables), dairy products (n = 17; milk, yoghurt, cream), soups (n = 14), carbohydrate-based dishes (n = 14; oatmeal, cereal, risotto, pancake), beverages (n = 9; fruit juice, tea), sauces (n = 9), breads (n = 8), fruits (n = 7; compote/purée, salad, smoothie), eggs dishes (n = 3; omelet) and pulse-based dishes (n = 1). It is interesting to note that food matrices included both liquids (milk, soup, fruit juice…), semi-liquid foods (purée, yoghurt…) and solid foods (cake, chicken sticks, bread). There was a large variability in the number of matrices used for fortification in the articles. Twelve articles used one only matrix category to be fortified (33–36, 39, 40, 46, 49, 52, 54, 75, 77). Munk et al. (66) developed 36 fortified dishes in collaboration with dietitians, chefs and patients from a hospital. These dishes covered a large range of different food types (soup, meat and fish dishes, vegetable dishes, bread, dessert, beverages).
Twenty different fortificants were identified across all the studies, including 10 regular food ingredients and 10 macronutrient isolates or concentrates. Four articles (38, 45, 59, 66) did not provide enough details about fortificants (“high fat dairy food,” “dairy,” “non-dairy substitute,” “natural energy-dense ingredient,” “protein powder,” “soy origin”), thus they could not be classified. Seven fortificants targeted energy fortification, 8 targeted protein fortification and 5 targeted both. Most of the fortificants were powdered (n = 11). Other fortificants were solid (n = 4), semi-liquid (n = 3) or liquid (n = 2). Energy fortificants included cream (n = 20 articles), butter/margarine (n = 13), oils (n = 10), carbohydrates (n = 7), hydrolyzed starch (n = 1), mayonnaise (n = 1) and maize (n = 1). Protein fortificants included whey protein (n = 15 articles), protein concentrates/isolates (n = 5; Protifar, Hyperprotidine, L-Carnitine…), soy (n = 3), pea (n = 2), meat (n = 2), collagen (n = 1), casein (n = 1), and gelatine (n = 1). Energy and protein fortificants included milk powder (n = 10), cheese (n = 7), milk (n = 5), eggs (n = 3) and almonds (n = 3). Finally, Figures 2, 3 illustrate the wide variability regarding the additional load of energy and protein provided by fortified food across the studies. This additional load varies from 23 to 850 kcal / day for energy (M = 403; SE = 62) and from 4 to 40 g / day for protein (M = 19; SE = 2).
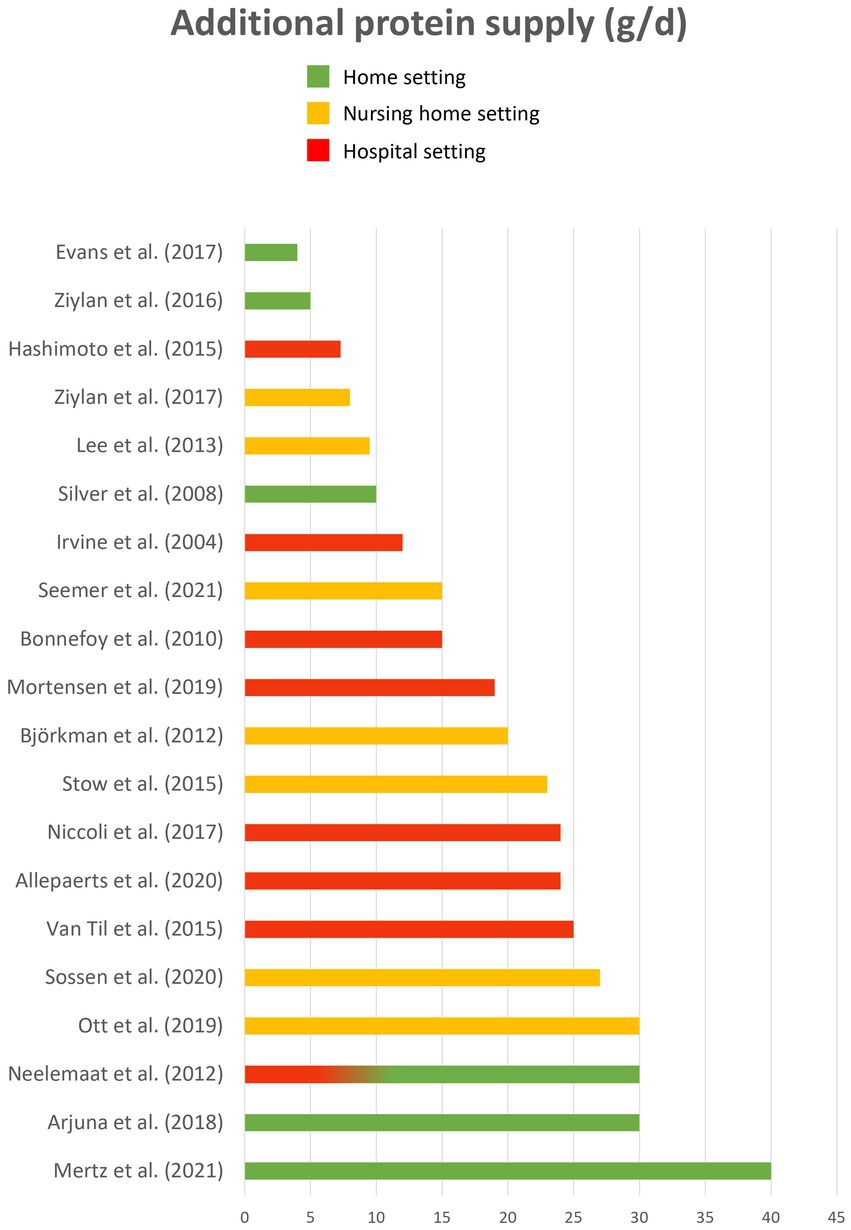
Figure 2. Additional protein load (g/d).
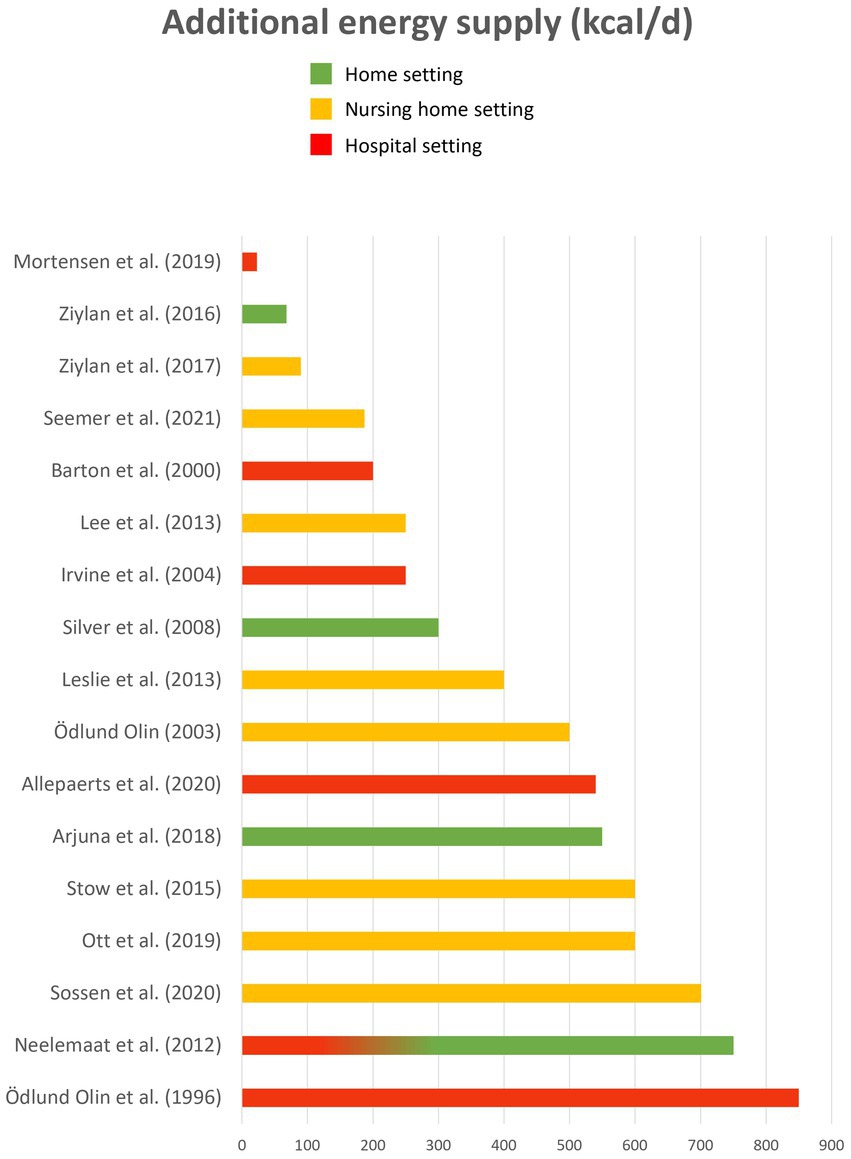
Figure 3. Additional energy load (kcal/d).
3.4. Assessment of DIY fortified foods acceptability
Thirteen studies have assessed consumer acceptability for DIY fortified foods (Table 3). All these studies conducted the acceptability evaluation with older people except for one (71), who asked nursing home staff to provide feedback on product acceptance based on residents’ observation. Six articles (33, 34, 43, 44, 52, 59) used liking scales to assess product acceptance while the others only collected qualitative data through interviews, focus groups or an acceptability survey. However, most of the articles do not provide enough information about the methodology used to assess acceptability and/or about the results. In most of the articles (n = 10/13), acceptability was only a secondary outcome while nutrition was the first one. In these studies, acceptability tests were usually conducted with the same sample as the one recruited for nutritional assessment (the whole sample in 6 articles; a smaller sub-sample in 2 articles). Three articles (33–35) were dedicated to assessing acceptability of DIY fortified foods versus regular foods.
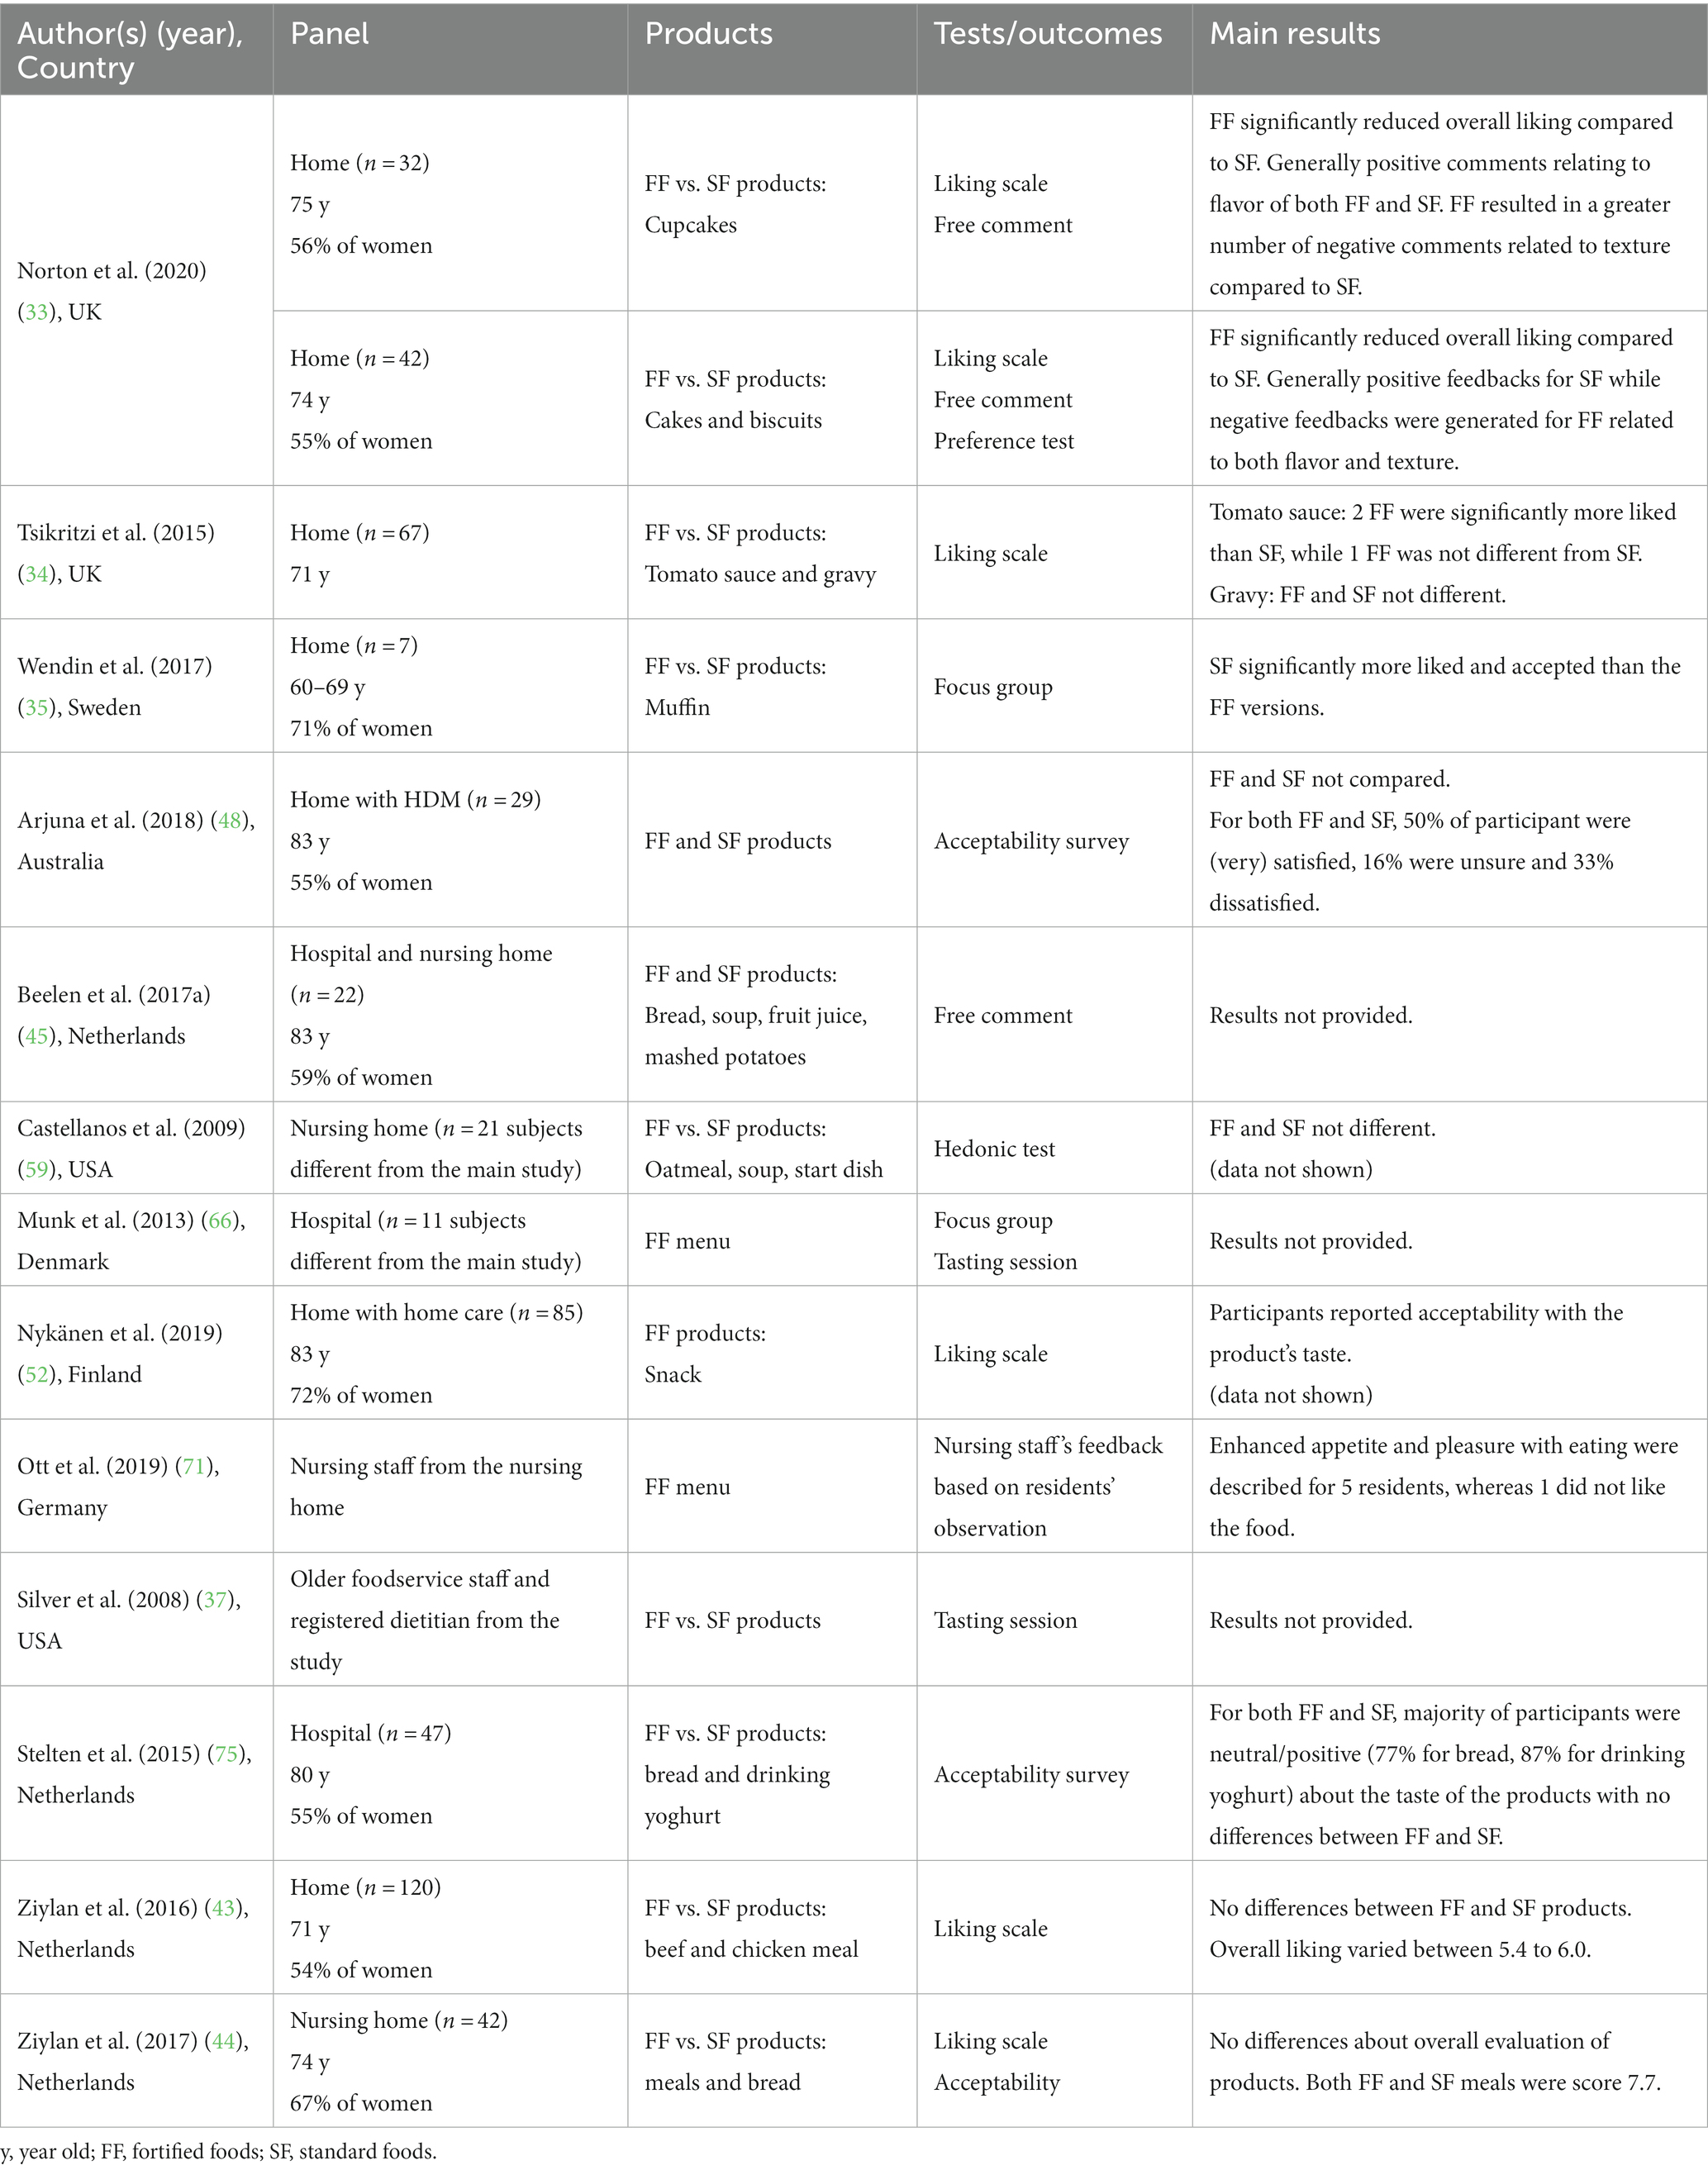
Table 3. DIY fortified food acceptability assessment.
Seven articles provided results on comparison between DIY fortified and regular foods. Among them, 4 articles (37, 43, 44, 59, 75) reported no significant difference in acceptability when comparing fortified and regular foods while 2 articles (33, 35) reported that fortified foods were less appreciated than regular food. Only one article reported that some fortified foods were more appreciated than regular food, but it depended on the nature of the fortificant added to the food (34). In fact, tomato sauce fortified with cream or with a mix of whey protein and maltodextrin were more liked than regular tomato sauce, but tomato sauce fortified with butter was less liked than regular tomato sauce. Wendin et al. (35) also showed some difference between foods fortified with different fortificants: the regular muffin was more liked than the muffin fortified with almond flour, which was more liked than the whey muffin, itself more liked than the soy muffin.
3.5. Assessment of the nutritional impact of DIY food-based fortification
Forty studies assessed the impact of diet enrichment including DIY food-based fortification on nutritional outcomes (food and/or nutrient intakes, nutritional status or body weight) compared to a standard diet (Table 4). Among these studies, 3 combined DIY food-based and diet-based fortification (i.e., modifying the diet by adding nutritionally rich foods), 6 combined food-based fortification and fortified foods marketed by the Food Industry, 1 combined food-based fortification and Oral Nutritional Supplements (ONS), and 2 combined food-based fortification, diet-based fortification and ONS, while 27 studies assessed the impact of DIY food-based fortification alone. Nutritional intake was mainly measured by using dietary record. Nutritional status was mainly assessed by measuring body weight or BMI (20 studies), by using the Mini-Nutritional Assessment Questionnaire [MNA, 8 studies – (39, 48, 49, 52, 57, 72, 73, 77)] or by measuring muscle mass [4 studies – (39, 46, 49, 58)]. A few studies used other indicators such as the Subjective Global Assessment (74) or albumin and pre-albmin (40, 47, 52, 58, 72).

Table 4. Comparison between DIY fortified diet and standard diet on nutritional outcomes.
When all the studies are considered, results highlight that provided protein-fortified foods led to a significant increase in protein intake (26 studies over 29) and that provided energy-fortified led to a significant increase in energy intake (15 studies over 20). Only a few studies showed a significant impact of DIY fortification on nutritional status compared to regular food offer: 3 out 8 observed a significant impact on MNA score, 7 out 20 observed a significant impact on body weight or BMI and 2 out 4 observed a significant impact on muscle mass. None observed a negative impact.
When only the studies which assessed the impact of DIY fortification alone are considered (in bold in the Table 4), results still highlight that provided protein-fortified foods led to a significant increase in protein intake (16 studies over 18) and that provided energy-fortified led to a significant increase in energy intake (9 studies over 13). Only a few studies showed a significant impact of DIY fortification on nutritional status compared to regular food offer: 1 out 5 observed a significant impact on MNA score, 4 out 13 observed a significant impact on body weight or BMI and 1 out 3 observed a significant impact on muscle mass.
3.6. Comparison of DIY food-based fortification with other alternatives
Seven studies evaluated two DIY food-based fortification strategies with either different energy/protein loads (36, 49, 59), different fortificants (46, 61, 65) or different portion sizes (43). Four studies compared DIY food-based fortification with another alternative such as ONS (76), (74), adding high-energy and/or high-protein food items to the menu (55), or increased staff assistance to older people during mealtime (50) (Table 5). However, very few studies have produced statistics to compare the different options. Not surprisingly, higher energy/protein loads are associated with higher energy/protein intake (36, 49). However, there was no significant difference between the 1.2 and the 1.5 g of protein / kg of body weight / day in the evolution of nutritional status and muscle mass over the 12-week intervention (49). In Ziylan et al. (43), the reduced-size enriched chicken meal led to a significantly higher energy intake than the normal-size meal. However, the difference in intake was rather small and no impact of portion size was observed for the enriched beef meals. In Evans et al. (46), a combination of three amino acids significantly improved muscle mass over 2 months while no change was observed when a single amino acid was used to fortify the orange juice. Stow et al. (76) observed no difference between food-based fortification and ONS while Sossen et al. (74) observed a slight advantage for DIY food-based fortification compared to ONS. Energy and protein intakes were higher with DIY fortification than with ONS, and body weight was stable with DIY fortification whereas it decreased with ONS during the 6 months of follow-up. Finally, providing DIY fortified food led to higher energy and protein intake when compared with improving staff assistance to older people during mealtime (50).
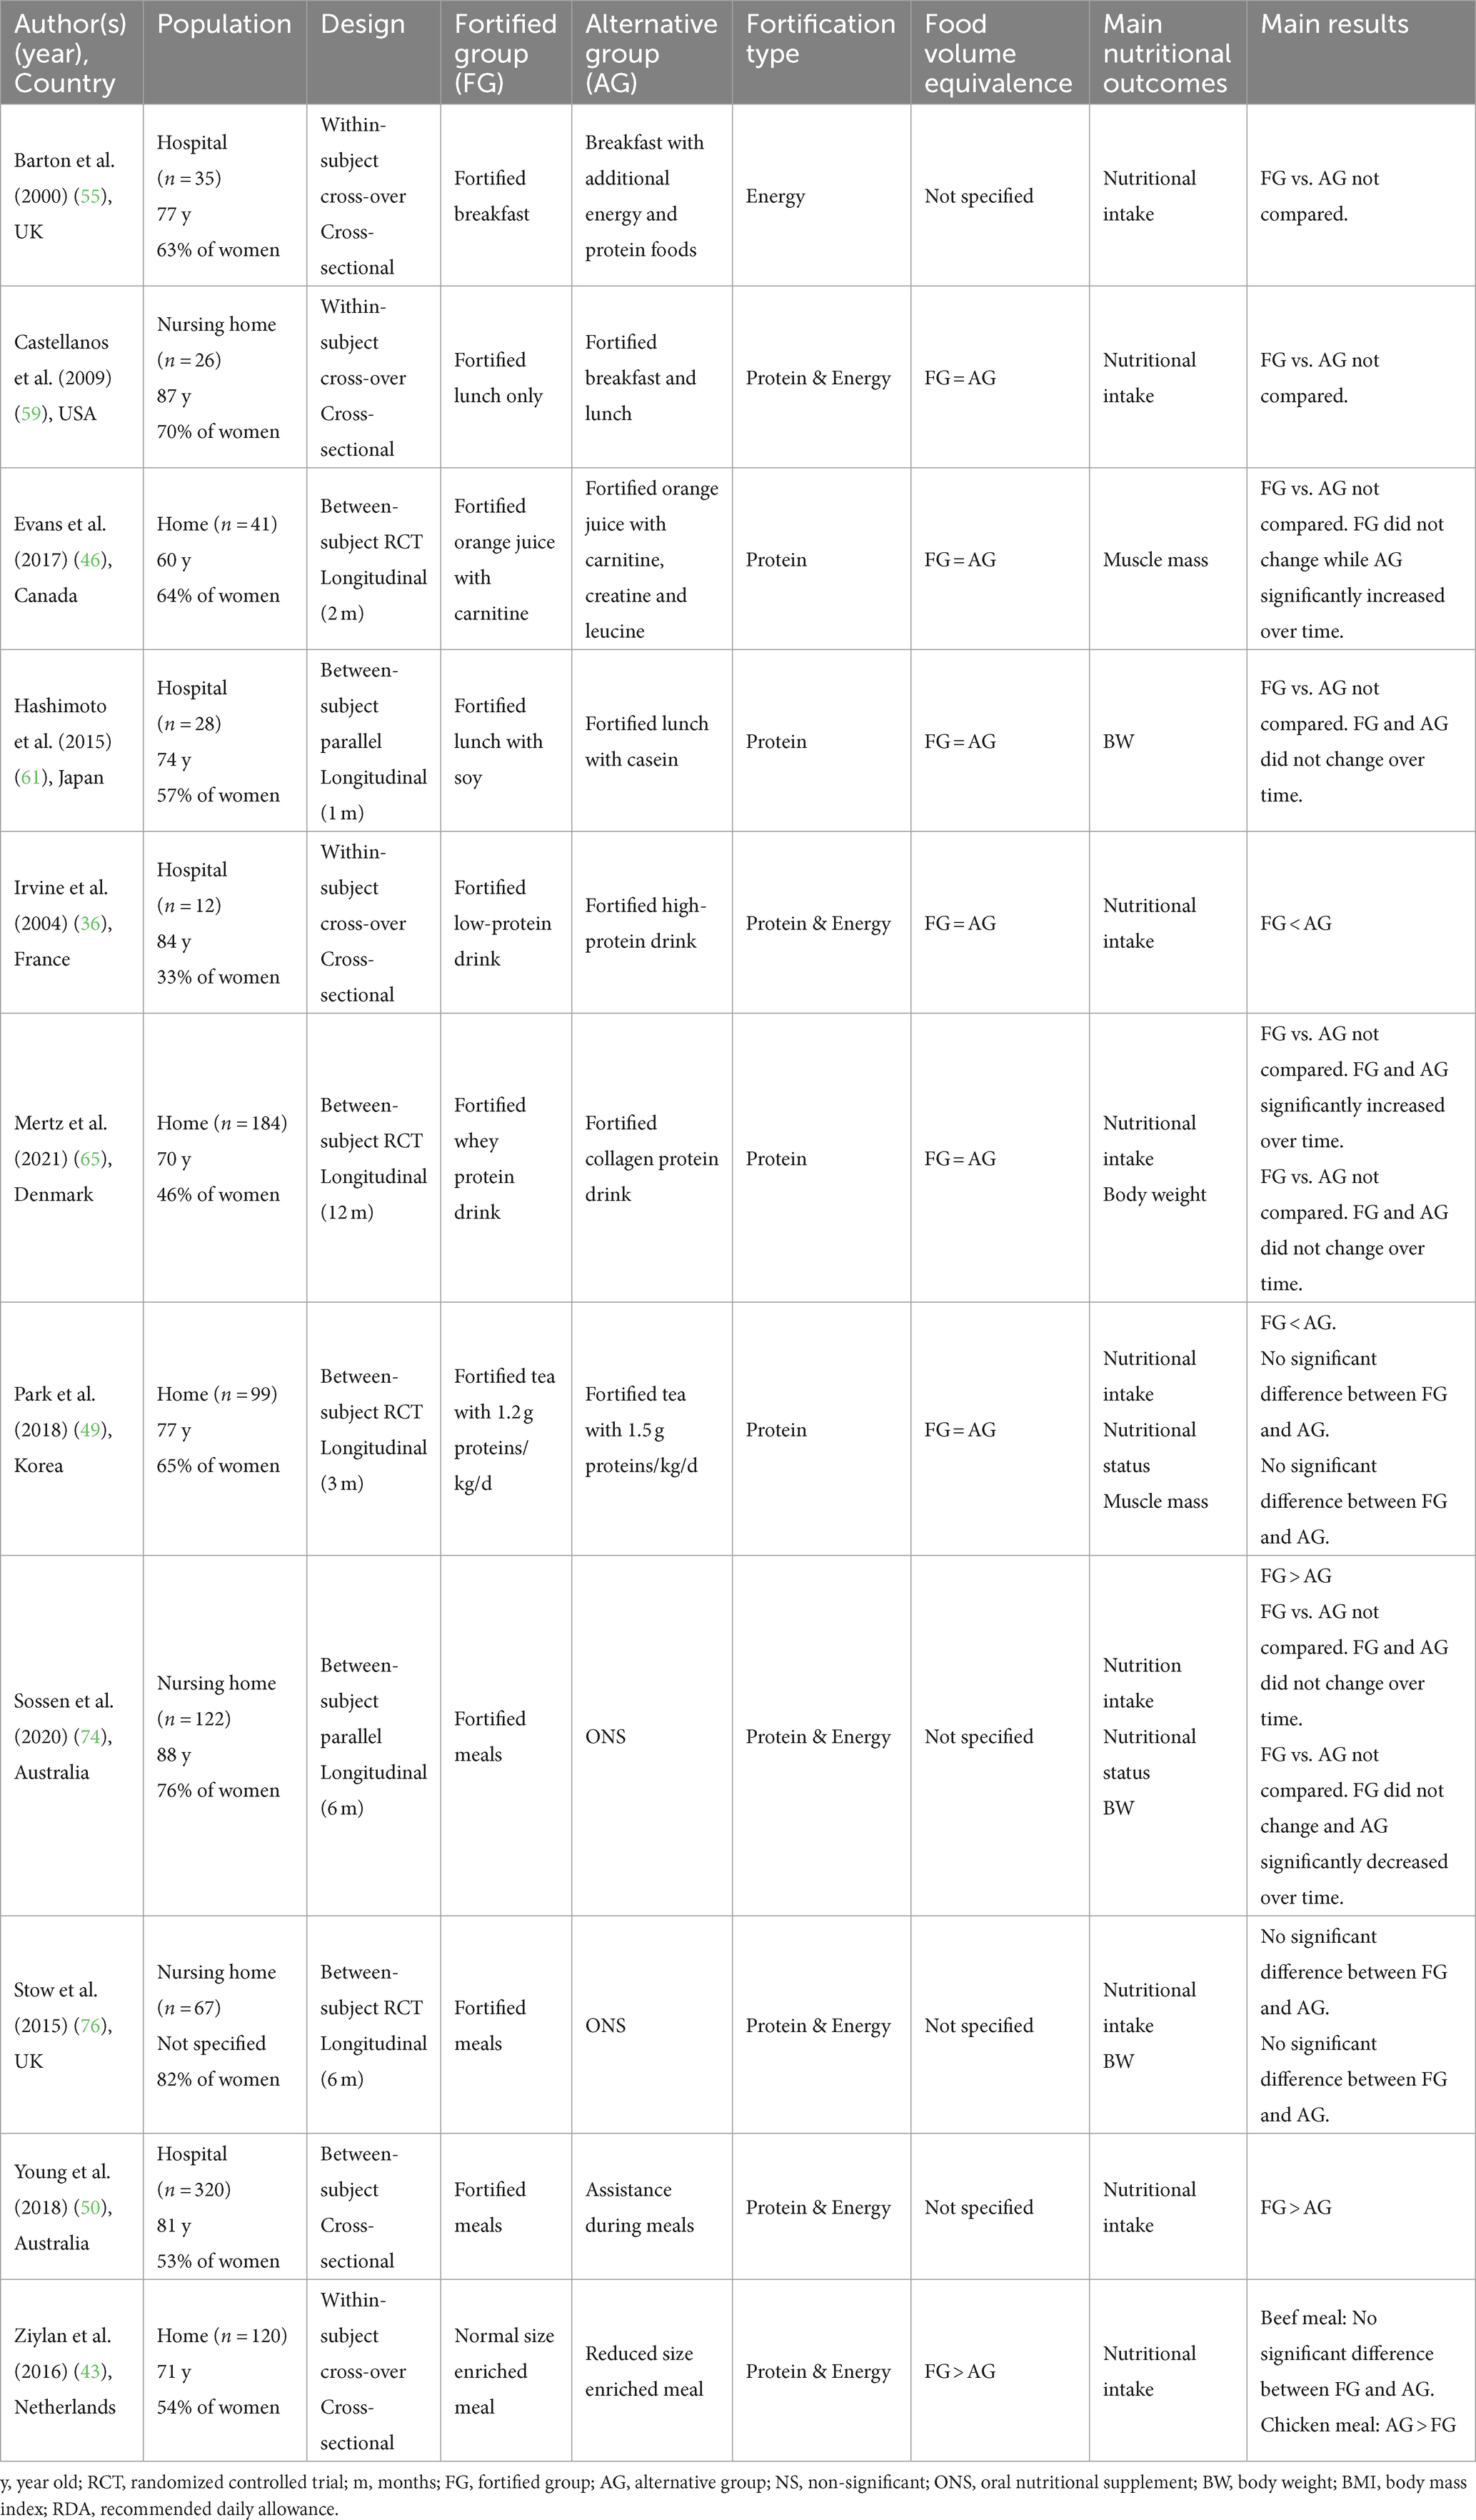
Table 5. Comparison between DIY fortification and other alternatives.
4. Discussion
4.1. Originality/value of the present review
A survey of the literature allowed the identification of five systematic literature reviews close to the topic of the present review (21–24, 30). Firstly, the systematic review of Trabal and Farran-Codina (23) investigated whether, compared to a standard diet, DIY food-based fortification with regular ingredients and/or powdered modules could improve energy and protein intake in older adults in hospital settings, long-care facilities or home settings. This review included 9 articles. The authors concluded that DIY fortification is a valid intervention for improving energy intake in older adults yet there was insufficient evidence for protein intake, nutritional status and body weight. Secondly, Morilla-Herrera et al. (21) targeted all studies related to DIY food-based fortification with macronutrients to prevent the risk of malnutrition in older patients receiving hospital services for acute or chronic disease, in older people living in nursing homes and in older people with home-care. This review encompassed 7 articles, and the meta-analysis highlighted that DIY food-based fortification yields positive results in the total amount of ingested calories and protein. Thirdly, Douglas et al. (22) aimed to evaluate the effect of DIY fortification with regular food ingredients (excluding protein powders) on energy and protein intake compared to standard diet among adults aged 60 and more in acute-care hospitals, long-term care settings or living at home. Ten articles were included. This review suggested that DIY fortification was effective in increasing energy and protein intake among older individuals. Fourthly, the systematic review by Mills et al. (24) explored the evidence for the use of energy and/or protein dense meals (DIY food-based fortification) or additional snacks (diet-based fortification) to increase the dietary energy and protein intake of adults older than 60 in hospital or rehabilitation facilities. Ten articles were identified. Authors reported that when compared with usual nutritional care, DIY fortification could be an effective, well-tolerated and cost-effective intervention to improve dietary intake among hospitalized patients. Finally, Sossen et al. (30) investigated the effect of food-based and diet-based fortification on energy and protein intake compared to any/no nutritional strategy in residents living in nursing homes. Sixteen articles were included. The results of the meta-analysis showed that fortified menus may significantly increase energy and protein intakes compared with standard menus.
The present review retrieved 44 articles that tested DIY food-based fortification in people over the age of 65. This review differs from previous reviews in the following respects. Firstly, we focused the review on DIY food-based fortification, i.e., the addition of regular food ingredients or macronutrient extracts into conventional food matrices to increase energy and protein content in the final dishes. Douglas et al. (22) considered only culinary ingredients. Mills et al. and Sossen et al. (24, 30) considered both food-based fortification and diet-based fortification via the addition of supplementary conventional foods like snacks to participants’ diets. Second, we considered all living settings, i.e., at home, with or without assistance, institutions and hospitals [Morilla-Herrera et al. (21) only considered dependent older people]. Thirdly, we considered not only nutritional outcomes but also acceptability outcomes. In addition, we used a wide range of keywords to account for the lack of consensual terminology regarding the concept of DIY food-based fortification (Supplementary material). This allowed us to identify a much larger number of articles than in previous reviews.
4.2. Description of DIY fortified recipes
A wide variety of DIY fortified recipes were extracted from this review, including liquid (35% of the recipes), semi-solid (17%) and solid food matrices (48%). However, the quality evaluation of the articles highlighted the lack of information provided by the authors on the description of fortified recipes. Only 8 articles provided sufficient information for a third party to reproduce the same fortified recipes as used in the articles. In order to identify efficient DIY fortified solutions, it is essential that in future articles provide a detailed description of the fortified recipes, including the nature of food matrices and fortificants, final energy and protein concentration, additional nutrient load provided by the fortified food compared to the standard food, consumption time, and portion size. From the information collected, energy fortification is mainly achieved through the use of fats and dairy products (cream, butter, oil) while protein fortification is mainly achieved through protein extracts. Such products are usually in powder form (‘protein powders’) and proved to have varied applications and uses within food processing as well as high nutritional and functional value (68). The present review showed that the protein products used in fortified recipes were mainly derived from animal sources (85% of the recipes), especially from milk (67% of the recipes), and to a lesser extent from plant sources (15% of the recipes). Animal-derived proteins are more readily digestible and effective in muscle protein synthesis than plant derived proteins (78).
4.3. Evaluation of DIY food-based fortification solutions
Results suggest that food-based fortification is an effective strategy to improve energy and/or protein intake. This trend is observed whether all the studies – including the ones that combined DIY fortification with other strategies (i.e., providing ONS, additional food items, fortified foods from Food Industry) or whether only the studies which assessed the impact of DIY fortification alone are considered. In other words, DIY fortification seems to be an effective strategy to improve nutritional intake, whether used alone or combined with other enrichment strategies. However, no strong evidence is observed regarding the impact of DIY fortification to improve the nutritional status (e.g., MNA score, body weight, muscle mass).
It should be noted that providing fortified food was not necessarily enough to get participants to meet the recommended nutritional allowance (50, 55, 60, 75). For instance, in Stelten et al. (75), 64% of the fortified group did not reach the threshold of 1.2 g protein/kg of body weight/day. This raises the question of the need for new fortification solutions with higher levels of energy and protein content. In addition, consuming fortified foods throughout the various meals of the day may be more efficient than consuming fortified foods only once per day. For instance, Castellanos et al. (59) reported higher energy intake when both breakfast and lunch were fortified than when only lunch was fortified, but they did not carry out statistical analysis to compare these two conditions.
Besides the relatively large number of studies that have tested the impact of DIY food-based fortification on nutritional outcomes, very few studies have looked at the acceptability of DIY fortified food. Only 10 of the 41 nutrition-related articles reported an evaluation of the acceptability of DIY fortified foods and only 3 of the 44 articles included in this review were completely devoted to the assessment of acceptability of DIY fortified food. Unsurprisingly, the quality of the acceptability studies is much better in the articles focused only on this outcome than in the articles that conducted an acceptability study alongside a nutritional study. In the latter, the sample size is often insufficient, the methods are often qualitative and the results are often imprecise and incomplete. In addition, the people who assess the acceptability of fortified food are sometimes different from the end-users [e.g., the fortified foods are tasted by the staff (37)]. Overall, the results tend to show that DIY fortified foods are equally or less appreciated than standard foods – never more. However, before drawing any final conclusions, there is a need to carry out further acceptability studies with a higher quality, taking into account the good practices and the norms of sensory evaluation (79, 80). Indeed, fortified foods should not only be good from a nutritional point of view, but also “good to eat” to ensure that they are actually consumed by the target population. Furthermore, it would be worthwhile to optimize the sensory quality of fortified foods by recruiting older adults in tasting panels. Fortification improvement based on older people’s feedback led to increased food intake in nursing homes (81, 84).
4.4. Limitations and strengths of the present SLR
The strength of this paper is its reliable literature search, with a complete overview of nutritional and acceptability issues for fortified food targeting older people. Given the lack of a consensual definition of the concept of food-based fortification, we have used a broad set of keywords to retrieve articles of interest. The limitations of the present literature review are the following: the literature search strategy did not include trial registries, nor grey literature, and it was restricted to English papers. There are two discrepancies between the present method and the one published before the review was carried out. In the published method, we considered including papers published in both English and French (the authors’ native language), but papers in French were ultimately excluded in order to avoid a language bias in the literature search. In addition, in the published method, we considered including papers related to micronutrients fortification, but ultimately focused the scope of the present review on macronutrient fortification, otherwise the scope of the review would have been too broad. Finally, a limitation lies in the fact that it was not always easy to determine whether the products used in the nutritional interventions were a DIY fortified food, a fortified food marketed by the Food Industry or an ONS. For instance, we excluded the studies where enrichment consisted of providing participants with a sachet of nutrient constituents to be dissolved in water [for instance (82, 83)]. Indeed, dissolving a sachet of powder in water is more like taking a drug than having a drink. Conversely, all the interventions consisting of adding a nutrient-dense ingredient to a food matrix were included, even when the fortificant was very specific [for example, branched chain amino acids powder (58), L-carnitine (46)]. However, the question arises as to the accessibility of this type of fortificant to the end-user in real life.
5. Conclusion
The present systematic literature review highlighted that, compared to a standard diet, DIY food-based fortification – i.e., incorporating ingredients of nutritional interest into commonly consumed foods – is a valuable strategy for increasing energy and protein intake in older people. However, no strong evidence was observed regarding the impact of DIY fortification to improve the nutritional status (i.e., MNA score, body weight, muscle mass). In addition, further research is needed to better assess the acceptability of this strategy among end-users. Given the limitations of the studies included in this systematic review, we put forward four recommendations for future research. First, we emphasize the need to develop a consistent definition of DIY food-based fortification that clearly distinguishes this strategy from other enrichment strategies such as the consumption of ONS or fortified food from food industry. Second, it would be useful for studies to better describe the recipes used for DIY fortification. This information would result in a better understanding of the factors that maximize the impact of food-based fortification on nutritional outcomes. Third, it would be relevant to systematically assess the acceptability of DIY fortified foods in addition to the nutritional outcomes. This should be done by implementing consumer tests that respect the good practices and the recommendations defined in sensory evaluation for such tests (sample size, methods…). To achieve this, it is essential to encourage more pluri-disciplinary research projects involving experts in nutrition, sensory evaluation and food technology. Fourth, we encourage researchers to further compare the impact of food-based fortification with other enrichment strategies, and in particular ONS, in order to better decipher the impact of each of these strategies in tackling undernutrition in the older people. Finally, future research should also study how to promote DIY food fortification among the older people, their caregivers, as well as among catering and health professionals. Indeed, despite this strategy has proved effective in sustaining caloric and protein intake in older people, it remains largely unknown and underused. Several dissemination strategies could be considered. A first one could be the development and the diffusion of DIY fortified recipes booklets. Such booklets should indicate the amount of protein provided by each portion. These booklets would also need to be co-created with end-users, to ensure the feasibility and acceptability of the recipes in the field, considering various settings (home cooking, home-delivery meals, nursing home, hospital). A second dissemination strategy could be the organization of therapeutic workshops at hospital discharge or in day hospital, bringing together dieticians, chefs and older people to promote DIY food fortification. However, from a more global perspective, public policies are needed to raise awareness of the nutritional needs of the older people. These policies must combine information and tools to maintain adequate energy and protein intakes, in order to prevent undernutrition in the older population.
Data availability statement
The original contributions presented in the study are included in the article/Supplementary material, further inquiries can be directed to the corresponding author/s.
Author contributions
AG: methodology, investigation, formal analysis, and writing – original draft. MP: methodology, investigation, formal analysis, and writing – review and editing. VW-D: conceptualization and writing – review and editing. CS-R: conceptualization, methodology, formal analysis, writing – original draft, and funding acquisition. All authors contributed to the article and approved the submitted version.
Funding
This work received funding by the French “Investissements d’Avenir” program, project ISITE-BFC (contract ANR-15-IDEX-0003) and from ANR (ANR-20-HDHL-0003 FORTIPHY), Research Council Norway (RCN 321819), BBSRC (BB/V018329/1) under the umbrella of the European Joint Programming Initiative “A Healthy Diet for a Healthy Life” (JPI HDHL) and of the ERA-NET Cofund ERA-HDHL (GA N°696295 of the EU Horizon 2020 Research and Innovation Programme).
Conflict of interest
During the past 36 months, CSGA and CHU Dijon received research grants from OGUST, SAVEURS et VIE, and INSTITUT NUTRITION. CS-R received consulting fees from BEL FOOD and author fees from Correspondances en Métabolismes Hormones Diabètes et Nutrition.
The remaining authors declare that the research was conducted in the absence of any commercial or financial relationships that could be construed as a potential conflict of interest.
Publisher’s note
All claims expressed in this article are solely those of the authors and do not necessarily represent those of their affiliated organizations, or those of the publisher, the editors and the reviewers. Any product that may be evaluated in this article, or claim that may be made by its manufacturer, is not guaranteed or endorsed by the publisher.
Supplementary material
The Supplementary material for this article can be found online at: https://www.frontiersin.org/articles/10.3389/fnut.2023.1232502/full#supplementary-material
Footnotes
References
1. European food safety authority (EFSA). Scientific opinion on dietary reference values for energy. EFSA J. (2013) 11:3005. doi: 10.2903/j.efsa.2013.3005
2. Volkert, D, Beck, AM, Cederholm, T, Cruz-Jentoft, A, Goisser, S, Hooper, L, et al. ESPEN guideline on clinical nutrition and hydration in geriatrics. Clin Nutr. (2019) 38:10–47. doi: 10.1016/j.clnu.2018.05.024
3. Bauer, J, Biolo, G, Cederholm, T, Cesari, M, Cruz-Jentoft, AJ, Morley, JE, et al. Evidence-based recommendations for optimal dietary protein intake in older people: a position paper from the PROT-AGE study group. J Am Med Dir Assoc. (2013) 14:542–59. doi: 10.1016/j.jamda.2013.05.021
4. Deutz, NEP, Bauer, JM, Barazzoni, R, Biolo, G, Boirie, Y, Bosy-Westphal, A, et al. Protein intake and exercise for optimal muscle function with aging: recommendations from the ESPEN expert group. Clin Nutr. (2014) 33:929–36. doi: 10.1016/j.clnu.2014.04.007
5. Shad, BJ, Thompson, JL, and Breen, L. Does the muscle protein synthetic response to exercise and amino acid-based nutrition diminish with advancing age? A systematic review. Am J Physiol Endocrinol Metab. (2016) 311:E803–17. doi: 10.1152/ajpendo.00213.2016
6. Bollwein, J, Diekmann, R, Kaiser, MJ, Bauer, JM, Uter, W, Sieber, CC, et al. Distribution but not amount of protein intake is associated with frailty: a cross-sectional investigation in the region of Nürnberg. Nutr J. (2013) 12:109. doi: 10.1186/1475-2891-12-109
7. Giezenaar, C, Chapman, I, Luscombe-Marsh, N, Feinle-Bisset, C, Horowitz, M, and Soenen, S. Ageing is associated with decreases in appetite and energy intake—a meta-analysis in healthy adults. Nutrients. (2016) 8:10028. doi: 10.3390/nu8010028
8. Corrêa Leite, ML, Nicolosi, A, Cristina, S, Hauser, WA, Pugliese, P, and Nappi, G. Dietary and nutritional patterns in an elderly rural population in northern and southern Italy: (I). A cluster analysis of food consumption. Eur J Clin Nutr. (2003) 57:1514–21. doi: 10.1038/sj.ejcn.1601719
9. Samieri, C, Jutand, MA, Féart, C, Capuron, L, Letenneur, L, and Barberger-Gateau, P. Dietary patterns derived by hybrid clustering method in older people: association with cognition, mood, and self-rated health. J Am Diet Assoc. (2008) 108:1461–71. doi: 10.1016/j.jada.2008.06.437
10. Thorpe, MG, Milte, CM, Crawford, D, and McNaughton, SA. A comparison of the dietary patterns derived by principal component analysis and cluster analysis in older Australians. Int J Behav Nutr Phys Act. (2016) 13:30. doi: 10.1186/s12966-016-0353-2
11. Gazan, R, Béchaux, C, Crépet, A, Sirot, V, Drouillet-Pinard, P, Dubuisson, C, et al. Dietary patterns in the French adult population: a study from the second French national cross-sectional dietary survey (INCA2) (2006–2007). Br J Nutr. (2016) 116:300–15. doi: 10.1017/S0007114516001549
12. Perraud, S. (2020). Evolutions de la consommation de protéines par sources alimentaires entre 2010 et 2019 selon les profils de consommateurs. Available at: https://zenodo.org/record/4327397
13. Sulmont-Rossé, C, and Van Wymelbeke, V. Les déterminants d’un apport protidique faible chez les personnes âgées dépendantes. Cahiers de Nutrition et de Diététique. (2019) 54:180–9. doi: 10.1016/j.cnd.2019.02.003
14. van der Pols-Vijlbrief, R, Wijnhoven, HAH, Schaap, LA, Terwee, CB, and Visser, M. Determinants of protein–energy malnutrition in community-dwelling older adults: a systematic review of observational studies. Ageing Res Rev. (2014) 18:112–31. doi: 10.1016/j.arr.2014.09.001
15. van der Meij, BS, Wijnhoven, HAH, Lee, JS, Houston, DK, Hue, T, Harris, TB, et al. Poor appetite and dietary intake in community-dwelling older adults. J Am Geriatr Soc. (2017) 65:2190–7. doi: 10.1111/jgs.15017
16. Hiesmayr, M, Schindler, K, Pernicka, E, Schuh, C, Schoeniger-Hekele, A, Bauer, P, et al. Decreased food intake is a risk factor for mortality in hospitalised patients: The NutritionDay survey 2006. Clin Nutr. (2009) 28:484–91. doi: 10.1016/j.clnu.2009.05.013
17. Schaible, UE, and Kaufmann, SHE. Malnutrition and infection: complex mechanisms and global impacts. PLoS Med. (2007) 4:7. doi: 10.1371/journal.pmed.0040115
18. Litchford, MD, Dorner, B, and Posthauer, ME. Malnutrition as a precursor of pressure ulcers. Adv Wound Care (New Rochelle). (2014) 3:54–63. doi: 10.1089/wound.2012.0385
19. Ferry, M. 31 – Conséquences globales de la dénutrition In: M Ferry, D Mischlich, E Alix, P Brocker, T Constans, and B Lesourd, et al., editors. Nutrition De la Personne âgée (Quatrième Édition) [Internet]. Paris: Elsevier Masson (2012). 172–8.
20. Abeshu, MA, and Geleta, B. The role of fortification and supplementation in mitigating the hidden hunger. J Nutr Food Sci. (2016) 6. doi: 10.4172/2155-9600.1000459
21. Morilla-Herrera, JC, Martín-Santos, FJ, Caro-Bautista, J, Saucedo-Figueredo, C, García-Mayor, S, and Morales-Asencio, JM. Effectiveness of food-based fortification in older people a systematic review and meta-analysis. J Nutr Health Aging. (2016) 20:178–84. doi: 10.1007/s12603-015-0591-z
22. Douglas, JW, Lawrence, JC, and Knowlden, AP. The use of fortified foods to treat malnutrition among older adults: a systematic review. QAOA. (2017) 18:104–19. doi: 10.1108/QAOA-05-2016-0018
23. Trabal, J, and Farran-Codina, A. Effects of dietary enrichment with conventional foods on energy and protein intake in older adults: a systematic review. Nutr Rev. (2015) 73:624–33. doi: 10.1093/nutrit/nuv023
24. Mills, SR, Wilcox, CR, Ibrahim, K, and Roberts, HC. Can fortified foods and snacks increase the energy and protein intake of hospitalised older patients? A systematic review. J Hum Nutr Diet. (2018) 31:379–89. doi: 10.1111/jhn.12529
25. Xiao, Y, and Watson, M. Guidance on conducting a systematic literature review. J Plan Educ Res. (2019) 39:93–112. doi: 10.1177/0739456X17723971
26. Shamseer, L, Moher, D, Clarke, M, Ghersi, D, Liberati, A, Petticrew, M, et al. Preferred reporting items for systematic review and meta-analysis protocols (PRISMA-P) 2015: Elaboration and explanation. Res Methods. (2015) 349:25. doi: 10.1136/bmj.g7647
27. Stone, PW. Popping the (PICO) question in research and evidence-based practice. Appl Nurs Res. (2002) 15:197–8. doi: 10.1053/apnr.2002.34181
28. Kmet, LM, Lee, RC, and Cook, LS. Alberta Heritage Foundation for Medical Research a, health technology assessment unit, University of Calgary, et al. standard quality assessment criteria for evaluating primary research papers from a variety of fields. Edmonton: Alberta Heritage Foundation for Medical Research (2004).
29. Higgins, J, Thomas, J, Chandler, J, Cumpston, M, Li, T, Page, M, et al. (2021). Cochrane handbook for systematic reviews of interventions (version 6.2) [internet]. Available at: www.training.cochrane.org/handbook
30. Sossen, L, Bonham, M, and Porter, J. Can fortified, nutrient-dense and enriched foods and drink-based nutrition interventions increase energy and protein intake in residential aged care residents? A systematic review with meta-analyses. Int J Nurs Stud. (2021) 124:104088. doi: 10.1016/j.ijnurstu.2021.104088
31. Beck, AM, Ovesen, L, and Schroll, M. Home-made oral supplement as nutritional support of old nursing home residents, who are undernourished or at risk of undernutrition based on the MNA. A pilot trial. Aging Clin Exp Res. (2002) 14:212–5. doi: 10.1007/BF03324439
32. Holyday, M, Daniells, S, Bare, M, Caplan, GA, Petocz, P, and Bolin, T. Malnutrition screening and early nutrition intervention in hospitalised patients in acute aged care: a randomised controlled trial. J Nutr Health Aging. (2012) 16:562–8. doi: 10.1007/s12603-012-0022-3
33. Norton, V, Lignou, S, Bull, SP, Gosney, MA, and Methven, L. Consistent effects of whey protein fortification on consumer perception and liking of solid food matrices (cakes and biscuits) regardless of age and saliva flow. Foods. (2020) 9. doi: 10.3390/foods9091328
34. Tsikritzi, R, Wang, J, Collins, VJ, Allen, VJ, Mavrommatis, Y, Moynihan, PJ, et al. The effect of nutrient fortification of sauces on product stability, sensory properties, and subsequent liking by older adults: fortified sauces for older patients…. J Food Sci. (2015) 80:S1100–10. doi: 10.1111/1750-3841.12850
35. Wendin, K, Höglund, E, Andersson, M, and Rothenberg, E. Protein enriched foods and healthy ageing effects of protein fortification on muffin characteristics. Agro Food Industry Hi Tech. (2017) 5:16–8. https://www.researchgate.net/publication/320858882
36. Irvine, P, Mouzet, JB, Marteau, C, Sallé, A, Genaitay, M, Favreau, AM, et al. Short-term effect of a protein load on appetite and food intake in diseased mildly undernourished elderly people. Clin Nutr. (2004) 23:1146–52. doi: 10.1016/j.clnu.2004.02.011
37. Silver, HJ, Dietrich, MS, and Castellanos, VH. Increased energy density of the home-delivered lunch meal improves 24-hour nutrient intakes in older adults. J Am Diet Assoc. (2008) 108:2084–9. doi: 10.1016/j.jada.2008.09.005
38. Starke, J, Schneider, H, Alteheld, B, Stehle, P, and Meier, R. Short-term individual nutritional care as part of routine clinical setting improves outcome and quality of life in malnourished medical patients. Clin Nutr. (2011) 30:194–201. doi: 10.1016/j.clnu.2010.07.021
39. Björkman, MP, Finne-Soveri, H, and Tilvis, RS. Whey protein supplementation in nursing home residents. A randomized controlled trial. Europ Geriat Med. (2012) 3:161–6. doi: 10.1016/j.eurger.2012.03.010
40. Lee, LC, Tsai, AC, Wang, JY, Hurng, BS, Hsu, HC, and Tsai, HJ. Need-based intervention is an effective strategy for improving the nutritional status of older people living in a nursing home: a randomized controlled trial. Int J Nurs Stud. (2013) 50:1580–8. doi: 10.1016/j.ijnurstu.2013.04.004
41. Munk, T, Beck, AM, Holst, M, Rosenbom, E, Rasmussen, HH, Nielsen, MA, et al. Positive effect of protein-supplemented hospital food on protein intake in patients at nutritional risk: a randomised controlled trial. J Hum Nutr Diet. (2014) 27:122–32. doi: 10.1111/jhn.12210
42. Beermann, T, Mortensen, MN, Skadhauge, LB, Høgsted, RH, Rasmussen, HH, and Holst, M. Protein and energy intake improved by breakfast intervention in hospital. Clin Nutr ESPEN. (2016) 13:e23–7. doi: 10.1016/j.clnesp.2016.02.097
43. Ziylan, C, Kremer, S, Eerens, J, Haveman-Nies, A, and de Groot, LCPGM. Effect of meal size reduction and protein enrichment on intake and satiety in vital community-dwelling older adults. Appetite. (2016) 105:242–8. doi: 10.1016/j.appet.2016.05.032
44. Ziylan, C, Haveman-Nies, A, Kremer, S, and de Groot, LCPGM. Protein-enriched bread and readymade meals increase community-dwelling older adults’ protein intake in a double-blind randomized controlled trial. J Am Med Dir Assoc. (2017) 18:145–51. doi: 10.1016/j.jamda.2016.08.018
45. Beelen, J, De Roos, NM, and De Groot, LCPGM. A: protein enrichment of familiar foods as an innovative strategy to increase protein intake in institutionalized elderly. J Nutr Health Aging. (2017) 21:173–9. doi: 10.1007/s12603-016-0733-y
46. Evans, M, Guthrie, N, Pezzullo, J, Sanli, T, Fielding, RA, and Bellamine, A. Efficacy of a novel formulation of L-carnitine, creatine, and leucine on lean body mass and functional muscle strength in healthy older adults: a randomized, double-blind placebo-controlled study. Nutr Metab (Lond). (2017) 14. doi: 10.1186/s12986-016-0158-y
47. Niccoli, S, Kolobov, A, Bon, T, Rafilovich, S, Munro, H, Tanner, K, et al. Whey protein supplementation improves rehabilitation outcomes in hospitalized geriatric patients: a double blinded, randomized controlled trial. J Nutr Gerontol Geriatr. (2017) 36:149–65. doi: 10.1080/21551197.2017.1391732
48. Arjuna, T, Miller, M, Ueno, T, Visvanathan, R, Lange, K, Soenen, S, et al. Food services using energy- and protein-fortified meals to assist vulnerable community-residing older adults meet their dietary requirements and maintain good health and quality of life: findings from a pilot study. Geriatrics (Switzerland). (2018) 3. doi: 10.3390/geriatrics3030060
49. Park, Y, Choi, JE, and Hwang, HS. Protein supplementation improves muscle mass and physical performance in undernourished prefrail and frail elderly subjects: a randomized, double-blind, placebo-controlled trial. Am J Clin Nutr. (2018) 108:1026–33. doi: 10.1093/ajcn/nqy214
50. Young, AM, Banks, MD, and Mudge, AM. Improving nutrition care and intake for older hospital patients through system-level dietary and mealtime interventions. Clin Nutr ESPEN. (2018) 24:140–7. doi: 10.1016/j.clnesp.2017.12.009
51. Mortensen, MN, Larsen, AK, Skadhauge, LB, Høgsted, RH, Beermann, T, Cook, ME, et al. Protein and energy intake improved by in-between meals: an intervention study in hospitalized patients. Clin Nutr ESPEN. (2019) 30:113–8. doi: 10.1016/j.clnesp.2019.01.007
52. Nykänen, I, Törrönen, R, and Schwab, U. Effect of dairy-based and energy-enriched berry-based snacks on quality of life in older people. Geriatr Gerontol Int. (2019) 19:960–1. doi: 10.1111/ggi.13674
53. Allepaerts, S, Buckinx, F, Bruyère, O, Reginster, JY, Paquot, N, and Gillain, S. Clinical impact of nutritional status and energy balance in elderly hospitalized patients. J Nutr Health Aging. (2020) 24:1073–9. doi: 10.1007/s12603-020-1527-9
54. Seemer, J, Kiesswetter, E, Fleckenstein-Sußmann, D, Gloning, M, Bader-Mittermaier, S, Sieber, CC, et al. Effects of an individualised nutritional intervention to tackle malnutrition in nursing homes: a pre-post study. Eur Geriatr Med. (2021). doi: 10.1007/s41999-021-00597-y
55. Barton, AD, Beigg, CL, Macdonald, IA, and Allison, SP. A recipe for improving food intakes in elderly hospitalized patients. Clin Nutr. (2000) 19:451–4. doi: 10.1054/clnu.2000.0149
56. Beelen, J, De Roos, NM, and De Groot, LCPGM. C: a 12-week intervention with protein-enriched foods and drinks improved protein intake but not physical performance of older patients during the first 6 months after hospital release: a randomised controlled trial. Br J Nutr. (2017) 117:1541–9. doi: 10.1017/S0007114517001477
57. Beelen, J, Vasse, E, Janssen, N, Janse, A, de Roos, NM, and de Groot, LCPGM. Protein-enriched familiar foods and drinks improve protein intake of hospitalized older patients: a randomized controlled trial. Clin Nutr. (2018) 37:1186–92. doi: 10.1016/j.clnu.2017.05.010
58. Bonnefoy, M, Laville, M, Ecochard, R, Jusot, JF, Normand, S, Maillot, S, et al. Effects of branched amino acids supplementation in malnourished elderly with catabolic status. J Nutr Health Aging. (2010) 14:579–84. doi: 10.1007/s12603-010-0090-1
59. Castellanos, VH, Marra, MV, and Johnson, P. Enhancement of select foods at breakfast and lunch increases energy intakes of nursing home residents with low meal intakes. J Am Diet Assoc. (2009) 109:445–51. doi: 10.1016/j.jada.2008.11.035
60. Gall, MJ, Grimble, GK, Reeve, NJ, and Thomas, SJ. Effect of providing fortified meals and between-meal snacks on energy and protein intake of hospital patients. Clin Nutr. (1998) 17:259–64. doi: 10.1016/S0261-5614(98)80317-8
61. Hashimoto, R, Sakai, A, Murayama, M, Ochi, A, Abe, T, Hirasaka, K, et al. Effects of dietary soy protein on skeletal muscle volume and strength in humans with various physical activities. J Med Investigat. (2015) 62:177–83. doi: 10.2152/jmi.62.177
62. Iuliano, S, Woods, J, and Robbins, J. Consuming two additional serves of dairy food a day significantly improves energy and nutrient intakes in ambulatory aged care residents: a feasibility study. J Nutr Health Aging. (2013) 17:509–13. doi: 10.1007/s12603-013-0025-8
63. Leslie, WS, Woodward, M, Lean, MEJ, Theobald, H, Watson, L, and Hankey, CR. Improving the dietary intake of under nourished older people in residential care homes using an energy-enriching food approach: a cluster randomised controlled study. J Hum Nutr Diet. (2013) 26:387–94. doi: 10.1111/jhn.12020
64. Lorefält, B, Wissing, U, and Unosson, M. Smaller but energy and protein-enriched meals improve energy and nutrient intakes in elderly patients. J Nutr Health Aging. (2005) 9:243–7.
65. Mertz, KH, Reitelseder, S, Bechshoeft, R, Bulow, J, Højfeldt, G, Jensen, M, et al. The effect of daily protein supplementation, with or without resistance training for 1 year, on muscle size, strength, and function in healthy older adults: a randomized controlled trial. Am J Clin Nutr. (2021) 113:790–800. doi: 10.1093/ajcn/nqaa372
66. Munk, T, Seidelin, W, Rosenbom, E, Nielsen, AL, Klausen, TW, Nielsen, MA, et al. A 24-h a la carte food service as support for patients at nutritional risk: a pilot study. J Hum Nutr Diet. (2013) 26:268–75. doi: 10.1111/jhn.12017
67. Neelemaat, F, Lips, P, Bosmans, JE, Thijs, A, Seidell, JC, and Bokhorst-de van der Schueren, MAE Short-term Oral nutritional intervention with protein and vitamin D decreases falls in malnourished older adults. J Am Geriatr Soc. (2012);60:691–699. doi: 10.1111/j.1532-5415.2011.03888.x
68. Norton, V, Lignou, S, and Methven, L. Influence of age and individual differences on mouthfeel perception of whey protein-fortified products: a review. Foods. (2021) 10:433. doi: 10.3390/foods10020433
69. Ödlund Olin, A. Energy-dense meals improve energy intake in elderly residents in a nursing home. Clin Nutr. (2003) 22:125–31. doi: 10.1054/clnu.2002.0610
70. Ödlund Olin, A, Österberg, P, Hådell, K, Armyr, I, Jerström, S, and Ljungqvist, O. Energy-enriched hospital food to improve energy intake in elderly patients. J Parenter Enter Nutr. (1996) 20:93–7. doi: 10.1177/014860719602000293
71. Ott, A, Senger, M, Lötzbeyer, T, Gefeller, O, Sieber, CC, and Volkert, D. Effects of a texture-modified, enriched, and reshaped diet on dietary intake and body weight of nursing home residents with chewing and/or swallowing problems: an enable study. J Nutr Gerontol Geriatr. (2019) 38:361–76. doi: 10.1080/21551197.2019.1628158
72. Polonen, S, Tiihonen, M, Hartikainen, S, and Nykanen, I. Individually tailored dietary counseling among old home care clients – effects on nutritional status. J Nutr Health Aging. (2017) 21:567–72. doi: 10.1007/s12603-016-0815-x
73. Smoliner, C, Norman, K, Scheufele, R, Hartig, W, Pirlich, M, and Lochs, H. Effects of food fortification on nutritional and functional status in frail elderly nursing home residents at risk of malnutrition. Nutrition. (2008) 24:1139–44. doi: 10.1016/j.nut.2008.06.024
74. Sossen, L, Bonham, M, and Porter, J. Does a high-energy high-protein diet reduce unintentional weight loss in residential aged care residents? J Nutr Gerontol Geriatr. (2020) 39:56–68. doi: 10.1080/21551197.2019.1691108
75. Stelten, S, Dekker, IM, Ronday, EM, Thijs, A, Boelsma, E, Peppelenbos, HW, et al. Protein-enriched ‘regular products’ and their effect on protein intake in acute hospitalized older adults; a randomized controlled trial. Clin Nutr. (2015) 34:409–14. doi: 10.1016/j.clnu.2014.08.007
76. Stow, R, Ives, N, Smith, C, Rick, C, and Rushton, A. A cluster randomised feasibility trial evaluating nutritional interventions in the treatment of malnutrition in care home adult residents. Trials. (2015) 16:433. doi: 10.1186/s13063-015-0952-2
77. van Til, AJ, Naumann, E, Cox-Claessens, IJHM, Kremer, S, Boelsma, E, and de van der Schueren, MAE. Effects of the daily consumption of protein enriched bread and protein enriched drinking yoghurt on the total protein intake in older adults in a rehabilitation Centre: a single blind randomised controlled trial. J Nutr Health Aging. (2015) 19:525–30. doi: 10.1007/s12603-015-0471-6
79. AFNOR. Méthodologie: Directives générales pour la réalisation d’épreuves hédoniques en laboratoire d’évaluation sensorielle ou en salle en conditions contrôlées impliquant des consommateurs. Paris – La Défense: AFNOR (2000). 23 p.
80. Maitre, I, Symoneaux, R, and Sulmont-Rossé, C. Sensory testing in new product development: working with older people In: J Delarue, JB Lawlor, and M Rogeaux, editors. Rapid sensory profiling techniques. Amsterdam: Elsevier (2015). 485–508.
81. Sulmont-Rossé, C, Symoneaux, R, Feyen, V, and Maître, I. Improving food sensory quality with and for elderly consumers In: G Ares and P Varela, editors. Methods in consumer research, vol. 2. Amsterdam: Elsevier (2018). 355–72.
82. Norton, C, Toomey, C, McCormack, WG, Francis, P, Saunders, J, Kerin, E, et al. Protein supplementation at breakfast and lunch for 24 weeks beyond habitual intakes increases whole-body Lean tissue mass in healthy older adults. J Nutr. (2016) 146:65–9. doi: 10.3945/jn.115.219022
83. Nilsson, MI, Mikhail, A, Lan, L, Carlo, AD, Hamilton, B, Barnard, K, et al. A five-ingredient nutritional supplement and home-based resistance exercise improve lean mass and strength in free-living elderly. Nutrients. (2020) 12:1–28. doi: 10.3390/nu12082391
Keywords: elderly, enrichment, supplementation, food-first, malnutrition, intake, body weight, acceptability
Citation: Geny A, Petitjean M, Van Wymelbeke-Delannoy V and Sulmont-Rossé C (2023) Impact of food-based fortification on nutritional outcomes and acceptability in older adults: systematic literature review. Front. Nutr. 10:1232502. doi: 10.3389/fnut.2023.1232502
Edited by:
Mohammed Youssef, Alexandria University, EgyptReviewed by:
Lauren E. O'Connor, United States Department of Agriculture (USDA), United StatesKathleen L. Hefferon, Cornell University, United States
Justin Chileshe, Tropical Diseases Research Centre, Zambia
Copyright © 2023 Geny, Petitjean, Van Wymelbeke-Delannoy and Sulmont-Rossé. This is an open-access article distributed under the terms of the Creative Commons Attribution License (CC BY). The use, distribution or reproduction in other forums is permitted, provided the original author(s) and the copyright owner(s) are credited and that the original publication in this journal is cited, in accordance with accepted academic practice. No use, distribution or reproduction is permitted which does not comply with these terms.
*Correspondence: Claire Sulmont-Rossé, Y2xhaXJlLnN1bG1vbnQtcm9zc2VAaW5yYWUuZnI=