Abstract
Background:
Dietary diversity refers to increasing the consumption of a variety of foods. The consumption of diversified food during pregnancy enables the adequate intake of 11 important micronutrients. Inadequate dietary intake during pregnancy is the major determinant factor in the risk of low birth weight infants. It is capable of ensuring the adequate intake of essential nutrients, which can promote good physical health and mental development. Pregnant women require more protein, iron, iodine, vitamin A, folate, and other nutrients. Adequate intake of fruit, vegetables, and animal products throughout the life cycle helps ensure that women enter pregnancy and lactation without deficiencies. Micronutrient deficiency and protein, carbohydrate, and fat intake imbalances are also linked to an increased risk of chronic disease.
Objective:
To assess the prevalence and associated factors with adequate dietary diversity among pregnant woman in Nekemte town, western Ethiopia, 202.1.
Methods:
A community-based cross-sectional study was conducted among 475 pregnant women in the town. We used a systematic random sampling technique. Data were collected through face-to-face interviews by trained data collectors using a validated questionnaire. Before being exported to STATA version 14, data were entered into EpiData version 3.1, cleaned, coded, and checked for missing values. Results from bivariable analysis of p-value less than 0.25 were moved to a multivariable binary logistic regression model for analysis. Finally, multivariable logistic regression with p-value of less than 0.05 was considered statistically significant.
Results:
The Prevalence of adequate dietary diversity was 43.6% (95% CI; 39.1–48.1). Households with the richest wealth index adjusted odds ratio (AOR = 3.17; 95%Confidence Interval = 1.60–6.28), those who have antenatal care (AOR = 2.16; 95%CI = 1.22–3.84), and women who were government employees (AOR = 1.87; 95%CI = 1.01–3.48) were positively associated with adequate dietary diversity. On the other hand, food-insecure households (AOR = 0.34; 95%CI = 0.17–0.66), women who had not changed their meal frequency (AOR = 0.613; 95%CI = 0.38–0.99), and women in their third trimester (AOR = 0.40; 95%CI = 0.20–0.81) were negatively associated with adequate dietary diversity during pregnancy.
Conclusion:
The findings showed that there was a low acceptable level of dietary diversity among pregnant women in the town. Wealth index, antenatal care, women’s occupation, household food insecurity, gestational age, and not changing meal frequency were identified as factors associated with adequate dietary diversity. Therefore, multi-sectoral collaboration is needed to enhance the dietary diversity of pregnant women by promoting women’s employment and strengthening sustainable income-generating activities.
Introduction
Diet refers to how people feed themselves and the foods they consume, which are heavily influenced by people’s traditions, religion, economic position, social status, and the opportunities provided by their natal surroundings (1). Dietary diversity refers to increasing the consumption of a variety of foods (2). It is capable of ensuring the adequate intake of essential nutrients, which can promote good physical health and mental development (3, 4). Pregnant women require more protein, iron, iodine, vitamin A, folate, and other nutrients (5, 6). The adequate intake of fruit, vegetables, and animal products throughout the life cycle helps to ensure that women enter pregnancy and lactation without deficiencies (6). Micronutrient deficiency and protein, carbohydrate, and fat intake imbalances are also linked to an increased risk of chronic disease (7). In resource-limited settings across the globe, low-quality, monotonous diets are the norm. When grain or tuber-based staple foods dominate and diets lack vegetables, fruits, and animal-source foods, the risk of a range of micronutrient deficiencies is high (8, 9). Worldwide, maternal undernutrition is the leading developmental challenge affecting nearly half of the world’s population and is responsible for the deaths of 3.5 million mothers and children every year. It accounts for approximately 7% of the disease burden and contributes to an increased chance of poor pregnancy outcomes (10). Worldwide, inadequate dietary diversity is a major public health issue for pregnant women (11). Deficiencies in key macronutrients and micronutrients have a substantial impact on pregnancy outcomes and neonatal health (12). Deficiencies of certain nutrients are also associated with fetal and newborn deaths, birth defects, and decreased physical and mental potential in the child (5, 6). Evidence suggests that the effects of fetal nutrition may persist well into adulthood, with possible intergenerational effects (13). A large study conducted in four countries reported that only 20% of pregnant women in Pakistan, a quarter (25%) of pregnant women in the Democratic Republic of the Congo (DRC), half (50%) of pregnant women in Guatemala, and 70% of pregnant women in India have adequate dietary diversity (14). In sub-Saharan African countries, diets are predominantly based on starchy foods with little or no animal products and few fresh fruits and vegetables (15). In Tanzania, cereals and starchy roots contribute 51 and 19% of the total dietary energy supply and 71 and 61% of the population’s dietary use of maize and rice, respectively (16). The least consumed foods in Tanzania include eggs, fish, flesh meat, organ meat, milk and milk products, other fruits, and vitamin A-rich fruits (16). Associated factors that were identified for suboptimal dietary practice were women’s age, education, occupation, use of medical services, socioeconomic status, previous delivery, morbidity, household assets, land ownership, and daily meal frequency (17).
A national-level study in Ethiopia (18) discovered a low rate of adequate dietary diversity (41%) among pregnant women. A large study that involved 540 pregnant women revealed that the mean dietary diversity score was 2.85 (19). Evidence from studies conducted in Ethiopia documented that the low Prevalence of adequate dietary diversity among pregnant women ranged from 25.4% in Shashemane town to 65.5% in the Illu Aba Bor zone (20–24). Studies have reported that the dietary diversity of pregnant women is associated with many factors. Among these, maternal education, nutritional information, dietary diversity knowledge, household wealth index level, and not having additional meals during pregnancy were factors significantly associated with pregnant women’s dietary diversity practice in Ethiopia (25 and 26).
Even though there have been reports about the dietary diversity of pregnant women, most of the existing reports are institutional-based. Because of this, identifying community-based specific factors related to dietary diversity in pregnant women is critical to designing evidence-based, appropriate long-term nutritional intervention strategies that would optimize pregnancy and fetal outcomes. This was in line with the current emphasis on the first 1,000 days of life as a window of opportunity to promote healthy child growth by updating data, which is essential for developing effective intervention strategies (20).
A limited study with a community-based design was previously conducted to assess the prevalence and factors associated with adequate dietary diversity among pregnant women in the study area, as well as how food varies according to culture, religion, and food anthropology, which needs further investigation. The study may be useful for the Nekemte Town Health Office in prioritizing, designing, and initiating intervention programs. Therefore, the aim of this study was to assess the prevalence and factors associated with adequate dietary diversity among pregnant women in Nekemte town.
Methods and materials
Study setting
Nekemte is located 330 km west of Addis Ababa, the capital of Ethiopia. Based on the population projection, the town has a total population of 135,856, of which, 4,714 (3.47%) are pregnant women. Nekemte is the capital city of the East Wollega zone of Oromia Regional State. The town has two government health centers, two referral hospitals, and many private health facilities. The town’s altitude ranges from 1960 to 2,170 meters above sea level; its average annual rainfall is 1854.9 mm and the average temperature ranges from 14°C to 26°C. Agriculture is the dominant livelihood of the population in the study area. The major crops grown in the area of Nekemte include cereals, pulses, and horticultural crops such as fruit, vegetables, and root crops. Cereals include maize, sorghum, teff, wheat, and barley, and pulses include beans, peas, field peas, lentils, and vetch. Furthermore, oilseeds such as linseed and Guizotia abyssinica are growing in small quantities (21).
Study design
Community-based cross-sectional.
Study Period
From October 15–25, 2021.
Population
The source population was comprised of pregnant women who resided in Nekemte town during the study period.
Study population
The study population was comprised of pregnant women who lived in randomly selected sub-cities.
Inclusion and exclusion criteria
Inclusion criteria: Pregnant women who were in Nekemte town during the study period.
Exclusion criteria: Pregnant women who were unable to communicate due to mental status or serious illness.
Sample Size Determination: For the first specific objective, the sample size was computed using a single population proportion formula. From a previously conducted study in Shashemane, 25.4% of the study participants had a high dietary diversity score with a 5% margin of error and a 95% confidence level (22).
N = required sample size.
P = Probability of having a highly diversified diet (25.4%).
Q = Probability of not having a diversified diet (1–25.4%).
D = Margin of Error = 5% = (0.05).
For the second specific objective of the study, Epi-Info software statistics were employed for sample size calculation, using 80% power and a 95% confidence interval, according to studies conducted in the Ilu Ababori zone, Shashemene town, and west Gojjam zone. Since the sample size of the first objective is greater than that of the second objective, a sample size of 292 was implemented for pregnant mothers in this study. Using a design effect of 1.5 and a response rate of 10%, the total sample size for this study was 482.
Sampling procedure
Three sub-clusters were selected using a simple random sampling method among seven sub-clusters in Nekemte town. From this sub-cluster, 482 pregnant women were proportionally allocated to the three selected sub-cities. We identified all eligible pregnant women through house-to-house visits with the help of health extension workers. The total number of households with pregnant women was accessed in selected sub-cities of the town. After the sampling interval (K) was calculated, households with eligible pregnant women were selected using a systematic random sampling technique. We selected pregnant women using the lottery method for households with more than one pregnant woman. If the pregnant women were not at home during the first visit, the data collators visited their house the next day; the pregnant women who were not available during the second visit were recorded as non-responsive. First, the initial pregnant woman was selected from the eligible group randomly, and then subsequent pregnant women were selected systemically. Then, pregnant women were selected at every Kth value until the sample size was fulfilled. All selected pregnant women were interviewed through house-to-house visits by data collectors.
Data collection tools and techniques
Prior to data collection, experienced and skilled data collectors were selected. The tools used in the study were adapted to different literature with similar objectives and demographic health surveys (DHS). Before the actual data collection, a questionnaire to collect demographic, health, and dietary data was prepared in English and then translated into Afan Oromo. After some corrections to the original tools had been made, the final version of the questionnaire was again translated into Afan Oromo.
Four nurses with Bachelor of science (BSc) degrees in nursing were involved in data collection. Two BSc health professionals were recruited for supervision. Data completion and accuracy were checked each day during data collection. Before interviews, informed voluntary written and signed consent was obtained. Initially, participants were asked to complete a brief questionnaire related to demographics, obstetrics, health care, food taboos, home food insecurity, food habits, and nutritional knowledge. Household food security status was assessed using the Household Food Insecurity Access Scale (HFIAS) (23). Household food security was categorized as food insecure for those who scored 2 or above out of 27 household food insecurity indicators and as food secure for pregnant women who scored less than 2 out of 27 household food insecurity indicators (23). Data were collected using interviewer-administered questionnaires and the 24-h recall method adapted from various literature, primarily Food and Agriculture Organization (FAO) guidelines for measuring household and individual dietary diversity (24). A total of 10 food groups were considered in this study, i.e., cereals (grains, white roots and tubers, and plantain), pulses (beans, peas, and lentils), nuts and seeds, dairy products, meat (any animal meat products, poultry, and fish), eggs, dark green leafy vegetables, other vitamin A-rich fruits and vegetables, other vegetables, and other fruits. The principal investigator managed the overall supervision and coordination (21, 25).
A wealth index was employed to estimate the economic level of the families. The wealth dispersion was generated by applying principal component analysis. The index was calculated using 17 household variables, including ownership of a latrine, selected household assets, housing standard, and source of water used for drinking and cooking. Lastly, the wealth data was categorized into quintiles: poorest, poor, medium, rich, and richest (26).
Data quality assurance
The data collectors were by the principal investigator. The training emphasized the data collection tool, how to handle the data, and the privacy and confidentiality of the information collected.
A pre-test was conducted on 10% of the total sample in the Burka Jato sub-city, the nonselected setting, to ensure data quality and test the competency of the data collectors. Data collection was also conducted under close supervision. Proper categorization and coding of the data was maintained for quality and all data were checked for completeness, accuracy, and clarity by the principal investigator and supervisors immediately after the data were collected.
Data processing and analysis
Data were entered into EpiData version 3.1, cleaned, coded, and checked for missing data and outliers before being exported to STATA version 14 for further analysis. Descriptive statistics were done to summarize the data. Frequencies, cross-tabulation, and percentages were calculated for all the categorical variables. The goodness of fit was checked by the Hosmer-Lemeshow statistic and omnibus tests. All the independent variables were entered into the equation first, and each one was removed one at a time if they did not contribute to the regression equation. All variables with p < 0.25 in the bivariable analyses were included in the final model of multivariable analysis to control all possible confounders. A multico-linearity test was carried out to show the correlation between independent variables using the collinearity statistics (variance inflation factors >10 were considered suggestive of the existence of multico-linearity). Backward elimination was used. Explanatory variables significantly associated with outcome variables with a value of p < 0.05 in multivariable analysis were determined as factors associated with adequate dietary diversity. To measure the strength of the association between predictors and outcome variables, odds ratios with a 95% confidence interval were calculated.
Dependent variable
Adequate dietary diversity status.
Independent variables
Socio-demographic factors: age, marital status, occupation, maternal education, religion, ethnicity, family size, wealth index.
Household food security status: food-secure household or food - insecure household.
Pregnancy and healthcare-related factors: early marriage, birth interval, parity, illness during pregnancy, history of complications, antenatal care (ANC) visit, history of multiple pregnancies, gestational age.
Food habits: meal frequency/size, food taboos, food cravings, food aversions, pica, substance use (smoking and alcoholism), coffee consumption, nutritional knowledge.
Operational definition and definition of terms
Dietary Diversity Status: Number of food groups consumed by pregnant women out of the 10 food groups; food groups include starch staples, pulses, nuts, any meat products (including poultry and fish), dark green leafy vegetables, vitamin A-rich vegetables and fruits, and other vegetables and fruits (21).
Adequate Dietary Diversity: Dietary diversity score of pregnant women receiving at least 5 food groups out of 10 (21, 25).
Inadequate Dietary Diversity: When pregnant women consumed less than 5 of the 10 food groups within 24 h before the survey at third trimester (21, 25).
Good Dietary Knowledge: Women had good dietary knowledge if they scored greater than or equal to the mean.
Poor Dietary Knowledge: Women had poor dietary knowledge if they scored less than the mean (21, 25).
Food-Insecure Household: Pregnant women who scored 2 and above out of 27 household food insecurity access scale indicator (23).
Food-Secure Household: Pregnant women who scored less than 2 out of 27 household food insecurity indicators (23).
Ethical considerations
Prior to data collection, ethical approval was obtained from Wollega University Institute of Health Sciences, postgraduate study, ethical review committee. An official letter was written to the Nekemte town health department. After permission was obtained from the town health department, a permission letter would be given to the sub-city administrative office. Health facility management and staff were also informed about the purpose of the research. Finally, written consent was obtained from individual study participants. The purpose and objective of the research were clearly explained to the study participants. In addition, the study participants were assured of confidentiality. They were also assured that in the event they want to withdraw from the interview at any point, they would be free to do so and there would be no penalty for this action.
Results
Socio-demographic characteristics
A total of 482 pregnant women were eligible and 475 consented, giving a response rate of 98.5%. The mean age of the women was 27.9 (±5.2), ranging from 16 to 42. The majority of respondents, 438 (92.2%), were married, 266 (56.0%) of them had received a formal education (Grade 1–12), and half of them, 263 (55.7%), were Protestant (Table 1).
Table 1
| Variables | Frequency (n) | Percentage (%) |
|---|---|---|
| Age (years) | ||
| <24 | 105 | 22.1 |
| 24–35 | 310 | 65.3 |
| >35 | 60 | 12.6 |
| Mean (± SD) | 27.9 (± 5.2) | |
| Maternal marital status | ||
| Single | 8 | 1.7 |
| Divorced | 17 | 3.6 |
| Married | 438 | 92.2 |
| Widowed | 12 | 2.5 |
| Maternal educational status | ||
| No formal education | 26 | 5.5 |
| Elementary school (1–8) | 74 | 15.9 |
| High School (9–12) | 192 | 40.4 |
| College and above | 183 | 38.5 |
| Maternal occupation | ||
| Housewife | 200 | 42.1 |
| Merchant | 98 | 20.6 |
| Daily Laborer | 38 | 8.0 |
| Governmental employees | 111 | 23.4 |
| Student | 28 | 5.89 |
| Ethnicity | ||
| Oromo | 402 | 84.6 |
| Amara | 49 | 10.3 |
| Gurage | 24 | 5.1 |
| Age at marriage (years) | ||
| <18 | 21 | 4.4 |
| 18–24 | 369 | 77.7 |
| >24 | 85 | 17.9 |
| Time to reach nearest health facility | ||
| <30 min | 414 | 87.2 |
| ≥30 min | 61 | 12.8 |
| Wealth index | ||
| Poorest | 109 | 23.0 |
| Poor | 82 | 17.3 |
| Middle | 95 | 20.0 |
| Rich | 95 | 20.0 |
| Richest | 94 | 19.8 |
| Family size | ||
| ≤ 3 | 170 | 35.8 |
| 4–5 | 207 | 43.58 |
| >5 | 98 | 20.6 |
| Household food security status | ||
| Secure | 59 | 12.4 |
| Insecure | 416 | 87.6 |
Socio-demographic characteristics of pregnant women in Nekemte town, Western Ethiopia, October 2021 (n = 475).
Pregnancy and feeding pattern related characteristics
Approximately 221 (46.53%) pregnant women were in the second trimester of pregnancy during the assessment. More than three-forth, 374 (78.74%), of pregnant women reported that they had attended an antenatal care visit. Approximately 286 (60.2%) pregnant women consumed four or more meals per day on the last day before assessment. On the other hand, 66 (13.89%) pregnant women had had complications during their current pregnancy (Table 2).
Table 2
| Characteristics | Category | Frequency | Percent |
|---|---|---|---|
| Number of pregnancy | ≤2 | 302 | 63.6 |
| 3–4 | 160 | 33.7 | |
| ≥5 | 13 | 2.7 | |
| Parity | 0 | 184 | 38.7 |
| 1–2 | 239 | 50.3 | |
| ≥3 | 52 | 10.9 | |
| Birth interval (months) | 12–36 | 228 | 48.0 |
| >36 | 247 | 52.0 | |
| Gestational Age | First trimester (< 16 weeks) | 77 | 16.2 |
| 2nd trimester (16–27 weeks) | 221 | 46.5 | |
| 3rd trimester (≥28 weeks) | 177 | 37.5 | |
| Age at first pregnancy | <24 years | 238 | 50.1 |
| ≥24 Years | 237 | 49.9 | |
| ANC | Had not attended | 101 | 21.3 |
| Had Attended | 374 | 78.7 | |
| Complications during current pregnancy |
No | 409 | 86.1 |
| Yes | 66 | 13.9 | |
| Food taboos | No | 416 | 87.9 |
| Yes | 59 | 12.4 | |
| Craving | No | 286 | 60.2 |
| Yes | 189 | 39.8 | |
| Food aversion | No | 368 | 77.5 |
| Yes | 107 | 22.5 | |
| Food Pica | No | 437 | 92.0 |
| Yes | 38 | 8.0 | |
| Fasting | No | 433 | 91.2 |
| Yes | 42 | 8.8 | |
| Meal frequency | <4 | 189 | 39.8 |
| ≥4 | 286 | 60.2 | |
| Maternal nutritional knowledge | Poor | 285 | 60.0 |
| Good | 190 | 40.0 |
Pregnancy and feeding pattern-related characteristics of pregnant women Nekemte town, Western Ethiopia, October 2021 (n = 475).
Prevalence of adequate dietary diversity
The mean dietary diversity score was 4.29 ± 1.18. Of the total respondents, 43.58% (95% CI = 39.10–48.05) had adequate dietary diversity (Figure 1).
Figure 1
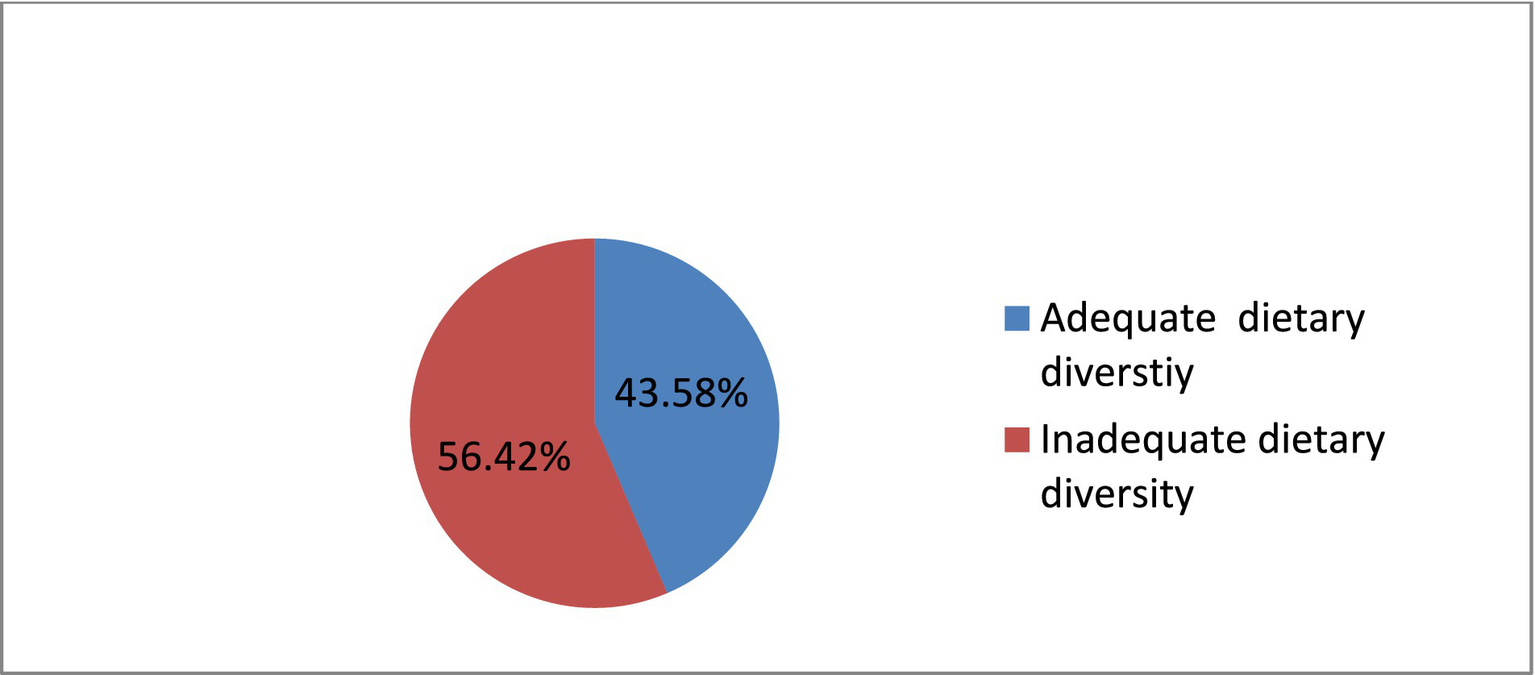
Prevalence of adequate dietary diversity among pregnant women in Nekemte town, Western Ethiopia, October 2021 (n = 475).
Food consumption patterns
In terms of food groups consumed by pregnant women in the previous 24 h, 100% consumed starchy stable food groups, 89.5% consumed other vegetable food groups, 81.9% consumed pulse food groups, 50.3% consumed dark green leafy vegetables, and 30.5% consumed other vitamin-A-rich fruits and vegetables, while the least-consumed food groups were fish, poultry, and meat (19.8%) and nuts and seeds (9.7%) (Figure 2).
Figure 2
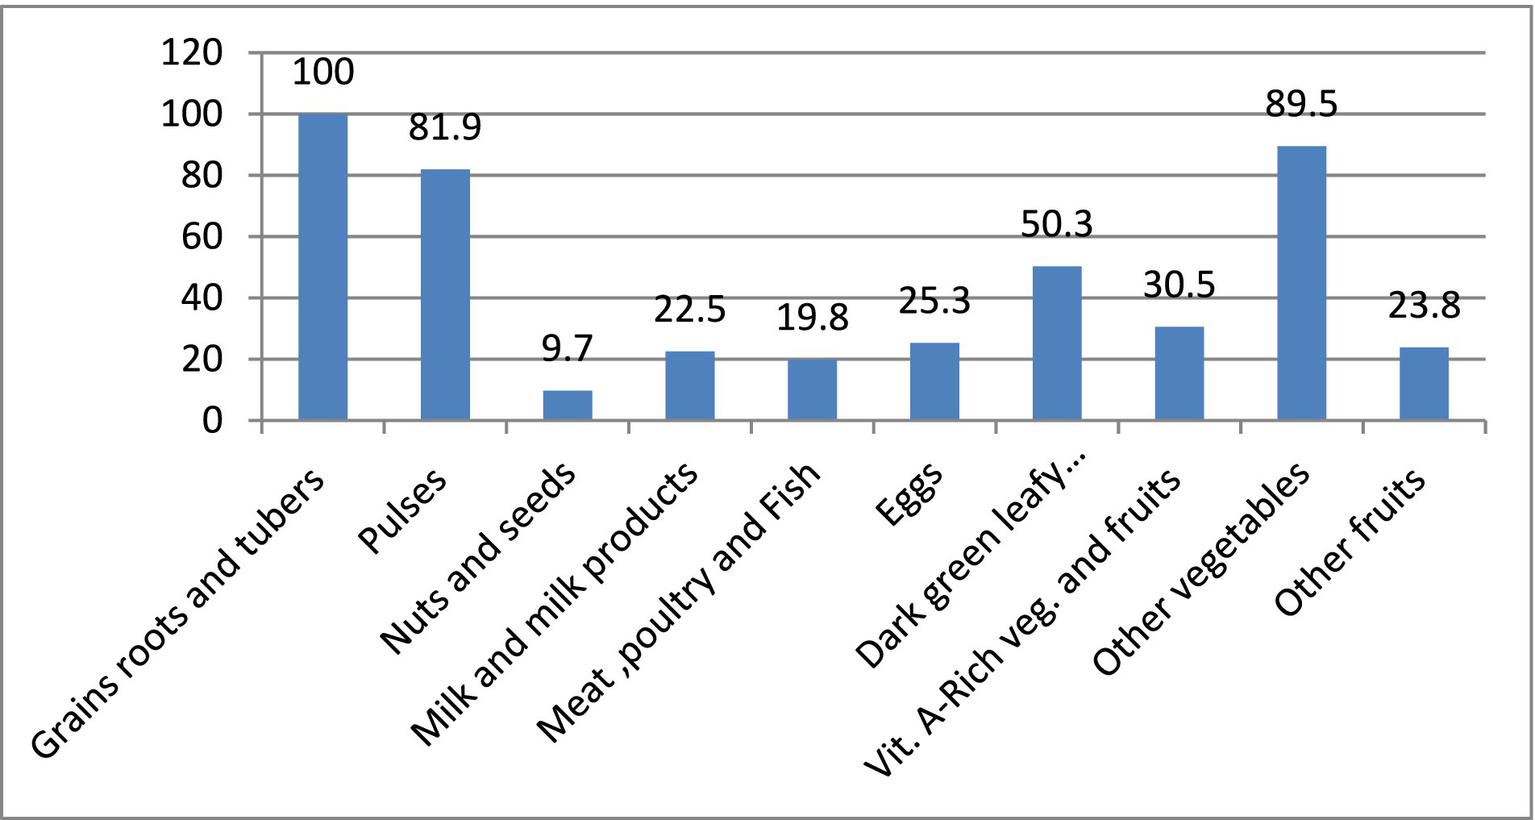
Food consumption patterns of pregnant women in Nekemte town, Western Ethiopia, October 2021 (n = 475).
Factors associated with adequate dietary diversity
In the bivariable analysis, maternal nutritional knowledge, wealth index, household food insecurity, maternal age, maternal educational status, maternal occupation, family size, gestational age, antenatal visits, food taboos, gravida, and food frequency were found to be candidates for multivariable analysis at value of p < 0.25. The Hosmer and Lemeshow goodness of fit gave p = 0.734, suggesting evidence of the goodness of fit of the model.
Adequate dietary diversity was 3.2 times (AOR = 3.17; 95%CI = 1.60–6.28) more likely among the rich quintiles compared to the poorest, 2.2 times (AOR = 2.16; 95%CI =1.22–3.84) more likely among those who had attended antenatal care compared to their counterparts, and almost 2 times (AOR = 1.87; 95%CI =1.01–3.49) more likely among government employees compared to housewives. However, adequate dietary diversity in pregnant women was found to be 66.2% (AOR = 0.34; 95% CI = 0.17–0.66) less likely in food-insecure households, 60% (AOR = 0.40; 95% CI = 0.20–0.81) less likely in third-trimester pregnancy compared to first-trimester pregnancy, and 38.7% (AOR = 0.61; 95% CI = 0.38–0.99) less likely in women who had not changed their meal frequency compared to those who had increased meal frequency (Table 3).
Table 3
| Variables | Dietary diversity | COR (95%CI) | AOR (95%CI) | value of p | |
|---|---|---|---|---|---|
| Adequate (207) |
Inadequate (268) |
||||
| Maternal nutritional knowledge | |||||
| Poor | 109 (52.7) | 176 (65.7) | 1 | 1 | |
| Good | 98 (34.3) | 92 (47.3) | 1.720 (1.19–2.49) | 1.304 (0.85–1.99) | 0.27 |
| Wealth Index | |||||
| Poorest | 26 (12.6) | 83 (31.0) | 1 | 1 | |
| Poor | 35 (16.9) | 47 (17.5) | 2.378 (1.28–4.42) | 3.10 (1.55–6.20) | 0.001 |
| Middle | 41 (19.8) | 54 (20.2) | 2.42 (1.33–4.41) | 2.20 (1.13–4.28) | 0.02 |
| Rich | 54 (26.1) | 41 (15.3) | 2.20 (2.31–7.65) | 3.17 (1.60–6.28) | <0.001** |
| Richest | 51 (24.6) | 43 (16.0) | 3.79 (2.08–6.89) | 2.54 (1.26–5.10) | 0.01 |
| Maternal household food security | |||||
| Secure | 18 (19.8) | 41 (6.7) | 1 | 1 | |
| Insecure | 166 (80.2) | 250 (93.2) | 0.292 (0.16–0.53) | 0.34 (0.17–0.66) | <0.001** |
| Maternal age (years) | |||||
| <24 | 40 (19.3) | 65 (24.3) | 1 | 1 | |
| 24–35 | 142 (68.6) | 168 (62.7) | 0.82 (0.49–1.38) | 1.01 (0.57–1.79) | 0.98 |
| >35 | 25 (12.1) | 35 (13.1) | 0.69 (0.40–1.18) | 0.69 (0.29–1.64) | 0.40 |
| Maternal educational status | |||||
| No formal Educ. | 8 (3.9) | 18 (6.7) | 1 | 1 | |
| Elementary school (1-8) | 23 (11.1) | 51 (19.03) | 1.02 (0.39–2.67) | 1.12 (0.39–3.27) | 0.83 |
| High School (9-12) | 82 (39.6) | 110 (41.0) | 1.68 (0.70–4.05) | 1.26 (0.48–3.33) | 0.64 |
| College & above | 94 (45.4) | 89 (33.21) | 2.38 (0.98–5.74) | 1.14 (0.45–3.46) | 0.681 |
| Maternal occupation | |||||
| Housewife | 69 (33.3) | 131 (48.9) | 1 | 1 | |
| Merchant | 47 (22.71) | 51 (19.03) | 1.75 (1.07–2.86) | 1.55 (0.87–2.64) | 0.15 |
| Daily Laborer | 15 (7.3) | 23 (8.6) | 1.24 (0.61–2.53) | 2.07 (0 0.93–4.63) | 0.08 |
| Student | 11 (5.3) | 17 (6.3) | 1.23 (0.55–2.77) | 1.13 (0.45–2.81) | 0.80 |
| Government employee | 65 (30.9) | 46 (16.8) | 2.68 (1.67–4.32) | 1.87 (1.01–3.48) | 0.047* |
| Maternal family size | |||||
| ≤ 3 | 61 (29.5) | 109 (40.5) | 1 | 1 | |
| 4–5 | 103 (49.5) | (104 38.8) | 1.77 (1.17–2.68) | 1.59 (0.93–2.71) | 0.09 |
| >5 | 43 (20.8) | 55 (20.5) | 1.40 (0.84–2.32) | 0.95 (0.49–1.86) | 0.10 |
| Gestational age | |||||
| First trimester (< 16 weeks) | 38 (18.4) | 39 (14.6) | 1 | 1 | |
| Second trimester (16–27 weeks) | 98 (47.3) | 123 (45.9) | 0.82 (0.49–1.38) | 0.56 (0.29–1.05) | 0.073 |
| Third trimester (≥28 weeks) | 71 (34.3) | 106 (39.6) | 0.69 (0.40–1.18) | 0.40 (0.20–0.81) | 0.01* |
| Antenatal care | |||||
| Had not attended | 33 (15.9) | 68 (25.4) | 1 | 1 | |
| Had Attended | 174 (84.1) | 200 (74.6) | 1.792 (1.13–2.85) | 2.16 (1.22–3.84) | 0.01* |
| Food taboos | |||||
| No | 177 (85.51) | 239 (89.2) | 1 | 1 | |
| Yes | 30 (14.5) | 29 (10.8) | 1.40 (0.81–2.41) | 1.542 (0.85–2.81) | 0.16 |
| Gravida | |||||
| ≤2 | 125 (60.4) | 177 (66.0) | 1 | 1 | |
| 3–4 | 78 (37.7) | 82 (30.6) | 1.35 (0.92–1.98) | 1.087 (0.63–1.87) | 0.76 |
| ≥5 | 4 (1.9) | 9 (3.4) | 0.63 (0.19–2.09) | 0.915 (0.214–3.91) | 0.91 |
| Food frequency | |||||
| Increased | 121 (58.5) | 123 (45.9) | 1 | 1 | |
| No change | 62 (29.9) | 110 (41.1) | 0.57 (0.38–0.86 | 0.61 (0.38–0.99) | 0.044 |
| Decreased | 24 (29.9) | 35 (41.1) | 0.70 (0.39–1.24) | 0.77 (0.39–1.49) | 0.43 |
Multivariable analysis of factors associated with adequate dietary diversity in pregnant women in Nekemte town, Western Ethiopia, October 2021 (n = 475).
COR, crude odd ratio; AOR, adjusted odd ratio.
**Statistically significant at value of p < 0.001.
*Statistically significant at value of p < 0.05.
Discussion
The aim of this study was to assess the prevalence and factors associated with adequate dietary diversity among pregnant women in Nekemte Town. The study investigated the dietary diversity status of pregnant women in Nekemte town, which showed that the prevalence of adequate dietary diversity was 43.6% (95% CI: 39.1–48.1%). Moreover, wealth index, antenatal care, occupation, household food insecurity, gestational age, and meal frequency were identified as factors associated with adequate dietary diversity among pregnant women in Nekemte town.
The study indicated that the overall status of adequate dietary diversity was found to be low. This study’s findings are nearly identical to previous studies reported in Nepal (45%) (27); Wachamo town, Southern Ethiopia (42.6%) (28); and Dire Dawa city administration, Ethiopia (43%) (29). The results of this study revealed that the rate of adequate dietary diversity is lower than the studies carried out in Pakistan (89%); Ghana (79.9%); Illu Aba Bor zone, Southwest Ethiopia (65.5%); and Jimma zone south-west Ethiopia (56.4%) (27, 30–32). However, the prevalence of the present study are considerably higher than the reported rates in Gojjam north Ethiopia (19.9%) and northeast Ethiopia (31.4%) (33, 34). This discrepancy might be because of socio-demographic, socioeconomic, and seasonal variations.
The current study revealed that household wealth was significantly associated with adequate dietary diversity among pregnant women. This finding is in agreement with studies carried out in Ethiopia (30), Bangladesh (35), and Ghana (31), whereby adequate dietary diversity was reportedly more likely among the rich compared to the poorest quintiles. Also, a previous study done in Ethiopia showed that, there are increased odds of dietary diversity practiced by 85% in rich pregnant women than in poor pregnant women (33). Therefore, households with the richest wealth index have a better chance of having diversified diets; a possible reason for this is that higher income is associated with increased purchasing power, which can help promote dietary diversity.
Another factor that was found to be associated with adequate dietary diversity among pregnant women was household food insecurity.
Mothers from food-insecure households were found to be less likely to consume a diversified diet compared to their counterparts. This result is similar to the findings of studies conducted in Ethiopia (28, 30, 33, and) and Ghana (31), which revealed women from households experiencing food insecurity were less likely to achieve adequate dietary diversity. This might be related to the low availability and accessibility of adequate food in food-insecure households. Another possible reason may be that mothers in food-insecure households are likely to reduce their food intake to provide for their infants and small children, which leads to the mother’s inadequate dietary diversity.
In this study, pregnant women who had attended antenatal care were more likely to consume diversified food groups compared with their counterparts. Other studies carried out in Ethiopia showed that pregnant women who had ANC visit were more likely to attain adequate dietary diversity than those who had not (36, 37). Furthermore, a study conducted in Ghana investigated that frequent ANC attendance was a significant independent predictor of maternal dietary diversity (31). This might be explained by the fact that when pregnant women attend ANC, they receive nutrition information from health professionals and follow healthy dietary practices.
The findings of the present study are in agreement with several studies in Ethiopia that reported that women who had not yet started to consume an additional meal in pregnancy were less likely to have an adequate diversified diet compared to those who had started consuming additional meals (23, 27). Another study in the east Gojjam zone of northwest Ethiopia and Hossana town, south Ethiopia found that increasing meal frequency improves women’s dietary diversity (36, 37). This might be because pregnant women who consume an additional meal per day have a greater chance of accessing different food groups.
Similar to reports from Raya Azebo zone, Tigray region, Ethiopia (38), Kenya (17), and Nepal (27), the occupational status of pregnant women was found to be significantly associated with adequate dietary diversity in this study setup. This study showed that pregnant women who were government employees had higher dietary diversity compared to those who were housewives. Housewives are more confined to household work and are more financially dependent on their families and partners than government employees. This might be due to women who participate in yielding their family financial income having a better chance of earning income and better access to diversified foods and appropriate diets. Being in the third trimester was negatively associated with adequate dietary diversity. This relationship was also reported by another study carried out in Dessie town, northeastern Ethiopia (34).
Many women report that they eat better at the start of pregnancy (what they eat becomes more important); however, they do not always maintain the changes throughout pregnancy for unknown reasons (39). The possible reason might be that mothers adhere to specific diets because they habituate and adapt to the specific diets they prefer.
Conclusion
This study has revealed a low prevalence of adequate dietary diversity among pregnant women. Adequate dietary diversity was positively associated with households with the richest wealth index, women who had attended antenatal care, and pregnant women who were government employees. However, adequate dietary diversity was negatively associated with food-insecure households, late gestational age (third trimester), and no changes in meal frequency during pregnancy.
Recommendations
Nutritional education intervention needs to be tailored to meet the needs of pregnant women to improve their food intake frequency and the variety in their diet. Appropriate dietary intake and meal frequency counseling during ANC, delivery, and postnatal care are very important for improving dietary diversity during pregnancy. Support is needed for strengthening saving habits and establishing small-scale enterprises to create off-arm income opportunities to improve pregnant women’s buying power, leading to adequate dietary diversity. All development sectors need to collaborate to improve the dietary diversity and nutritional status of pregnant women through promoting and strengthening sustainable income-generating activities and saving strategies to improve the wealth status of pregnant women.
Statements
Data availability statement
The raw data supporting the conclusions of this article will be made available by the authors, without undue reservation.
Ethics statement
The studies involving human participants were reviewed and approved by the Wollega University Ethical Review Board. The patients/participants provided their written informed consent to participate in this study.
Author contributions
HB, BA, MF, and JS were involved in the study conception, study design, statistical analysis, and results interpretation. All authors contributed to the article and approved the submitted version.
Acknowledgments
We would like to express our sincere appreciation to Wollega University, the study participants, and the data collectors.
Conflict of interest
The authors declare that the research was conducted in the absence of any commercial or financial relationships that could be construed as a potential conflict of interest.
Publisher’s note
All claims expressed in this article are solely those of the authors and do not necessarily represent those of their affiliated organizations, or those of the publisher, the editors and the reviewers. Any product that may be evaluated in this article, or claim that may be made by its manufacturer, is not guaranteed or endorsed by the publisher.
- ANC
Antenatal care
- AOR
Adjusted Odd Ratio
- CI
Confidence Interval
- COR
Crude Odd Ratio
- DDS
Dietary Diversity Score
- EAR
Estimated Average Requirement
- FANTA
Food and Nutrition Technical Assistance
- FAO
Food and Agriculture Organization of the United Nations
- FHI
Family Health International
- LMIC
Lower-Middle Income Countries
- MDD
Minimum Dietary Diversity
- MDD-W
Minimum Dietary Diversity for Women of Reproductive Age
- POU
Prevalence of Undernourishment
- STATA
Statistics Data
- UNICEF
United Nations International Children’s Fund
- USAID
United State Aid For International Development
- WRA
Women of Reproductive Age
Glossary
References
1.
USAID. Empowering new generations to improve nutrition an economic opportunities (ENGINE), a project of the US Global Health initiative and feed the future, AID-663-A-11_00017.
2.
Ellen M Anthony B Deirdre M . Milk and dairy product in human nutrition. Rome, Italy: Fao of the United Nation (2013). 28 p.
3.
Mary A Marie T . Dietary diversity is associated with child nutritional status: evidence from demographic and health surveys. J Nutr. (2004) 134:2579–85.
4.
Daniels CM . Dietary diversity as a measure of Women’s diet quality in resource-poor areas: results from metropolitan Cebu, Philippines site In: Technical assistance II project. Washington: Food and Nutrition (2009). FANTA-2.
5.
USAID . Maternal nutrition during pregnancy, LINKAGES academy for educational development 1825. Connecticut Avenue, NW, Washington, DC: USIAID guideline (2009).
6.
Aya M Amreen NS . Pregnancy diet and nutrition, what to eat what not to eat. J Nutrient. (2019) 20:3.
7.
King JC . Pregnancy and nutrient metabolism, Physiology of pregnancy and nutrient metabolism. Am J Clin Nutr. (2000) 71:1218s–25S. doi: 10.1093/ajcn/71.5.1218s
8.
WHO . Nutrition of women in the preconception period, during pregnancy and the breastfeeding period report by the secretariat: sixty-fifth world health assembly A65/20 12; provisional agenda item 13.3.
9.
Torheim LE Ferguson EL Penrose K Arimond M . Women in resource-poor settings are at risk of inadequate intakes of multiple micronutrients. J Nutri. (2010) 140:2051S–8S. doi: 10.3945/jn.110.123463
10.
Abu-saad K Fraser D . Maternal nutrition and birth outcomes. Epid Rev. (2010) 32:5–25. doi: 10.1093/epirev/mxq001
11.
Johns T Sthapit BR . Biocultural diversity in the sustainability of developing-country food systems. Food Nutr Bull. (2004) 25:143–55. doi: 10.1177/156482650402500207
12.
WHO, UNICEF, UNFPA, The World Bank and the United Nations Population Division . Trends in maternal mortality: 1990 to 2015 Geneva: WHO, 2015. 19. Imamura, F et al. dietary quality among men and women in 187 countries in 1990 and 2010. Lancet Global Health 2015. 3:132–42.
13.
Anderson AS . Symposium ‘nutritional adaptation to pregnancy and lactation’. Pregnancy as a time for dietary change. Proc Nutr Soc. (2001) 60:497–504. doi: 10.1079/PNS2001113
14.
Rebecca L . Lander pregnant women in four low-middle income countries have a high prevalence of inadequate dietary intakes that are improved by dietary diversity (2019) 10:1560
15.
Ruel MT . Operationalizing dietary diversity: a review of measurement issues and research priorities. J Nutr. (2003) 133:3911S–26S. doi: 10.1093/jn/133.11.3911S
16.
Lumole Zerida Samwel . Household dietary diversity and nutritional status of children and women of reproductive age in Madizini township and its hinterland villages, (2015). Available at:https://www.semanticscholar.org/author/Zerida-Samwel-Lumole/104575963
17.
Willy K Judith K Peter C . Determinants of dietary diversity among pregnant women in Laikipia County, Kenya: a cross-sectional study. BMC Nutr. (2017) 3:1–8. doi: 10.1186/s40795-017-0126-6
18.
Alkalash RT Nazeha A Nagwa N . Dietary practice and nutritional status among pregnant women attending antenatal Care of Egyptian, rural family health unit Safa Hamdy. The Egyptian. J Hosp Med. (2021) 83:1030. doi: 10.21608/ejhm.2021.160053
19.
Asssefa T Banjaw B Gebreab G Hailu Aand Wodajew B . Inadequacy of dietary intakes among pregnant women in Ethiopia, micronutrient forum 5th global conference, Available at: https://www.eventscribe.com/2020/MNF-CONNECTED/index.asp?launcher=1
20.
Imdad A Bhutta ZA . Maternal nutrition and birth outcomes: effect of balanced protein-energy supplementation. Pediatr Perinat Epidemiol. (2012) 26:178–90. doi: 10.1111/j.1365-3016.2012.01308.x
21.
Nekemte town health office, 2021 annual report
22.
Melaku D Mohammed A Mesfin T Meskerem T . Dietary diversity and associated factors among pregnant women attending antenatal Clinic in Shashemane, Oromia, Central Ethiopia: a cross-sectional study. J Nutr Metabol. (2019)
23.
Deitchler M Ballard T Swindale A Coates J . Validation of a measure of household hunger for cross-cultural use In: Acedemy for educational development. Washington, DC: (2010)
24.
FAO . Minimum dietary diversity for women: a guide for measurement. Rome: FAO guideline (2016).
25.
FAO and FHI 360. Minimum Dietary Diversity for Women: a guide for measurement. Ro
26.
CSA and ICF . Ethiopia demographic and health survey. Ethiopia, and Rockville.Maryland, USA: Addis Ababa (2016).
27.
Shrestha V Paudel R Sunuwar DR Lyman ALT Manohar S Amatya A . Factors associated with dietary diversity among pregnant women in the western hill region of Nepal: a community based cross-sectional study. PLoS One. (2021) 16:e0247085. doi: 10.1371/journal.pone.0247085
28.
Romedan D Beakal Z Hassen M Ritbano A Habtamu H . Determinants of dietary diversity practice among pregnant women attending antenatal clinic at Wachemo university Nigist Eleni Mohammed memorial referral hospital, southern Ethiopia. PLoS One. (2021) 16:e0250037. doi: 10.1371/journal.pone.0250037
29.
Aman S Melake D Meyrema A Kedir T Dietary diversity and nutritional status of pregnant women attending public hospitals in Dire Dawa City, eastern Ethiopia. East Afr J Health Biomed Sci, (2018) Volume 2: 10–17,2018
30.
Dereje T Dessalegn T Tefera B . Factors associated with dietary practice and nutritional status of pregnant women in rural communities of Illu aba bor zone, Southwest Ethiopia. J Nutr Dietary Suppl. (2020) 12:103–12.
31.
Mahama S Sofo M Shaibu M . Determinants of dietary diversity and its relationship with the nutritional status of pregnant women, journal of nutritional. Science. (2021) 10. doi: 10.1017/jns.2021.6
32.
Melesse NK Dessalegn T Tefera B . Level and predictors of dietary diversity among pregnant women in rural south-West Ethiopia: a community-based cross-sectional study. BMJ Open. (2021) 11:e055125. doi: 10.1136/bmjopen-2021-055125
33.
Deyganto G Mathewos Alemu G Gistane A Dessalegn A . Prevalence of under nutrition and its associated factors among pregnant women in Konso district, southern Ethiopia: a community-based cross-sectional study. BMC Nutrition. (2021) 7:32. doi: 10.1186/s40795-021-00437-z
34.
Kang Y Hurley KM Ruel-bergeron J Monclus AB Oemcke R Shu L et al . Household food insecurity is associated with low dietary diversity among pregnant and lactating women in rural Malawi. Public Health Nutr. (2018) 22:697–705. doi: 10.1017/S1368980018002719
35.
FAO , 2016. Available at:http://www.fao.org/publications
36.
Walelgn T Tsegahun W Mamo D . Dietary diversity practice and associated factors among pregnant women attending ANC in Kolfe Keranyo sub city health centers, Addis Ababa, Ethiopia. (2020) 3, 14–22.
37.
Seid A Melkitu F Tadesse A Zemichael G . Dietary diversity practice and associated factors among pregnant women in north East Ethiopia. BMC Res Notes. (2019) 12:123. doi: 10.1186/s13104-019-4159-6
38.
Kemal J Mukemil A . Minimum dietary diversity score and associated factors among pregnant women at Alamata general hospital, Raya Azebo zone, Tigray region, Ethiopia. J Nutr Metabol. (2019) 2019. doi: 10.1155/2019/8314359
39.
Hoesli I . Nutrition in pregnancy. Glob Libr Women’s Med. (2009):1756–2228. doi: 10.3843/GLOWM.10097
Summary
Keywords
dietary diversity, pregnant women, factors associated, dietary adequacy, Nekemte Twon
Citation
Bikila H, Ariti BT, Fite MB and Sanbata JH (2023) Prevalence and factors associated with adequate dietary diversity among pregnant women in Nekemte town, Western Ethiopia, 2021. Front. Nutr. 10:1248974. doi: 10.3389/fnut.2023.1248974
Received
28 June 2023
Accepted
03 November 2023
Published
15 December 2023
Volume
10 - 2023
Edited by
Minatsu Kobayashi, Otsuma Women's University, Japan
Reviewed by
Maryam Amini, National Nutrition and Food Technology Research Institute, Iran; Mahdi Shadnoush, Shahid Beheshti University of Medical Sciences, Iran
Updates
Copyright
© 2023 Bikila, Ariti, Fite and Sanbata.
This is an open-access article distributed under the terms of the Creative Commons Attribution License (CC BY). The use, distribution or reproduction in other forums is permitted, provided the original author(s) and the copyright owner(s) are credited and that the original publication in this journal is cited, in accordance with accepted academic practice. No use, distribution or reproduction is permitted which does not comply with these terms.
*Correspondence: Haile Bikila, haile.bikila@gmail.com
Disclaimer
All claims expressed in this article are solely those of the authors and do not necessarily represent those of their affiliated organizations, or those of the publisher, the editors and the reviewers. Any product that may be evaluated in this article or claim that may be made by its manufacturer is not guaranteed or endorsed by the publisher.