Abstract
Introduction:
Both conventional adenoma (AD) and serrated polyp (SP) were known precursor lesions of colorectal cancer (CRC). Modifiable lifestyle factors were significantly associated with CRC risk, but whether these factors were related to the risk of different precursors of CRC needed to be clarified. This study aimed to evaluate the risks of AD and SP caused by lifestyle factors and compare the risk differences between AD and SP.
Methods:
The study population was from the CRC screening cohort in Hangzhou, China. A total of 458,457 eligible individuals volunteered to undergo initial screening including the fecal immunochemical test (FIT) and the CRC risk assessment. Finally, 13,993 participants who had undergone colonoscopy tests and had been diagnosed at designated hospitals were selected in this study. All participants were required to fill out a questionnaire during the initial screening for collecting their information. The generalized estimate equation (GEE) model was used to assess the association between lifestyle factors/dietary preferences and AD/SP.
Results:
The body mass index (BMI) and smoking were positively associated with the risks of only SP (BMI: OR = 1.50, 95%CI: 1.23–1.84; smoking: OR = 1.29, 95%CI: 1.07–1.55), only AD (BMI: OR = 1.53, 95%CI: 1.28–1.82; OR = 1.24, 95%CI: 1.11–1.39), and synchronous SP and AD (BMI: OR = 1.97, 95%CI: 1.40–2.75; smoking: OR = 1.53, 95%CI: 1.27–1.85). In the case-group comparison, smoking was more strongly associated with the risk of synchronous SP and AD than only AD. Alcohol drinking was positively associated with the risk of AD (OR = 1.28, 95%CI: 1.14–1.44), but no statistically significant difference was observed in risks in the case-group comparison. Furthermore, whole-grain intake was associated with a decreased risk of only AD (OR = 0.78, 95%CI: 0.65–0.93). However, white meat intake was positively associated with risks of only SP when compared with AD cases (OR = 1.60, 95%CI: 1.15–2.23).
Conclusion:
The current study identified common risk factors such as BMI and smoking as well as different risks of certain factors (e.g., alcohol drinking and whole-grain intake) for SP and AD. However, there were still some factors, especially diet-related factors, that have not been fully elucidated in their association with the two lesions. Further research is needed in future to confirm and develop prevention strategies for different lesions.
1 Introduction
With the development of the social economy, the transformation of population structure and the disease spectrum, cancer has become one of the leading causes of premature death (<70 years old) in most countries (1). Among them, colorectal cancer (CRC) ranks as the third most common malignant tumor worldwide. New cases and deaths of CRC were estimated to account for one-tenth of all cancer cases in 2020 (2). For decades, it was generally believed that conventional adenoma (AD) was the only known precursor lesion of CRC (3), caused by abnormal cell proliferation or DNA mismatch repair (4), and ultimately formed invasive cancer via the adenoma–carcinoma sequence. However, along with the improvement of detection technology, it has been found that CRC could be derived from another precursor pathway (5). Through the serrated-neoplasia pathway, serrated polyp (SP) has been estimated to give rise to approximately 15–30% of all CRC cases (3). According to the World Health Organization (WHO) classification of tumors of the digestive tract, SP has three known subtypes: hyperplastic polyp (HP), sessile serrated lesion (SSL), and traditional serrated adenomas (TSA) (6). These precursors, particularly the SSL subtype, were more frequently found in post-colonoscopy CRC, namely interval colorectal cancer (7), leading to the speculation that there was a high miss-rate of SPs in endoscopy or the serrated-neoplasia pathway would accelerate carcinogenesis (8). Therefore, serrated lesions with malignant potential have attracted increasing research attention; meanwhile, CRC was regarded as a heterogeneous disease.
Modifiable lifestyle factors were significantly associated with colorectal cancer (9). Smoking, alcohol intake, red meat, and processed meat consumption have been revealed to be risk factors for causing CRC in humans (10, 11). Thus, healthy changes in principal lifestyle factors can effectively prevent new CRC (12). However, do lifestyle risk factors show heterogeneity in the adenoma–carcinoma and serrated-neoplasia pathways? A few studies (13–16) have assessed whether these factors differed between different lesions and indicated the etiologic heterogeneity between the two precursor pathways. However, the current epidemiological evidence is inconsistent. For example, the association between alcohol intake and the serrated pathway has shown opposite results across the literature (14, 15). In addition, most of the evidence was limited by the sample size (15). Thus, large sample sizes of data were still needed to confirm the results of previous studies. In order to explore the role of lifestyle factors in different pathways of CRC, this study was based on a large population screening cohort in eastern China and aimed to evaluate the risks of conventional adenoma (AD) and serrated polyp (SP) caused by modifiable lifestyle factors and compare the risk differences between AD and SP.
2 Methods
2.1 Study population
This study was implemented in Hangzhou City, Zhejiang Province, China, from April 2020 to October 2020, for which residents aged 40 to 74 years were invited for a two-step CRC screening. The fecal immunochemical test (FIT) combined with the CRC risk assessment was adopted as the initial screening method, and colonoscopy was for the diagnostic examination. People assessed as high risk in FIT or risk assessment were both invited to undergo further testing. The high-risk threshold set for FIT was 20ug/g (100 ng/mL). The CRC risk assessment criteria (Supplementary material 1) were optimized on the basis of the Asia-Pacific Colorectal Screening scoring (17). In the end, a total of 458,457 eligible individuals volunteered to participate in the initial screening, and among them, 85,340 participants were assessed as being high risk for CRC, who were invited to take a colonoscopy examination for further diagnosis. During the screening period, 30.3% of the high-risk participants underwent a colonoscopy. In addition, a small number of residents at middle or low risk for CRC took the initiative to participate in the diagnostic screening. Therefore, a total of 25,964 participants underwent a colonoscopy examination. After excluding those with no colonoscopy diagnostic result, or with a diagnosis of non-adenomatous polyps or CRC, or with unreasonable questionnaire information, or with a previous diagnosis of intestines disease, including inflammatory bowel disease (IBD), colorectal adenomas, polyps, chronic diarrhea or constipation, and with previous malignancies, a total of 13,993 individuals were recruited in this study. Overall, the number of only SP cases, only AD cases, and synchronous SP and AD cases were 4,233, 1,097, and 638, respectively. The flow chart of the study sample is shown in Figure 1.
Figure 1
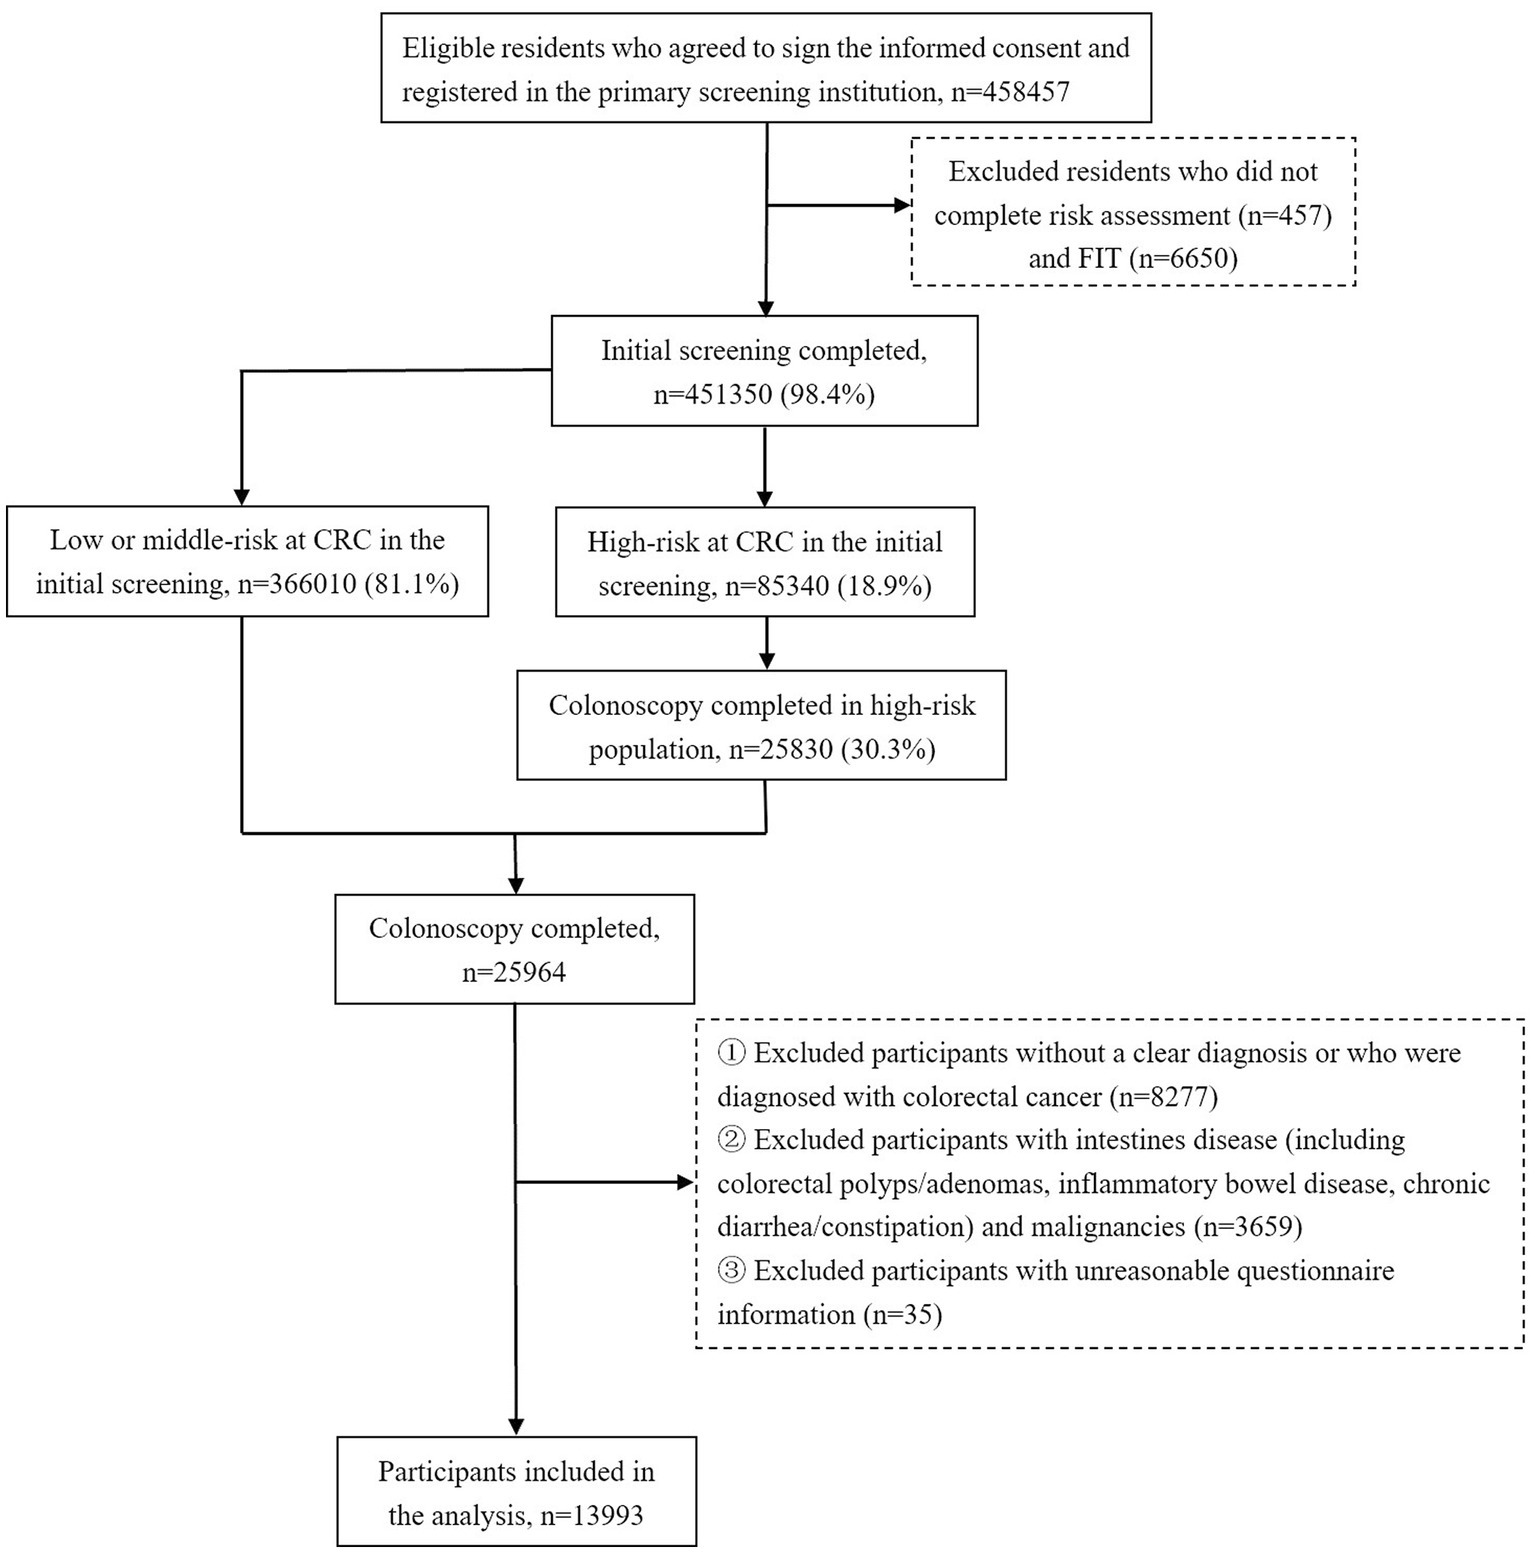
Flow chart of participants inclusion in the analysis.
2.2 Variable definition
In the initial screening, participants were required to fill out a questionnaire through a face-to-face survey for their detailed information, which was reported by the participants themselves. The questionnaire was based on the questionnaire of the Cancer Screening Program in Urban China (CanSPUC), which was a national major public health service project in China (18). Data collected from the participants included sociodemographic characteristics and lifestyle factors relevant to CRC, such as sex, age, body weight and height, education status, marital status, history of diagnosed diseases including malignant tumors and intestine diseases, first-degree relative’s family history of CRC and familial adenomatous polyps, regular aspirin use, cigarette smoking, alcohol drinking, physical activity, and dietary preference. Body mass index (BMI) was calculated as weight (kg) divided by height (m) squared and was classified into low weight (<18.5 kg/m2), normal weight (18.5–23.9 kg/m2), overweight (24–27.9 kg/m2), and obesity (≥28 kg/m2) according to the guideline for the prevention and control of overweight and obesity in Chinese adults (19). Regular non-steroidal anti-inflammatory drugs (NSAIDs) use was defined as taking NSAIDs more than once a week. Smoking was categorized into never smoking, current smoking (more than 1 cigarette per day for more than 6 months), and former smoking (stop smoking for 2 years). Drinking was categorized into never drinking, current drinking (more than 1 time per week for more than 6 months), and former drinking (stop drinking for 2 years). The questionnaire asked residents how often they had participated in physical activity over the past year and divided it into five categories: never, 1–3 times per month, 1–2 times per week, 3–5 times per week, and every day or almost every day. The dietary preference survey asked participants how often they ate a variety of foods over the past year, with optional frequencies, including never, 1–3 days per month, 1–3 days per week, 4–6 days per week, and every day or almost every day. The food was categorized into types of diet, including vegetables, fruits, red meat, white meat, beans and soy products, preserved vegetables, processed meats, fried or grilled food, and whole grains.
All histological diagnosis was made by experienced physicians at designated hospitals, and detailed endoscopic data were recorded following a standard template, including bowel preparation, procedure completion, lesion location, type, size, morphology, and so on. The SP cases referred to individuals with HPs, SSLs, and TSAs. The AD cases referred to individuals with tubular adenomas, villous adenomas, tubular villous adenomas, and adenomas with dysplasia. If a participant had both SP and AD characteristics in the lesions at the same site, or a participant had both SP and AD lesions at a different site, then we regarded him as a synchronous SP and AD case in the current study.
2.3 Statistical analysis
Categorical variables were presented as frequency and percentage. The chi-square test was used to compare differences between groups of no polyp control group (including individuals with normal colonoscopy results or chronic colorectal inflammation), only SP cases, only AD cases, and synchronous SP and AD cases. Due to the participants from different districts, the relevant characteristics of participants were different across districts; therefore, the multivariate generalized estimate equation (GEE) model was used to assess the risk of lifestyle factors and dietary preferences for SP and AD, and the trend test was carried out for factors in ascending or descending categories. Sex, age group, education status, family history of CRC or familial adenomatous polyposis in first-degree relatives, cigarette smoking status, alcohol drinking status, frequency of physical activity, regular NSAID use, and dietary preference were adjusted in the model. In addition, the associations of a number of only SP and only AD cases with influencing factors were analyzed, respectively. In the analysis, duration, intensity, and quitting time of cigarette smoking and alcohol drinking were treated in tertile variables, respectively. R software (version 4.0.3) and SAS Studio were used for statistical analysis, and SAS Studio was mainly used for GEE model analysis. The value of p was considered as significant when less than 0.05 in a two-sided test. However, due to the multiple comparisons, the statistically significant level was adjusted by the false discovery rate (FDR).
3 Results
Table 1 presents demographic characteristics of the no polyp control group, only SP group, only AD group, and synchronous SP and AD groups. The detection rates of only SP, only AD, and synchronous SP and AD were higher in men than those in women (p < 0.001). Individuals aged 70–74 years showed the highest detection rate of only AD (40.2%) and synchronous SP and AD (5.6%), while those who aged 50–59 and 60–69 years had higher detection rates of only SP (8.3 and 8.1%) than the 70–74-year group (6.8%) (p < 0.001). Furthermore, significant differences between the four groups were also observed in the comparison of education status (p = 0.017) and family history of CRC (p < 0.001). There was a higher detection rate of only AD in the group who were illiterate (31.4%), but the detection rate of only SP was higher in those with a college education or above (9.3%). In addition, the detection rate of synchronous SP and AD was highest in the group with high school education or below. Participants who had a first-degree relative’s family history of CRC showed the highest prevalence of only AD (39.8%) and synchronous SP and AD (8.0%), but the prevalence of only SP was the lowest (6.6%). Individuals who had no idea about whether they had a family history of CRC exhibited the highest detection rate of only SP (9.6%). In addition, there were statistically significant differences in smoking and drinking status, physical activity, and regular aspirin use between the four groups.
Table 1
| Characteristic | Total (n = 13,993) | No polyp control (n = 8,025) | Only serrated polyp (SP) (n = 1,097) | Only conventional adenoma (AD) (n = 4,233) | Synchronous SP and AD (n = 638) | p | ||||
|---|---|---|---|---|---|---|---|---|---|---|
| N (%) | N (%) | Detection rate (%) | N | Detection rate (%) | N | Detection rate (%) | N | Detection rate (%) | ||
| Sex | <0.001 | |||||||||
| Male | 7,691 (55.0) | 3,710 (46.2) | 48.2 | 671 (61.2) | 8.7 | 2,859 (67.5) | 37.2 | 451 (70.7) | 5.9 | |
| Female | 6,302 (45.0) | 4,315 (53.8) | 68.5 | 426 (38.8) | 6.8 | 1,374 (32.5) | 21.8 | 187 (29.3) | 3.0 | |
| Age group, years | <0.001 | |||||||||
| 40~ | 248 (1.8) | 185 (2.3) | 74.6 | 12 (1.1) | 4.8 | 43 (1.0) | 17.3 | 8 (1.3) | 3.2 | |
| 50~ | 4,527 (32.4) | 3,071 (38.3) | 67.8 | 375 (34.2) | 8.3 | 957 (22.6) | 21.1 | 124 (19.4) | 2.7 | |
| 60~ | 6,469 (46.2) | 3,466 (43.2) | 53.6 | 522 (47.6) | 8.1 | 2,128 (50.3) | 32.9 | 353 (55.3) | 5.5 | |
| 70 ~ 74 | 2,749 (19.6) | 1,303 (16.2) | 47.4 | 188 (17.1) | 6.8 | 1,105 (26.1) | 40.2 | 153 (24.0) | 5.6 | |
| BMI | <0.001 | |||||||||
| Low weight | 434 (3.1) | 297 (3.7) | 68.4 | 20 (1.8) | 4.6 | 104 (2.5) | 24.0 | 13 (2.0) | 3.0 | |
| Normal weight | 7,427 (53.1) | 4,535 (56.5) | 61.1 | 549 (50.0) | 7.4 | 2043 (48.3) | 27.5 | 300 (47.0) | 4.0 | |
| Overweight | 5,285 (37.8) | 2,806 (35.0) | 53.1 | 453 (41.3) | 8.6 | 1761 (41.6) | 33.3 | 265 (41.5) | 5.0 | |
| Obesity | 847 (6.1) | 387 (4.8) | 45.7 | 75 (6.8) | 8.9 | 325 (7.7) | 38.4 | 60 (9.4) | 7.1 | |
| Ethnicity | 0.743 | |||||||||
| Han | 13,988 (100.0) | 8,021 (100.0) | 57.3 | 1,097 (100.0) | 7.8 | 4,232 (100.0) | 30.3 | 638 (100.0) | 4.6 | |
| Others | 5 (0.0) | 4 (0.0) | 80.0 | 0 (0.0) | 0.0 | 1 (0.0) | 20.0 | 0 (0.0) | 0.0 | |
| Education status | 0.017 | |||||||||
| Illiteracy | 1,645 (11.8) | 958 (11.9) | 58.2 | 104 (9.5) | 6.3 | 517 (12.2) | 31.4 | 66 (10.3) | 4.0 | |
| High school or below | 11,886 (84.9) | 6,781 (84.5) | 57.1 | 950 (86.6) | 8.0 | 3,601 (85.1) | 30.3 | 554 (86.8) | 4.7 | |
| College or above | 462 (3.3) | 286 (3.6) | 61.9 | 43 (3.9) | 9.3 | 115 (2.7) | 24.9 | 18 (2.8) | 3.9 | |
| Marital status | 0.484 | |||||||||
| Unmarried | 87 (0.6) | 50 (0.6) | 57.5 | 6 (0.5) | 6.9 | 27 (0.6) | 31.0 | 4 (0.6) | 4.6 | |
| Married | 13,271 (94.8) | 7,641 (95.2) | 57.6 | 1,042 (95.0) | 7.9 | 3,986 (94.2) | 30.0 | 602 (94.4) | 4.5 | |
| Remarried | 171 (1.2) | 91 (1.1) | 53.2 | 15 (1.4) | 8.8 | 55 (1.3) | 32.2 | 10 (1.6) | 5.8 | |
| Divorced or widowed | 464 (3.3) | 243 (3.0) | 52.4 | 34 (3.1) | 7.3 | 165 (3.9) | 35.6 | 22 (3.4) | 4.7 | |
| Family history of CRC in first-degree relatives | <0.001 | |||||||||
| No | 13,050 (93.3) | 7,502 (93.5) | 57.5 | 1,019 (92.9) | 7.8 | 3,951 (93.3) | 30.3 | 578 (90.6) | 4.4 | |
| Yes | 412 (2.9) | 188 (2.3) | 45.6 | 27 (2.5) | 6.6 | 164 (3.9) | 39.8 | 33 (5.2) | 8.0 | |
| Unknown | 531 (3.8) | 335 (4.2) | 63.1 | 51 (4.6) | 9.6 | 118 (2.8) | 22.2 | 27 (4.2) | 5.1 | |
| Family history of familial adenomatous polyposis in first-degree relatives | 0.305 | |||||||||
| No | 12,564 (89.8) | 7,224 (90.0) | 57.5 | 972 (88.6) | 7.7 | 3,795 (89.7) | 30.2 | 573 (89.8) | 4.6 | |
| Yes | 369 (2.6) | 217 (2.7) | 58.8 | 37 (3.4) | 10.0 | 97 (2.3) | 26.3 | 18 (2.8) | 4.9 | |
| Unknown | 1,060 (7.6) | 584 (7.3) | 55.1 | 88 (8.0) | 8.3 | 341 (8.1) | 32.2 | 47 (7.4) | 4.4 | |
| Cigarette smoking status | <0.001 | |||||||||
| Never | 10,001 (71.5) | 6,295 (78.4) | 62.9 | 745 (67.9) | 7.4 | 2,598 (61.4) | 26.0 | 363 (56.9) | 3.6 | |
| Current | 3,267 (23.3) | 1,374 (17.1) | 42.1 | 292 (26.6) | 8.9 | 1,366 (32.3) | 41.8 | 235 (36.8) | 7.2 | |
| Former | 725 (5.2) | 356 (4.4) | 49.1 | 60 (5.5) | 8.3 | 269 (6.4) | 37.1 | 40 (6.3) | 5.5 | |
| Alcohol drinking status | <0.001 | |||||||||
| Never | 10,103 (72.2) | 6,302 (78.5) | 62.4 | 780 (71.1) | 7.7 | 2,635 (62.2) | 26.1 | 386 (60.5) | 3.8 | |
| Current | 3,670 (26.2) | 1,614 (20.1) | 44.0 | 303 (27.6) | 8.3 | 1,511 (35.7) | 41.2 | 242 (37.9) | 6.6 | |
| Former | 220 (1.6) | 109 (1.4) | 49.5 | 14 (1.3) | 6.4 | 87 (2.1) | 39.5 | 10 (1.6) | 4.5 | |
| Frequency of physical activity | ||||||||||
| Never | 7,313 (52.3) | 4,106 (51.2) | 56.1 | 554 (50.5) | 7.6 | 2,333 (55.1) | 31.9 | 320 (50.2) | 4.4 | |
| 1 ~ 3 times a month | 1,237 (8.8) | 794 (9.9) | 64.2 | 107 (9.8) | 8.6 | 295 (7.0) | 23.8 | 41 (6.4) | 3.3 | |
| 1 ~ 2 times a week | 1894 (13.5) | 1,209 (15.1) | 63.8 | 139 (12.7) | 7.3 | 462 (10.9) | 24.4 | 84 (13.2) | 4.4 | |
| 3 ~ 5 times a week | 932 (6.7) | 535 (6.7) | 57.4 | 70 (6.4) | 7.5 | 286 (6.8) | 30.7 | 41 (6.4) | 4.4 | |
| Every day or almost every day | 2,617 (18.7) | 1,381 (17.2) | 52.8 | 227 (20.7) | 8.7 | 857 (20.2) | 32.7 | 152 (23.8) | 5.8 | |
| Regular NSAID use | <0.001 | |||||||||
| No | 13,418 (95.9) | 7,750 (96.6) | 57.8 | 1,055 (96.2) | 7.9 | 4,010 (94.7) | 29.9 | 603 (94.5) | 4.5 | |
| Yes | 575 (4.1) | 275 (3.4) | 47.8 | 42 (3.8) | 7.3 | 223 (5.3) | 38.8 | 35 (5.5) | 6.1 | |
Distribution of sociodemographic characteristics between no polyp controls, only SP cases, only AD cases, and synchronous SP and AD groups.
Bold font indicates that the value is statistically significant after FDR correction (p < = 0.013).
3.1 Multivariable associations of lifestyle factors and dietary preference with SP and AD
As shown in Table 2, BMI was positively associated with the risk of both types of lesions. Compared to participants with normal weight, those with low weight had lower risks of only AD (OR = 0.78, 95%CI: 0.64–0.94), but those with overweight (OR = 1.22, 95%CI: 1.09–1.38 for only AD; OR = 1.18, 95%CI: 1.07–1.29 for only SP) or obesity (OR = 1.50, 95%CI: 1.23–1.84 for only SP, p for trend <0.001; OR = 1.53, 95%CI: 1.28–1.82 for only AD, p for trend <0.001; and OR = 1.97, 95%CI: 1.40–2.75 for synchronous SP and AD, p for trend =0.002) were more likely to develop AD and SP. Cigarette smoking also appeared to increase the risk of intestinal lesions. Compared to individuals who never smoked, current smokers had a 20–30% increased risk of only SP (OR = 1.29, 95%CI: 1.07–1.55) and only AD (OR = 1.24, 95%CI: 1.11–1.39), and an approximately 50% increased risk of synchronous SP and AD (OR = 1.53, 95%CI: 1.27–1.85). Further analysis found that compared to never smokers, current smokers who have been smoking for 31 to 40 years (OR = 1.45, 95%CI: 1.24–1.70 for only SP; OR = 1.31, 95%CI: 1.13–1.52 for only AD; OR = 1.44, 95%CI: 1.14–1.81 for synchronous SP and AD) or smoked more than 20 cigarettes per day (OR = 1.55, 95%CI: 1.17–2.06 for only SP; OR = 1.34, 95%CI: 1.15–1.57 for only AD; OR = 1.58, 95%CI: 1.19–2.09 for synchronous SP and AD) also significantly increased the risks of AD and SP. However, quitting smoking was shown to have a protective effect against polyps and adenomas. The OR of quitting smoking for ≤5 years was 0.53 for only SP (95%CI: 0.40–0.70), 0.58 for only AD (95%CI: 0.46–0.73) when compared to current smokers and the OR of quitting smoking for 6–12 years was 0.38 for synchronous SP and AD (95%CI: 0.24–0.61). As for alcohol drinking, current drinkers, drinking duration, and intensity were only observed to be positively associated with the risk of only AD (p for trend <0.001) but not only SP. In addition, no significant association between physical activity and regular aspirin use with SP and AD was observed. A negative association was observed between the frequency of whole-grain intake and the risk of only AD (e.g., OR = 0.85, 95%CI: 0.75–0.96 for eating whole grain 1–3 days per month vs. never eating whole grain), while the correlation of frequency of food intake and the two lesions was not observed in other categories.
Table 2
| Factors | No polyp control (n = 8,025) | Only serrated polyp (SP) (n = 1,097) | Only conventional adenoma (AD) (n = 4,233) | Synchronous SP and AD (n = 638) | N (%) | OR (95%CI) | p for trend | N (%) | OR (95%CI) | p for trend | N (%) | OR (95%CI) | p for trend | ||||||
|---|---|---|---|---|---|---|---|---|---|---|---|---|---|---|---|---|---|---|---|
| BMI a | |||||||||||||||||||
| Low weight | 297 (3.7) | 20 (1.8) | 0.60 (0.38–0.94) | <0.001 | 104 (2.5) | 0.78 (0.64–0.94) | <0.001 | 13 (2.0) | 0.71 (0.39–1.29) | 0.002 | |||||||||
| Normal weight | 4,535 (56.5) | 549 (50.0) | ref | 2043 (48.3) | ref | 300 (47.0) | ref | ||||||||||||
| Overweight | 2,806 (35.0) | 453 (41.3) | 1.22 (1.09–1.38) | 1761 (41.6) | 1.18 (1.07–1.29) | 265 (41.5) | 1.20 (1.02–1.42) | ||||||||||||
| Obesity | 387 (4.8) | 75 (6.8) | 1.50 (1.23–1.84) | 325 (7.7) | 1.53 (1.28–1.82) | 60 (9.4) | 1.97 (1.40–2.75) | ||||||||||||
| Cigarette smoking status b | |||||||||||||||||||
| Never | 6,295 (78.4) | 745 (67.9) | ref | - | 2,598 (61.4) | ref | - | 363 (56.9) | ref | - | |||||||||
| Current | 1,374 (17.1) | 292 (26.6) | 1.29 (1.07–1.55) | 1,366 (32.3) | 1.24 (1.11–1.39) | 235 (36.8) | 1.53 (1.27–1.85) | ||||||||||||
| Former | 356 (4.4) | 60 (5.5) | 0.99 (0.75–1.31) | 269 (6.4) | 0.82 (0.67–1.01) | 40 (6.3) | 0.88 (0.68–1.14) | ||||||||||||
| Smoking duration, years b | |||||||||||||||||||
| Never | 6,295 (78.4) | 745 (67.9) | ref | 0.034 | 2,598 (61.4) | ref | <0.001 | 363 (56.9) | ref | <0.001 | |||||||||
| ≤30 | 716 (8.9) | 134 (12.2) | 1.14 (0.91–1.44) | 631 (14.9) | 1.17 (1.02–1.35) | 97 (15.2) | 1.29 (0.98–1.70) | ||||||||||||
| 31–40 | 541 (6.7) | 130 (11.9) | 1.45 (1.24–1.70) | 568 (13.4) | 1.31 (1.13–1.52) | 86 (13.5) | 1.44 (1.14–1.81) | ||||||||||||
| >40 | 473 (5.9) | 88 (8.0) | 1.12 (0.77–1.64) | 436 (10.3) | 0.97 (0.83–1.13) | 92 (14.4) | 1.50 (1.18–1.92) | ||||||||||||
| Smoking intensity, pack/day b | |||||||||||||||||||
| Never | 6,295 (78.4) | 745 (67.9) | ref | 0.009 | 2,598 (61.4) | ref | <0.001 | 363 (56.9) | ref | <0.001 | |||||||||
| ≤15 | 651 (8.1) | 124 (11.3) | 1.13 (0.87–1.48) | 616 (14.6) | 1.12 (0.95–1.31) | 97 (15.2) | 1.25 (0.97–1.61) | ||||||||||||
| 16–20 | 834 (10.4) | 167 (15.2) | 1.22 (0.99–1.52) | 746 (17.6) | 1.14 (1.02–1.27) | 135 (21.2) | 1.47 (1.21–1.78) | ||||||||||||
| >20 | 245 (3.1) | 61 (5.6) | 1.55 (1.17–2.06) | 273 (6.4) | 1.34 (1.15–1.57) | 43 (6.7) | 1.58 (1.19–2.09) | ||||||||||||
| Smoking cessation status, years b | |||||||||||||||||||
| Current | 1,374 (79.4) | 292 (83.0) | ref | 0.463 | 1,366 (83.5) | ref | <0.001 | 235 (85.5) | ref | <0.001 | |||||||||
| Quit ≤5 | 133 (7.7) | 15 (4.3) | 0.53 (0.40–0.70) | 86 (5.3) | 0.58 (0.46–0.73) | 18 (6.5) | 0.71 (0.53–0.97) | ||||||||||||
| Quit 6–12 | 109 (6.3) | 21 (6.0) | 0.87 (0.58–1.31) | 91 (5.6) | 0.75 (0.60–0.93) | 8 (2.9) | 0.38 (0.24–0.61) | ||||||||||||
| Quit >12 | 114 (6.6) | 24 (6.8) | 0.94 (0.52–1.70) | 92 (5.6) | 0.68 (0.52–0.87) | 14 (5.1) | 0.60 (0.40–0.91) | ||||||||||||
| Alcohol drinking status c | |||||||||||||||||||
| Never | 6,302 (78.5) | 780 (71.1) | ref | - | 2,635 (62.2) | ref | - | 386 (60.5) | ref | - | |||||||||
| Current | 1,614 (20.1) | 303 (27.6) | 1.05 (0.81–1.35) | 1,511 (35.7) | 1.28 (1.14–1.44) | 242 (37.9) | 1.27 (0.96–1.69) | ||||||||||||
| Former | 109 (1.4) | 14 (1.3) | 0.71 (0.36–1.40) | 87 (2.1) | 1.09 (0.85–1.41) | 10 (1.6) | 0.76 (0.48–1.19) | ||||||||||||
| Drinking duration, years c | |||||||||||||||||||
| Never | 6,302 (78.5) | 780 (71.1) | ref | 0.603 | 2,635 (62.2) | ref | <0.001 | 386 (60.5) | ref | 0.001 | |||||||||
| ≤37 | 700 (8.7) | 120 (10.9) | 1.01 (0.70–1.45) | 489 (11.6) | 1.21 (1.04–1.40) | 79 (12.4) | 1.24 (0.80–1.92) | ||||||||||||
| 38–45 | 540 (6.7) | 106 (9.7) | 1.05 (0.85–1.30) | 566 (13.4) | 1.36 (1.12–1.66) | 82 (12.9) | 1.17 (0.84–1.61) | ||||||||||||
| >45 | 483 (6.0) | 91 (8.3) | 1.03 (0.77–1.37) | 543 (12.8) | 1.25 (1.12–1.40) | 91 (14.3) | 1.34 (1.00–1.80) | ||||||||||||
| Alcohol intake, ml/week c | |||||||||||||||||||
| Never | 6,302 (78.5) | 780 (71.1) | ref | 0.510 | 2,635 (62.2) | ref | <0.001 | 386 (60.5) | ref | 0.021 | |||||||||
| ≤25 | 651 (8.1) | 109 (9.9) | 0.99 (0.67–1.45) | 494 (11.7) | 1.19 (1.04–1.36) | 80 (12.5) | 1.18 (0.84–1.66) | ||||||||||||
| 25.1–55.9 | 498 (6.2) | 94 (8.6) | 1.05 (0.75–1.46) | 454 (10.7) | 1.23 (1.02–1.49) | 69 (10.8) | 1.16 (0.88–1.54) | ||||||||||||
| >56 | 574 (7.2) | 114 (10.4) | 1.06 (0.85–1.33) | 650 (15.4) | 1.41 (1.24–1.60) | 103 (16.1) | 1.40 (1.04–1.87) | ||||||||||||
| Frequency of physical activity d | |||||||||||||||||||
| Never | 4,106 (51.2) | 554 (50.5) | ref | 0.146 | 2,333 (55.1) | ref | 0.239 | 320 (50.2) | ref | 0.018 | |||||||||
| 1 ~ 3 times a month | 794 (9.9) | 107 (9.8) | 1.10 (0.86–1.39) | 295 (7.0) | 0.88 (0.71–1.10) | 41 (6.4) | 0.86 (0.60–1.23) | ||||||||||||
| 1 ~ 2 times a week | 1,209 (15.1) | 139 (12.7) | 0.95 (0.75–1.21) | 462 (10.9) | 0.90 (0.72–1.13) | 84 (13.2) | 1.22 (0.79–1.86) | ||||||||||||
| 3 ~ 5 times a week | 535 (6.7) | 70 (6.4) | 1.00 (0.78–1.30) | 286 (6.8) | 1.11 (0.93–1.33) | 41 (6.4) | 1.14 (0.81–1.58) | ||||||||||||
| Every day or almost every day | 1,381 (17.2) | 227 (20.7) | 1.19 (0.99–1.42) | 857 (20.2) | 1.11 (0.93–1.32) | 152 (23.8) | 1.37 (1.03–1.81) | ||||||||||||
| Regular NSAID use e | |||||||||||||||||||
| No | 7,750 (96.6) | 1,055 (96.2) | ref | - | 4,010 (94.7) | ref | - | 603 (94.5) | ref | - | |||||||||
| Yes | 275 (3.4) | 42 (3.8) | 0.94 (0.74–1.19) | 223 (5.3) | 1.04 (0.89–1.22) | 35 (5.5) | 1.04 (0.78–1.38) | ||||||||||||
| Frequency of vegetable intake f | |||||||||||||||||||
| Never | 51 (0.6) | 4 (0.4) | 0.50 (0.17–1.47) | 0.566 | 28 (0.7) | 1.52 (0.69–3.35) | 0.080 | 2 (0.3) | 0.43 (0.17–1.11) | 0.448 | |||||||||
| 1–3 days per month | 112 (1.4) | 16 (1.5) | ref | 42 (1.0) | ref | 10 (1.6) | ref | ||||||||||||
| 1–3 days per week | 542 (6.8) | 61 (5.6) | 0.68 (0.42–1.13) | 222 (5.2) | 1.05 (0.78–1.41) | 32 (5.0) | 0.57 (0.25–1.30) | ||||||||||||
| 4–6 days per week | 1,377 (17.2) | 167 (15.2) | 0.67 (0.40–1.13) | 559 (13.2) | 1.09 (0.77–1.54) | 87 (13.6) | 0.62 (0.34–1.12) | ||||||||||||
| Every day | 5,943 (74.1) | 849 (77.4) | 0.73 (0.42–1.29) | 3,382 (79.9) | 1.25 (0.85–1.85) | 507 (79.5) | 0.69 (0.40–1.18) | ||||||||||||
| Frequency of fruit intake f | |||||||||||||||||||
| Never | 267 (3.3) | 41 (3.7) | ref | 0.117 | 222 (5.2) | ref | 0.490 | 35 (5.5) | ref | 0.607 | |||||||||
| 1–3 days per month | 881 (11.0) | 99 (9.0) | 0.82 (0.60–1.12) | 503 (11.9) | 0.95 (0.72–1.24) | 74 (11.6) | 0.91 (0.62–1.35) | ||||||||||||
| 1–3 days per week | 2,739 (34.1) | 359 (32.7) | 0.97 (0.78–1.20) | 1,452 (34.3) | 0.95 (0.77–1.16) | 201 (31.5) | 0.79 (0.63–0.99) | ||||||||||||
| 4–6 days per week | 2,125 (26.5) | 289 (26.3) | 1.01 (0.77–1.31) | 1,015 (24.0) | 0.94 (0.78–1.14) | 153 (24.0) | 0.84 (0.62–1.12) | ||||||||||||
| Every day | 2013 (25.1) | 309 (28.2) | 1.12 (0.83–1.51) | 1,041 (24.6) | 0.95 (0.74–1.22) | 175 (27.4) | 0.88 (0.66–1.17) | ||||||||||||
| Frequency of red meat intake f | |||||||||||||||||||
| Never | 233 (2.9) | 29 (2.6) | ref | 0.198 | 123 (2.9) | ref | 0.577 | 17 (2.7) | ref | 0.033 | |||||||||
| 1–3 days per month | 1,266 (15.8) | 131 (11.9) | 0.76 (0.48–1.22) | 568 (13.4) | 1.04 (0.82–1.32) | 59 (9.2) | 0.67 (0.40–1.12) | ||||||||||||
| 1–3 days per week | 3,873 (48.3) | 526 (47.9) | 0.94 (0.60–1.47) | 2084 (49.2) | 1.17 (0.90–1.54) | 312 (48.9) | 1.08 (0.60–1.93) | ||||||||||||
| 4–6 days per week | 1803 (22.5) | 291 (26.5) | 1.14 (0.75–1.73) | 981 (23.2) | 1.20 (0.91–1.59) | 161 (25.2) | 1.12 (0.58–2.17) | ||||||||||||
| Every day | 850 (10.6) | 120 (10.9) | 0.90 (0.55–1.47) | 477 (11.3) | 1.08 (0.74–1.57) | 89 (13.9) | 1.07 (0.59–1.92) | ||||||||||||
| Frequency of white meat intake f | |||||||||||||||||||
| Never | 401 (5.0) | 42 (3.8) | ref | 0.812 | 254 (6.0) | ref | 0.194 | 29 (4.5) | ref | 0.105 | |||||||||
| 1–3 days per month | 1922 (24.0) | 232 (21.1) | 1.26 (0.85–1.87) | 858 (20.3) | 0.80 (0.63–1.01) | 109 (17.1) | 0.94 (0.49–1.80) | ||||||||||||
| 1–3 days per week | 4,043 (50.4) | 599 (54.6) | 1.39 (1.00–1.92) | 2,204 (52.1) | 0.91 (0.73–1.13) | 341 (53.4) | 1.17 (0.73–1.87) | ||||||||||||
| 4–6 days per week | 1,399 (17.4) | 184 (16.8) | 1.10 (0.76–1.61) | 735 (17.4) | 0.92 (0.79–1.07) | 119 (18.7) | 1.13 (0.74–1.71) | ||||||||||||
| Every day | 260 (3.2) | 40 (3.6) | 1.21 (0.89–1.65) | 182 (4.3) | 1.10 (0.84–1.44) | 40 (6.3) | 1.56 (0.81–3.01) | ||||||||||||
| Frequency of bean and soy product intake f | |||||||||||||||||||
| Never | 554 (6.9) | 87 (7.9) | ref | 0.657 | 382 (9.0) | ref | 0.057 | 51 (8.0) | ref | 0.887 | |||||||||
| 1–3 days per month | 2098 (26.1) | 273 (24.9) | 0.85 (0.62–1.14) | 1,080 (25.5) | 0.93 (0.81–1.06) | 147 (23.0) | 0.93 (0.66–1.29) | ||||||||||||
| 1–3 days per week | 3,973 (49.5) | 542 (49.4) | 0.84 (0.63–1.13) | 2075 (49.0) | 0.86 (0.75–0.98) | 310 (48.6) | 0.93 (0.67–1.30) | ||||||||||||
| 4–6 days per week | 1,160 (14.5) | 153 (13.9) | 0.84 (0.58–1.21) | 556 (13.1) | 0.80 (0.62–1.03) | 98 (15.4) | 1.00 (0.67–1.49) | ||||||||||||
| Every day | 240 (3.0) | 42 (3.8) | 1.04 (0.70–1.55) | 140 (3.3) | 0.83 (0.60–1.15) | 32 (5.0) | 1.09 (0.46–2.56) | ||||||||||||
| Frequency of preserved vegetable intake f | |||||||||||||||||||
| Never | 1,619 (20.2) | 214 (19.5) | ref | 0.406 | 726 (17.2) | ref | 0.006 | 109 (17.1) | ref | 0.497 | |||||||||
| 1–3 days per month | 3,280 (40.9) | 478 (43.6) | 1.13 (0.92–1.37) | 1,637 (38.7) | 1.13 (1.00–1.28) | 262 (41.1) | 1.15 (0.84–1.58) | ||||||||||||
| 1–3 days per week | 2,417 (30.1) | 316 (28.8) | 0.98 (0.81–1.18) | 1,375 (32.5) | 1.17 (0.99–1.37) | 195 (30.6) | 1.01 (0.79–1.30) | ||||||||||||
| 4–6 days per week | 514 (6.4) | 65 (5.9) | 0.92 (0.63–1.33) | 352 (8.3) | 1.32 (1.05–1.67) | 42 (6.6) | 0.92 (0.61–1.39) | ||||||||||||
| Every day | 195 (2.4) | 24 (2.2) | 0.83 (0.48–1.43) | 143 (3.4) | 1.28 (1.02–1.60) | 30 (4.7) | 1.49 (0.92–2.40) | ||||||||||||
| Frequency of fried or grilled food intake f | |||||||||||||||||||
| Never | 4,790 (59.7) | 677 (61.7) | ref | 0.182 | 2,705 (63.9) | ref | 0.046 | 391 (61.3) | ref | 0.362 | |||||||||
| 1–3 days per month | 2,316 (28.9) | 318 (29.0) | 1.00 (0.89–1.12) | 1,146 (27.1) | 1.01 (0.89–1.14) | 180 (28.2) | 1.05 (0.90–1.23) | ||||||||||||
| 1–3 days per week | 797 (9.9) | 86 (7.8) | 0.81 (0.61–1.09) | 324 (7.7) | 0.81 (0.66–1.00) | 59 (9.2) | 1.05 (0.77–1.43) | ||||||||||||
| 4–6 days per week | 99 (1.2) | 13 (1.2) | 1.08 (0.54–2.16) | 49 (1.2) | 1.05 (0.69–1.58) | 6 (0.9) | 0.84 (0.34–2.05) | ||||||||||||
| Every day | 23 (0.3) | 3 (0.3) | 0.86 (0.27–2.74) | 9 (0.2) | 0.61 (0.31–1.21) | 2 (0.3) | 0.52 (0.15–1.86) | ||||||||||||
| Frequency of whole-grain intake f | |||||||||||||||||||
| Never | 945 (11.8) | 143 (13.0) | ref | 0.407 | 624 (14.7) | ref | 0.142 | 80 (12.5) | ref | 0.885 | |||||||||
| 1–3 days per month | 2,299 (28.6) | 321 (29.3) | 0.96 (0.80–1.15) | 1,149 (27.1) | 0.85 (0.75–0.96) | 198 (31.0) | 1.15 (0.86–1.53) | ||||||||||||
| 1–3 days per week | 2,615 (32.6) | 337 (30.7) | 0.87 (0.74–1.03) | 1,382 (32.6) | 0.86 (0.72–1.03) | 173 (27.1) | 0.81 (0.59–1.11) | ||||||||||||
| 4–6 days per week | 1,107 (13.8) | 147 (13.4) | 0.89 (0.68–1.17) | 570 (13.5) | 0.86 (0.72–1.04) | 91 (14.3) | 1.00 (0.75–1.35) | ||||||||||||
| Every day | 1,059 (13.2) | 149 (13.6) | 0.92 (0.76–1.12) | 508 (12.0) | 0.78 (0.65–0.93) | 96 (15.0) | 1.05 (0.68–1.62) | ||||||||||||
Association analysis of lifestyle factors and dietary preference with AD and SP.
aAdjusted for sex, age group, education status, family history of CRC or familial adenomatous polyposis in first-degree relatives, cigarette smoking status, alcohol drinking status, frequency of physical activity, regular NSAID use, and dietary preference. bAdjusted for sex, age group, education status, family history of CRC or familial adenomatous polyposis in first-degree relatives, BMI, alcohol drinking status, frequency of physical activity, regular NSAID use, and dietary preference. cAdjusted for sex, age group, education status, family history of CRC or familial adenomatous polyposis in first-degree relatives, BMI, cigarette smoking status, frequency of physical activity, regular NSAID use, and dietary preference. dAdjusted for sex, age group, education status, family history of CRC or familial adenomatous polyposis in first-degree relatives, BMI, cigarette smoking status, alcohol drinking status, regular NSAID use, and dietary preference. eAdjusted for sex, age group, education status, family history of CRC or familial adenomatous polyposis in first-degree relatives, BMI, cigarette smoking status, alcohol drinking status, frequency of physical activity, and dietary preference. fAdjusted for sex, age group, education status, family history of CRC or familial adenomatous polyposis in first-degree relatives, BMI, cigarette smoking status, alcohol drinking status, frequency of physical activity, and regular NSAID use. Bold font indicates that the value is statistically significant after FDR correction (p < = 0.013).
To explore the influence of the number of these two lesions on the association between the factors mentioned above and the risk of only SP and only AD, we divided the SP and AD cases into one lesion and multiple lesion groups for analysis, and the results are shown in Table 3. The correlation between the most influence factors and the two lesions was consistent with the results in Table 2. Besides, regular NSAID use exhibited to reduce the risk of single SP (OR = 0.76, 95%CI: 0.63–0.92). In addition, a positive association was observed between the frequency of preserved vegetable intake and the risk of single SP (e.g., OR = 1.29, 95%CI: 1.07–1.56 for eating preserved vegetables 4–6 days per week vs. never eating preserved vegetables). However, there are some results that do not meet our expectations. Alcohol drinking for less than 37 years showed a protective effect on the risk of developing multiple SPs (OR = 0.51, 95%CI: 0.31–0.84), but in the current study, the sample size of this group was only 9 cases, so the results need to be verified by referring to literature with a larger sample size. Exercising more than 3 times a week (OR = 2.31, 95%CI: 1.39–3.83) and exercising every day (OR = 1.75, 95%CI: 1.29–2.38) increased the risk of developing multiple SPs.
Table 3
| Factors | No polyp Control | Serrated polyp (SP) | Conventional adenoma (AD) | ||||||||||||
|---|---|---|---|---|---|---|---|---|---|---|---|---|---|---|---|
| The number of lesion site | The number of lesion site | ||||||||||||||
| 1 | >1 | 1 | >1 | ||||||||||||
| N (%) | OR (95%CI) | p for trend | N (%) | OR (95%CI) | p for trend | N (%) | OR (95%CI) | p for trend | N (%) | OR (95%CI) | p for trend | ||||
| BMI a | |||||||||||||||
| Low weight | 297 (3.7) | 19 (1.9) | 0.63 (0.40–1.00) | <0.001 | 1 (0.8) | 0.28 (0.04–2.10) | 0.322 | 81 (2.7) | 0.82 (0.69–0.99) | <0.001 | 23 (1.8) | 0.64 (0.40–1.01) | <0.001 | ||
| Normal weight | 4,535 (56.5) | 487 (49.8) | ref | 62 (51.7) | ref | 1,472 (49.4) | ref | 571 (45.5) | ref | ||||||
| Overweight | 2,806 (35.0) | 401 (41.0) | 1.24 (1.09–1.40) | 52 (43.3) | 1.15 (0.86–1.53) | 1,218 (40.9) | 1.16 (1.05–1.28) | 543 (43.3) | 1.22 (1.06–1.40) | ||||||
| Obesity | 387 (4.8) | 70 (7.2) | 1.61 (1.29–2.01) | 5 (4.2) | 0.82 (0.36–1.90) | 208 (7.0) | 1.42 (1.17–1.73) | 117 (9.3) | 1.83 (1.57–2.12) | ||||||
| Cigarette smoking status b | |||||||||||||||
| Never | 6,295 (78.4) | 679 (69.5) | ref | - | 66 (55.0) | ref | - | 1936 (65.0) | ref | - | 662 (52.8) | ref | - | ||
| Current | 1,374 (17.1) | 245 (25.1) | 1.20 (0.94–1.52) | 47 (39.2) | 2.17 (1.38–3.42) | 865 (29.0) | 1.18 (1.06–1.31) | 501 (40.0) | 1.36 (1.07–1.75) | ||||||
| Former | 356 (4.4) | 53 (5.4) | 0.98 (0.77–1.24) | 7 (5.8) | 1.14 (0.46–2.84) | 178 (6.0) | 0.82 (0.68–0.99) | 91 (7.3) | 0.82 (0.59–1.13) | ||||||
| Smoking duration, years b | |||||||||||||||
| Never | 6,295 (78.4) | 679 (69.5) | ref | 0.279 | 66 (55.0) | ref | <0.001 | 1936 (65.0) | ref | <0.001 | 662 (52.8) | ref | 0.030 | ||
| ≤30 | 716 (8.9) | 118 (12.1) | 1.11 (0.88–1.40) | 16 (13.3) | 1.44 (0.87–2.38) | 410 (13.8) | 1.13 (1.01–1.27) | 221 (17.6) | 1.25 (0.95–1.66) | ||||||
| 31–40 | 541 (6.7) | 103 (10.5) | 1.27 (1.01–1.59) | 27 (22.5) | 3.16 (1.56–6.43) | 356 (12.0) | 1.23 (1.08–1.40) | 212 (16.9) | 1.48 (1.05–2.08) | ||||||
| >40 | 473 (5.9) | 77 (7.9) | 1.10 (0.72–1.68) | 11 (9.2) | 1.39 (0.76–2.56) | 277 (9.3) | 0.94 (0.80–1.11) | 159 (12.7) | 1.01 (0.77–1.32) | ||||||
| Smoking intensity, pack/day b | |||||||||||||||
| Never | 6,295 (78.4) | 679 (69.5) | ref | 0.083 | 66 (55.0) | ref | 0.007 | 1936 (65.0) | ref | <0.001 | 662 (52.8) | ref | 0.007 | ||
| ≤15 | 651 (8.1) | 104 (10.6) | 1.06 (0.80–1.41) | 20 (16.7) | 1.78 (1.13–2.80) | 377 (12.7) | 1.04 (0.90–1.20) | 239 (19.1) | 1.28 (0.95–1.74) | ||||||
| 16–20 | 834 (10.4) | 141 (14.4) | 1.14 (0.87–1.49) | 26 (21.7) | 2.02 (1.25–3.29) | 497 (16.7) | 1.13 (1.04–1.23) | 249 (19.9) | 1.14 (0.89–1.46) | ||||||
| >20 | 245 (3.1) | 53 (5.4) | 1.46 (1.10–1.95) | 8 (6.7) | 2.29 (0.93–5.68) | 169 (5.7) | 1.24 (1.05–1.47) | 104 (8.3) | 1.52 (1.15–2.02) | ||||||
| Smoking cessation status, years b | |||||||||||||||
| Current | 1,374 (79.4) | 245 (82.2) | ref | 0.644 | 47 (87.0) | ref | 0.442 | 865 (82.9) | ref | 0.040 | 501 (84.6) | ref | 0.001 | ||
| Quit ≤5 | 133 (7.7) | 13 (4.4) | 0.55 (0.39–0.75) | 2 (3.7) | 0.45 (0.14–1.44) | 53 (5.1) | 0.56 (0.40–0.79) | 33 (5.6) | 0.60 (0.45–0.80) | ||||||
| Quit 6–12 | 109 (6.3) | 20 (6.7) | 1.00 (0.71–1.40) | 1 (1.9) | 0.25 (0.04–1.47) | 62 (5.9) | 0.81 (0.60–1.10) | 29 (4.9) | 0.65 (0.45–0.92) | ||||||
| Quit >12 | 114 (6.6) | 20 (6.7) | 0.95 (0.54–1.69) | 4 (7.4) | 0.82 (0.19–3.59) | 63 (6.0) | 0.74 (0.57–0.95) | 29 (4.9) | 0.56 (0.35–0.88) | ||||||
| Alcohol drinking status c | |||||||||||||||
| Never | 6,302 (78.5) | 696 (71.2) | ref | - | 84 (70.0) | ref | - | 1959 (65.8) | ref | - | 676 (53.9) | ref | - | ||
| Current | 1,614 (20.1) | 267 (27.3) | 1.09 (0.84–1.42) | 36 (30.0) | 0.77 (0.45–1.31) | 959 (32.2) | 1.21 (1.09–1.35) | 552 (44.0) | 1.43 (1.21–1.68) | ||||||
| Former | 109 (1.4) | 14 (1.4) | 0.84 (0.42–1.69) | 0 (0.0) | - | 61 (2.0) | 1.15 (0.84–1.59) | 26 (2.1) | 0.97 (0.71–1.32) | ||||||
| Drinking duration, years c | |||||||||||||||
| Never | 6,302 (78.5) | 696 (71.2) | ref | 0.526 | 84 (70.0) | ref | 0.920 | 1959 (65.8) | ref | <0.001 | 676 (53.9) | ref | <0.001 | ||
| ≤37 | 700 (8.7) | 111 (11.4) | 1.09 (0.75–1.59) | 9 (7.5) | 0.51 (0.31–0.84) | 307 (10.3) | 1.09 (0.93–1.29) | 182 (14.5) | 1.50 (1.24–1.81) | ||||||
| 38–45 | 540 (6.7) | 92 (9.4) | 1.08 (0.87–1.35) | 14 (11.7) | 0.80 (0.47–1.37) | 374 (12.6) | 1.36 (1.12–1.65) | 192 (15.3) | 1.36 (1.07–1.71) | ||||||
| >45 | 483 (6.0) | 78 (8.0) | 1.05 (0.77–1.44) | 13 (10.8) | 0.89 (0.38–2.08) | 339 (11.4) | 1.21 (1.07–1.36) | 204 (16.3) | 1.36 (1.19–1.56) | ||||||
| Alcohol intake, ml/week c | |||||||||||||||
| Never | 6,302 (78.5) | 696 (71.2) | ref | 0.325 | 84 (70.0) | ref | 0.203 | 1959 (65.8) | ref | <0.001 | 676 (53.9) | ref | <0.001 | ||
| ≤25 | 651 (8.1) | 95 (9.7) | 1.02 (0.70–1.47) | 14 (11.7) | 0.78 (0.39–1.55) | 319 (10.7) | 1.12 (0.99–1.26) | 175 (14.0) | 1.35 (1.07–1.70) | ||||||
| 25.1–55.9 | 498 (6.2) | 83 (8.5) | 1.10 (0.78–1.55) | 11 (9.2) | 0.74 (0.31–1.72) | 294 (9.9) | 1.20 (0.99–1.45) | 160 (12.8) | 1.32 (1.06–1.65) | ||||||
| >56 | 574 (7.2) | 103 (10.5) | 1.14 (0.88–1.49) | 11 (9.2) | 0.63 (0.39–1.01) | 407 (13.7) | 1.34 (1.17–1.53) | 243 (19.4) | 1.54 (1.31–1.81) | ||||||
| Frequency of physical activity d | |||||||||||||||
| Never | 4,106 (51.2) | 506 (51.8) | ref | 0.447 | 48 (40.0) | ref | 0.001 | 1,642 (55.1) | ref | 0.724 | 691 (55.1) | ref | 0.047 | ||
| 1 ~ 3 times a month | 794 (9.9) | 96 (9.8) | 1.05 (0.81–1.37) | 11 (9.2) | 1.51 (0.95–2.42) | 233 (7.8) | 0.94 (0.74–1.20) | 62 (4.9) | 0.69 (0.55–0.86) | ||||||
| 1 ~ 2 times a week | 1,209 (15.1) | 128 (13.1) | 0.95 (0.75–1.20) | 11 (9.2) | 0.94 (0.58–1.51) | 351 (11.8) | 0.93 (0.75–1.15) | 111 (8.9) | 0.81 (0.59–1.10) | ||||||
| 3 ~ 5 times a week | 535 (6.7) | 55 (5.6) | 0.88 (0.70–1.11) | 15 (12.5) | 2.31 (1.39–3.83) | 197 (6.6) | 1.06 (0.86–1.32) | 89 (7.1) | 1.26 (0.96–1.65) | ||||||
| Every day or almost every day | 1,381 (17.2) | 192 (19.7) | 1.12 (0.93–1.36) | 35 (29.2) | 1.75 (1.29–2.38) | 556 (18.7) | 1.02 (0.87–1.20) | 301 (24.0) | 1.32 (1.00–1.74) | ||||||
| Regular NSAID use e | |||||||||||||||
| No | 7,750 (96.6) | 947 (96.9) | ref | - | 108 (90.0) | ref | - | 2,830 (95.0) | ref | - | 1,180 (94.1) | ref | - | ||
| Yes | 275 (3.4) | 30 (3.1) | 0.76 (0.63–0.92) | 12 (10.0) | 2.14 (1.15–4.00) | 149 (5.0) | 1.05 (0.92–1.21) | 74 (5.9) | 1.02 (0.71–1.48) | ||||||
| Frequency of vegetable intake f | |||||||||||||||
| Never | 51 (0.6) | 4 (0.4) | 0.52 (0.17–1.59) | 0.763 | 0 (0.0) | - | 0.267 | 22 (0.7) | 1.85 (0.80–4.30) | 0.070 | 6 (0.5) | 0.99 (0.35–2.81) | 0.224 | ||
| 1–3 days per month | 112 (1.4) | 15 (1.5) | ref | 1 (0.8) | ref | 27 (0.9) | ref | 15 (1.2) | ref | ||||||
| 1–3 days per week | 542 (6.8) | 55 (5.6) | 0.65 (0.37–1.14) | 6 (5.0) | 1.01 (0.10–10.5) | 158 (5.3) | 1.13 (0.86–1.50) | 64 (5.1) | 0.89 (0.50–1.59) | ||||||
| 4–6 days per week | 1,377 (17.2) | 155 (15.9) | 0.65 (0.37–1.16) | 12 (10.0) | 0.74 (0.08–6.95) | 412 (13.8) | 1.22 (0.91–1.62) | 147 (11.7) | 0.86 (0.46–1.61) | ||||||
| Every day | 5,943 (74.1) | 748 (76.6) | 0.70 (0.38–1.27) | 101 (84.2) | 1.06 (0.13–8.29) | 2,360 (79.2) | 1.40 (1.03–1.91) | 1,022 (81.5) | 1.00 (0.50–2.00) | ||||||
| Frequency of fruit intake f | |||||||||||||||
| Never | 267 (3.3) | 37 (3.8) | ref | 0.185 | 4 (3.3) | ref | 0.368 | 137 (4.6) | ref | 0.914 | 85 (6.8) | ref | 0.160 | ||
| 1–3 days per month | 881 (11.0) | 88 (9.0) | 0.80 (0.58–1.10) | 11 (9.2) | 1.03 (0.40–2.64) | 345 (11.6) | 1.00 (0.77–1.31) | 158 (12.6) | 0.87 (0.61–1.24) | ||||||
| 1–3 days per week | 2,739 (34.1) | 327 (33.5) | 0.98 (0.76–1.27) | 32 (26.7) | 0.85 (0.46–1.56) | 1,041 (34.9) | 1.05 (0.84–1.31) | 411 (32.8) | 0.78 (0.61–1.00) | ||||||
| 4–6 days per week | 2,125 (26.5) | 262 (26.8) | 1.02 (0.73–1.42) | 27 (22.5) | 0.95 (0.51–1.76) | 737 (24.7) | 1.04 (0.85–1.29) | 278 (22.2) | 0.78 (0.62–0.97) | ||||||
| Every day | 2013 (25.1) | 263 (26.9) | 1.08 (0.77–1.52) | 46 (38.3) | 1.54 (0.64–3.71) | 719 (24.1) | 1.03 (0.80–1.32) | 322 (25.7) | 0.84 (0.61–1.15) | ||||||
| Frequency of red meat intake f | |||||||||||||||
| Never | 233 (2.9) | 27 (2.8) | ref | 0.255 | 2 (1.7) | ref | 0.191 | 92 (3.1) | ref | 0.977 | 31 (2.5) | ref | 0.269 | ||
| 1–3 days per month | 1,266 (15.8) | 124 (12.7) | 0.76 (0.46–1.27) | 7 (5.8) | 0.63 (0.12–3.36) | 417 (14.0) | 0.97 (0.80–1.16) | 151 (12.0) | 1.22 (0.79–1.88) | ||||||
| 1–3 days per week | 3,873 (48.3) | 467 (47.8) | 0.89 (0.58–1.35) | 59 (49.2) | 1.57 (0.28–8.71) | 1,496 (50.2) | 1.09 (0.89–1.34) | 588 (46.9) | 1.36 (0.88–2.12) | ||||||
| 4–6 days per week | 1803 (22.5) | 250 (25.6) | 1.05 (0.69–1.60) | 41 (34.2) | 2.33 (0.47–11.67) | 654 (22.0) | 1.05 (0.85–1.31) | 327 (26.1) | 1.62 (1.04–2.52) | ||||||
| Every day | 850 (10.6) | 109 (11.2) | 0.89 (0.56–1.42) | 11 (9.2) | 1.01 (0.21–4.97) | 320 (10.7) | 0.99 (0.74–1.33) | 157 (12.5) | 1.29 (0.73–2.28) | ||||||
| Frequency of white meat intake f | |||||||||||||||
| Never | 401 (5.0) | 38 (3.9) | ref | 0.733 | 4 (3.3) | ref | 0.768 | 177 (5.9) | ref | 0.772 | 77 (6.1) | ref | 0.029 | ||
| 1–3 days per month | 1922 (24.0) | 212 (21.7) | 1.27 (0.86–1.88) | 20 (16.7) | 1.27 (0.29–5.60) | 648 (21.8) | 0.85 (0.64–1.12) | 210 (16.7) | 0.69 (0.48–0.99) | ||||||
| 1–3 days per week | 4,043 (50.4) | 532 (54.5) | 1.40 (1.00–1.96) | 67 (55.8) | 1.29 (0.36–4.58) | 1,550 (52.0) | 0.91 (0.72–1.15) | 654 (52.2) | 0.91 (0.67–1.23) | ||||||
| 4–6 days per week | 1,399 (17.4) | 159 (16.3) | 1.11 (0.76–1.62) | 25 (20.8) | 1.06 (0.34–3.31) | 493 (16.5) | 0.89 (0.77–1.05) | 242 (19.3) | 0.98 (0.75–1.28) | ||||||
| Every day | 260 (3.2) | 36 (3.7) | 1.27 (0.95–1.70) | 4 (3.3) | 0.82 (0.20–3.30) | 111 (3.7) | 1.00 (0.71–1.43) | 71 (5.7) | 1.29 (0.87–1.91) | ||||||
| Frequency of bean and soy product intake f | |||||||||||||||
| Never | 554 (6.9) | 80 (8.2) | ref | 0.372 | 7 (5.8) | ref | 0.221 | 260 (8.7) | ref | 0.058 | 122 (9.7) | ref | 0.078 | ||
| 1–3 days per month | 2098 (26.1) | 249 (25.5) | 0.82 (0.57–1.18) | 24 (20.0) | 1.09 (0.55–2.14) | 788 (26.5) | 0.94 (0.79–1.12) | 292 (23.3) | 0.88 (0.69–1.11) | ||||||
| 1–3 days per week | 3,973 (49.5) | 480 (49.1) | 0.81 (0.57–1.16) | 62 (51.7) | 1.18 (0.55–2.51) | 1,449 (48.6) | 0.85 (0.73–0.99) | 626 (49.9) | 0.85 (0.74–0.98) | ||||||
| 4–6 days per week | 1,160 (14.5) | 134 (13.7) | 0.81 (0.53–1.23) | 19 (15.8) | 1.21 (0.56–2.65) | 392 (13.2) | 0.82 (0.64–1.05) | 164 (13.1) | 0.74 (0.56–1.00) | ||||||
| Every day | 240 (3.0) | 34 (3.5) | 0.92 (0.62–1.36) | 8 (6.7) | 2.31 (0.82–6.47) | 90 (3.0) | 0.83 (0.57–1.21) | 50 (4.0) | 0.84 (0.59–1.19) | ||||||
| Frequency of preserved vegetable intake f | |||||||||||||||
| Never | 1,619 (20.2) | 191 (19.5) | ref | 0.462 | 23 (19.2) | ref | 0.393 | 526 (17.7) | ref | 0.017 | 200 (15.9) | ref | 0.003 | ||
| 1–3 days per month | 3,280 (40.9) | 430 (44.0) | 1.13 (0.93–1.38) | 48 (40.0) | 1.09 (0.71–1.67) | 1,180 (39.6) | 1.13 (1.01–1.26) | 457 (36.4) | 1.15 (0.94–1.42) | ||||||
| 1–3 days per week | 2,417 (30.1) | 275 (28.1) | 0.97 (0.79–1.19) | 41 (34.2) | 1.09 (0.67–1.78) | 946 (31.8) | 1.15 (0.98–1.35) | 429 (34.2) | 1.22 (0.98–1.53) | ||||||
| 4–6 days per week | 514 (6.4) | 59 (6.0) | 0.95 (0.66–1.37) | 6 (5.0) | 0.70 (0.29–1.73) | 236 (7.9) | 1.29 (1.07–1.56) | 116 (9.3) | 1.39 (0.96–2.02) | ||||||
| Every day | 195 (2.4) | 22 (2.3) | 0.88 (0.54–1.42) | 2 (1.7) | 0.55 (0.1–3.07) | 91 (3.1) | 1.24 (0.98–1.57) | 52 (4.1) | 1.37 (1.01–1.86) | ||||||
| Frequency of fried or grilled food intake f | |||||||||||||||
| Never | 4,790 (59.7) | 602 (61.6) | ref | 0.242 | 75 (62.5) | ref | 0.890 | 1891 (63.5) | ref | 0.038 | 814 (64.9) | ref | 0.118 | ||
| 1–3 days per month | 2,316 (28.9) | 288 (29.5) | 1.00 (0.89–1.12) | 30 (25.0) | 0.96 (0.61–1.51) | 828 (27.8) | 1.01 (0.91–1.14) | 318 (25.4) | 1.00 (0.80–1.24) | ||||||
| 1–3 days per week | 797 (9.9) | 72 (7.4) | 0.76 (0.51–1.11) | 14 (11.7) | 1.33 (0.69–2.56) | 225 (7.6) | 0.80 (0.63–1.01) | 99 (7.9) | 0.88 (0.64–1.20) | ||||||
| 4–6 days per week | 99 (1.2) | 12 (1.2) | 1.09 (0.53–2.27) | 1 (0.8) | 0.87 (0.08–9.81) | 31 (1.0) | 0.94 (0.61–1.45) | 18 (1.4) | 1.35 (0.86–2.13) | ||||||
| Every day | 23 (0.3) | 3 (0.3) | 1.00 (0.33–3.03) | 0 (0.0) | - | 4 (0.1) | 0.41 (0.14–1.21) | 5 (0.4) | 0.96 (0.54–1.72) | ||||||
| Frequency of whole-grain intake f | |||||||||||||||
| Never | 945 (11.8) | 126 (12.9) | ref | 0.269 | 17 (14.2) | ref | 0.629 | 430 (14.4) | ref | 0.347 | 194 (15.5) | ref | 0.104 | ||
| 1–3 days per month | 2,299 (28.6) | 294 (30.1) | 0.99 (0.81–1.22) | 27 (22.5) | 0.70 (0.38–1.30) | 808 (27.1) | 0.84 (0.72–0.99) | 341 (27.2) | 0.88 (0.71–1.10) | ||||||
| 1–3 days per week | 2,615 (32.6) | 299 (30.6) | 0.90 (0.74–1.09) | 38 (31.7) | 0.74 (0.50–1.11) | 982 (33.0) | 0.89 (0.71–1.11) | 400 (31.9) | 0.83 (0.74–0.93) | ||||||
| 4–6 days per week | 1,107 (13.8) | 133 (13.6) | 0.93 (0.73–1.20) | 14 (11.7) | 0.61 (0.27–1.35) | 403 (13.5) | 0.89 (0.69–1.15) | 167 (13.3) | 0.82 (0.63–1.08) | ||||||
| Every day | 1,059 (13.2) | 125 (12.8) | 0.90 (0.74–1.09) | 24 (20.0) | 1.02 (0.69–1.52) | 356 (12.0) | 0.80 (0.65–0.99) | 152 (12.1) | 0.74 (0.58–0.94) | ||||||
Association analysis of lifestyle factors and dietary preference with AD and SP according to the number of lesion.
aAdjusted for sex, age group, education status, family history of CRC or familial adenomatous polyposis in first-degree relatives, cigarette smoking status, alcohol drinking status, frequency of physical activity, regular NSAID use, and dietary preference. bAdjusted for sex, age group, education status, family history of CRC or familial adenomatous polyposis in first-degree relatives, BMI, alcohol drinking status, frequency of physical activity, regular NSAID use, and dietary preference. cAdjusted for sex, age group, education status, family history of CRC or familial adenomatous polyposis in first-degree relatives, BMI, cigarette smoking status, frequency of physical activity, regular NSAID use, and dietary preference. dAdjusted for sex, age group, education status, family history of CRC or familial adenomatous polyposis in first-degree relatives, BMI, cigarette smoking status, alcohol drinking status, regular NSAID use, and dietary preference. eAdjusted for sex, age group, education status, family history of CRC or familial adenomatous polyposis in first-degree relatives, BMI, cigarette smoking status, alcohol drinking status, frequency of physical activity, and dietary preference. fAdjusted for sex, age group, education status, family history of CRC or familial adenomatous polyposis in first-degree relatives, BMI, cigarette smoking status, alcohol drinking status, frequency of physical activity, and regular NSAID use. Bold font indicates that the value is statistically significant after FDR correction (p < = 0.013).
3.2 Multivariable associations of lifestyle factors and dietary preference with SP and AD in case-group comparison
As shown in Table 4, with only AD cases as reference, the smoking duration was associated with an increased risk of synchronous SP and AD (OR = 1.52, 95%CI: 1.20–1.93 for smoking more than 40 years vs. never smoking), and quitting smoking between 6 and 12 years reduced the risk of synchronous SP and AD (OR = 0.51, 95%CI: 0.32–0.81).
Table 4
| Factors | Only conventional adenoma (AD) control (n = 4,233) | Only serrated polyp (SP) (n = 1,097) | Synchronous SP and AD (n = 638) | N (%) | OR (95%CI) | p for trend | N (%) | OR (95%CI) | p for trend | ||||
|---|---|---|---|---|---|---|---|---|---|---|---|---|---|
| BMI a | |||||||||||||
| Low weight | 104 (2.5) | 20 (1.8) | 0.78 (0.51–1.18) | 0.480 | 13 (2.0) | 0.95 (0.54–1.66) | 0.330 | ||||||
| Normal weight | 2043 (48.3) | 549 (50.0) | ref | 300 (47.0) | ref | ||||||||
| Overweight | 1761 (41.6) | 453 (41.3) | 1.03 (0.93–1.15) | 265 (41.5) | 1.02 (0.90–1.17) | ||||||||
| Obesity | 325 (7.7) | 75 (6.8) | 0.97 (0.81–1.16) | 60 (9.4) | 1.30 (0.93–1.80) | ||||||||
| Cigarette smoking status b | |||||||||||||
| Never | 2,598 (61.4) | 745 (67.9) | ref | - | 363 (56.9) | ref | - | ||||||
| Current | 1,366 (32.3) | 292 (26.6) | 1.02 (0.82–1.26) | 235 (36.8) | 1.21 (1.02–1.44) | ||||||||
| Former | 269 (6.4) | 60 (5.5) | 1.19 (0.88–1.61) | 40 (6.3) | 1.05 (0.91–1.22) | ||||||||
| Smoking duration, years b | |||||||||||||
| Never | 2,598 (61.4) | 745 (67.9) | ref | 0.958 | 363 (56.9) | ref | 0.002 | ||||||
| ≤30 | 631 (14.9) | 134 (12.2) | 0.95 (0.79–1.15) | 97 (15.2) | 1.09 (0.84–1.41) | ||||||||
| 31–40 | 568 (13.4) | 130 (11.9) | 1.09 (0.88–1.35) | 86 (13.5) | 1.08 (0.85–1.35) | ||||||||
| >40 | 436 (10.3) | 88 (8.0) | 1.16 (0.76–1.76) | 92 (14.4) | 1.52 (1.20–1.93) | ||||||||
| Smoking intensity, pack/day b | |||||||||||||
| Never | 2,598 (61.4) | 745 (67.9) | ref | 0.770 | 363 (56.9) | ref | 0.062 | ||||||
| ≤15 | 616 (14.6) | 124 (11.3) | 1.00 (0.74–1.35) | 97 (15.2) | 1.11 (0.91–1.35) | ||||||||
| 16–20 | 746 (17.6) | 167 (15.2) | 1.05 (0.82–1.35) | 135 (21.2) | 1.26 (1.04–1.53) | ||||||||
| >20 | 273 (6.4) | 61 (5.6) | 1.13 (0.83–1.54) | 43 (6.7) | 1.16 (0.87–1.54) | ||||||||
| Smoking cessation status, years b | |||||||||||||
| Current | 1,366 (83.5) | 292 (83.0) | ref | 0.452 | 235 (85.5) | ref | 0.012 | ||||||
| Quit ≤5 | 86 (5.3) | 15 (4.3) | 0.93 (0.67–1.29) | 18 (6.5) | 1.20 (0.99–1.46) | ||||||||
| Quit 6–12 | 91 (5.6) | 21 (6.0) | 1.16 (0.67–1.99) | 8 (2.9) | 0.51 (0.32–0.81) | ||||||||
| Quit >12 | 92 (5.6) | 24 (6.8) | 1.40 (0.87–2.25) | 14 (5.1) | 0.90 (0.72–1.12) | ||||||||
| Alcohol drinking status c | |||||||||||||
| Never | 2,635 (62.2) | 780 (71.1) | ref | - | 386 (60.5) | ref | - | ||||||
| Current | 1,511 (35.7) | 303 (27.6) | 0.83 (0.66–1.06) | 242 (37.9) | 1.00 (0.76–1.31) | ||||||||
| Former | 87 (2.1) | 14 (1.3) | 0.65 (0.38–1.13) | 10 (1.6) | 0.71 (0.45–1.11) | ||||||||
| Drinking duration, years c | |||||||||||||
| Never | 2,635 (62.2) | 780 (71.1) | ref | 0.032 | 386 (60.5) | ref | 0.975 | ||||||
| ≤37 | 489 (11.6) | 120 (10.9) | 0.84 (0.61–1.17) | 79 (12.4) | 1.02 (0.70–1.49) | ||||||||
| 38–45 | 566 (13.4) | 106 (9.7) | 0.79 (0.61–1.03) | 82 (12.9) | 0.85 (0.65–1.11) | ||||||||
| >45 | 543 (12.8) | 91 (8.3) | 0.84 (0.63–1.10) | 91 (14.3) | 1.09 (0.77–1.53) | ||||||||
| Alcohol intake, ml/week c | |||||||||||||
| Never | 2,635 (62.2) | 780 (71.1) | ref | 0.026 | 386 (60.5) | ref | 0.826 | ||||||
| ≤25 | 494 (11.7) | 109 (9.9) | 0.85 (0.60–1.19) | 80 (12.5) | 1.00 (0.75–1.35) | ||||||||
| 25.1–55.9 | 454 (10.7) | 94 (8.6) | 0.86 (0.61–1.23) | 69 (10.8) | 0.94 (0.73–1.22) | ||||||||
| >56 | 650 (15.4) | 114 (10.4) | 0.77 (0.61–0.97) | 103 (16.1) | 0.99 (0.71–1.37) | ||||||||
| Frequency of physical activity d | |||||||||||||
| Never | 2,333 (55.1) | 554 (50.5) | ref | 0.694 | 320 (50.2) | ref | 0.024 | ||||||
| 1 ~ 3 times a month | 295 (7.0) | 107 (9.8) | 1.24 (0.87–1.78) | 41 (6.4) | 0.94 (0.65–1.36) | ||||||||
| 1 ~ 2 times a week | 462 (10.9) | 139 (12.7) | 1.06 (0.85–1.33) | 84 (13.2) | 1.32 (0.94–1.84) | ||||||||
| 3 ~ 5 times a week | 286 (6.8) | 70 (6.4) | 0.92 (0.71–1.20) | 41 (6.4) | 1.01 (0.69–1.49) | ||||||||
| Every day or almost every day | 857 (20.2) | 227 (20.7) | 1.08 (0.90–1.30) | 152 (23.8) | 1.24 (0.98–1.56) | ||||||||
| Regular NSAID use e | |||||||||||||
| No | 4,010 (94.7) | 1,055 (96.2) | ref | - | 603 (94.5) | ref | - | ||||||
| Yes | 223 (5.3) | 42 (3.8) | 0.91 (0.72–1.14) | 35 (5.5) | 1.01 (0.73–1.41) | ||||||||
| Frequency of vegetable intake f | |||||||||||||
| Never | 28 (0.7) | 4 (0.4) | 0.33 (0.15–0.75) | 0.279 | 2 (0.3) | 0.32 (0.14–0.71) | 0.645 | ||||||
| 1–3 days per month | 42 (1.0) | 16 (1.5) | ref | 10 (1.6) | ref | ||||||||
| 1–3 days per week | 222 (5.2) | 61 (5.6) | 0.63 (0.36–1.10) | 32 (5.0) | 0.61 (0.25–1.52) | ||||||||
| 4–6 days per week | 559 (13.2) | 167 (15.2) | 0.61 (0.33–1.16) | 87 (13.6) | 0.63 (0.29–1.38) | ||||||||
| Every day | 3,382 (79.9) | 849 (77.4) | 0.59 (0.31–1.10) | 507 (79.5) | 0.61 (0.29–1.25) | ||||||||
| Frequency of fruit intake f | |||||||||||||
| Never | 222 (5.2) | 41 (3.7) | ref | 0.011 | 35 (5.5) | ref | 0.852 | ||||||
| 1–3 days per month | 503 (11.9) | 99 (9.0) | 0.87 (0.57–1.31) | 74 (11.6) | 0.98 (0.68–1.40) | ||||||||
| 1–3 days per week | 1,452 (34.3) | 359 (32.7) | 1.03 (0.72–1.45) | 201 (31.5) | 0.85 (0.67–1.08) | ||||||||
| 4–6 days per week | 1,015 (24.0) | 289 (26.3) | 1.07 (0.73–1.57) | 153 (24.0) | 0.92 (0.68–1.25) | ||||||||
| Every day | 1,041 (24.6) | 309 (28.2) | 1.21 (0.85–1.72) | 175 (27.4) | 0.95 (0.69–1.31) | ||||||||
| Frequency of red meat intake f | |||||||||||||
| Never | 123 (2.9) | 29 (2.6) | ref | 0.351 | 17 (2.7) | ref | 0.067 | ||||||
| 1–3 days per month | 568 (13.4) | 131 (11.9) | 0.73 (0.45–1.19) | 59 (9.2) | 0.62 (0.33–1.16) | ||||||||
| 1–3 days per week | 2084 (49.2) | 526 (47.9) | 0.77 (0.53–1.12) | 312 (48.9) | 0.87 (0.47–1.61) | ||||||||
| 4–6 days per week | 981 (23.2) | 291 (26.5) | 0.92 (0.66–1.28) | 161 (25.2) | 0.88 (0.40–1.92) | ||||||||
| Every day | 477 (11.3) | 120 (10.9) | 0.80 (0.58–1.10) | 89 (13.9) | 0.94 (0.52–1.72) | ||||||||
| Frequency of white meat intake f | |||||||||||||
| Never | 254 (6.0) | 42 (3.8) | ref | 0.403 | 29 (4.5) | ref | 0.229 | ||||||
| 1–3 days per month | 858 (20.3) | 232 (21.1) | 1.60 (1.15–2.23) | 109 (17.1) | 1.16 (0.63–2.14) | ||||||||
| 1–3 days per week | 2,204 (52.1) | 599 (54.6) | 1.56 (1.18–2.06) | 341 (53.4) | 1.30 (0.85–1.99) | ||||||||
| 4–6 days per week | 735 (17.4) | 184 (16.8) | 1.21 (0.82–1.78) | 119 (18.7) | 1.24 (0.83–1.85) | ||||||||
| Every day | 182 (4.3) | 40 (3.6) | 1.10 (0.80–1.51) | 40 (6.3) | 1.45 (0.73–2.87) | ||||||||
| Frequency of bean and soy product intake f | |||||||||||||
| Never | 382 (9.0) | 87 (7.9) | ref | 0.445 | 51 (8.0) | ref | 0.402 | ||||||
| 1–3 days per month | 1,080 (25.5) | 273 (24.9) | 0.92 (0.68–1.24) | 147 (23.0) | 1.02 (0.74–1.41) | ||||||||
| 1–3 days per week | 2075 (49.0) | 542 (49.4) | 0.98 (0.71–1.34) | 310 (48.6) | 1.09 (0.74–1.62) | ||||||||
| 4–6 days per week | 556 (13.1) | 153 (13.9) | 1.05 (0.63–1.74) | 98 (15.4) | 1.26 (0.73–2.17) | ||||||||
| Every day | 140 (3.3) | 42 (3.8) | 1.21 (0.80–1.83) | 32 (5.0) | 1.34 (0.64–2.78) | ||||||||
| Frequency of preserved vegetable intake f | |||||||||||||
| Never | 726 (17.2) | 214 (19.5) | ref | 0.059 | 109 (17.1) | ref | 0.323 | ||||||
| 1–3 days per month | 1,637 (38.7) | 478 (43.6) | 0.99 (0.82–1.19) | 262 (41.1) | 1.01 (0.75–1.36) | ||||||||
| 1–3 days per week | 1,375 (32.5) | 316 (28.8) | 0.84 (0.67–1.06) | 195 (30.6) | 0.87 (0.64–1.19) | ||||||||
| 4–6 days per week | 352 (8.3) | 65 (5.9) | 0.68 (0.39–1.18) | 42 (6.6) | 0.69 (0.46–1.03) | ||||||||
| Every day | 143 (3.4) | 24 (2.2) | 0.67 (0.37–1.23) | 30 (4.7) | 1.15 (0.72–1.85) | ||||||||
| Frequency of fried or grilled food intake f | |||||||||||||
| Never | 2,705 (63.9) | 677 (61.7) | ref | 0.385 | 391 (61.3) | ref | 0.352 | ||||||
| 1–3 days per month | 1,146 (27.1) | 318 (29.0) | 0.99 (0.85–1.14) | 180 (28.2) | 1.05 (0.92–1.19) | ||||||||
| 1–3 days per week | 324 (7.7) | 86 (7.8) | 1.03 (0.81–1.31) | 59 (9.2) | 1.29 (0.97–1.73) | ||||||||
| 4–6 days per week | 49 (1.2) | 13 (1.2) | 1.04 (0.49–2.23) | 6 (0.9) | 0.82 (0.30–2.26) | ||||||||
| Every day | 9 (0.2) | 3 (0.3) | 1.51 (0.38–5.95) | 2 (0.3) | 0.92 (0.31–2.73) | ||||||||
| Frequency of whole-grain intake f | |||||||||||||
| Never | 624 (14.7) | 143 (13.0) | ref | 0.546 | 80 (12.5) | ref | 0.563 | ||||||
| 1–3 days per month | 1,149 (27.1) | 321 (29.3) | 1.13 (0.92–1.39) | 198 (31.0) | 1.38 (0.99–1.92) | ||||||||
| 1–3 days per week | 1,382 (32.6) | 337 (30.7) | 1.02 (0.81–1.30) | 173 (27.1) | 0.96 (0.66–1.38) | ||||||||
| 4–6 days per week | 570 (13.5) | 147 (13.4) | 1.05 (0.81–1.35) | 91 (14.3) | 1.18 (0.79–1.77) | ||||||||
| Every day | 508 (12.0) | 149 (13.6) | 1.21 (0.99–1.46) | 96 (15.0) | 1.36 (0.92–2.00) | ||||||||
Association analysis of lifestyle factors and dietary preference with AD and SP in case-group comparisons.
aAdjusted for sex, age group, education status, family history of CRC or familial adenomatous polyposis in first-degree relatives, cigarette smoking status, alcohol drinking status, frequency of physical activity, regular NSAID use, and dietary preference. bAdjusted for sex, age group, education status, family history of CRC or familial adenomatous polyposis in first-degree relatives, BMI, alcohol drinking status, frequency of physical activity, regular NSAID use, and dietary preference. cAdjusted for sex, age group, education status, family history of CRC or familial adenomatous polyposis in first-degree relatives, BMI, cigarette smoking status, frequency of physical activity, regular NSAID use, and dietary preference. dAdjusted for sex, age group, education status, family history of CRC or familial adenomatous polyposis in first-degree relatives, BMI, cigarette smoking status, alcohol drinking status, regular NSAID use, and dietary preference. eAdjusted for sex, age group, education status, family history of CRC or familial adenomatous polyposis in first-degree relatives, BMI, cigarette smoking status, alcohol drinking status, frequency of physical activity, and dietary preference. fAdjusted for sex, age group, education status, family history of CRC or familial adenomatous polyposis in first-degree relatives, BMI, cigarette smoking status, alcohol drinking status, frequency of physical activity, and regular NSAID use.
As for dietary preference, although statistically significant results were observed between the only SP/synchronous AD and SP risk and vegetable intake, the sample size of the group who never ate vegetables was too small to be credible. The white meat intake was more likely to develop serrated polyp than conventional adenoma (e.g., OR = 1.60, 95%CI: 1.15–2.23 for eating 1–3 days per month vs. never eating). No association was found between other factors and SP or synchronous SP and AD when compared with only AD cases.
4 Discussion
This study was intended to assess the relationship between modifiable lifestyle factors and serrated polyp and conventional adenoma. We found that BMI and cigarette smoking were significantly associated with the increased risk of only SP, only AD, and synchronous SP and AD, whereas alcohol drinking showed a positive correlation with the risk of only AD. The case-group comparison indicated that cigarette smoking was more strongly associated with synchronous SP and AD than only AD. Besides, in the analysis of influencing factors related to dietary preference, the consumption of whole grains was inversely associated with the risk of only AD. In case-group comparison, the consumption of white meat was found to be positively associated with only SP than only AD.
Previous studies have demonstrated that obesity is an established risk factor for colorectal cancer (12). Similarly, positive associations between BMI and SP/AD have been reported in some literature (20, 21). Our study also supported this correlation. The inflammatory state of adipose tissue in the condition of obesity creates a favorable environment for tumor development (22). For example, the excess cytokines and adipokines produced by the increased adipose tissue will activate a series of signaling pathways, including phosphoinositide kinase-3 (PI3K)/serine–threonine protein kinase (AKT), leading to hyperplasia, proliferation, and carcinogenesis in colon cells (23). Furthermore, the distinguishing traits of the serrated-neoplasia pathway included the mutation of the BRAF gene, CpG island methylation phenotype (CIMP), and DNA microsatellite instability (MSI) (5, 8, 24). A chronic inflammatory environment can also induce microsatellite instability (MSI) by downregulating DNA repair pathways, resulting in the development of lesions in the serrated pathway (25). However, unlike previous research reports (15, 25), no stronger association between BMI and serrated polyps than traditional adenomas was observed in this study. Besides, physical activity, which was important in obesity-related cancers, was found to decrease colorectal cancer risk in previous studies, especially high levels of physical activity (26). However, in this analysis, people who exercised almost every day had a higher risk of multiple SPs and ADs. We speculate that this is due to the higher proportion of older people in the screening cohort. When we stratified the population by age, in a multivariate analysis, we found that participants aged ≥ 60 years who exercised daily or almost daily had a higher risk of developing SP (OR = 1.30, 95%CI: 1.13–1.49) or synchronous SP and AD (OR = 1.44, 95%CI: 1.11–1.87) than those who never exercised, but no such association was found in people aged <60 years (p > 0.05). Therefore, the reason for the higher risk among residents who exercised almost every day in our analysis could be due to confounding bias brought on by age. We suspect that people over the age of 60 may increase their exercise frequency because they already felt in poor physical condition themselves, but the short-term increase in exercise frequency did not reduce their risk of disease.
While only AD was taken as the control group, this study found that smoking appeared to be more strongly associated with the risk of synchronous SP and AD, which was consistent with the previous findings. Smoking has been found to have differential effects on different molecular pathways in CRC (27, 28). Current smoking showed higher ORs for MSI-high, CIMP-high, and BRAF-mutated subtype CRC, suggesting that smoking was more strongly associated with serrated pathway (27, 29). The analysis of the association between CRC subtype risk and other smoking-related variables including density and total duration reported the same results (29). Therefore, epigenetic alterations may contribute to smoking-induced colorectal neoplasms (12). Interestingly, Sonja et al. (30) reported an observation that there were widespread changes in DNA methylation patterns in smokers compared with never smokers. In former smokers, methylation levels were found to be similar to those in never smokers, suggesting that quitting smoking could restore aberrant methylation to normal levels (30). The protective effect of quitting smoking found in this study could confirm the study mentioned above. In addition, as the positive correlation between alcohol consumption and CRC was reported in many previous studies (31–33), alcohol drinking was a well-established risk factor for cancer. However, the pathways of alcohol to cancer development were not fully understood (34). According to related studies (13, 27, 35), there were no major differences were observed in the relationship between alcohol and CRC subtypes, but some studies (36) have indicated that alcohol intake was associated with an increased risk of traditional adenoma–carcinoma pathway but not serrated pathway. The results of our analysis support this finding.
Dietary fiber was generally thought to be beneficial for colorectal cancer. However, due to the fact that dietary fiber actually contains a wide range of materials, the population research results were not consistent (14, 37–40). He et al. (40) indicated that higher whole-grain intake was associated with lower CRC risk in men but not in women, and no heterogeneity was detected by subtypes. In this study, we found that whole grains were negatively associated with the traditional adenomas, but not serrated polyps. Although this may have been a chance finding, some studies (40) have also shown that fiber intake was not associated with mutation states such as BRAF, CIMP, and MSI that are highly associated with SP. However, other studies have reported different results. For example, Martha et al. (41) reported that higher dietary fiber was associated with a reduced risk of having a CIMP-mutated or a BRAF-mutated tumor. Similarly, white meat has also been inconsistently associated with CRC risk. A previous study conducted in Lanxi, China, reported that both poultry and seafood consumption were negatively associated with colorectal polyps (42). Another systematic review found a mild inverse association between fish and CRC risk, but less evidence for white meat (43). Therefore, future studies on white meat may need to classify it as either seafood sources or poultry sources to better explore its impact on CRC risk.
This is a large-scale population-based case–control study with an advantage in sample size. The colonoscopy examination of the subjects was conducted in designated hospitals, so a more consistent examination procedure and evaluation criteria were used to eliminate some investigation bias. In addition, the questionnaire information including socio-demographics, disease history, lifestyle, and so on was collected by trained staff through face-to-face questioning, thus having better credibility. There are also several weaknesses within this study. First, participants were asked to recall lifestyle information from the past year and report their anthropometric information, disease history, and so on; in addition to recall bias, the data, which was entirely self-reported by participants, can also be a source of bias. Meanwhile, compared with the course of CRC, the exposure assessed in this article was basically at the same time point as the outcome, so there may be limitations in inferring the long-term effects of factors such as physical activity and dietary preferences. Besides, the included population in the study were those who chose to undergo diagnostic screening who were at high CRC risk, while those who did not attend colonoscopy were not in the analysis. People who volunteer to undergo screening may place more emphasis on managing their own health; thus, it may result in an impact on the evaluation results. However, in all the people who underwent colonoscopy and had definite diagnosis, this study excluded a number of patients with non-adenomatous polyps, accounting for approximately 2% of the total number. The absence of data on this segment of the population may also have affected our results.
In summary, our assessment found common risk factors for SP and AD, such as high body mass index and a history of smoking, while alcohol consumption was more strongly associated with the risk of AD, suggesting that lifestyle changes should be made to reduce the risk of colorectal cancer. In addition, in terms of dietary factors, most of the influences on the risk of AD and SP have not been clarified. In future, more in-depth analysis can be conducted based on the detailed classification of different dietary sources or the comprehensive consideration of various diets.
Statements
Data availability statement
The original contributions presented in the study are included in the article/Supplementary material, further inquiries can be directed to the corresponding author.
Ethics statement
The studies involving humans were approved by Ethics review committee of Hangzhou Center for Disease Control and Prevention. The studies were conducted in accordance with the local legislation and institutional requirements. The participants provided their written informed consent to participate in this study.
Author contributions
JX: Writing – original draft. PC: Writing – original draft. KQ: Writing – original draft. BL: Writing – original draft. ZC: Writing – original draft. ZY: Writing – original draft. CJ: Writing – original draft. YY: Writing – review & editing.
Funding
The author(s) declare financial support was received for the research, authorship, and/or publication of this article. The authors acknowledge the financial support from the Chinese National Natural Science Foundation (81973055), the National Key Research and Development Program of China (Grant No. 2022YFC2703505 and 2021YFC2701901), Major research and development projects of the Zhejiang Science and Technology Department (Grant No. 2018C03010), Key Laboratory of Intelligent Preventive Medicine of Zhejiang Province (Grant No. 2020E10004), and Leading Innovative and Entrepreneur Team Introduction Program of Zhejiang (Grant No. 2019R01007).
Acknowledgments
The authors acknowledge the support from the Hangzhou Health Committee and the Hangzhou Center for Disease Control and Prevention. The authors also thank all the participants in this program for their active participation.
Conflict of interest
The authors declare that the research was conducted in the absence of any commercial or financial relationships that could be construed as a potential conflict of interest.
Publisher’s note
All claims expressed in this article are solely those of the authors and do not necessarily represent those of their affiliated organizations, or those of the publisher, the editors and the reviewers. Any product that may be evaluated in this article, or claim that may be made by its manufacturer, is not guaranteed or endorsed by the publisher.
Supplementary material
The Supplementary material for this article can be found online at: https://www.frontiersin.org/articles/10.3389/fnut.2023.1269629/full#supplementary-material
References
1.
Bray F Laversanne M Weiderpass E Soerjomataram I . The ever-increasing importance of cancer as a leading cause of premature death worldwide. Cancer. (2021) 127:3029–30. doi: 10.1002/cncr.33587
2.
Sung H Ferlay J Siegel RL Laversanne M Soerjomataram I Jemal A et al . Global Cancer statistics 2020: GLOBOCAN estimates of incidence and mortality worldwide for 36 cancers in 185 countries. CA Cancer J Clin. (2021) 71:209–49. doi: 10.3322/caac.21660
3.
van Toledo DEFWM IJspeert JEG Dekker E . Current approaches in managing colonic serrated polyps and serrated polyposis. Annu Rev Med. (2022) 73:293–306. doi: 10.1146/annurev-med-042220-024703
4.
Calderwood AH Lasser KE Roy HK . Colon adenoma features and their impact on risk of future advanced adenomas and colorectal cancer. World J Gastrointest Oncol. (2016) 8:826–34. doi: 10.4251/wjgo.v8.i12.826
5.
Nguyen LH Goel A Chung DC . Pathways of colorectal carcinogenesis. Gastroenterology. (2020) 158:291–302. doi: 10.1053/j.gastro.2019.08.059
6.
Nagtegaal ID Odze RD Klimstra D Paradis V Rugge M Schirmacher P et al . The 2019 WHO classification of tumours of the digestive system. Histopathology. (2020) 76:182–8. doi: 10.1111/his.13975
7.
Burgess NG Tutticci NJ Pellise M Bourke MJ . Sessile serrated adenomas/polyps with cytologic dysplasia: a triple threat for interval cancer. Gastrointest Endosc. (2014) 80:307–10. doi: 10.1016/j.gie.2014.03.050
8.
IJspeert JE Vermeulen L Meijer GA Dekker E . Serrated neoplasia-role in colorectal carcinogenesis and clinical implications. Nat Rev Gastroenterol Hepatol. (2015) 12:401–9. doi: 10.1038/nrgastro.2015.73
9.
Siegel RL Miller KD Goding Sauer A Fedewa SA Butterly LF Anderson JC et al . Colorectal cancer statistics, 2020. CA Cancer J Clin. (2020) 70:145–64. doi: 10.3322/caac.21601
10.
Islami F Goding Sauer A Miller KD Siegel RL Fedewa SA Jacobs EJ et al . Proportion and number of cancer cases and deaths attributable to potentially modifiable risk factors in the United States. CA Cancer J Clin. (2018) 68:31–54. doi: 10.3322/caac.21440
11.
Song M Garrett WS Chan AT . Nutrients, foods, and colorectal cancer prevention. Gastroenterology. (2015) 148:1244–60.e16. doi: 10.1053/j.gastro.2014.12.035
12.
Keum N Giovannucci E . Global burden of colorectal cancer: emerging trends, risk factors and prevention strategies. Nat Rev Gastroenterol Hepatol. (2019) 16:713–32. doi: 10.1038/s41575-019-0189-8
13.
Burnett-Hartman AN Passarelli MN Adams SV Upton MP Zhu LC Potter JD et al . Differences in epidemiologic risk factors for colorectal adenomas and serrated polyps by lesion severity and anatomical site. Am J Epidemiol. (2013) 177:625–37. doi: 10.1093/aje/kws282
14.
Davenport JR Su T Zhao Z Coleman HG Smalley WE Ness RM et al . Modifiable lifestyle factors associated with risk of sessile serrated polyps, conventional adenomas and hyperplastic polyps. Gut. (2018) 67:456–65. doi: 10.1136/gutjnl-2016-312893
15.
He X Wu K Ogino S Giovannucci EL Chan AT Song M . Association between risk factors for colorectal Cancer and risk of serrated polyps and conventional adenomas. Gastroenterology. (2018) 155:355–73.e18. doi: 10.1053/j.gastro.2018.04.019
16.
Hang D Wang L Fang Z du M Wang K He X et al . Ultra-processed food consumption and risk of colorectal cancer precursors: results from 3 prospective cohorts. J Natl Cancer Inst. (2023) 115:155–64. doi: 10.1093/jnci/djac221
17.
Peng L Weigl K Boakye D Brenner H . Risk scores for predicting advanced colorectal neoplasia in the average-risk population: a systematic review and meta-analysis. Am J Gastroenterol. (2018) 113:1788–800. doi: 10.1038/s41395-018-0209-2
18.
Chen H Li N Ren J Feng X Lyu Z Wei L et al . Participation and yield of a population-based colorectal cancer screening programme in China. Gut. (2019) 68:1450–7. doi: 10.1136/gutjnl-2018-317124
19.
Chen C Lu FC . The guidelines for prevention and control of overweight and obesity in Chinese adults. Biomed Environ Sci. (2004) 17:1–36.
20.
Omata F Deshpande GA Ohde S Mine T Fukui T . The association between obesity and colorectal adenoma: systematic review and meta-analysis. Scand J Gastroenterol. (2013) 48:136–46. doi: 10.3109/00365521.2012.737364
21.
Ye X Han P Wu Z Cui Y Chen Y Chen Z et al . New management of surveillance in patients with baseline serrated polyps: a large single-center retrospective cohort study in China. Eur J Gastroenterol Hepatol. (2023) 35:181–90. doi: 10.1097/MEG.0000000000002494
22.
Riondino S Roselli M Palmirotta R Della-Morte D Ferroni P Guadagni F . Obesity and colorectal cancer: role of adipokines in tumor initiation and progression. World J Gastroenterol. (2014) 20:5177–90. doi: 10.3748/wjg.v20.i18.5177
23.
Chaplin A Rodriguez RM Segura-Sampedro JJ Ochogavía-Seguí A Romaguera D Barceló-Coblijn G . Insights behind the relationship between colorectal Cancer and obesity: is visceral adipose tissue the missing link?Mol Sci. (2022) 23. doi: 10.3390/ijms232113128
24.
Leggett B Whitehall V . Role of the serrated pathway in colorectal cancer pathogenesis. Gastroenterology. (2010) 138:2088–100. doi: 10.1053/j.gastro.2009.12.066
25.
Lo CH He X Hang D Wu K Ogino S Chan AT et al . Body fatness over the life course and risk of serrated polyps and conventional adenomas. Int J Cancer. (2020) 147:1831–44. doi: 10.1002/ijc.32958
26.
Larson EA Dalamaga M Magkos F . The role of exercise in obesity-related cancers: current evidence and biological mechanisms. Semin Cancer Biol. (2023) 91:16–26. doi: 10.1016/j.semcancer.2023.02.008
27.
Amitay EL Carr PR Jansen L Roth W Alwers E Herpel E et al . Smoking, alcohol consumption and colorectal cancer risk by molecular pathological subtypes and pathways. Br J Cancer. (2020) 122:1604–10. doi: 10.1038/s41416-020-0803-0
28.
Chia VM Newcomb PA Bigler J Morimoto LM Thibodeau SN Potter JD . Risk of microsatellite-unstable colorectal cancer is associated jointly with smoking and nonsteroidal anti-inflammatory drug use. Cancer Res. (2006) 66:6877–83. doi: 10.1158/0008-5472.CAN-06-1535
29.
Limsui D Vierkant RA Tillmans LS Wang AH Weisenberger DJ Laird PW et al . Cigarette smoking and colorectal cancer risk by molecularly defined subtypes. J Natl Cancer Inst. (2010) 102:1012–22. doi: 10.1093/jnci/djq201
30.
Zeilinger S Kühnel B Klopp N Baurecht H Kleinschmidt A Gieger C et al . Tobacco smoking leads to extensive genome-wide changes in DNA methylation. PLoS One. (2013) 8:e63812. doi: 10.1371/journal.pone.0063812
31.
Cho E Smith-Warner SA Ritz J van den Brandt P Colditz GA Folsom AR et al . Alcohol intake and colorectal cancer: a pooled analysis of 8 cohort studies. Ann Intern Med. (2004) 140:603–13. doi: 10.7326/0003-4819-140-8-200404200-00007
32.
Corrao G Bagnardi V Zambon A Arico S . Exploring the dose-response relationship between alcohol consumption and the risk of several alcohol-related conditions: a meta-analysis. Addiction. (1999) 94:1551–73. doi: 10.1046/j.1360-0443.1999.9410155111.x
33.
Choi YJ Myung SK Lee JH . Light alcohol drinking and risk of Cancer: a Meta-analysis of cohort studies. Cancer Res Treat. (2018) 50:474–87. doi: 10.4143/crt.2017.094
34.
Rumgay H Murphy N Ferrari P Soerjomataram I . Alcohol and Cancer: epidemiology and biological mechanisms. Nutrients. (2021) 13. doi: 10.3390/nu13093173
35.
Shrubsole MJ Wu H Ness RM Shyr Y Smalley WE Zheng W . Alcohol drinking, cigarette smoking, and risk of colorectal adenomatous and hyperplastic polyps. Am J Epidemiol. (2008) 167:1050–8. doi: 10.1093/aje/kwm400
36.
Jayasekara H MacInnis RJ Williamson EJ Hodge AM Clendenning M Rosty C et al . Lifetime alcohol intake is associated with an increased risk of KRAS+ and BRAF-/KRAS- but not BRAF+ colorectal cancer. Int J Cancer. (2017) 140:1485–93. doi: 10.1002/ijc.30568
37.
Hidaka A Harrison TA Cao Y Sakoda LC Barfield R Giannakis M et al . Intake of dietary fruit, vegetables, and Fiber and risk of colorectal Cancer according to molecular subtypes: a pooled analysis of 9 studies. Cancer Res. (2020) 80:4578–90. doi: 10.1158/0008-5472.CAN-20-0168
38.
Fuchs CS Giovannucci EL Colditz GA Hunter DJ Stampfer MJ Rosner B et al . Dietary fiber and the risk of colorectal cancer and adenoma in women. N Engl J Med. (1999) 340:169–76. doi: 10.1056/NEJM199901213400301
39.
Song M Wu K Meyerhardt JA Ogino S Wang M Fuchs CS et al . Fiber intake and survival after colorectal Cancer diagnosis. JAMA Oncol. (2018) 4:71–9. doi: 10.1001/jamaoncol.2017.3684
40.
He X Wu K Zhang X Nishihara R Cao Y Fuchs CS et al . Dietary intake of fiber, whole grains and risk of colorectal cancer: an updated analysis according to food sources, tumor location and molecular subtypes in two large US cohorts. Int J Cancer. (2019) 145:3040–51. doi: 10.1002/ijc.32382
41.
Slattery ML Curtin K Sweeney C Levin TR Potter J Wolff RK et al . Diet and lifestyle factor associations with CpG island methylator phenotype and BRAF mutations in colon cancer. Int J Cancer. (2007) 120:656–63. doi: 10.1002/ijc.22342
42.
Chai X Li Y Yin Z Wu F Hu P Liu X et al . Association of Meat Subtypes with Colorectal Polyp Prevalence: finding from the Lanxi pre-colorectal Cancer cohort in China. Front Nutr. (2022) 9:833571. doi: 10.3389/fnut.2022.833571
43.
Alegria-Lertxundi I Bujanda L Arroyo-Izaga M . Role of dairy foods, fish, white meat, and eggs in the prevention of colorectal Cancer: a systematic review of observational studies in 2018–2022. Nutrients. (2022) 14. doi: 10.3390/nu14163430
Summary
Keywords
colorectal cancer, conventional adenomas, serrated polyps, modifiable lifestyle factors, diet
Citation
Xu J, Chi P, Qin K, Li B, Cheng Z, Yu Z, Jiang C and Yu Y (2024) Association between lifestyle and dietary preference factors and conventional adenomas and serrated polyps. Front. Nutr. 10:1269629. doi: 10.3389/fnut.2023.1269629
Received
30 July 2023
Accepted
20 December 2023
Published
10 January 2024
Volume
10 - 2023
Edited by
Paul B. Higgins, Atlantic Technological University, Ireland
Reviewed by
Paula Berstad, Cancer Registry of Norway, Norway; Luis Eduardo González Salazar, National Institute of Medical Sciences and Nutrition Salvador Zubirán, Mexico
Updates
Copyright
© 2024 Xu, Chi, Qin, Li, Cheng, Yu, Jiang and Yu.
This is an open-access article distributed under the terms of the Creative Commons Attribution License (CC BY). The use, distribution or reproduction in other forums is permitted, provided the original author(s) and the copyright owner(s) are credited and that the original publication in this journal is cited, in accordance with accepted academic practice. No use, distribution or reproduction is permitted which does not comply with these terms.
*Correspondence: Yunxian Yu, yunxianyu@zju.edu.cn
†These authors have contributed equally to this work and share first authorship
Disclaimer
All claims expressed in this article are solely those of the authors and do not necessarily represent those of their affiliated organizations, or those of the publisher, the editors and the reviewers. Any product that may be evaluated in this article or claim that may be made by its manufacturer is not guaranteed or endorsed by the publisher.