 Janine P. M. Faessen
 Edith J. M. Feskens
 Elske M. Brouwer-Brolsma
- Division of Human Nutrition and Health, Wageningen University & Research, Wageningen, Netherlands
Introduction: Diet quality indices provide a quick indicator of overall diet and are commonly used in research and surveillance. We developed a Dutch Healthy Diet for pregnant women (DHD-P) index, comprising 22 components aligned with the 2021 Dutch food-based dietary guidelines for pregnant women. Our evaluation focused on assessing its performance and sensitivity to change.
Methods: The DHD-P index was quantified by using a validated Food Frequency Questionnaire (FFQ) and two 24-h recalls at 12 and 24 weeks gestation completed by 24-to-41 year old pregnant women participating in the GLIMP-II study. Strength and direction of associations were evaluated based on de-attenuated correlation coefficients between FFQ and 24-h recall data at 24 weeks gestation (n = 47). Sensitivity to change was evaluated by comparing DHD-P index data assessed by both FFQ and recalls at 12 and 24 weeks gestation using paired t-tests or Wilcoxon Signed Rank Test (n = 27).
Results: De-attenuated correlation coefficients between FFQ and 24-recall data showed a good correlation for the total DHD-P score (rho = 0.57) and moderate to good correlations for component scores. FFQ as well as recall data showed comparable dietary intake at 12 and 24 weeks, suggesting minimal changes during pregnancy. Correlations over time were moderate-to-good for scores based on FFQ and low to moderate for scores based on 24hRs, indicating better reproducibility of scores based on FFQ data.
Conclusion: Considering the moderate to good correlations, the DHD-P index appears to be an appropriate index to assess diet quality among pregnant women, and could serve as a foundation to provide dietary feedback toward healthier food choices. Studies including dietary data for all relevant food groups and nutrients are needed to substantiate our findings and further explore the DHD-P sensitivity to change.
Introduction
A diet quality index is a convenient and effective indicator of overall diet quality (1, 2). These indices capture information about a group of dietary components and are assumed to partially account for synergistic interactions between nutrients and/or food groups (3). Consequently, epidemiological studies are placing growing emphasis on exploring associations between diet quality indices and specific health outcomes, moving beyond a focus solely on single nutrients and foods. To illustrate, a meta-analysis on 18 studies concluded that a one unit higher maternal diet quality was associated with a one unit better child neurodevelopment score (1). Moreover, a low Healthy Eating Index 2015 score (<70) among 762 US pregnant women was associated with a higher risk of fetal growth restrictions and hypertensive disorders during pregnancy (RR = 0.33, 95%CI: 0.13–0.68 and RR = 0.46, 95%CI: 0.24–0.79) (4). In a study among 660 pregnant Mexican women, women in the highest tertile of the Maternal Diet Quality Score compared to lowest tertile had a reduced risk of a baby with low birth weight (OR = 0.22, 95%CI: 0.06–0.75) (2).
In addition to its application in epidemiological contexts, a diet quality index is a straightforward parameter to understand and apply by health care professionals, policy makers as well as the general population (3). Therefore, diet quality indices are valuable tools as part of mobile Health (mHealth)-applications to facilitate self-monitoring and providing more individualized feedback in clinical practices to improve diet quality (3, 5). In fact, diet quality indices improved dietary habits of users in 60% of previously reviewed apps (6). However, mHealth-applications using diet quality indices for pregnant women are currently not available.
A diet quality index can consist of several different components (e.g., food groups, macro or micronutrients), scoring methods (e.g., ratios, moderation, and optimum), weighting of components (e.g., dependent on health effects) and can be based on different dietary recommendations (5, 7). While several diet quality indices have been developed for pregnant women across the globe (8–11), no diet quality exists yet for Dutch pregnant women. However, there is a Dutch Healthy Diet 2015 (DHD-2015) index based on the Dutch dietary guidelines of 2015 for the general adult population, excluding pregnant and lactating women (5, 12). More recently (2021), the Health Council of the Netherlands developed dietary guidelines for pregnant women (13).
The main objective of this study was to refine the existing DHD-15 index, aligning it with the latest Dutch dietary recommendations for pregnant women (DHD-P), using data of the GLIMP-II study. This refinement serves as a crucial step in establishing the foundation for a personalized nutrition app tailored to the specific dietary needs of pregnant women. Subsequently, we studied the correlation between the DHD-P index calculated using food frequency questionnaire (FFQ) data and using 24-h recall (24hR) data, and examined the index’s ability to detect changes over time at 12 and 24 weeks of gestation.
Methods
Study design
Data were extracted from the GLIMP-II study (14, 15), a prospective cohort study to assess the impact of diet, nutrient status and other lifestyle factors on the development of gestational diabetes mellitus. Women visited the hospital at four timepoints: before pregnancy (T0), at 12 weeks of gestation (T1), at 24 weeks of gestation (T2) and after pregnancy (T3). At each time point, information on anthropometrics was obtained, followed by fasting venipuncture and a 75-grams oral glucose tolerance test including a venipuncture 2 h after glucose load. Furthermore, participants completed a FFQ and various questionnaires addressing lifestyle, health, and pregnancy-related factors at each time point. Additionally, participants submitted two 24hRs during each time period. The Medical Ethics Committee of Wageningen University & Research approved the GLIMP2 study (NL50554.081.14). All women gave their written informed consent before the start of the study.
Study population
Between June 2015 and May 2017, women were enrolled in this study if they expressed a desire to become pregnant within 1 year or were less than 24 weeks pregnant. Recruitment took place through three hospitals in the eastern part of the Netherlands: Gelderse Vallei Hospital (Ede), Rijnstate (Arnhem), and Slingeland (Doetinchem). Inclusion criteria involved women aged 18–40, proficient in speaking and reading Dutch, and capable of independent decision making. Participants meeting any of the following criteria were excluded from the study: inability to read or speak Dutch, multiple gestation index pregnancy (e.g., twins), diagnosis of Type 1 diabetes mellitus, diagnosis of Type 2 diabetes mellitus, index pregnancy resulting in preterm birth (<32 weeks), and index pregnancy resulting in low birth weight (<2,500 g). Eventually, 107 women participated in the study, but not all provided complete dietary data at all timepoints, leading to varied inclusions for the different analyses performed.
Dietary assessment
Dietary intake data were collected by using FFQ and 24hR. The semi-quantitative FFQ consisting of 173 items was validated to estimate habitual intake of energy, macronutrients, fiber, and B-vitamins among Dutch adults (16, 17). Consumption frequencies and number of units eaten or portion sizes were defined according to Dutch household measures (18). Frequencies ranged from ‘not in this month’ to ‘6–7 days per week’. Daily intake levels were calculated by multiplying frequency, portion size and nutrient content per gram using Dutch food composition table from 2011 (19). Additionally, two web-based 24hRs using Compl-eat™ (20) were completed for each time period. The tool guides participants in reporting all foods and drinks consumed during the previous day, including foods and standard recipes commonly consumed by the Dutch population. Portion sizes were reported in household measures, standard portions, weight in grams and volume in liters. Lastly, it reminds participants to report commonly forgotten foods such as snacks, sugar in coffee and cooking fats. Dates were randomly selected. Trained dieticians checked all reported 24hRs on unusual portion sizes and data completeness. Nutrient intakes were calculated using the Dutch Food Composition Database (NEVO) 2016. Participants reported their supplement usage at each time point, detailing frequency, quantity (number of tablets or drops), type, and brand. Supplement content was determined from product label information or the Anatomical Therapeutic Chemical (ATC) code website. For FFQ and recall comparison, women with data from both FFQ and two recalls at 24 weeks pregnancy were considered (n = 47). For the assessment of sensitivity to change, data of 27 women with FFQ and two 24hRs at both 12 and 24 weeks of pregnancy could be used.
Development of the DHD-P index
Scoring of the DHD-P index was based on dietary recommendations for pregnant women and the general Dutch population (13, 21). The recommended minimum, maximum or range of intake from the guidelines informed the scoring for each component. If a recommended level or range was lacking, the score was assigned based on the perceived positive or negative health associations of the food/nutrient, drawing from existing literature and considering the population’s intake range. In the subsequent sections, we elaborate on the calculation for each modified or added component in the DHD-P index (i.e., iron, dairy, fish, caffeine, alcohol, soy products folic acid supplementation, vitamin D supplementation, vitamin A, iodine and iron) as compared to the original DHD index. As the scoring methodology for fruit, vegetables, whole grains, legumes, nuts, fats and oils, red meat, processed meat, coffee, sweetened beverages and fruit juices and salt is similar to the original DHD index (5), the calculation for these components is not further detailed in this manuscript except for Table 1.
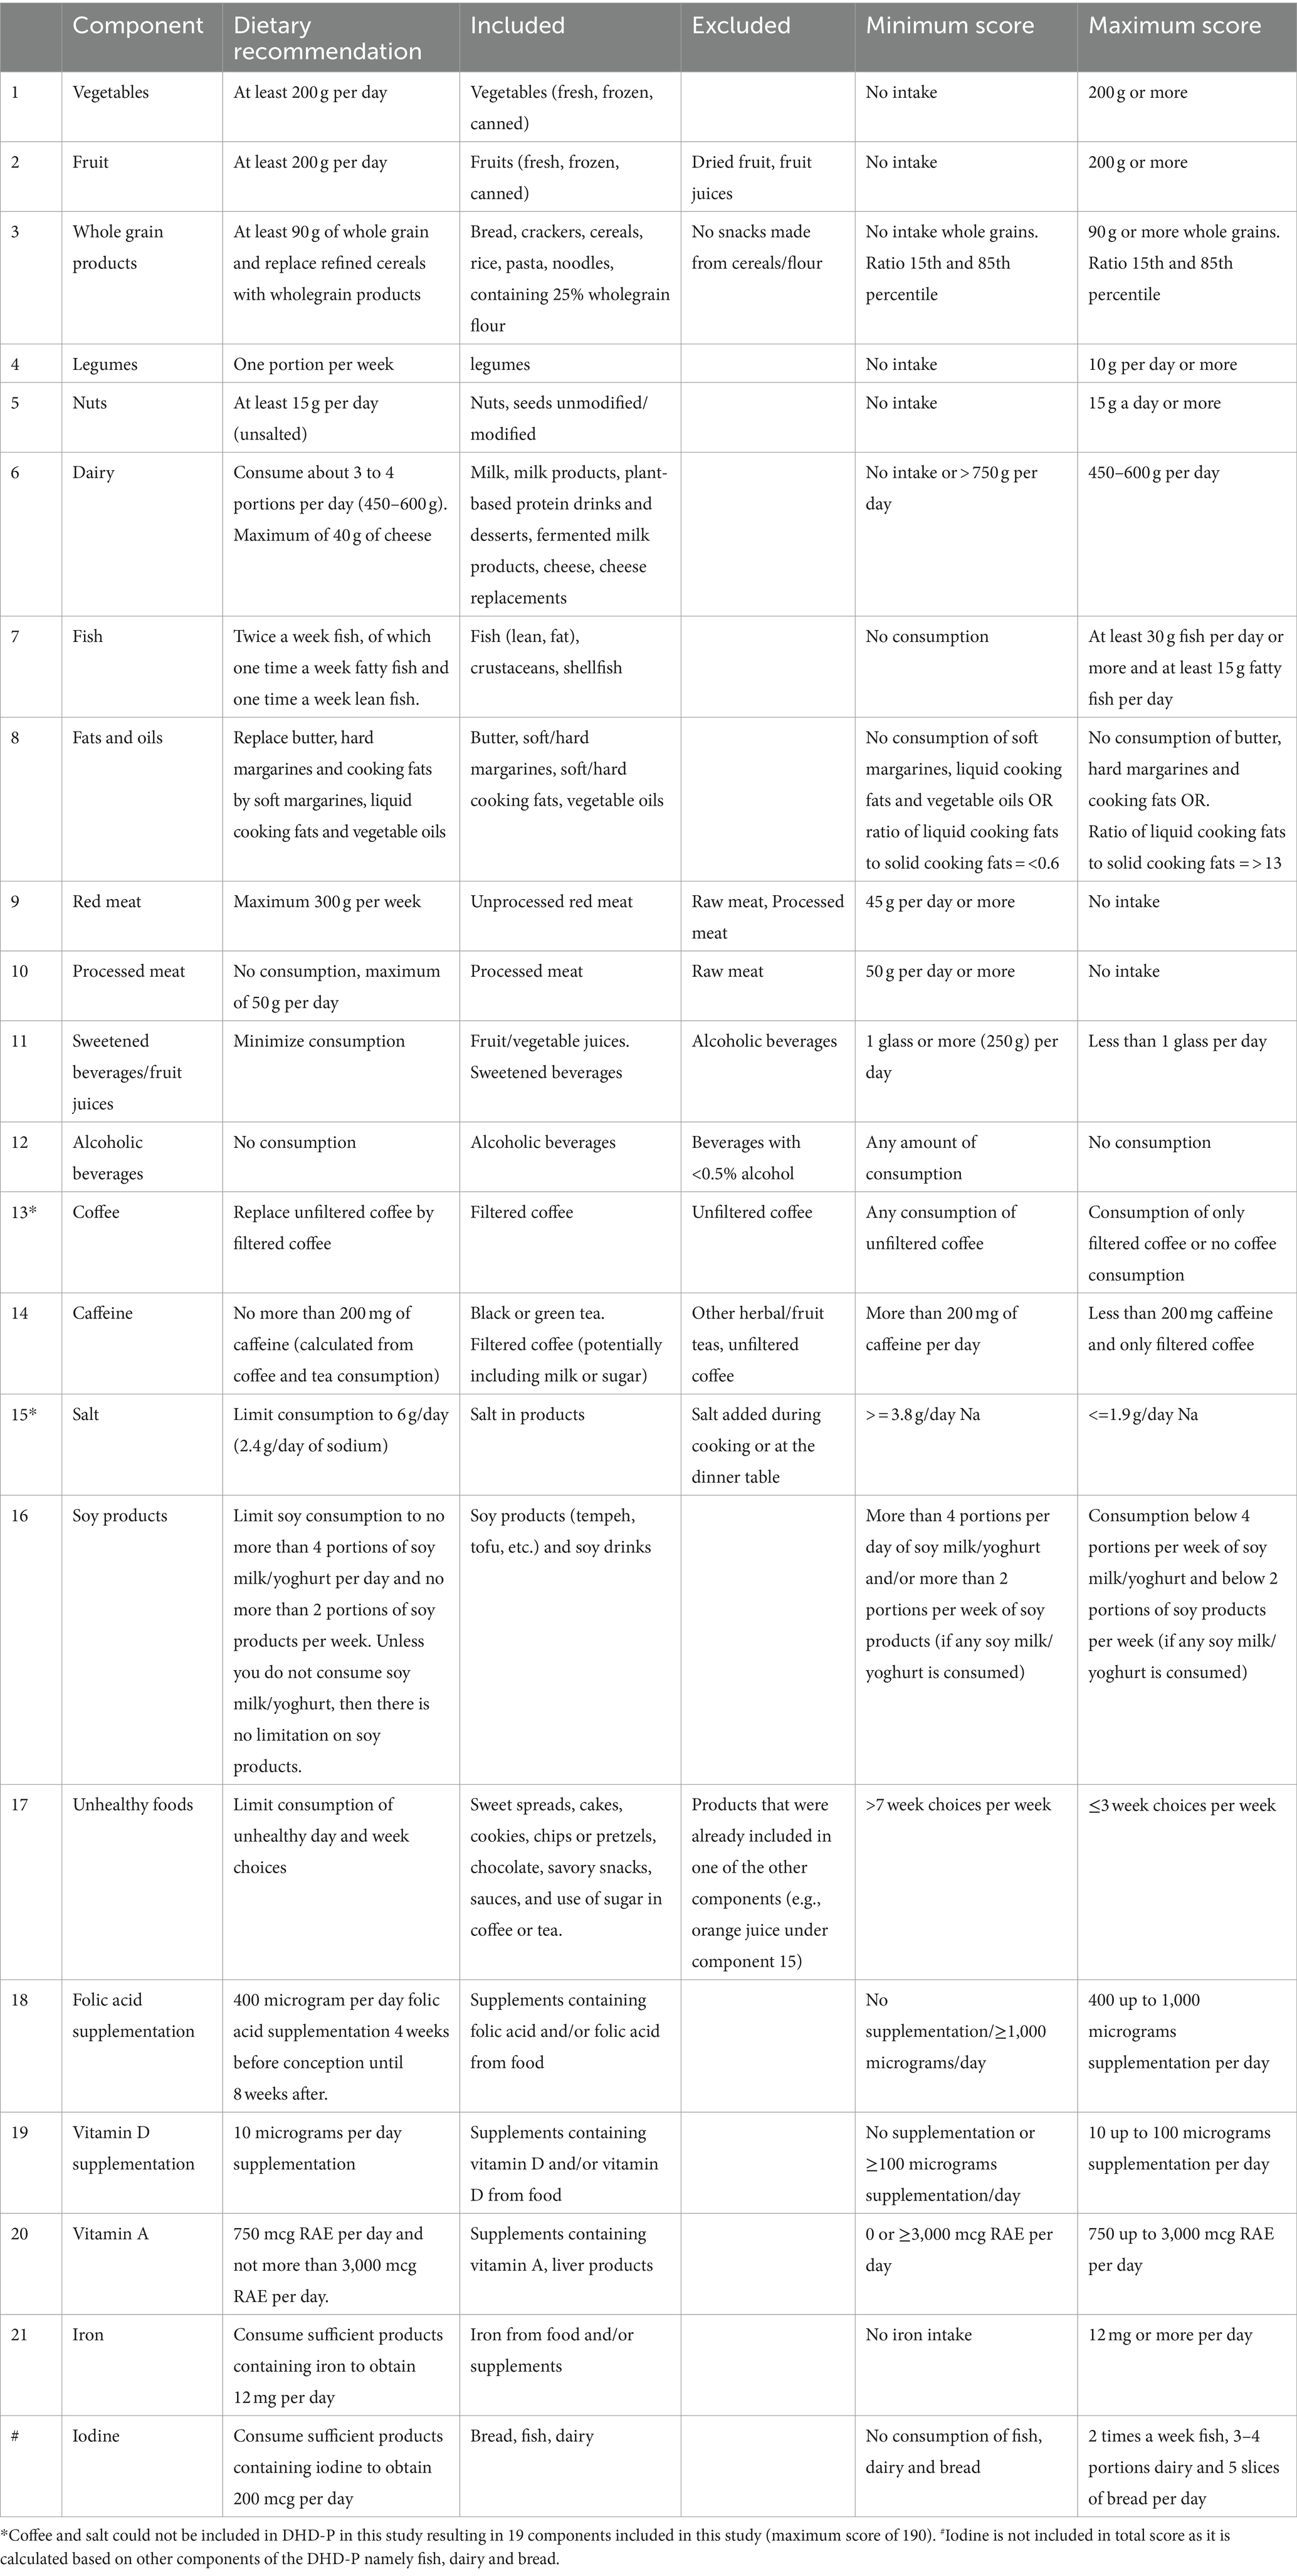
Table 1. Overview of scoring components of the DHD-P index.
Dairy
Pregnant women are recommended to consume 3–4 portions of dairy products (13). Dairy and particularly calcium reduces the risk of pre-eclampsia, hypertension and pre-term birth (13, 22). Women score 10 points for a consumption between 3 and 4 portions daily. Aligning with the DHD-15 index, a maximum limit is set at 750 g/day, equivalent to approximately five portions per day according the Dutch portion size database portie-online.nl (23). Additionally, the Dutch Nutrition Centre recommends a maximum of 40 g of cheese per day (24). Pregnant women are recommended not to consume raw milk or cheese made from raw milk. Skimmed and semi-skimmed milk are part of the dietary recommendations of the Dutch Nutrition Centre, but full-fat milk is not. Butter is excluded from this category.
Fish
Pregnant women are recommended to consume fish twice weekly, including both lean and fatty fish, promoting brain development (25) and reducing the risk of early birth (13). The fish score is divided into two sub-scores; one for lean fish and one for fatty fish consumption. Earning 10 points requires a weekly 100-gram portion (approximately 15 g per day), with scores ranging from 0 to 10 for daily consumption between 0 and 15 g. Similarly, consuming at least 15 g per day of fatty fish is awarded 10 points, with a score ranging from 0 to 10 for daily consumption between 0 and 15 g. Both sub-scores equally contribute to the total fish score. Although it is crucial to avoid raw fish, particularly predator and pale fish, to minimize the risk of exposure to contaminants like dioxins and mercury (13), these specifics are not included in the score due to limited available information.
Caffeine
To promote fetal growth and prevent low birth weight (26), the Health Council recommends limiting caffeine intake to 200 mg per day (13), equivalent to two cups of coffee. Tea, with lower caffeine content, is allowed up to four cups (25). Exceeding these limits results in a score of 0, while intake below these thresholds earns a score of 10. The assessment uses cups of coffee as a proxy due to limitations in obtaining precise caffeine intake information through FFQ and 24-recall methods.
Alcohol
Alcohol poses risks to fertility and is strongly discouraged during pregnancy due to its association with birth defects and developmental disorders (27). The scoring system assigns 10 points to women who abstain from alcohol, while any amount of alcohol consumption results in a score of 0. The scoring reflects the unequivocal recommendation to completely avoid alcohol during pregnancy, as no safe threshold has been identified (13).
Soy products
The Nutrition Centre recommends women not to exceed four portions of soy drink or yoghurt per day and to limit soy product consumption to 2 times a week as part of dinner. No specific limits are set for women avoiding soy drink or yogurt. Soy contains isoflavones, which have a weak estrogenic effect, potentially having hormonal disruptive effects, and can pass the placenta (13). The upper intake limit is set at 1 mg per kg of body weight per day (13). Women surpassing the recommended limits receive 0 points, while those staying below are scored 10 points.
Folic acid supplementation
The Health Council of the Netherlands (HCN) recommends women actively planning, wishing, or experiencing unplanned pregnancies to use a daily folic acid supplementation of 400 mcg, starting 1 month before conception and continuing up to 10 weeks after conception (13). This is crucial as the recommended intake cannot be met through a regular diet, and supplementation reduces the risk on neural tube defects, early birth and low birth weight (13). Scoring ranges from 0–10: 10 points for intakes of 400 mcg or higher (up to 1,000 mcg based on Upper Tolerable Levels as set by the European Food Safety Authority) (28) in the first 10 weeks of pregnancy; 0 points for intakes of 0 or above 1,000 mcg; the score ranges between 0 and 10 for intakes between 0 and 400 micrograms and between 400 and 1,000 mcg the score ranges from 10 to 0. If a woman is more than 10 weeks pregnant, the score for this component is set at 10.
Vitamin D supplementation
Pregnant women, irrespective of skin color or sunlight exposure, are recommended to supplement their diet with 10 micrograms of vitamin D per day (29), which aligns with the general guidance for individuals with dark skin or low sun exposure. Vitamin D is important for bone growth of the baby, reduced risk of gestational diabetes and a low birth weight and asthma-like symptoms of the baby (13). Women score 10 points for an intake of 10 mcg vitamin D per day through supplements. A score of 0 is assigned for no intake or above 100 mcg (based on Upper Tolerable Levels as set by the European Food Safety Authority) (30), while scores between 0–10 and 100–10 mcg vary from 0 to 10.
Vitamin A
For pregnant women, the recommended daily intake of vitamin A is 750 mcg retinol-activity-equivalents (RAE), with a tolerable upper limit is 3,000 mcg per day (31). While vitamin A is essential for reproduction, excessive retinol intake can have teratogenic effects on the fetus. Women score 10 points for a 750 mcg RAE intake, and scores range from 0 to 10 for intakes between 0 and 750 mcg RAE and between 3,000 and 750 mcg RAE.
Iron
The Dutch Health Council recommends that pregnant women ensure sufficient dietary iron intake to prevent deficiencies (13). Sufficient iron intake levels reduce the risk of maternal anemia during and after pregnancy (32). Recognizing the challenge in obtaining adequate iron solely through diet, the recommended intake is set at 12 mg per day instead of the original 16 mg per day (13). Scoring awards 10 points for intakes of 12 mg or higher, with the score varying from 0 to 10 for intakes between 0 and 12 mg per day.
Iodine
The daily iodine requirement is 200 mcg per day (13), crucial for thyroid gland function, vital in the growth and brain development of the unborn child (13). To ensure adequate iodine intake, the Dutch Nutrition Centre recommends consuming fish twice a week, 3–4 portions of dairy per day, and 5 slices of bread daily (33). The iodine score, an additional score, is not included in the total score due to overlapping components. More specifically, the iodine score is calculated based on the subcomponents dairy, fish and bread, which each count for 1/3 of the score. The components dairy and fish are calculated as described earlier; consuming 5 slices of bread daily scores a 10, with the score increasing from 0 to 10 for 0 to 5 slices of bread daily.
DHD-P index in GLIMP-II
Diet quality scores based on FFQ and 24hR data were computed following the calculations outlined in Table 1. Due to limited dietary intake data obtained from both the FFQ and 24hR, some component scores were either not included in the final calculation or according to a modified approach based on available data. Specifically, coffee (lacking detail on being filtered/unfiltered) and salt intake (i.e., lacking detail on salt use in home cooked meals) scores could not be determined due to insufficient data. Excluding salt and coffee from the index resulted in a maximum possible score of 190 based on 19 components. Iodine was not included in the total score as it relies on other components in the index, namely dairy and fish.
Covariates
Body mass index (BMI) was calculated as body weight divided by squared body height (kg/m2). Body weight was measured to the nearest 0.1 kg with empty pockets and without shoes at each time point by trained professionals using a calibrated balance (SECA, Hamburg, Germany). Body height was measured to nearest 0.1 cm with no shoes on using a wall-mounted stadiometer (SECA, Hamburg, Germany). Standardized questions mainly based on the LifeLines study questionnaires (34) were employed to gather data on various maternal factors, including age (years), ethnicity (Western/non-Western), marital status (married/living together), parity (no/one or more children), educational level (low/mediate/high), smoking habits (yes/no), and physical activity (MET min/week) and history of gestational diabetes (yes/no). Ethnicity classification was determined based on the participant’s birth country and biological parents and was categorized in Western or non-Western. Education level was divided into low (primary school, vocational or lower general secondary education), mediate (higher secondary education or intermediate vocational training) and high (higher vocational education or university).
Statistical analysis
Categorical variables were depicted as frequencies and percentages. Median with interquartile range were shown for non-normally distributed data, while means with standard deviations were used for normally distributed data. Macronutrient levels were presented as percentage of total energy.
To assess relative validity, scores based on the FFQ were compared to scores based on the average of two 24hRs at 24 weeks of pregnancy by using a paired sample Wilcoxon Signed Rank Test for not normally distributed data. Spearman correlation coefficients were assessed using Lombards criteria (35) to indicate strength and direction of association of individual scores. A correlation coefficient below 0.20 was considered weak, between 0.20 and 0.49 moderate and 0.50 or higher good (35). Correlation coefficients between 24hR and FFQ intake levels were expected to be attenuated due to high within person variation from day-to-day variation of two 24hRs. To adjust for within person variation, de-attenuated correlation coefficients were calculated by using the method of Rosner and Willett (36).
To assess sensitivity to change, absolute scores were compared over time, and correlation coefficients were calculated between scores at 12 weeks and 24 weeks based on both FFQ and 24hR data (37). As data was not-normally distributed data, a paired Wilcoxon Signed Rank Test was performed and Spearman correlation coefficients were calculated.
Statistical analyses were performed using R 4.0.2 with a confidence level of 0.95.
Results
Table 2 presents the baseline characteristics for the total population and stratified based on diet quality score. On average, women were 33 years old (SD: 3) with a BMI of 27 kg/m2 (SD: 5). Most women were married (84%), had children (96%), identified as western ethnicity (98%), and had a high education level (73%). Only 5% (n = 2) smoked, and 9% (n = 4) had a history of gestational diabetes. Although not statistically significant, there were noticeable differences in education between women with low and high DHD-P scores (59% versus 86% high educated, p = 0.11).
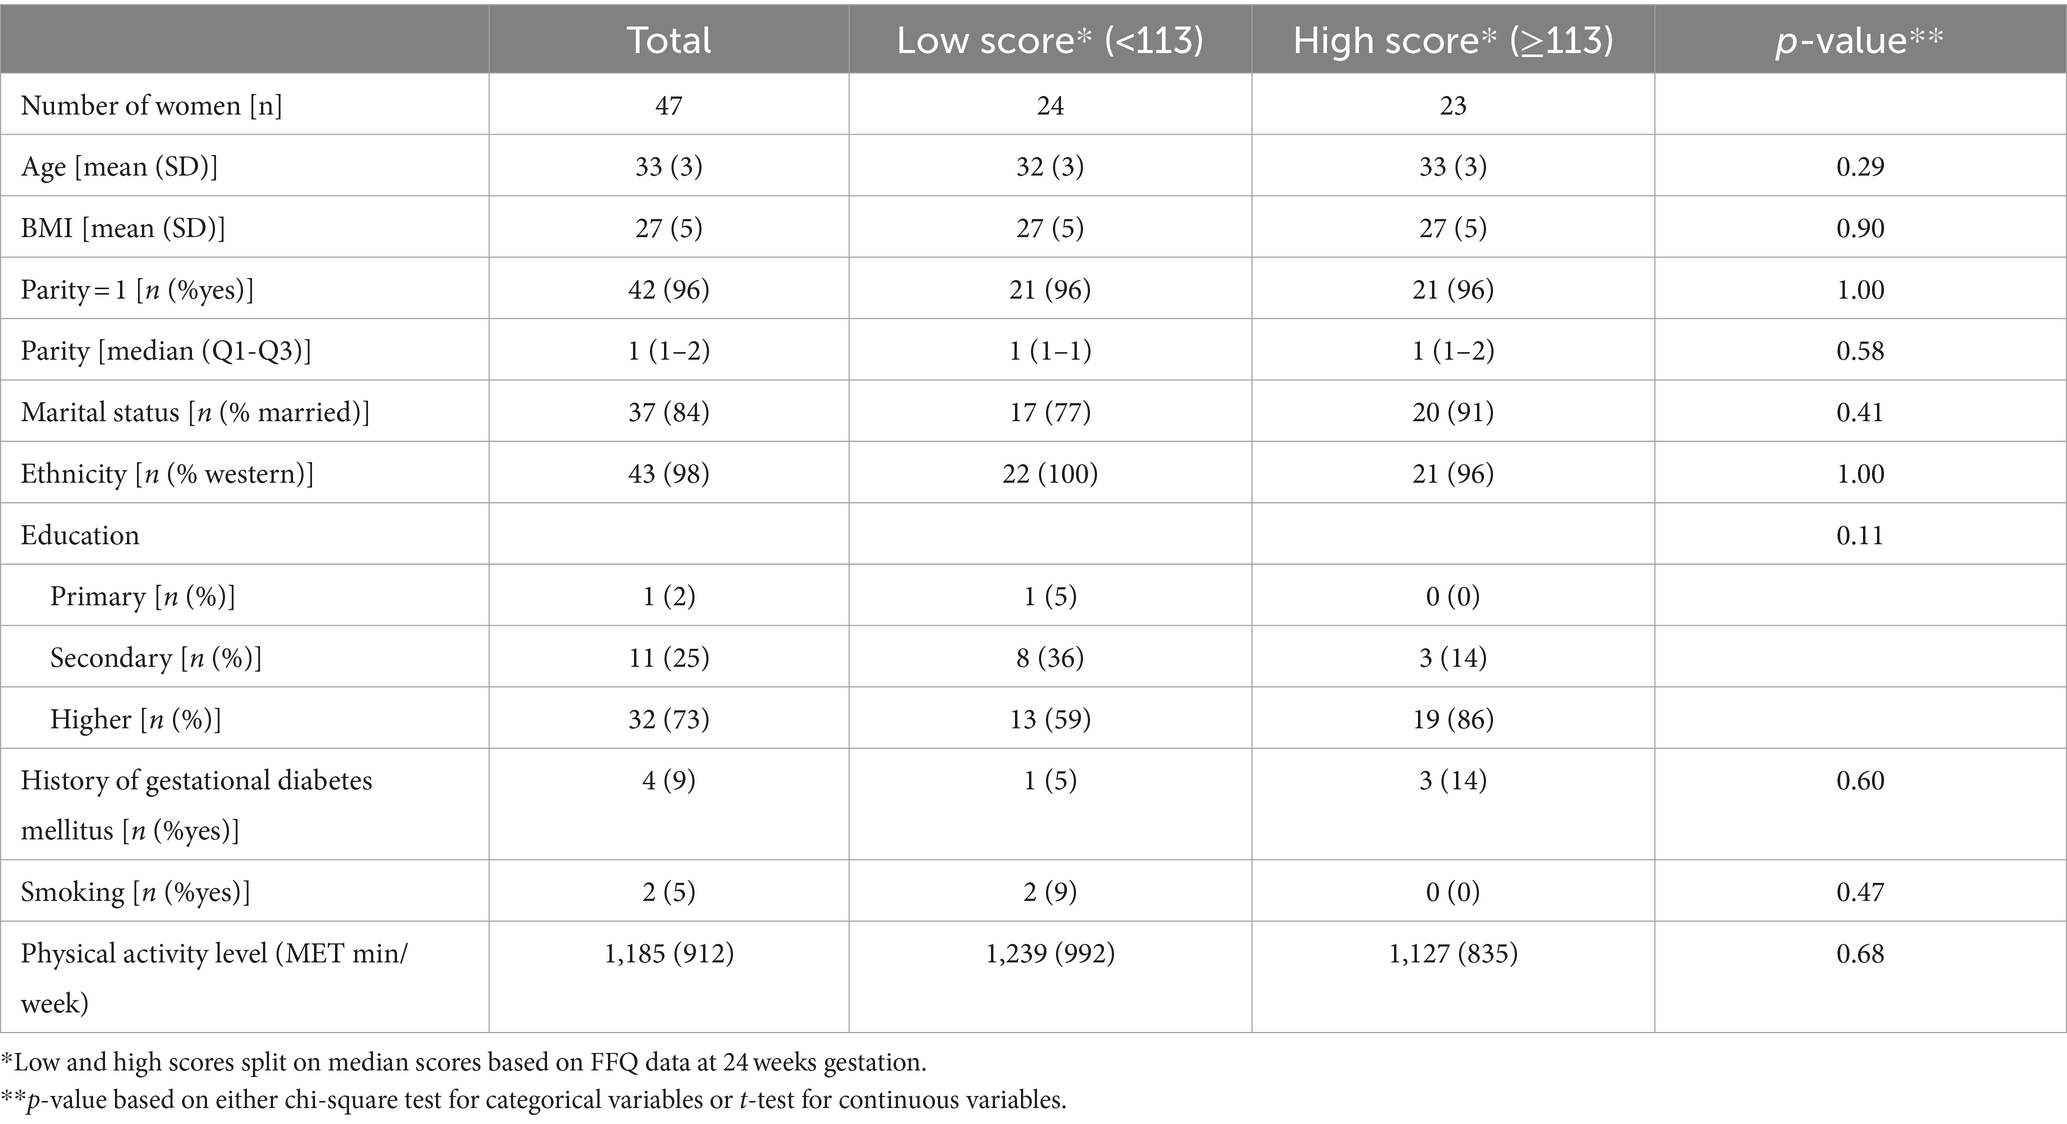
Table 2. Baseline characteristics of study population.
Percentages of total energy from macronutrients were comparable for FFQ and 24hR data at 24 weeks (Table 3). FFQ data indicated higher intakes of vegetables, legumes, total fish, lean fish, fatty fish, liquid fat and iron compared to the recall data, while the opposite trend was observed for vitamin A and caffeine intake. A significant difference was also observed when comparing FFQ and recall data for the total diet quality score, i.e., 113 (IQR: 100–126) and 104 (IQR: 96–109) (p < 0.001), respectively. Examining individual component scores showed that vegetables, fruit, legumes, fish, fats, caffeine, vitamin A and iodine scored significantly higher in FFQ compared to 24hR data. The processed meat score was higher in 24hR data compared to FFQ data [4 (IQR: 0–10) versus 3 (IQR: 0–5)]. All other components did not significantly differ between FFQ and 24hRs.
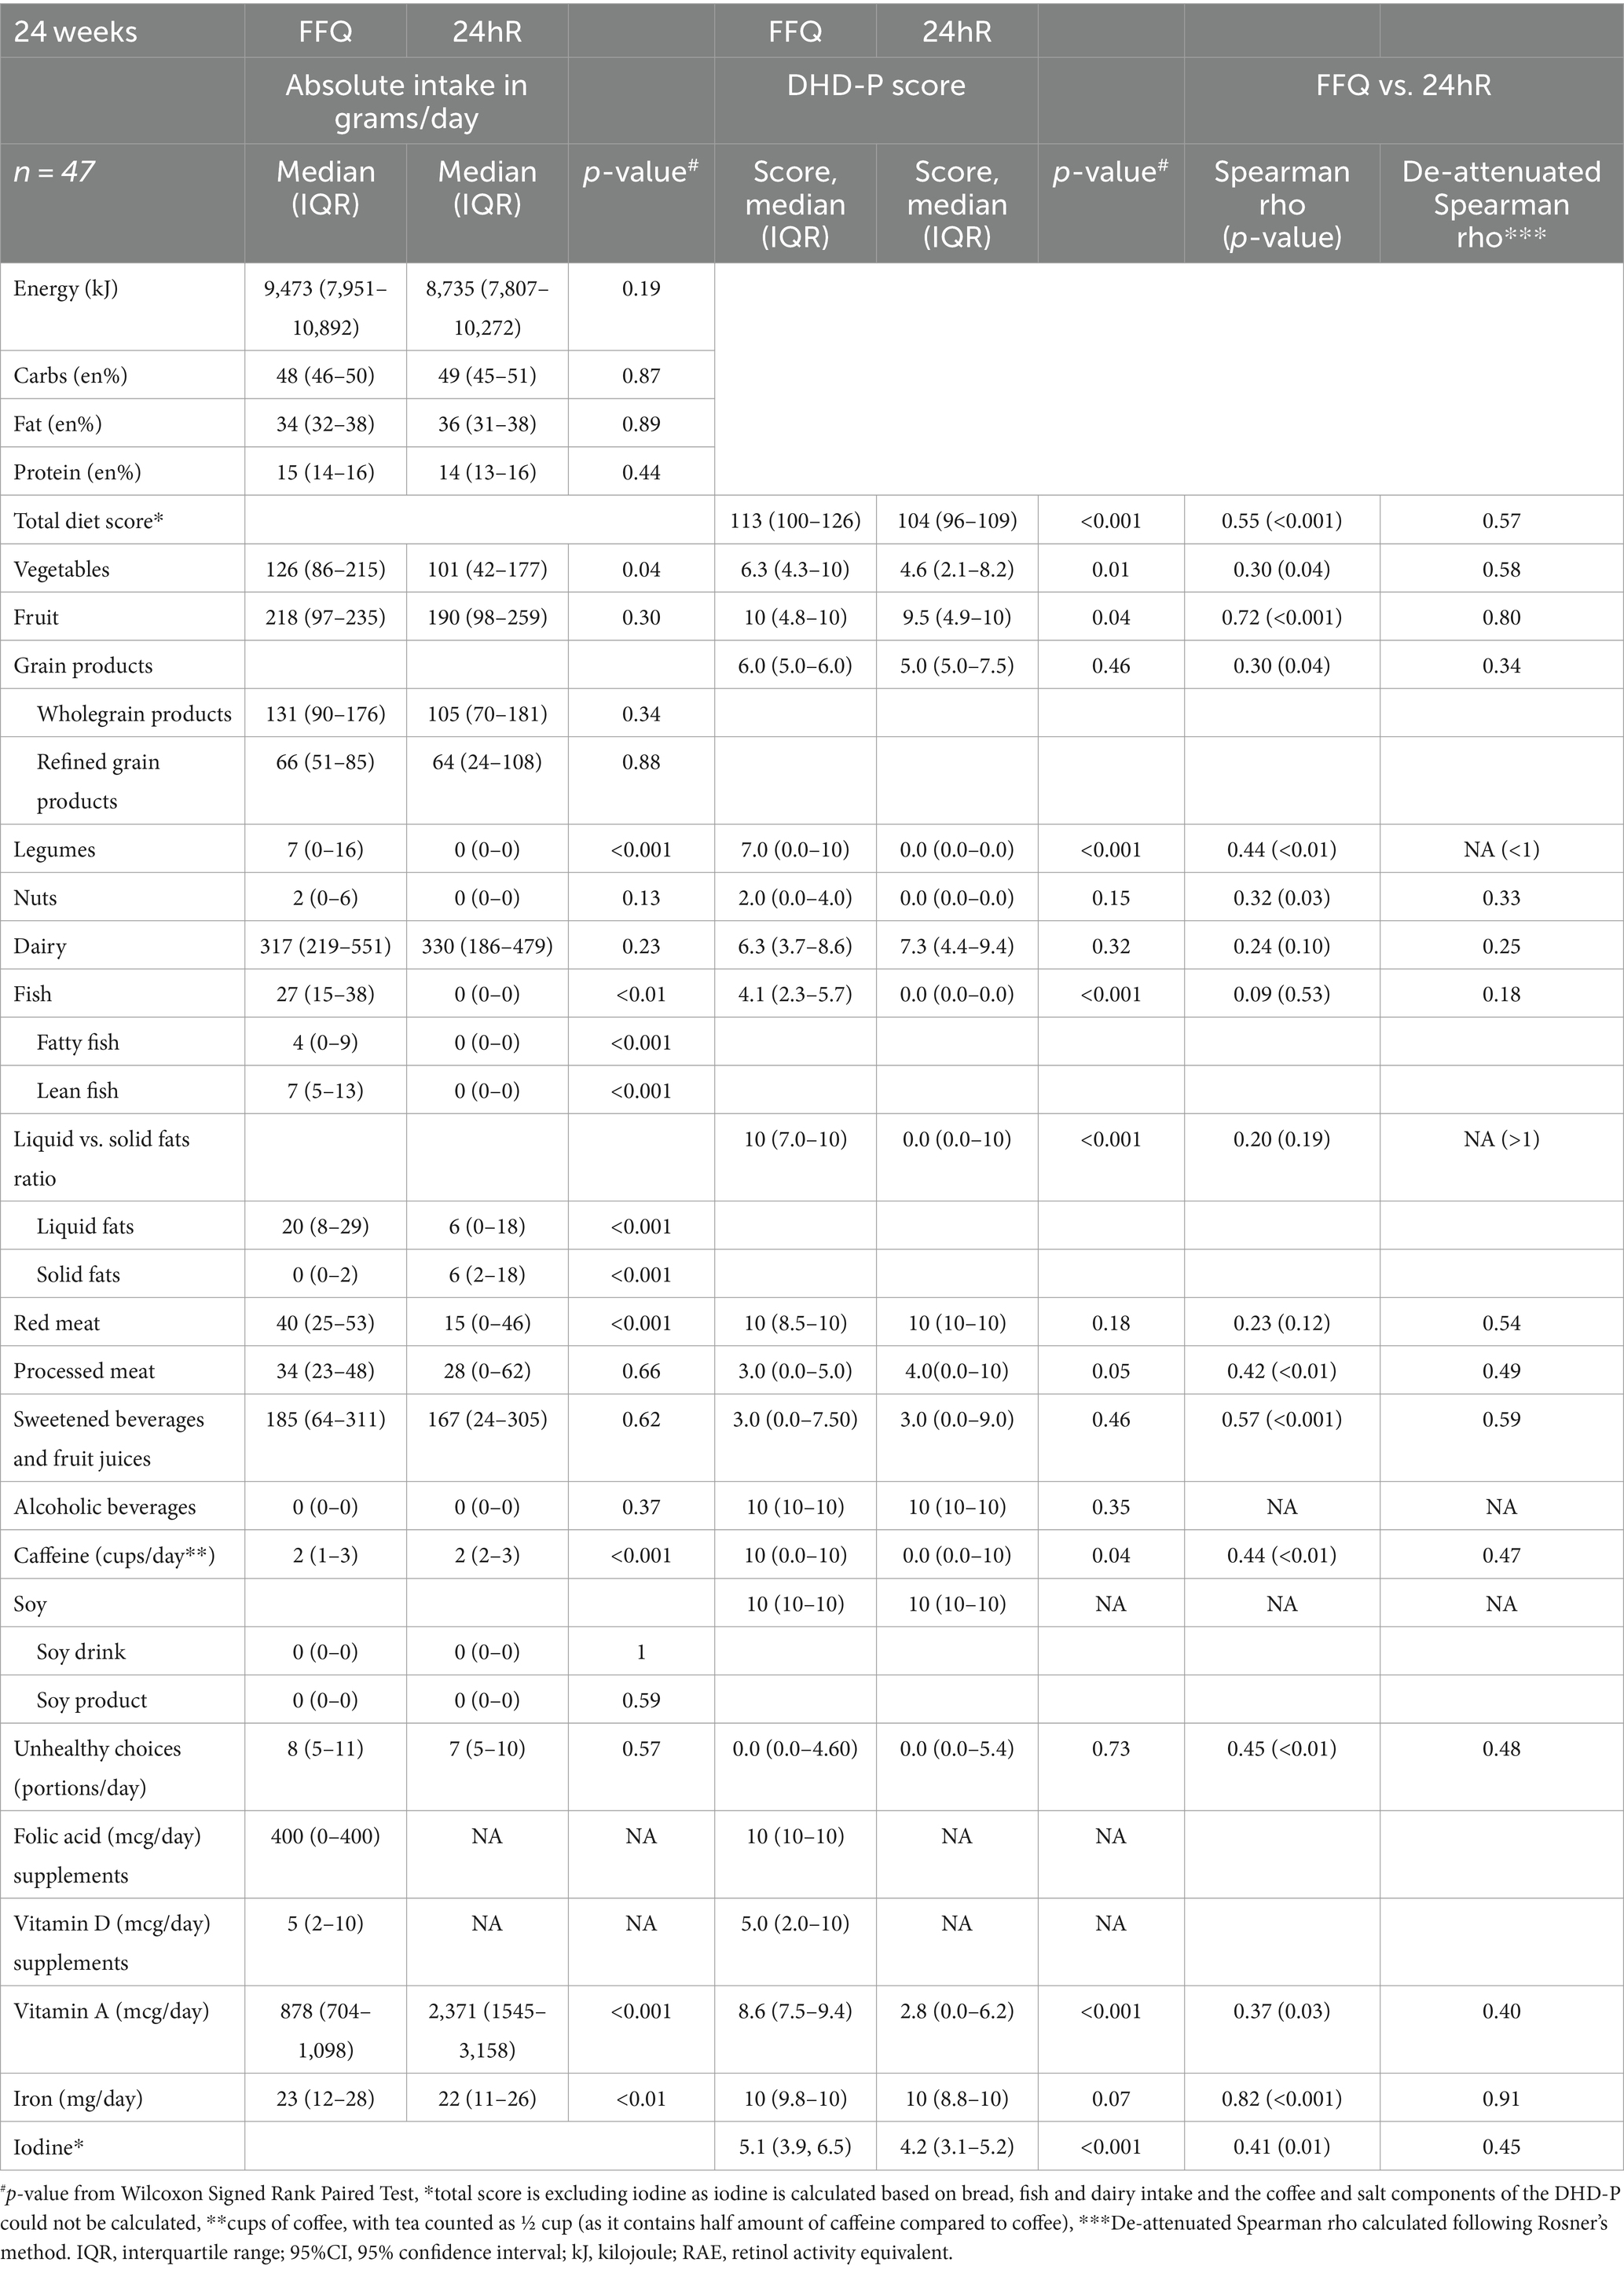
Table 3. Comparison of energy, macronutrients, and DHD-P components between 24hR and FFQ at 24 weeks gestation.
Despite significant absolute differences in the total diet quality score for the FFQ and recall, the de-attenuated correlation coefficient between the two methods was 0.57 and classified as good. Similarly, correlations for individual component scores when comparing FFQ and 24hR data were moderate or good for most components (Table 3). Specifically, correlations between component scores based on FFQ and 24hR data were moderate for whole grains, nuts, dairy, processed meat, caffeine, unhealthy choices, vitamin A and iodine (rho = 0.25–0.49) (35). For fruit, vegetables, sugar-sweetened beverages, red meat and iron correlations were good (>0.50). A low correlation was observed for fish (rho = 0.09). The uncorrected correlation coefficients for the total diet quality score, whole grain products, nuts, dairy, sweetened beverages and fruit juices, caffeine, unhealthy choices, vitamin A and iodine were similar to the de-attenuated values. No de-attenuated correlation coefficients could be calculated for legumes (Spearman rho = 0.44) and fat (Spearman rho = 0.20) due to high within person variation. A de-attenuated correlation coefficient for alcoholic beverages and soy products could not be calculated due the high similarity in consumption between FFQ and 24hR data, resulting in minimal variance and within person variation.
An overview of diet quality based on FFQ data at 12 and 24 gestational weeks is presented in Table 4, revealing significant absolute differences for the intakes of red meat [43 (IQR: 29–58) vs. 39 (IQR 23–47) g/day, p = 0.02], caffeine [2 (IQR: 1–2) versus 2 (IQR: 1–3) cups/day, p = 0.04] and supplemental folic acid [400 (IQR: 400–400) versus 400 (IQR: 0–400) mcg/day, p = 0.02]. No significant differences were observed for any other DHD-P components. Accordingly, evaluation of individual component scores did not significantly differ over time, except for red meat [diff = −0.9 (95%CI:−1.5; −0.3)], and the total diet quality score showed a correlation coefficient of 0.69 over time, with individual components correlations ranging from 0.27 for red meat to 0.84 for vegetables.
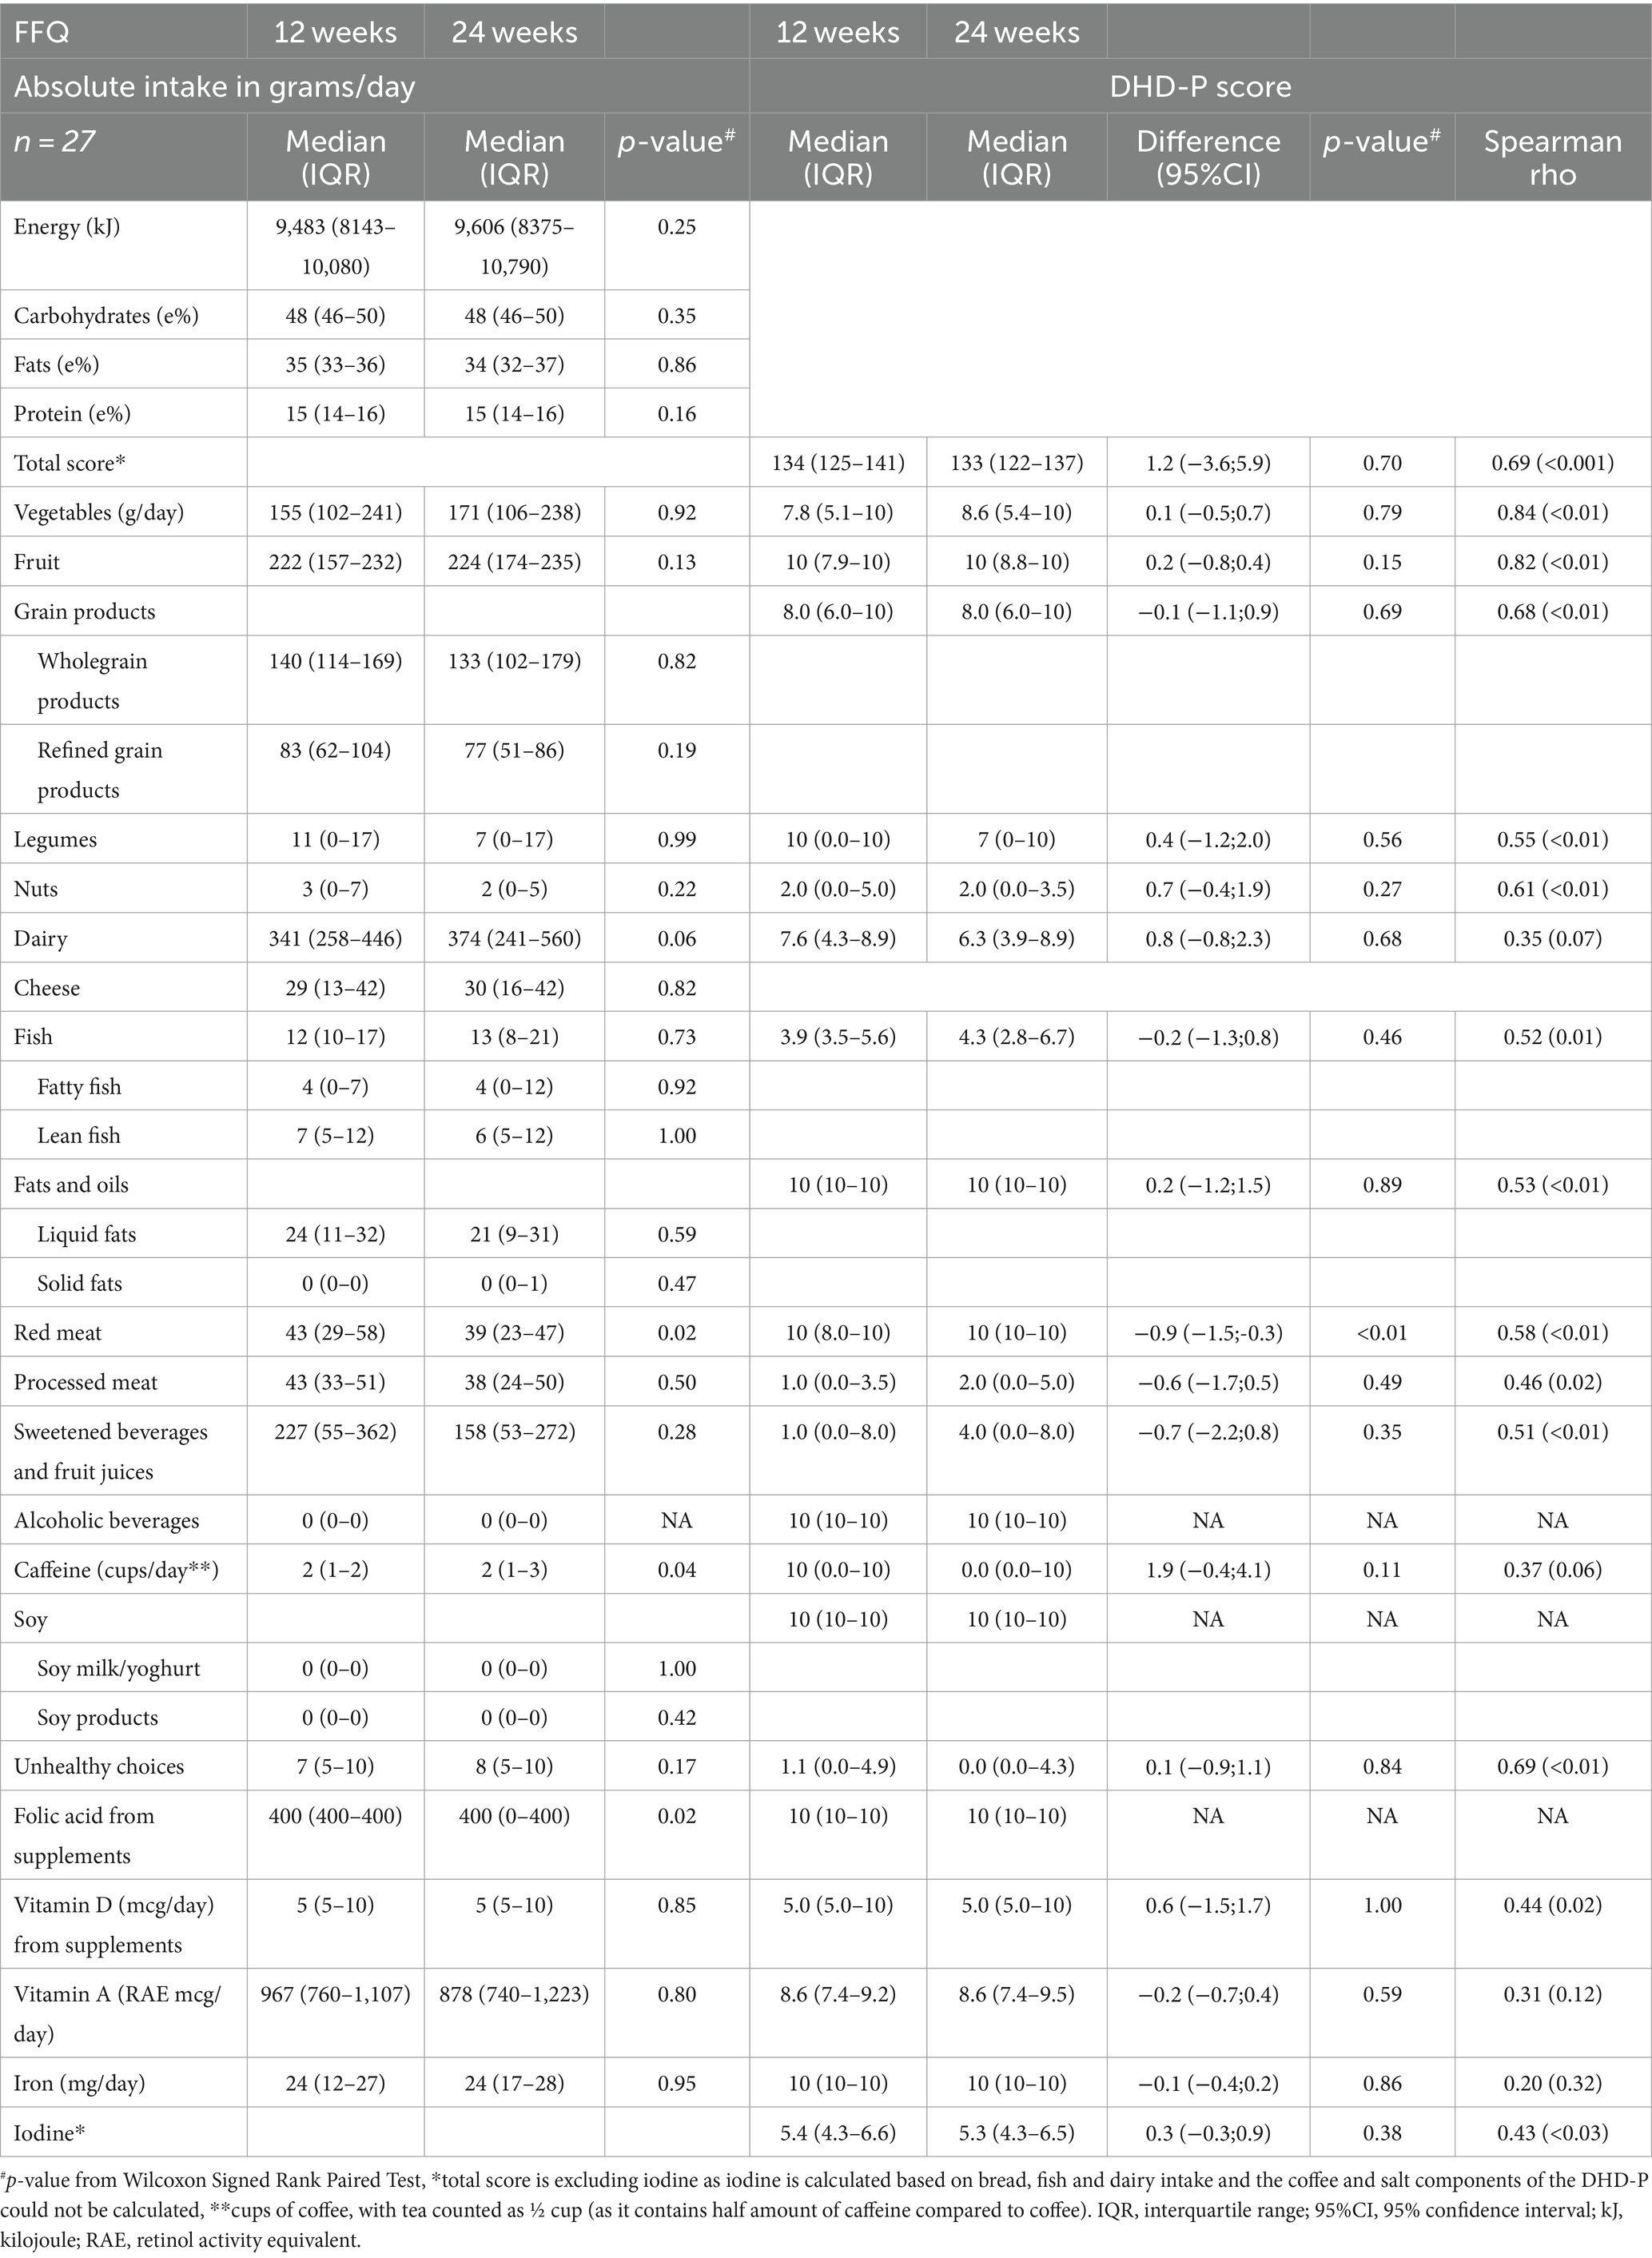
Table 4. Comparing median intake and DHD-P scores based on FFQ data at 12 and 24 weeks gestation.
Consistent with the FFQ data, recall data showed a non-significant increase in energy intake over time (Table 5), with similar values for folic acid supplementation. In contrast to the FFQ data, recall data indicated lower refined grains [53 (IQR: 15–79) vs. 94 (IQR: 69–127)] and processed meat consumption at 24 weeks compared to 12 weeks gestation [24 (IQR: 0–49) and 41 (IQR: 14–70) g/d]. No significant differences in intakes were observed for any of the other DHD-P components. Accordingly, DHD-P scores did not substantially differ between 12 and 24 weeks, except for a higher score for grains at 24 weeks compared to 12 weeks [diff = 1.3 (95%CI: 1.0–2.5)]. The correlation coefficient for the total diet quality score between 12 and 24 weeks of pregnancy was 0.22 with correlation of individual components ranging between 0.02 for red meat and 0.69 for caffeine.
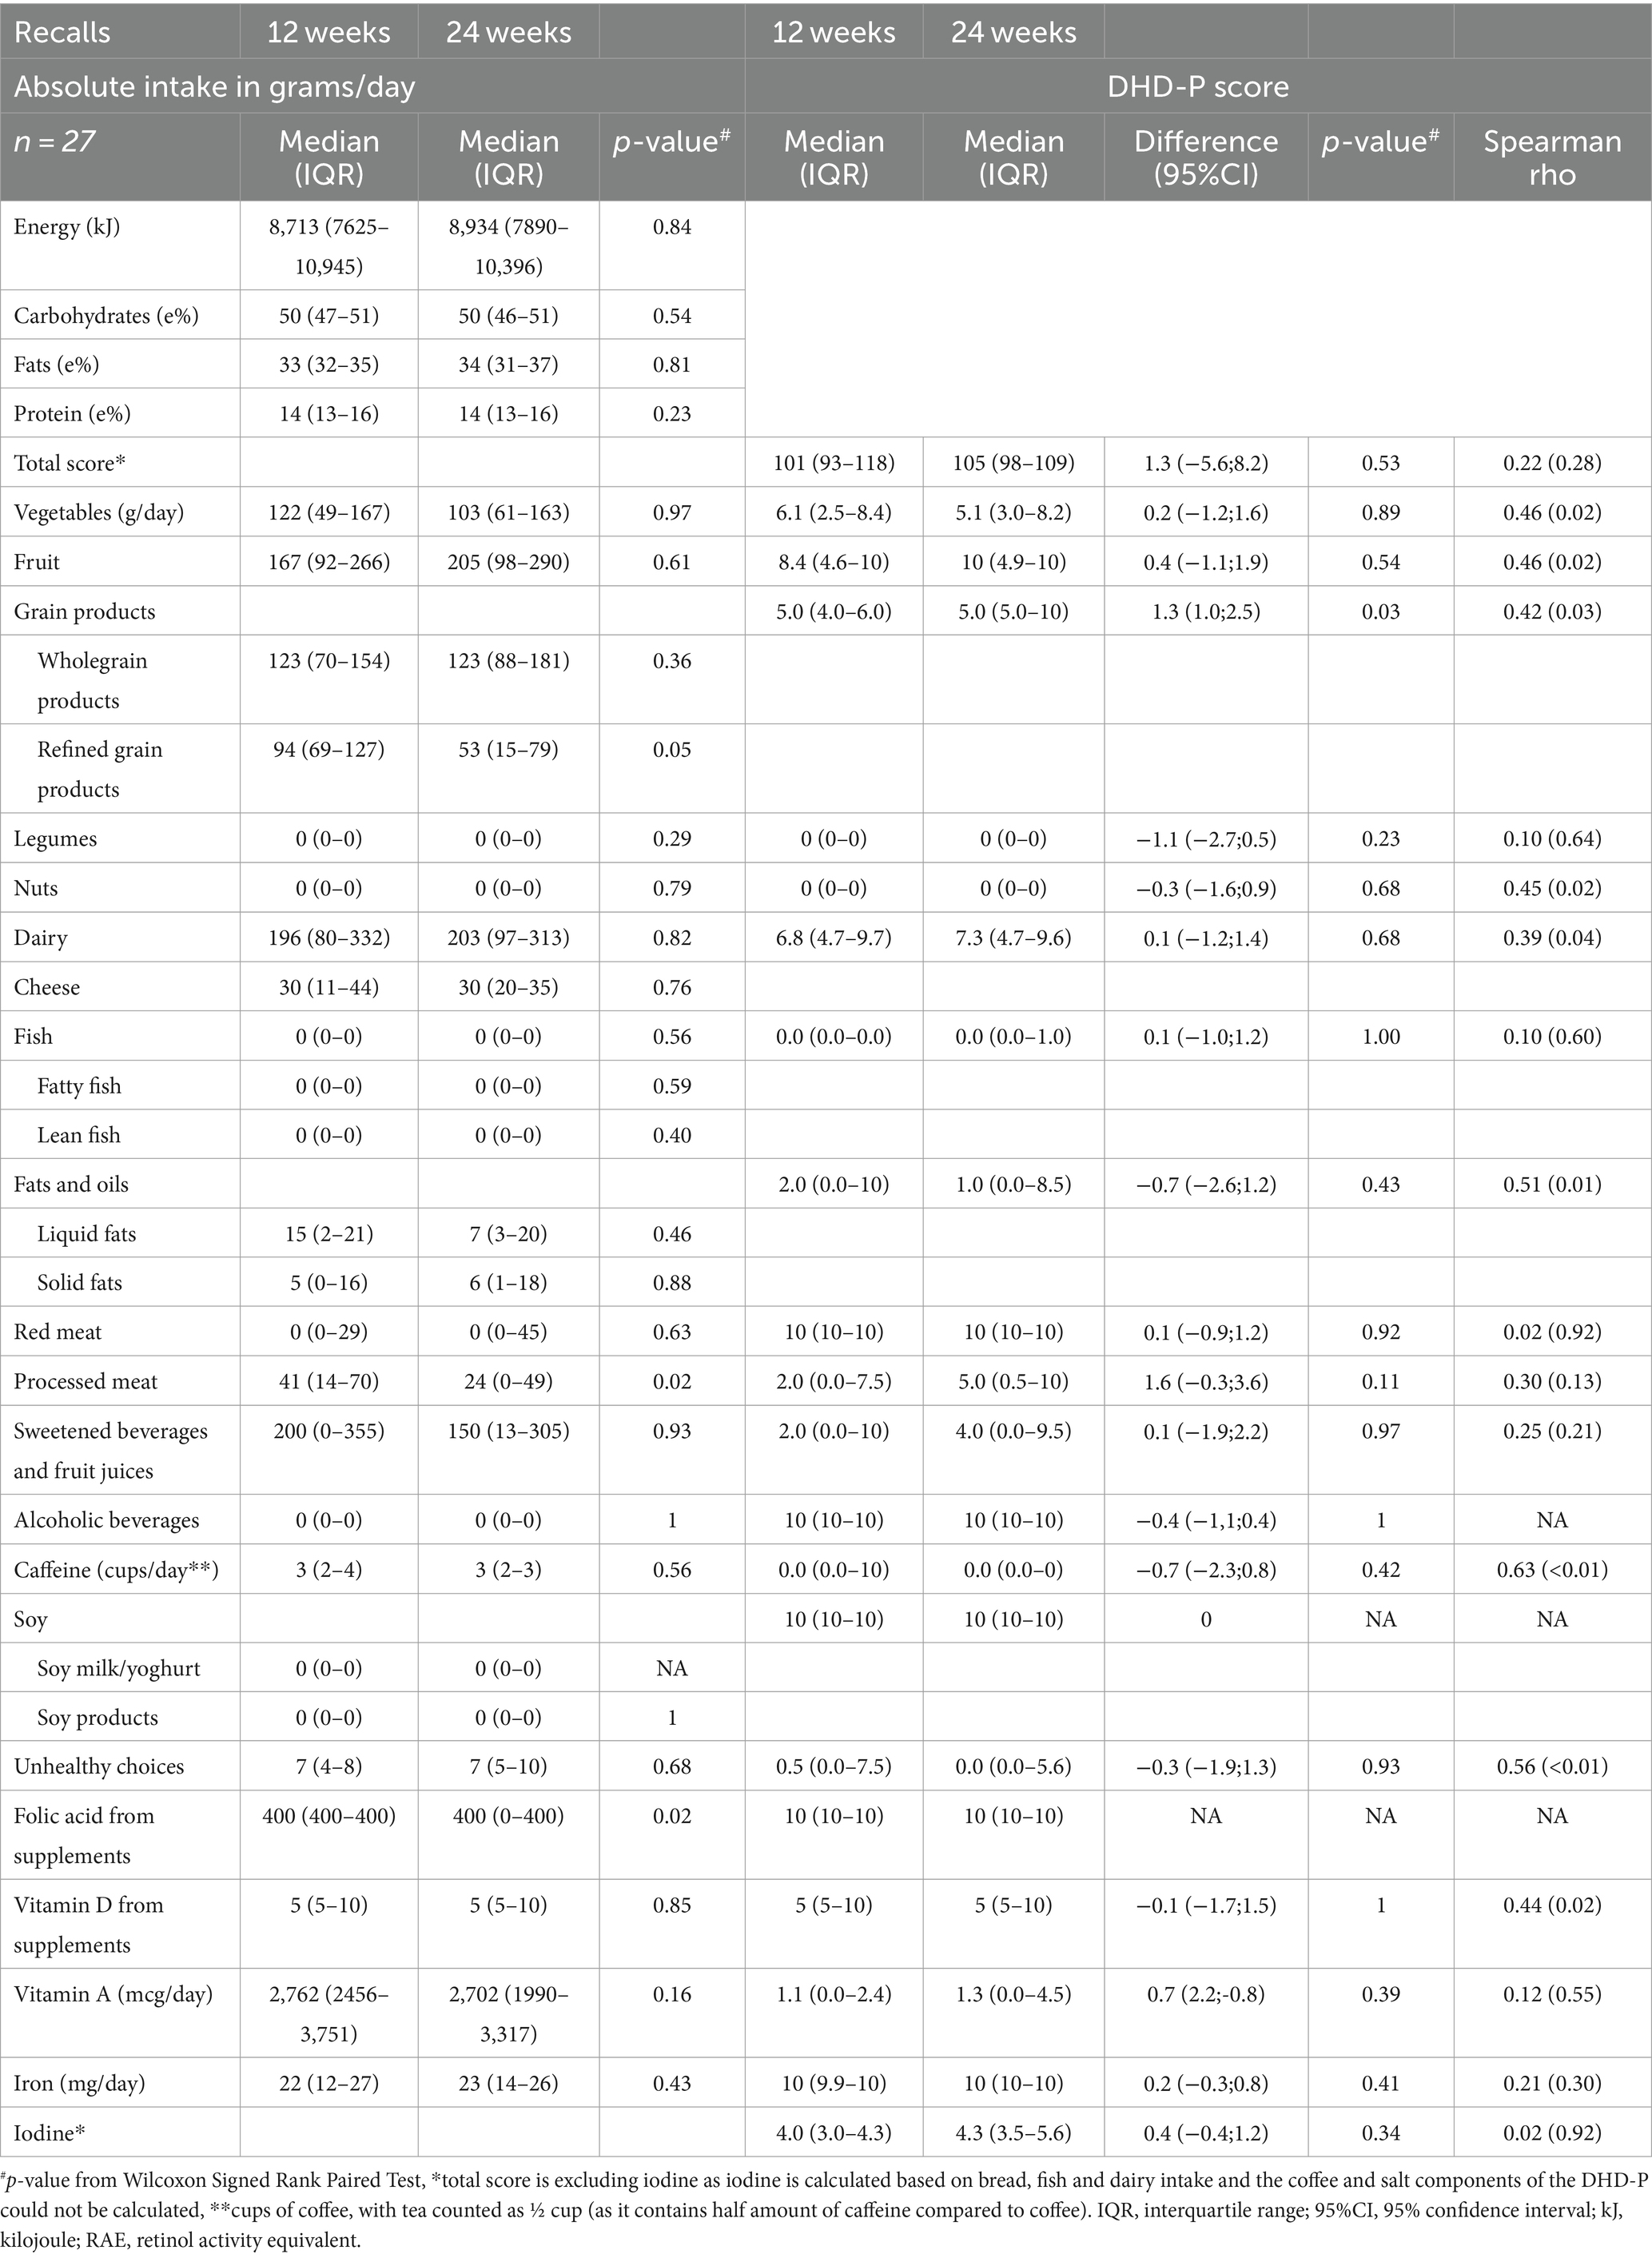
Table 5. Comparing median intake and DHD-P scores based on 24hR data at 12 and 24 weeks gestation.
Discussion
In this study, we developed the DHD-P index using the recommendations from the Dutch Health Council for pregnant women and evaluated it using GLIMP-II study data. Despite significant differences for several absolute intake estimates and individual component scores when comparing FFQ and 24hR data at 24 weeks gestation, de-attenuated correlation coefficients were moderate or good for almost all components. Moreover, FFQ and recall data both showed comparable dietary intake data for daily consumed food groups at 12 and 24 weeks, suggesting minimal changes during pregnancy. Further, this study demonstrated moderate or good correlations over time of the adjusted DHD score based on FFQ data compared to 24hRs data among Dutch pregnant women indicating good reproducibility.
Various diet quality indexes for pregnant women have been developed worldwide, using different dietary guidelines and scoring methods. For instance, the Diet Quality Index for Pregnancy (DQIP) including eight components was developed by Bodnar and Siega-Riz (10) based on FFQ data of 2,063 women in the second trimester while applying the US dietary guidelines. In contrast to the DHD-P’s different scoring for folic acid supplementation based on the specific stage of pregnancy, the DQIP maintained consistent scoring across trimesters. In terms of the number of food groups assessed in previously developed indices, our index markedly differs from a Brazilian diet quality score, developed by Crivellenti et al. (11). Whereas our index consists of 14 food groups and eight nutrient components, the Brazilian index is composed of five nutrient components, three food group components and one moderator component reflecting the percentage of total energy from ultra-processed foods (11). Kennedy et al. (8) developed an index based on EFSA, WHO and USA Institute of Medicine guidelines, which scored the adherence to the guidelines for each nutrient or food group with 1 point, weighting all food groups and nutrients the same. Further, the Healthy Food Intake Index containing 11 components based on the Nordic Nutrition Recommendations was scored ranging between 0 and 1 or 0 and 2 depending on the relevance for overall diet quality (9). Conversely, the DHD-P applies an equal weighting approach for all its components due to the challenges in assigning weights to components based on health effects. Variations in indices can be explained by variations in the underpinning recommendations, divergence in the employed dietary assessment methodologies during index development, and the prioritization choices made by developers (e.g., specific emphasis on certain food groups, nutrients, or health outcomes).
In this study, we observed median diet quality scores of 133 and 134 out of 190 based on FFQ data at 12 and 24 weeks gestation. In comparison, Nguyen et al. (38) observed a mean diet quality score of 7.6 out of 15 among 4,824 Dutch pregnant women who completed an FFQ between 2002 and 2006. They used a scoring system based on the 2015 Dutch dietary guidelines for adults, incorporating folic acid supplements, and assigning a maximum score for alcohol abstinence (38). Thus, scores in our study were higher than the scores observed by Nguyen et al. (38), which may potentially be explained by a higher percentage of high educated women in the GLIMP-II study (73% versus 47%). Further, we observed a good correlation between the diet quality index calculated with the FFQ and 24hRs, which is highly comparable to the results of the evaluation of the original DHD-index among 885 adults (5). Most component specific coefficients between the two methods were also comparable between our study and the original DHD-evaluation, including lower correlation coefficients for episodically consumed foods. Considering the absolute intake levels, the FFQ data of our study showed higher intake levels for 7 out of 28 nutrients or food groups compared to the average of the two 24hRs, particularly for some episodically consumed foods such as fish and legumes. A meta-analysis including 130 studies evaluating validity of the FFQ for epidemiological studies among adults (39), also showed higher intake levels for 17 out of 32 nutrients for FFQ data vs. recall data. Moreover, a validation study on the FFQ used in this study observed higher reported levels of 8 out of 30 nutrients compared to recall data (17). In light of the inherent attributes of the two methodologies, the observed outcome in our study is not unexpected. The FFQ is anticipated to more effectively capture habitual food intake when contrasted with two 24-h dietary recalls. As a result, the FFQ is expected to provide a more accurate estimation of the habitual intake pertaining to episodically consumed foods (5). Given that the total diet quality score and most individual component scores exhibited moderate or good correlation when comparing FFQ and 24hR data, we consider the DHD-P index a useful tool to compare scores between pregnant women and for self-monitoring (35).
When comparing diet quality between 12 and 24 weeks gestation, we observed limited variation in absolute intake levels and diet quality component scores of commonly consumed food groups for both FFQ and 24hR data indicating minimal dietary changes during pregnancy. Particularly if differences existed these are expected to become evident using 24hR data as these provide more detailed dietary information compared to FFQs. It can be questioned whether diet remains completely similar during pregnancy trimesters as, e.g., women may be more motivated to eat healthy at the beginning of pregnancy (40, 41), but many other factors, such as physical complaints, could play a role in dietary habits during pregnancy as well (41). Although only a limited number of studies explored dietary intake at different stages during pregnancy, a study among about 2,500 UK pregnant women also observed minimal alterations in dietary patterns (42). In line, no changes in overall diet quality were observed over pregnancy trimesters among 79 Canadian pregnant women. However, in terms of individual components, intakes of fruit and vegetables decreased and ‘milk and alternatives’ increased during pregnancy among the Canadian women (41). Based on the FFQ data of our study, we observed a similar trend for dairy intake. In terms of reproducibility, FFQ data showed moderate to good correlations, while those based on 24hRs were categorized as low to moderate according to Lombard’s criteria (35, 43). It is essential to emphasize that correlation coefficients signify the relatedness between measurements over time, not the level of agreement (44). Consequently, this suggests that scores over time based on FFQ are more closely intertwined compared to those based on 24hR data. This difference may again be attributed to substantial day-to-day variation, particularly for episodically consumed foods like fish, legumes, and associated nutrients (e.g., iodine) when relying on only two 24hRs.
So far, a few diet quality scores exist for Dutch pregnant women, but these were not evaluated and are not based on the recent guidelines. We used data from the GLIMP-II study including intake levels based on both FFQ and two 24hRs at two time points during pregnancy to exploratively evaluate the DHD-P index. While correlation coefficients can assess reproducibility and indicate the validity of long-term dietary intake measures, it is crucial to recognize that high reproducibility does not necessarily ensure high validity (43). Limitations of this study are its limited sample size, and the inclusion of women with a predisposition for gestational diabetes, reducing external validity to the generally pregnant population in the Netherlands. Additionally, both 24hRs and FFQ have its limitations in assessing habitual dietary intake as they both rely on memory and a food composition table to calculate nutrient values. Furthermore, the 24hRs used in GLIMP-II were web-based, which likely resulted in lower reporting rates as no additional questions could be asked in comparison to when performed during a phone call or meeting in person. Additionally, the FFQ used in this study was not designed to inquire about nutrients or food groups specifically of interest during pregnancy, such as vitamin A consumption via liver products. Distinguishing between types of products (e.g., low or high fat milk) in FFQs depends on question specificity. Despite attempts to score similar food products in both 24hR and FFQ data, differences may have occurred from the FFQ’s broader product inquiries compared to the 24hRs. Another limitation of the current evaluation study is the inability to calculate the intake of all intended components, such as filtered coffee and salt intake. To note, the Eetscore tool, developed by researchers from Wageningen University, can be used as a diet screener to collect all this necessary dietary data to calculate DHD-15 scores (45). Therefore, using the updated Eetscore tool in combination with the DHD-P potentially provides the optimal assessment method for diet quality among Dutch pregnant women.
Conclusion
This study presents the development of the DHD-P index based on Dutch dietary guidelines for pregnant women issued by the Dutch Health Council in 2021. Additionally, we performed an explorative evaluation on the DHD-P to provide insight in the index’s usability and reproducibility. The DHD-P appears to be an appropriate index to assess dietary quality among pregnant women, and could serve as a foundation to provide dietary feedback toward healthier food choices. Further evaluations using more complete dietary data specifically relevant in respect to the dietary guidelines for pregnant women and the DHD-P, such as salt intake and type of coffee consumption, are recommended.
Data availability statement
The data analyzed in this study is subject to the following licenses/restrictions: the raw data supporting the conclusions of this article will be made available by the authors, upon reasonable request. Requests to access these datasets should be directed to ZWxza2UuYnJvdXdlci1icm9sc21hQHd1ci5ubA==.
Ethics statement
The studies involving humans were approved by Medical Ethics Committee of Wageningen University & Research. The studies were conducted in accordance with the local legislation and institutional requirements. The participants provided their written informed consent to participate in this study.
Author contributions
JF: Conceptualization, Formal analysis, Investigation, Methodology, Visualization, Writing – original draft, Writing – review & editing. EF: Data curation, Funding acquisition, Resources, Supervision, Writing – review & editing. EB-B: Conceptualization, Data curation, Formal analysis, Funding acquisition, Investigation, Methodology, Resources, Supervision, Writing – original draft, Writing – review & editing.
Funding
The author(s) declare that financial support was received for the research, authorship, and/or publication of this article. The research described in this paper was supported by a grant from the Regiodeal Foodvalley (162135). Regiodeal Foodvalley had no role is the design, analysis or writing of this article.
Acknowledgments
We thank Hanne de Jong for her advisory role in the development of the DHD-P and for the work she did in the adaptation of the Eetscore tool. Further, Jeanne de Vries deserves gratitude for her work in data collection of the GLIMP-II study.
Conflict of interest
The authors declare that the research was conducted in the absence of any commercial or financial relationships that could be construed as a potential conflict of interest.
Publisher’s note
All claims expressed in this article are solely those of the authors and do not necessarily represent those of their affiliated organizations, or those of the publisher, the editors and the reviewers. Any product that may be evaluated in this article, or claim that may be made by its manufacturer, is not guaranteed or endorsed by the publisher.
References
1. Borge, TC, Aase, H, Brantsæter, AL, and Biele, G. The importance of maternal diet quality during pregnancy on cognitive and behavioural outcomes in children: a systematic review and meta-analysis. BMJ Open. (2017) 7:1–14. doi: 10.1136/bmjopen-2017-016777
2. Ancira-Moreno, M, O’Neill, MS, Rivera-Dommarco, JÁ, Batis, C, Ramírez, SR, Sánchez, BN, et al. Dietary patterns and diet quality during pregnancy and low birthweight: the PRINCESA cohort. Matern Child Nutr. (2020) 16:e12972–11. doi: 10.1111/mcn.12972
3. Lazarou, C, and Newby, PK. Use of dietary indexes among children in developed countries. Adv Nutr. (2011) 2:295–303. doi: 10.3945/an.110.000166
4. Wang, XY, Zhao, P, Frolova, AI, Odibo, AO, Carter, EB, Kelly, JC, et al. Diet quality in pregnancy and the risk of fetal growth restriction. Am J Obstet Gynecol. (2022) 226:S21–2. doi: 10.1016/j.ajog.2021.11.081
5. Looman, M, Feskens, EJM, de Rijk, M, Meijboom, S, Biesbroek, S, Temme, EHM, et al. Development and evaluation of the Dutch healthy diet index 2015. Public Health Nutr. (2017) 20:2289–99. doi: 10.1017/S136898001700091X
6. Scarry, A, Rice, J, O’Connor, EM, and Tierney, AC. Usage of Mobile applications or Mobile health technology to improve diet quality in adults. Nutrients. (2022) 14:2437. doi: 10.3390/nu14122437
7. Fransen, HP, and Ocké, MC. Indices of diet quality. Curr Opin Clin Nutr Metab Care. (2008) 11:559–65. doi: 10.1097/MCO.0b013e32830a49db
8. Kennedy, RAK, Reynolds, CME, O’Malley, EG, and Turner, MJ. Assessing maternal dietary quality in early pregnancy in the programming of intrauterine fetal growth. Acta Obstet Gynecol Scand. (2020) 99:510–7. doi: 10.1111/aogs.13768
9. Valkama, AJ, Meinilä, JM, Koivusalo, SB, Lindström, J, Rönö, K, Stach-Lempinen, B, et al. Diet quality as assessed by the healthy food intake index and relationship with serum lipoprotein particles and serum fatty acids in pregnant women at increased risk for gestational diabetes. Br J Nutr. (2018) 120:914–24. doi: 10.1017/S0007114518002404
10. Bodnar, LM, and Siega-Riz, AM. A diet quality index for pregnancy detects variation in diet and differences by sociodemographic factors. Public Health Nutr. (2002) 5:801–9. doi: 10.1079/phn2002348
11. Crivellenti, LC, Zuccolotto, DCC, and Sartorelli, DS. Development of a diet quality index adapted for pregnant women. Rev Saude Publica. (2018) 52:59–11. doi: 10.11606/S1518-8787.2018052000184
12. Kromhout, D, Spaaij, CJK, de Goede, J, and Weggemans, RM. The 2015 Dutch food-based dietary guidelines. Eur J Clin Nutr. (2016) 70:869–78. doi: 10.1038/ejcn.2016.52
13. Health Council of the Netherlands. Dietary Recommendations for Pregnant Women. (2021). Available at: https://www.gezondheidsraad.nl/documenten/adviezen/2021/06/22/voedingsaanbevelingen-voor-zwangere-vrouwen (Accessed February 16, 2024).
14. Looman, M, Geelen, A, Samlal, RAK, Heijligenberg, R, Klein Gunnewiek, J, Balvers, M, et al. Changes in micronutrient intake and status, diet quality and glucose tolerance from preconception to the second trimester of pregnancy. Nutrients. (2019) 11:460. doi: 10.3390/nu11020460
15. Looman, M, van den Berg, C, Geelen, A, Samlal, R, Heijligenberg, R, Klein Gunnewiek, J, et al. Supplement use and dietary sources of folate, vitamin D, and n-3 fatty acids during preconception: the GLIMP2 study. Nutrients. (2018) 10:962. doi: 10.3390/nu10080962
16. Siebelink, E, Geelen, A, and De Vries, JHM. Self-reported energy intake by FFQ compared with actual energy intake to maintain body weight in 516 adults. Br J Nutr. (2011) 106:274–81. doi: 10.1017/S0007114511000067
17. Streppel, MT, de Vries, JHM, Meijboom, S, Beekman, M, de Craen, AJM, Slagboom, PE, et al. Relative validity of the food frequency questionnaire used to assess dietary intake in the Leiden longevity study. Nutr J. (2013) 12:75. doi: 10.1186/1475-2891-12-75
18. RIVM. NEVO-Online. (2021). Available at: https://www.rivm.nl/en/dutch-food-composition-database/nevo-online (Accessed February 16, 2024).
19. National Institute for Public Health. NEVO-table. Dutch food composition table 2011/Version 3. Bilthoven: RIVM (2011).
20. Meijboom, S, van Houts-Streppel, MT, Perenboom, C, Siebelink, E, van de Wiel, AM, Geelen, A, et al. Evaluation of dietary intake assessed by the Dutch self-administered web-based dietary 24-h recall tool (Compl-eatTM) against interviewer-administered telephone-based 24-h recalls. J Nutr Sci. (2017) 6:e49. doi: 10.1017/jns.2017.45
21. Dutch Health Council. Dietary guidelines 2015–2020. J Nutr Educ Behav. (2016) 48:518. doi: 10.1016/j.jneb.2016.04.389
22. Dutch Health Council. Voedingsnormen Voor Vitamines En Mineralen Voor Zwangere Vrouwen. (2021). Available at: https://www.gezondheidsraad.nl/documenten/adviezen/2021/06/22/voedingsaanbevelingen-voor-zwangere-vrouwen (Accessed February 16, 2024).
23. RIVM. Portion online - version 2020/1.4. Bilthoven Published (2020). Available at: https://portie-online.rivm.nl/ (Accessed March 29, 2024).
24. Netherlands Nutrition Centre. Richtlijnen Schijf van Vijf. Richtlijnen Schijf van Vijf. (2020). 1–134. Available at: https://www.voedingscentrum.nl/Assets/Uploads/voedingscentrum/Documents/Professionals/Schijf%20van%20Vijf/Richtlijnen%20Schijf%20van%20Vijf.pdf (Accessed February 16, 2024).
25. Stafleu, A, Postma-Smeets, A, Vossen Van Der, W, and Peters, S. Voeding en Zwangerschap. The Hague: Dutch Nutrition Centre (2015).
26. Qian, J, Chen, Q, Ward, SM, Duan, E, and Zhang, Y. Impacts of caffeine during pregnancy. Trends Endocrinol Metab. (2020) 31:218–27. doi: 10.1016/j.tem.2019.11.004
27. Bailey, BA, and Sokol, RJ. Pregnancy and alcohol use: evidence and recommendations for prenatal care. Clin Obstet Gynecol. (2008) 51:436–44. doi: 10.1097/GRF.0b013e31816fea3d
28. Turck, D, Bohn, T, Castenmiller, J, de Henauw, S, Hirsch-Ernst, KI, Knutsen, HK, et al. Scientific opinion on the tolerable upper intake level for folate. EFSA J. (2023) 21:e08353. doi: 10.2903/j.efsa.2023.8353
29. Health Council of the Netherlands. Evaluation of the dietary reference values for vitamin D. The Hague: Health Council of the Netherlands. (2012).
30. Turck, D, Bohn, T, Castenmiller, J, De Henauw, S, Hirsch‐Ernst, KI, Knutsen, HK, et al. Scientific opinion on the tolerable upper intake level for vitamin D, including the derivation of a conversion factor for calcidiol monohydrate. EFSA J. (2023) 21:6–9. doi: 10.2903/j.efsa.2023.8145
31. Voedingscentrum. Aanbevelingen voor vitamines, mineralen en spoorelementen/Recommendations for vitamins, minerals and trace elements. (2014). Available at: https://www.voedingscentrum.nl/assets/uploads/voedingscentrum/documents/professionals/pers/factsheets/factsheet%20aanbevelingen%20voor%20vitamines,%20mineralen%20en%20spoorelementen.pdf (Accessed February 16, 2024).
32. Dutch Health Council. Health effects of nutrient intake from supplements during pregnancy. (2021). Available at: https://www.gezondheidsraad.nl/documenten/adviezen/2021/06/22/voedingsaanbevelingen-voor-zwangere-vrouwen (Accessed February 16, 2024).
33. Voedingscentrum. Hoe krijg ik voldoende voedingsstoffen binnen als ik zwanger ben? (2021). Available at: https://www.voedingscentrum.nl/nl/zwanger-en-kind/zwanger/zwanger-en-voedingsstoffen.aspx (Accessed June 22, 2021).
34. Scholtens, S, Smidt, N, Swertz, MA, Bakker, SJL, Dotinga, A, Vonk, JM, et al. Cohort profile: LifeLines, a three-generation cohort study and biobank. Int J Epidemiol. (2015) 44:1172–80. doi: 10.1093/ije/dyu229
35. Lombard, MJ, Steyn, NP, Charlton, KE, and Senekal, M. Application and interpretation of multiple statistical tests to evaluate validity of dietary intake assessment methods. Nutr J. (2015) 14:40. doi: 10.1186/s12937-015-0027-y
36. Rosner, B, and Willett, WC. Re: “interval estimates for correlation coefficients corrected for within-person variation: implications for study design and hypothesis testing”. Am J Epidemiol. (1988) 127:377–86. doi: 10.1093/oxfordjournals.aje.a115537
37. Frazier, AL, Wilett, WC, and Colditz, GA. Reproducibility of recall of adolescent diet: nurses’ health study (United States). Cancer Causes Control. (1995) 6:499–506. doi: 10.1007/BF00054157
38. Nguyen, AN, de Barse, LM, Tiemeier, H, Jaddoe, VWV, Franco, OH, Jansen, PW, et al. Maternal history of eating disorders: diet quality during pregnancy and infant feeding. Appetite. (2017) 109:108–14. doi: 10.1016/j.appet.2016.11.030
39. Cui, Q, Xia, Y, Wu, Q, Chang, Q, Niu, K, and Zhao, Y. Validity of the food frequency questionnaire for adults in nutritional epidemiological studies: a systematic review and meta-analysis. Crit Rev Food Sci Nutr. (2021) 63:1670–88. doi: 10.1080/10408398.2021.1966737
40. Wennberg, AL, Lundqvist, A, Högberg, U, Sandström, H, and Hamberg, K. Women’s experiences of dietary advice and dietary changes during pregnancy. Midwifery. (2013) 29:1027–34. doi: 10.1016/j.midw.2012.09.005
41. Savard, C, Lemieux, S, Carbonneau, É, Provencher, V, Gagnon, C, Robitaille, J, et al. Trimester-specific assessment of diet quality in a sample of Canadian pregnant women. Int J Environ Res Public Health. (2019) 16:311. doi: 10.3390/ijerph16030311
42. Crozier, SR, Robinson, SM, Godfrey, KM, Cooper, C, and Inskip, HM. Women’s dietary patterns change little from before to during pregnancy. J Nutr. (2009) 139:1956–63. doi: 10.3945/jn.109.109579
43. Willett, W. Reproducibility and validity of food-frequency questionnaires comparison of means with data from other sources. Oxford: Oxford University Press. (2010).
44. Tabacchi, G, Amodio, E, Di Pasquale, M, Bianco, A, Jemni, M, and Mammina, C. Validation and reproducibility of dietary assessment methods in adolescents: a systematic literature review. Public Health Nutr. (2013) 17:2700–14. doi: 10.1017/S1368980013003157
Keywords: diet quality, pregnancy, evaluation, maternal diet, diet index
Citation: Faessen JPM, Feskens EJM and Brouwer-Brolsma EM (2024) Development and short evaluation of the Dutch healthy diet index for pregnant women; DHD-P. Front. Nutr. 11:1386888. doi: 10.3389/fnut.2024.1386888
Edited by:
Maria de Fatima Domingues, Khalifa University, United Arab EmiratesReviewed by:
Maryam Amini, National Nutrition and Food Technology Research Institute, IranOctavian Vasiliu, Dr. Carol Davila University Emergency Military Central Hospital, Romania
Copyright © 2024 Faessen, Feskens and Brouwer-Brolsma. This is an open-access article distributed under the terms of the Creative Commons Attribution License (CC BY). The use, distribution or reproduction in other forums is permitted, provided the original author(s) and the copyright owner(s) are credited and that the original publication in this journal is cited, in accordance with accepted academic practice. No use, distribution or reproduction is permitted which does not comply with these terms.
*Correspondence: Janine P. M. Faessen, amFuaW5lLmZhZXNzZW5Ad3VyLm5s