Abstract
Background:
Sarcopenia is associated with oxidative stress. The Oxidative Balance Score (OBS) is commonly used to assess dietary and lifestyle exposure to oxidative stress. However, few studies in the literature have assessed the correlation between sarcopenia and OBS.
Aim:
This study aimed to assess the association between OBS and sarcopenia among young and middle-aged adults in the United States using data from the National Health and Nutrition Examination Survey (NHANES).
Method:
Weighted logistic regression analysis was used to investigate the association between OBS and sarcopenia based on data from NHANES 2011–2018. Subgroup analyses were performed to observe the consistency of the outcomes, and the stability of the results was tested using sensitivity analyses.
Result:
The final sample included 5,525 young and middle-aged American adults. A higher OBS was associated with a lower risk of sarcopenia. In the fully adjusted model, the second (odds ratio [OR]: 0.62, 95% confidence interval [CI]: 0.41, 0.94; p = 0.023), third (OR: 0.50; 95% CI: 0.34, 0.74; p < 0.001), and highest quartiles (OR: 0.18; 95% CI: 0.11, 0.28; p < 0.001) of the OBS were associated with higher risks of sarcopenia when compared to the lowest quartile. This association was consistent across both dietary and lifestyle OBS scores. Our subgroup analysis revealed no significant differences between the subgroups of variables included in the interaction analysis. Sensitivity analyses revealed similar results.
Conclusion:
Our study showed that higher antioxidant and lower antioxidant exposure may decrease the risk of developing sarcopenia. Higher OBS scores may indicate greater protection against sarcopenia; however, further clinical studies are warranted to confirm these findings.
1 Introduction
Sarcopenia, a disorder related to the progressive loss of muscle mass and function, has adverse effects on falls, functional decline, frailty, and mortality (1). Recently, sarcopenia has been found in the younger population, despite its general association with advanced aging (2, 3). Globally, the number of patients with sarcopenia is expected to increase from 50 to 200 million over the next 40 years (4). Among the population aged < 60 years, the incidence of sarcopenia ranges between 8% and 36% (5). Healthcare costs can be substantially increased due to sarcopenia (6). For sarcopenia patients aged < 65 years, hospitalization costs increase even further than they do for those aged >65 years (7).
Sarcopenia can be classified into two types: primary and secondary. With aging, the aggravation of muscle fiber loss, neurodegeneration, and dysfunctional proteins in the skeletal muscles contribute to primary sarcopenia (8). Several factors can contribute to secondary sarcopenia—including insulin resistance, inactivity, poor nutrition, neuromuscular diseases, and hormonal imbalances (9). The histopathological characteristics of the two types of sarcopenia are similar, such as muscle fiber replacement by adipose tissue, increased fibrosis, oxidative stress, altered muscle metabolism, and neuromuscular junction degeneration (10). Oxidative stress refers to an imbalance between the production of reactive oxygen species (ROS), also known as free radicals, and the antioxidant defense system (11). ROS accumulation in sarcopenia occurs as a result of mitochondrial dysfunction. This accumulation can affect the function of myofibrils, motor neurons, and the sarcoplasmic reticulum—thus hindering muscle regeneration (12, 13). Therefore, a potential therapy for sarcopenia patients is to reduce ROS levels via antioxidant treatment. This treatment can include increasing dietary antioxidant intake, increasing physical activity, avoiding obesity, and avoiding tobacco smoking.
However, a single factor is unlikely to have a significant impact on the overall antioxidant/oxidative system. To evaluate the roles of multiple diets and lifestyles on the overall oxidative/antioxidant system, the Oxidative Balance Score (OBS) has been developed to measure one's general exposure to oxidants and antioxidants (14). Studies have demonstrated that a higher OBS reflects increased protection against a range of diseases—including kidney disease (15), diabetes (16), non-alcoholic fatty liver disease (17), and even depression (18). However, few studies in the literature have reviewed the correlation between sarcopenia and OBS. Therefore, this study aimed to assess the association between OBS and sarcopenia among young and middle-aged adults in the United States, using National Health and Nutrition Examination Survey (NHANES) data, for aiding the development of new preventive interventions for the condition.
2 Materials and methods
2.1 Study population
The NHANES is a cross-sectional survey aimed at assessing the health and nutritional statuses of adults and children in the United States. We included population data from the nationally representative NHANES database from 2011 to 2018. During all four cycles, we collected complete information concerning sarcopenia and OBS in adults aged >20 years. Written informed consent was obtained from each participant on joining the NHANES, and the study was approved by the ethics review board of the National Center for Health Statistics.
The details of our study's inclusion and exclusion criteria are represented in Figure 1. Among 39,156 participants in the four waves, some were excluded if (1) they were < 20 years of age (n = 16,539); (2) they had missing values concerning OBS data (n = 12,409)—including body mass index (BMI) (n = 1,279), cotinine (n = 1,197), alcohol use (n = 4,292), physical examination results (n = 3,874), and dietary data (n = 1,758); (3) they had missing sarcopenia data (n = 4,310); and (4) they had missing data on covariates (n = 382). Finally, 5,525 participants were enrolled in this study (Figure 1).
Figure 1
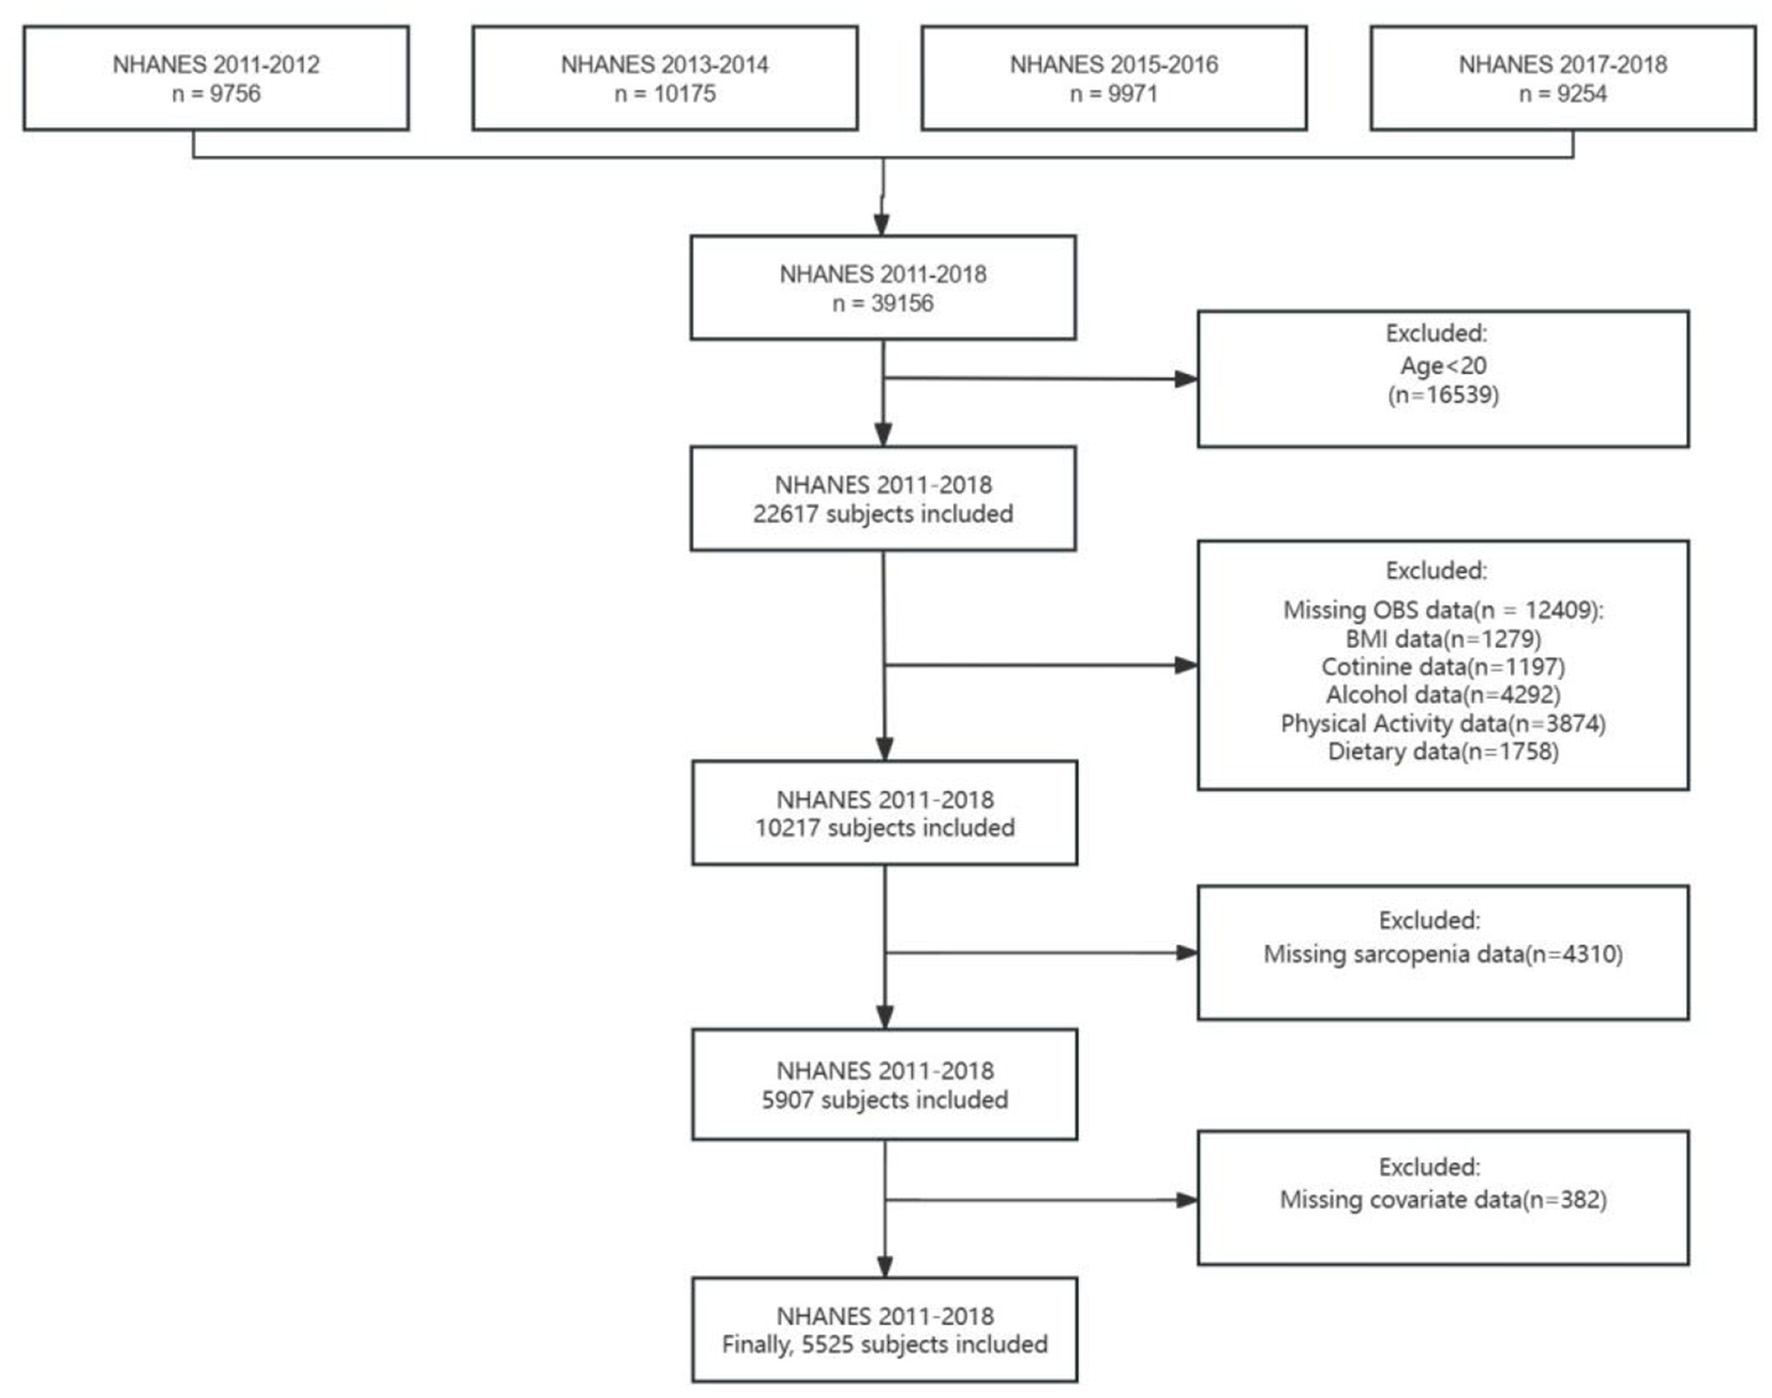
Flow chart of the sample selection from NHANES 2011–2018.
2.2 Assessment of sarcopenia
Sarcopenia was evaluated based on appendicular skeletal muscle mass (ASM). ASM was defined as the total sum of the lean soft tissue mass in the limbs, measured using dual-energy x-ray absorptiometry. A sarcopenia index of < 0.789 for men and < 0.512 for women was considered to indicate sarcopenia according to the recommendations published by the Foundation for National Institutes of Health Osteoarthritis Biomarkers study (FNIH). The sarcopenia index was calculated according to the following equation:
Sarcopenia index = total appendicular skeletal muscle mass/BMI (kg/m2) (19).
Based on the NHANES data, participants aged 8–59 years were eligible for dual-energy x-ray absorptiometry between 2011 and 2018.
2.3 Oxidative balance score
The calculation of the OBS, initially developed by Zhang et al. (14), was composed of 16 dietary and 4 lifestyle scores, including 5 oxidants and 15 antioxidants. An analysis of the mean values of two 24-h dietary review interviews provided dietary intake values for 16 nutrients. BMI, alcohol consumption, smoking status, and physical activity represent the elements of the lifestyle OBS. All of these components, except alcohol consumption, were categorized into sex-specific tertiles for this study. In our analysis of antioxidants, scores of 0, 1, and 2 were assigned from the lowest to the highest tertiles, whereas oxidants were ranked from 2 to 0. For alcohol consumption, we assigned 0 points to men who consumed >30 g/day and women who consumed >15 g/day; 1 point to men who consumed ≤ 30 g/day and women who consumed ≤ 15 g/day; and 2 points to non-drinkers. A higher total OBS score (i.e., the sum of all of the component scores) was considered to indicate a favorable oxidative balance. Supplementary Table 1 lists the classifications and assigned scores for each OBS factor.
2.4 Assessment of covariates
Our covariates for this study included demographic variables, dietary factors, and comorbidities. Demographic variables comprised sex, age group (young adults, 20–39 years; middle-aged adults, 40–59 years), ethnicity, educational level, and family income level (measured as family income to poverty [PIR]—with low family income, PIR ≤ 1.3; moderate family income, 1.3 < PIR < 3.5; and high family income, PIR ≥3.5). Total energy intake and chronic comorbidities—including diabetes, hypertension, and cardiovascular disease (CVD, including coronary heart disease, congestive heart failure, and angina)—were also assessed. Hypertension was determined by referring to a self-reported diagnosis by a doctor, use of antihypertensive medication, or high blood pressure (20). Diabetes was recorded if it had been diagnosed by a physician, if a participant was taking antidiabetic medication, had abnormal blood glucose, or if it was indicated in the glucose tolerance test results (21).
2.5 Statistical analysis
In light of the sample weighting selection guidelines of the NHANES, our study used the sampling weights recorded on dietary 2-day sample weight (WTDR2D) records. These records were divided by 4 since the survey had four consecutive cycles to ensure that our results were representative of the national population. Continuous variables are represented as weighted means (standard errors), and categorical ones are represented as counts (weighted percentages). To test the characteristic differences of variables in the four OBS groups, the Rao–Scott chi-squared and Kruskal–Wallis tests were used for categorical and non-normally distributed continuous variables, respectively.
Weighted logistic regression analysis was used to evaluate the association between OBS and sarcopenia. Model 1 represented the unadjusted analysis, whereas Model 2 adjusted for age, sex, ethnicity, educational level, and family income level. Model 3 increased the adjustments for energy intake, and complications such as hypertension, CVD, and diabetes were adjusted based on Model 2. We then transformed continuous OBS scores into quartile-categorical ones, exploring trend tests (P for trend). A subgroup analysis was also performed to observe the consistency of outcomes based on baseline variables. The stability of the results was tested using a sensitivity analysis. To investigate possible non-linear connections between OBS and sarcopenia among individuals, a restricted cubic spline (RCS) analysis was performed. All analyses were performed using various packages included in R Studio version 4.3.2. Statistical significance was set at a p < 0.05.
3 Results
3.1 Baseline characteristics
Table 1 describes the baseline characteristics of the participants based on OBS quartiles. A total of 5,525 participants were included in our study, consisting of 2,945 men (weighted 53%) and 2,580 women (weighted 47%), most of whom were non-Hispanic Caucasian in ethnicity (65%). The weighted prevalence of sarcopenia was 5.8% across the overall US population. Compared to the lowest OBS quartile, the participants in the highest one were more likely to be non-Hispanic Caucasian and less likely to have diabetes, higher educational levels, higher family incomes, and higher total energy intakes. However, across the quartiles, there were no significant differences in terms of sex, age, hypertension, or CVD.
Table 1
| Characteristic | Overall, N = 5,525 (100%) | Q1, N = 1,529 (25%) | Q2, N = 1,372 (24%) | Q3, N = 1,431 (27%) | Q4, N = 1,193 (23%) | P-value |
|---|---|---|---|---|---|---|
| Age | 0.4 | |||||
| Young adults | 2,762 (50%) | 783 (51%) | 680 (50%) | 702 (47%) | 597 (51%) | |
| Middle adults | 2,763 (50%) | 746 (49%) | 692 (50%) | 729 (53%) | 596 (49%) | |
| Sex | 0.4 | |||||
| Male | 2,945 (53%) | 805 (52%) | 745 (55%) | 753 (54%) | 642 (50%) | |
| Female | 2,580 (47%) | 724 (48%) | 627 (45%) | 678 (46%) | 551 (50%) | |
| Race | < 0.001 | |||||
| Mexican American | 734 (9.6%) | 158 (9.0%) | 180 (9.4%) | 197 (9.4%) | 199 (10%) | |
| Other Hispanic | 492 (6.3%) | 130 (6.3%) | 112 (6.2%) | 127 (5.5%) | 123 (7.2%) | |
| Non-Hispanic white | 2,252 (65%) | 602 (62%) | 558 (64%) | 613 (68%) | 479 (67%) | |
| Non-Hispanic Black | 1,106 (9.6%) | 421 (15%) | 287 (10%) | 227 (7.3%) | 171 (5.7%) | |
| Other/multiracial | 941 (9.3%) | 218 (8.1%) | 235 (10%) | 267 (9.5%) | 221 (9.8%) | |
| Education level | < 0.001 | |||||
| > 9th Grade | 172 (1.7%) | 49 (1.7%) | 45 (1.9%) | 34 (1.1%) | 44 (2.2%) | |
| 9–11th Grade | 572 (7.3%) | 208 (11%) | 144 (7.9%) | 121 (5.6%) | 99 (4.9%) | |
| High school Grad/GED | 1,182 (21%) | 411 (28%) | 275 (22%) | 295 (20%) | 201 (12%) | |
| Some college or AA degree | 1,894 (34%) | 581 (40%) | 490 (34%) | 455 (30%) | 368 (34%) | |
| College graduate or above | 1,705 (36%) | 280 (20%) | 418 (33%) | 526 (43%) | 481 (47%) | |
| Poverty | < 0.001 | |||||
| Low family income | 1,584 (21%) | 542 (29%) | 394 (21%) | 360 (17%) | 288 (16%) | |
| Middle family income | 1,996 (33%) | 581 (34%) | 498 (34%) | 508 (35%) | 409 (28%) | |
| High family income | 1,945 (46%) | 406 (36%) | 480 (44%) | 563 (48%) | 496 (56%) | |
| Total energy intake | 2,186.96 (828.82) | 1,585.36 (544.27) | 2,006.39 (571.85) | 2,360.53 (655.74) | 2,818.17 (963.14) | < 0.001 |
| Hypertension | 0.064 | |||||
| Yes | 1,505 (25%) | 486 (28%) | 363 (25%) | 379 (25%) | 277 (21%) | |
| No | 4,020 (75%) | 1,043 (72%) | 1,009 (75%) | 1,052 (75%) | 916 (79%) | |
| Diabetes | 0.002 | |||||
| Yes | 511 (7.0%) | 165 (9.4%) | 136 (6.3%) | 128 (7.9%) | 82 (4.2%) | |
| No | 5,014 (93%) | 1,364 (91%) | 1,236 (94%) | 1,303 (92%) | 1,111 (96%) | |
| Cardiovascular disease | 0.2 | |||||
| Yes | 105 (1.7%) | 40 (2.0%) | 24 (1.1%) | 29 (2.4%) | 12 (1.1%) | |
| No | 5,420 (98%) | 1,489 (98%) | 1,348 (99%) | 1,402 (98%) | 1,181 (99%) | |
| Sarcopenia | < 0.001 | |||||
| Yes | 379 (5.8%) | 145 (9.3%) | 96 (6.1%) | 90 (5.4%) | 48 (2.1%) | |
| No | 5,146 (94%) | 1,384 (91%) | 1,276 (94%) | 1,341 (95%) | 1,145 (98%) |
Baseline patient characteristics by OBS quartiles.
3.2 Association between OBS and sarcopenia
The results of the weighted logistic regression analysis detailed in Table 2 indicate that sarcopenia was negatively associated with both continuous dietary OBS and OBS quartiles. In the fully adjusted model (Model 3), the second (OR: 0.62, 95% CI: 0.41, 0.94, p = 0.023), the third (OR: 0.50, 95% CI: 0.34, 0.74, p < 0.001), and highest quartiles (OR: 0.18, 95% CI: 0.11, 0.28, p < 0.001) of OBS were associated with higher risks of sarcopenia when compared to the lowest quartile. In our sensitivity analysis, the removal of any individual OBS component showed the same trend (p < 0.0001; Supplementary Table 2).
Table 2
| Model 1 | Model 2 | Model 3 | |||||||
|---|---|---|---|---|---|---|---|---|---|
| Characteristic | OR | 95% CI | p-value | OR | 95% CI | p-value | OR | 95% CI | p-value |
| Continuous OBS | 0.94 | 0.93, 0.96 | < 0.001 | 0.94 | 0.93, 0.96 | < 0.001 | 0.93 | 0.91, 0.95 | < 0.001 |
| Q1 | Ref | Ref | Ref | Ref | Ref | Ref | Ref | Ref | Ref |
| Q2 | 0.63 | 0.43, 0.94 | 0.025 | 0.63 | 0.42, 0.95 | 0.027 | 0.62 | 0.41, 0.94 | 0.023 |
| Q3 | 0.55 | 0.39, 0.78 | 0.001 | 0.57 | 0.41, 0.81 | 0.002 | 0.50 | 0.34, 0.74 | < 0.001 |
| Q4 | 0.21 | 0.14, 0.31 | < 0.001 | 0.21 | 0.14, 0.31 | < 0.001 | 0.18 | 0.11, 0.28 | < 0.001 |
| P for trend | < 0.001 | < 0.001 | < 0.001 | ||||||
Weighted logistic regression analysis models showing the associations between OBS and sarcopenia.
OR, odds ratio; CI, confidence intervals. Model 1: unadjusted for age, sex, race, education level, and poverty. Model 2: adjusted for age, sex, race, education level, and poverty. Model 3: adjusted for total energy intake, hypertension, diabetes, and CVDs.
3.3 Association between dietary OBS, lifestyle OBS, and sarcopenia
Our study categorized OBS into dietary and lifestyle categories. The associations between dietary and lifestyle OBS with sarcopenia were evaluated separately (Table 3). Sarcopenia was negatively associated with continuous dietary OBS in a way that was statistically significant after adjusting for all covariates (OR = 0.94 [0.92, 0.97], p < 0.001). For lifestyle OBS, a higher score was strongly associated with a lower risk of sarcopenia after adjusting for all covariates (OR = 0.73 [0.66, 0.81], p < 0.001). Sarcopenia was equally affected by the dietary and lifestyle OBS quartiles. Lifestyle OBS affected sarcopenia more than dietary OBS.
Table 3
| Model 1 | Model 2 | Model 3 | |||||||
|---|---|---|---|---|---|---|---|---|---|
| Characteristic | OR | 95% CI | p -value | OR | 95% CI | p -value | OR | 95% CI | p -value |
| Continuous dietary OBS | 0.95 | 0.94, 0.97 | < 0.001 | 0.95 | 0.94, 0.97 | < 0.001 | 0.94 | 0.92, 0.97 | < 0.001 |
| Dietary OBS group | |||||||||
| Q1 | Ref | Ref | Ref | Ref | Ref | Ref | Ref | Ref | Ref |
| Q2 | 0.64 | 0.43, 0.96 | 0.031 | 0.65 | 0.43, 0.98 | 0.039 | 0.60 | 0.38, 0.95 | 0.031 |
| Q3 | 0.59 | 0.41, 0.86 | 0.007 | 0.63 | 0.42, 0.93 | 0.022 | 0.56 | 0.36, 0.87 | 0.012 |
| Q4 | 0.29 | 0.18, 0.47 | < 0.001 | 0.29 | 0.18, 0.46 | < 0.001 | 0.24 | 0.12, 0.48 | < 0.001 |
| P for trend | < 0.001 | < 0.001 | < 0.001 | ||||||
| Continuous lifestyle OBS | 0.69 | 0.63, 0.76 | < 0.001 | 0.70 | 0.63, 0.77 | < 0.001 | 0.73 | 0.66, 0.81 | < 0.001 |
| Lifestyle OBS group | |||||||||
| Q1 | Ref | Ref | Ref | Ref | Ref | Ref | Ref | Ref | Ref |
| Q2 | 0.41 | 0.27, 0.61 | < 0.001 | 0.42 | 0.28, 0.63 | < 0.001 | 0.46 | 0.30, 0.71 | < 0.001 |
| Q3 | 0.31 | 0.19, 0.51 | < 0.001 | 0.34 | 0.21, 0.57 | < 0.001 | 0.39 | 0.23, 0.65 | < 0.001 |
| Q4 | 0.21 | 0.10, 0.46 | < 0.001 | 0.22 | 0.10, 0.49 | < 0.001 | 0.24 | 0.11, 0.56 | 0.001 |
| P for trend | < 0.001 | < 0.001 | < 0.001 | ||||||
OR estimates for associations between dietary or lifestyle OBS and sarcopenia.
OR, odds ratio; CI, confidence intervals. Model 1: unadjusted for age, sex, race, education level, and poverty. Model 2: adjusted for age, sex, race, education level, and poverty. Model 3: adjusted for total energy intake, hypertension, diabetes, and cardiovascular disease.
3.4 Subgroup analyses and interaction effects of the association between OBS and sarcopenia
Through a subgroup analysis, the association between OBS and sarcopenia was explored by considering age, sex, ethnicity, educational level, family income, and comorbidities such as diabetes, hypertension, and CVD—as is shown in Figure 2. Higher OBS is associated with a lower risk of sarcopenia in subgroups stratified by age, sex, family income, and presence of diabetes, hypertension, or CVD (P for trend, < 0.05). This subgroup analysis showed that the CVD subgroup was more sensitive to OBS than the non-CVD one. Individuals with CVD had a 34% lower risk of developing sarcopenia with higher OBS scores. By contrast, the risk of sarcopenia only decreased by 7% in those individuals without CVD. Non-Hispanic African–Americans, people of other ethnicities, and those with high school levels of education did not show significant associations with sarcopenia. No significant differences were observed between the subgroups of the covariates in our interaction analysis (Figure 2).
Figure 2
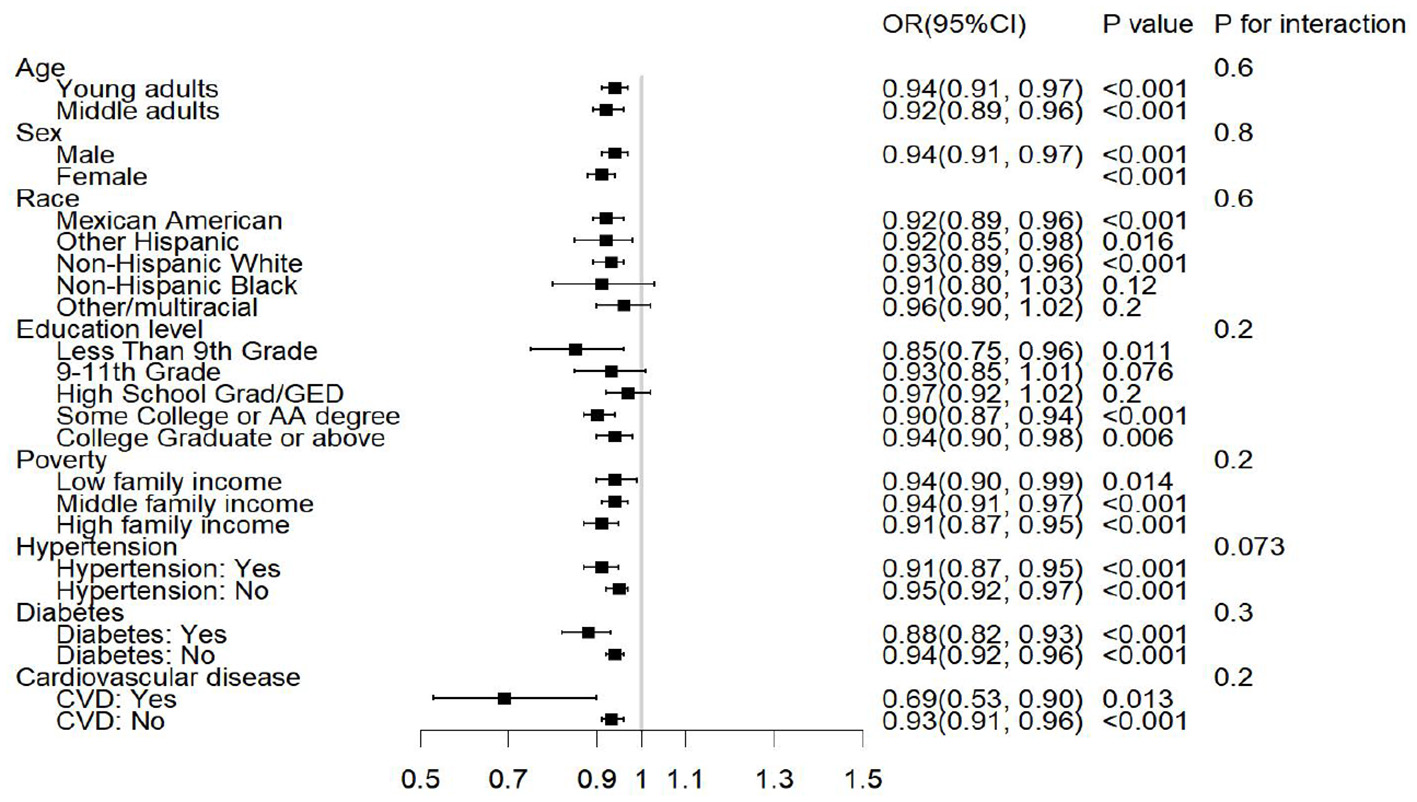
Forest plot for our subgroup analyses. P value: adjusted P value for Model 3.
3.5 Restricted cubic spline analysis
To evaluate the non-linear associations between OBS, dietary OBS, lifestyle OBS, and sarcopenia, we performed a restricted cubic spline (RCS) analysis based on the weighted logistic regression adjusted for Model 3. Figures 3A–C show that the non-linear represented p was >0.05, indicating a linear association between these variables.
Figure 3
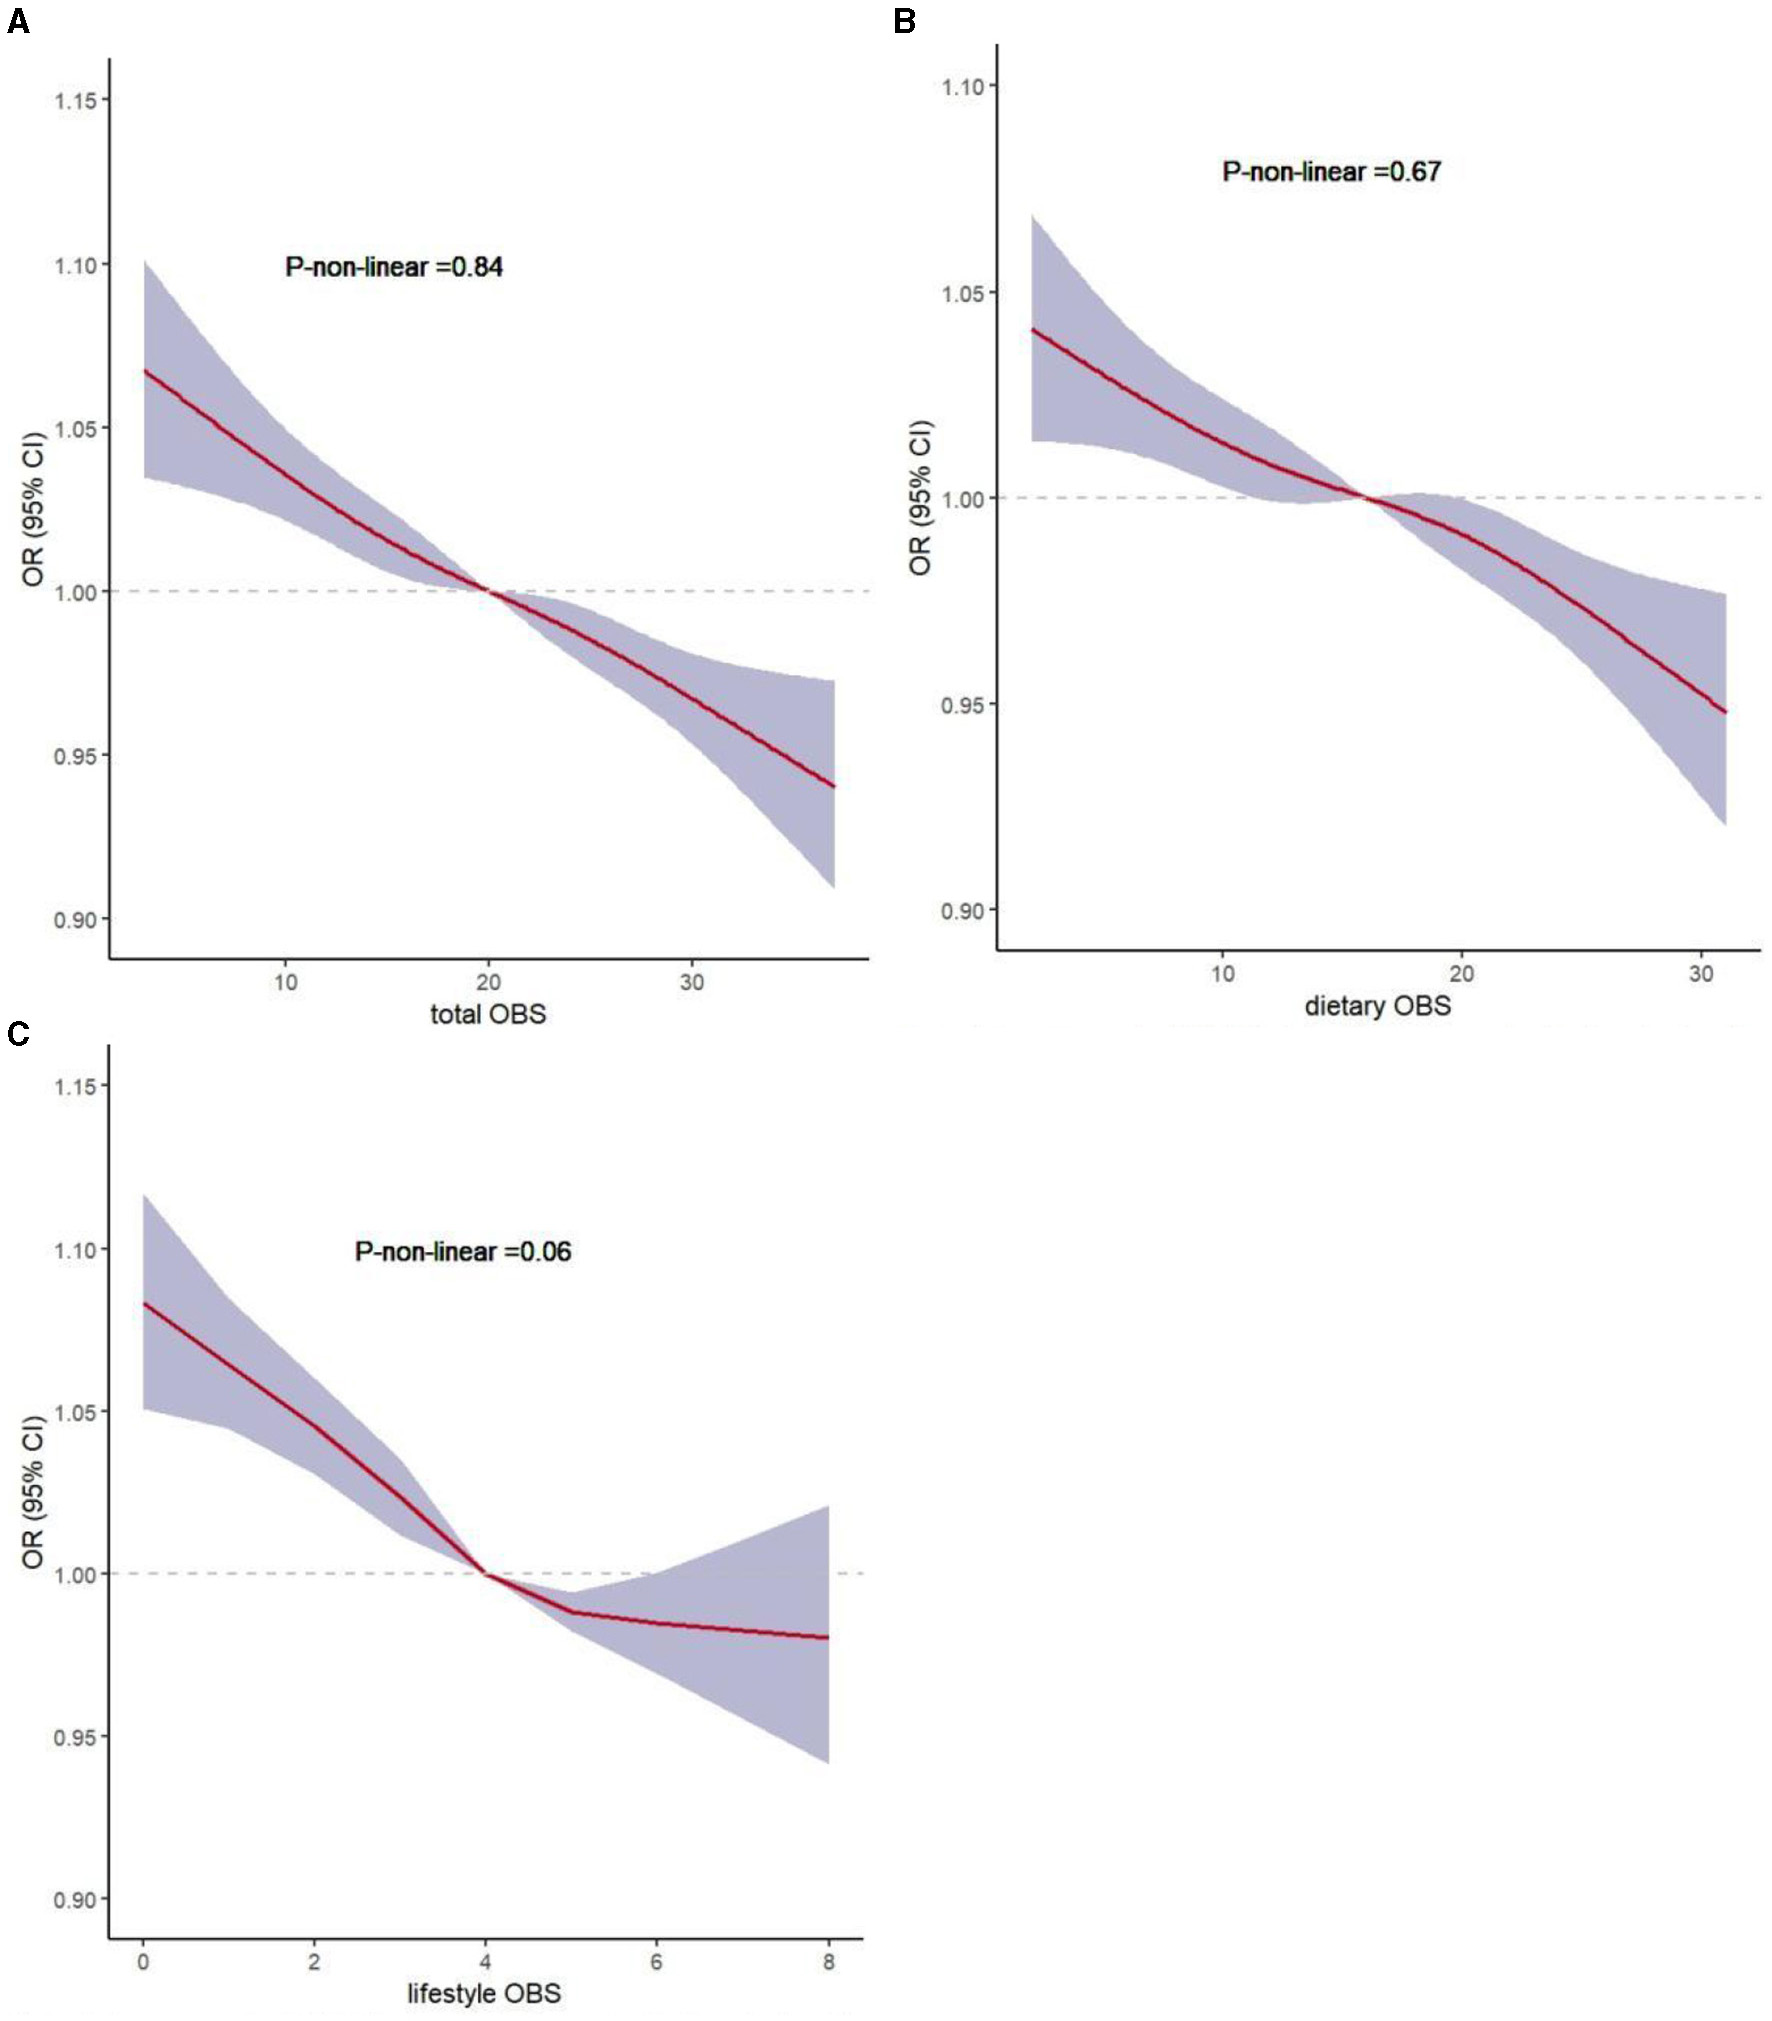
Non-linear associations of total OBS, dietary OBS, and lifestyle OBS with sarcopenia by restricted cubic spline analysis. (A) total OBS and sarcopenia; (B) dietary OBS and sarcopenia; (C) lifestyle OBS and sarcopenia.
4 Discussion
Using data from NHANES 2011–2018, we conducted a cross-sectional study to clarify the negative association between OBS and the risk of sarcopenia, demonstrating that a higher OBS may be associated with a lower risk of sarcopenia. Despite adjusting for possible confounders, this association remained significant for both dietary and lifestyle OBS.
Sarcopenia-associated skeletal muscle loss generally begins at the age of 35 years and progresses at a rate of 1%−2% per year (22). Recent studies have revealed that pre-sarcopenia was identified in 33%−66% of healthy young women in Japan (23, 24). Therefore, it is imperative to initiate preventive measures against frailty at a young age to circumvent potential future mobility challenges or conditions such as sarcopenia.
The multifactorial and intricate pathogenesis of sarcopenia can be caused by a range of factors including genetics, aging, diet, and physical inactivity (25). Skeletal muscle loss has been linked to oxidative stress, inflammation, insulin resistance, mitochondrial dysfunction, and telomere shortening, among other factors (12, 26–30). The skeletal muscle becomes more vulnerable to oxidative stress with increase in metabolic activity, resulting in ROS production (31). Oxidative stress is increased in sarcopenia, leading to an increased risk of CVD in sarcopenic obesity and chronic obstructive pulmonary disease (32, 33). Bernabeu-Wittel et al. reported that oxidative stress markers, including lower total antioxidant capacity for ROS (TAC-ROS) and higher superoxide dismutase (SOD) levels, were increased in sarcopenia patients (34). Oxidants in tobacco smoke and obesity can cause oxidative stress by producing ROS or reducing the defensive mechanisms of the antioxidant system, including several dietary components (35). Individuals with antioxidant deficiency coupled with poor nutrition are more likely to experience adverse health reactions as a result of oxidative stress (36). Therefore, it is a feasible strategy for individuals at high risk of sarcopenia to reduce free radical generation through antioxidant treatments. ROS can be produced either by endogenous antioxidant defense systems or by exogenous systems (i.e., dietary intake) (37). The OBS is a synthetic metric used to assess the overall exposure balance of dietary and lifestyle oxidants and antioxidants (14). The results of our study support the current understanding of the role of OS in the pathogenesis of sarcopenia, as a higher OBS level protects against sarcopenia.
Although no direct evidence has been reported linking OBS with sarcopenia, several studies have demonstrated an association between dietary intake and sarcopenia. A higher intake of fiber may result in a greater abundance of specific gut bacteria, which slows the development of sarcopenia (38). Vitamins C and E are antioxidant vitamins, as they can scavenge ROS and promote cellular antioxidant activity (39). A study by Lewis et al. reported a positive association between dietary and circulating vitamin C levels and skeletal muscle mass in middle-aged and older individuals (40). Vitamin E plays a significant role in the recovery of myogenic cell membranes and is beneficial for treating muscle cells (41). One cross-sectional study showed that dietary and plasma vitamin E concentrations can reduce the risk of both hip and total fractures (42). Intake of a wide range of B vitamins can also reduce the risk of sarcopenia. Niacin, also known as vitamin B3, plays a vital role in preventing sarcopenia (43). Moreover, consumption of B6 may be beneficial in combating sarcopenia, frailty, and all-cause mortality (44). During B6 deficiency, the modulation of PLP-dependent enzymes results in several pathophysiological states that can impair skeletal muscle function (44). Sufficient evidence indicates that low micronutrient intake can result in a higher risk of sarcopenia. Magnesium is an important cofactor in many enzymatic reactions essential for the preservation of muscle mass and the protection of muscle tissue from oxidative damage (45, 46). In a cross-sectional study, oral intake of magnesium was observed to potentially prevent sarcopenia (47). One systematic review reported that sarcopenia could be prevented and treated by increasing intake of micronutrients such as calcium, iron, magnesium, phosphorus, potassium, selenium, sodium, and zinc (48). The benefits of dietary antioxidants, including the reduction of oxidative stress in skeletal muscles, are well known (49). The Composite Dietary Antioxidant Index (CDAI), which includes vitamins A, C, and E; carotenoids; zinc; and selenium, was examined in a recent study (49). The CDAI is related to hand grip strength, which indirectly supports the evidence that dietary factors contribute to sarcopenia (49).
The preservation, loss, and restoration of muscle mass rely on the balance between two concurrent yet opposing processes: protein degradation (PD) and protein synthesis (PS), collectively referred to as protein turnover. (50). The mTOR kinase serves as a central regulator of muscle protein synthesis, and its activity is significantly influenced by the availability of nutrients—particularly amino acids and growth factors (50). Whey proteins may further enhance antioxidant capacity by providing cysteine-rich proteins, which work in the synthesis of glutathione, a crucial intracellular antioxidant (51).
A correlation between a healthy lifestyle and sarcopenia has been confirmed. To date, physical activity has been proven to help maintain muscle health and delay sarcopenia (52), and resistance exercise, in particular, is a potent stimulus for PS (53). In the absence of exercise, muscle atrophy occurs because of reduced production of myocytokines, an imbalance between anti-inflammatory and pro-inflammatory mediators, and altered protein synthesis (54). However, consistent research has demonstrated that exercise generates ROS, which can be both beneficial or harmful depending on several factors, including the concentration of ROS, the duration of exposure, and the individual's training status (55).For example, ROS triggers the mitochondrial biogenesis cascade in response to endurance exercise (56). Additionally, within physiological concentrations, ROS regulates antioxidant systems by boosting the content and activities of SOD1 and SOD2 in muscle cells, thereby reducing ROS concentration (57).Given the current findings regarding oxidative balance and sarcopenia, it could be hypothesized that the impact of exercise on sarcopenia is multifaceted and may involve the regulation of oxidative balance. Further research is needed to prove this hypothesis.
Tobacco smoking and alcohol consumption represent two other primary factors that can affect muscle health. The effects of smoking include inactivity, lack of energy, and systemic inflammation—all of which interfere with muscle protein synthesis (58). A longitudinal cohort study investigating the correlation between smoking and the prevalence of sarcopenia observed that smokers had a 2.36-fold higher risk of developing sarcopenia than non-smokers (59). The prevalence of sarcopenia was aggravated by excessive alcohol consumption, possibly because skeletal muscle protein synthesis is restricted by excessive alcohol consumption (58, 60). BMI was used to assess body fat and thickness in this study. A previous study discovered an association between abdominal obesity and muscle mass and strength decline (61). Some individuals have both obesity and sarcopenia, sometimes referred to as sarcopenic obesity. The systemic energy burden associated with obesity accelerates disease onset by driving muscle loss (62).
These results further demonstrate the importance of antioxidant capacity in patients with sarcopenia or those at risk of developing it. Thus, we measured the oxidative balance in our participants and assessed its role in sarcopenia using OBS—a comprehensive indicator. Our study indicated that OBS was significantly higher in the non-sarcopenia group than in the sarcopenia one. Furthermore, observation of continuous OBS showed that lifestyle OBS had a more positive influence on sarcopenia than dietary OBS. After stratification by age, sex, ethnicity, educational level, family income, hypertension, diabetes, and CVD, no substantial alterations were observed in the association between OBS and sarcopenia.
Our study had several notable strengths. First, we used data from a nationally representative population-based study to generate our results, making them more generalizable. Furthermore, OBS, as a comprehensive measurement method, provides an assessment of multiple aspects of oxidant–antioxidant exposure. Finally, as opposed to older adults, our study surveyed the relationship between OBS and sarcopenia in young and middle-aged adults. However, this study also had several key limitations. Owing to its cross-sectional design, we were unable to establish a causal relationship between OBS and sarcopenia. Second, sarcopenia is defined as a decline in skeletal muscle mass with functional deterioration. In this study, sarcopenia was assessed based on low muscle mass. In the NHANES datasets, inadequate information regarding muscle function was found. Thus, future studies for determining the correlation between muscle function and OBS should be conducted. In addition, collecting 24-h dietary data may induce recall bias and fail to reflect long-term dietary patterns. Therefore, further clinical randomized controlled trials are warranted to confirm our findings.
5 Conclusion
This study showed that higher antioxidant and lower oxidant exposure may decrease the risk of developing sarcopenia. A higher OBS may indicate higher protection against sarcopenia. Therefore, individuals may be able to reduce the loss of muscle mass and delay the development of sarcopenia by maintaining healthy lifestyles and taking dietary antioxidant supplements. However, further clinical studies are warranted to confirm these findings.
Statements
Data availability statement
Publicly available datasets were analyzed in this study. This data can be found here: https://wwwn.cdc.gov/nchs/nhanes.
Ethics statement
The studies involving humans were approved by the National Center for Health Statistics' Ethics Review Board. The studies were conducted in accordance with the local legislation and institutional requirements. The participants provided their written informed consent to participate in this study.
Author contributions
ZC: Formal analysis, Methodology, Supervision, Writing – original draft, Writing – review & editing. DD: Formal analysis, Writing – review & editing.
Funding
The author(s) declare that no financial support was received for the research, authorship, and/or publication of this article.
Acknowledgments
The authors thank the NCHS for their efforts in creating the data for the NHANES.
Conflict of interest
The authors declare that the research was conducted in the absence of any commercial or financial relationships that could be construed as a potential conflict of interest.
Publisher’s note
All claims expressed in this article are solely those of the authors and do not necessarily represent those of their affiliated organizations, or those of the publisher, the editors and the reviewers. Any product that may be evaluated in this article, or claim that may be made by its manufacturer, is not guaranteed or endorsed by the publisher.
Supplementary material
The Supplementary Material for this article can be found online at: https://www.frontiersin.org/articles/10.3389/fnut.2024.1397429/full#supplementary-material
References
1.
Cruz-Jentoft AJ Sayer AA . Sarcopenia. Lancet. (2019) 393:2636–46. 10.1016/S0140-6736(19)31138-9
2.
Cruz-Jentoft AJ Bahat G Bauer J Boirie Y Bruyère O Cederholm T et al . Sarcopenia: revised European consensus on definition and diagnosis. Age Ageing. (2019) 48:16–31. 10.1093/ageing/afy169
3.
Sayer AA Syddall H Martin H Patel H Baylis D Cooper C . The developmental origins of sarcopenia. J Nutr Health Aging. (2008) 12:427–32. 10.1007/BF02982703
4.
Cruz-Jentoft AJ Baeyens JP Bauer JM Boirie Y Cederholm T Landi F et al . Sarcopenia: European consensus on definition and diagnosis. Age Ageing. (2010) 39:412–23. 10.1093/ageing/afq034
5.
Petermann-Rocha F Balntzi V Gray SR Lara J Ho FK Pell JP et al . Global prevalence of sarcopenia and severe sarcopenia: a systematic review and meta-analysis. J Cachexia Sarcopeni. (2022) 13:86–99. 10.1002/jcsm.12783
6.
Jung HN Jung CH . Hwang Y-CSarcopenia in youth. Metabolism. (2023) 144:155557. 10.1016/j.metabol.2023.155557
7.
Sousa AS Guerra RS Fonseca I Pichel F Ferreira S Amaral TF . Financial impact of sarcopenia on hospitalization costs. Eur J Clin Nutr. (2016) 70:1046–51. 10.1038/ejcn.2016.73
8.
Lang T Streeper T Cawthon P Baldwin K Taaffe DR Harris TB . Sarcopenia: etiology, clinical consequences, intervention, and assessment. Osteoporos Int. (2010) 21:543–59. 10.1007/s00198-009-1059-y
9.
Thomas DR . Loss of skeletal muscle mass in aging: Examining the relationship of starvation, sarcopenia and cachexia. Clin Nutr. (2007) 26:389–99. 10.1016/j.clnu.2007.03.008
10.
Dhillon RJS Hasni S . Pathogenesis and management of Sarcopenia. Clin Geriatr Med. (2017) 33:17–26. 10.1016/j.cger.2016.08.002
11.
Jones DP . Radical-free biology of oxidative stress. Am J Physiol Cell Physiol. (2008) 295: C849–68. 10.1152/ajpcell.00283.2008
12.
Mitchell WK Williams J Atherton P Larvin M Lund J Narici M . Sarcopenia, dynapenia, and the impact of advancing age on human skeletal muscle size and strength; a quantitative review. Fron. Physiol. (2012) 3:260. 10.3389/fphys.2012.00260
13.
Tournadre A Vial G Capel F Soubrier M Boirie Y . Sarcopenia. Joint Bone Spine. (2019) 86:309–14. 10.1016/j.jbspin.2018.08.001
14.
Zhang W Peng S-F Chen L Chen H-M Cheng X-E Tang Y-H . Association between the oxidative balance score and telomere length from the national health and nutrition examination survey 1999-2002. Oxid Med Cell Longev. (2022) 2022:1–11. 10.1155/2022/1345071
15.
Ke R He Y Chen C . Association between oxidative balance score and kidney stone in United States adults: analysis from NHANES 2007-2018. Front Physiol. (2023) 14:1275750. 10.3389/fphys.2023.1275750
16.
Wu C Ren C Song Y Gao H Pang X Zhang L . Gender-specific effects of oxidative balance score on the prevalence of diabetes in the US population from NHANES. Front Endocrinol (Lausanne). (2023) 14:1148417. 10.3389/fendo.2023.1148417
17.
Liu Y Chen M . Dietary and lifestyle oxidative balance scores are independently and jointly associated with nonalcoholic fatty liver disease: a 20 years nationally representative cross-sectional study. Front Nutr. (2023) 10:1276940. 10.3389/fnut.2023.1276940
18.
Liu X Liu X Wang Y Zeng B Zhu B Dai F . Association between depression and oxidative balance score: national health and nutrition examination survey (NHANES) 2005-2018. J Affect Disord. (2023) 337:57–65. 10.1016/j.jad.2023.05.071
19.
Studenski SA Peters KW Alley DE Cawthon PM McLean RR Harris TB et al . The FNIH sarcopenia project: rationale, study description, conference recommendations, and final estimates. The J Gerontol Series A. (2014) 69:547–58. 10.1093/gerona/glu010
20.
Ng CH Wong ZY Chew NWS Chan KE Xiao J Sayed N et al . Hypertension is prevalent in non-alcoholic fatty liver disease and increases all-cause and cardiovascular mortality. Front Cardiovasc Med. (2022) 9:942753. 10.3389/fcvm.2022.942753
21.
Barb D Repetto EM Stokes ME Shankar SS Cusi K . Type 2 diabetes mellitus increases the risk of hepatic fibrosis in individuals with obesity and nonalcoholic fatty liver disease. Obesity. (2021) 29:1950–60. 10.1002/oby.23263
22.
Hwang J Park S . Gender-specific risk factors and prevalence for sarcopenia among community-dwelling young-old adults. Int J Environ Res Public Health. (2022) 19:232. 10.3390/ijerph19127232
23.
Yasuda T . Identifying preventative measures against frailty, locomotive syndrome, and sarcopenia in young adults: a pilot study. J Phys Ther Sci. (2021) 33:823–7. 10.1589/jpts.33.823
24.
Ayabe M Kumahara H Yamaguchi-Watanabe A Chiba H Kobayashi N Sakuma I et al . Appendicular muscle mass and exercise/sports participation history in young Japanese women. Ann Hum Biol. (2019) 46:335–9. 10.1080/03014460.2019.1641221
25.
Mellen RH Girotto OS Marques EB Laurindo LF Grippa PC Mendes CG et al . Insights into pathogenesis, nutritional and drug approach in sarcopenia: a systematic review. Biomedicines. (2023) 11:136. 10.3390/biomedicines11010136
26.
Nishikawa H Asai A Fukunishi S Nishiguchi S . Higuchi KMetabolic Syndrome and Sarcopenia. Nutrients. (2021) 13:3519. 10.3390/nu13103519
27.
Rubio-Ruiz M Guarner-Lans V Pérez-Torres I Soto M . Mechanisms underlying metabolic syndrome-related sarcopenia and possible therapeutic measures. Int J Mol Sci. (2019) 20:647. 10.3390/ijms20030647
28.
Brioche T . Lemoine-Morel S. Oxidative stress, sarcopenia, antioxidant strategies and exercise: molecular aspects. Curr Pharm Des. (2016) 22:2664–78. 10.2174/1381612822666160219120531
29.
Can B Kara O Kizilarslanoglu MC Arik G Aycicek GS Sumer F et al . Serum markers of inflammation and oxidative stress in sarcopenia. Aging Clin Exp Res. (2017) 29:745–52. 10.1007/s40520-016-0626-2
30.
Hernández-Álvarez D Rosado-Pérez J Gavia-García G Arista-Ugalde TL Aguiñiga-Sánchez I Santiago-Osorio E et al . Aging, physical exercise, telomeres, and sarcopenia: a narrative review. Biomedicines. (2023) 11:598. 10.3390/biomedicines11020598
31.
Mukund K Subramaniam S . Skeletal muscle: a review of molecular structure and function, in health and disease. Wiley Interdis Rev Syst Biol Med. (2020) 12:e1462. 10.1002/wsbm.1462
32.
Bellanti F Romano AD Lo Buglio A Castriotta V Guglielmi G Greco A et al . Oxidative stress is increased in sarcopenia and associated with cardiovascular disease risk in sarcopenic obesity. Maturitas. (2018) 109:6–12. 10.1016/j.maturitas.2017.12.002
33.
Lage V de Paula FA Dos Santos JM Costa HS da Silva GP Lima LP et al . Are oxidative stress biomarkers and respiratory muscles strength associated with COPD-related sarcopenia in older adults?Exp Gerontol. (2022) 157:111630. 10.1016/j.exger.2021.111630
34.
Bernabeu-Wittel M Gómez-Díaz R González-Molina Á Vidal-Serrano S Díez-Manglano J Salgado F et al . Oxidative stress, telomere shortening, and apoptosis associated to sarcopenia and frailty in patients with multimorbidity. J Clin Med. (2020) 9:2669. 10.3390/jcm9082669
35.
Hernández-Ruiz Á García-Villanova B Guerra-Hernández EJ Carrión-García CJ Amiano P Sánchez M-J et al . Oxidative balance scores (OBSs) integrating nutrient, food and lifestyle dimensions: development of the nutrient L-OBS and food L-OBS. Antioxidants. (2022) 11:300. 10.3390/antiox11020300
36.
Liu Z Ren Z Zhang J Chuang C-C Kandaswamy E Zhou T et al . Role of ROS and nutritional antioxidants in human diseases. Front Physiol. (2018) 9:477. 10.3389/fphys.2018.00477
37.
Robinson S Granic A Sayer A . A micronutrients and sarcopenia: current perspectives. Proc Nutr Soc. (2021) 80:311–8. 10.1017/S0029665121001956
38.
Prokopidis K Cervo MM Gandham A Scott D . Impact of protein intake in older adults with sarcopenia and obesity: a gut microbiota perspective. Nutrients. (2020) 12:2285. 10.3390/nu12082285
39.
Liu S Zhang L Li S . Advances in nutritional supplementation for sarcopenia management. Front Nutr. (2023) 10:1189522. 10.3389/fnut.2023.1189522
40.
Lewis LN Hayhoe RP Mulligan AA Luben RN Khaw K-T Welch AA . Lower dietary and circulating vitamin C in middle- and older-aged men and women are associated with lower estimated skeletal muscle mass. J Nutr. (2020) 150:2789–98. 10.1093/jn/nxaa221
41.
Howard AC McNeil AK McNeil PL . Promotion of plasma membrane repair by vitamin E. Nat Commun. (2011) 2:597. 10.1038/ncomms1594
42.
Mulligan AA Hayhoe RPG Luben RN Welch AA . Positive associations of dietary intake and plasma concentrations of vitamin E with skeletal muscle mass, heel bone ultrasound attenuation and fracture risk in the EPIC-Norfolk cohort. Antioxidants. (2021) 10:159. 10.3390/antiox10020159
43.
Xiang S Li Y Li Y Zhang J Pan W Lu Y et al . Increased dietary niacin intake improves muscle strength, quality, and glucose homeostasis in adults over 40 years of age. J Nutr Health Aging. (2023) 27:709–18. 10.1007/s12603-023-1967-0
44.
Kato N Kimoto A Zhang P Bumrungkit C Karunaratne S Yanaka N et al . Relationship of low vitamin B6 status with sarcopenia, frailty, and mortality: a narrative review. Nutrients. (2024) 16:177. 10.3390/nu16010177
45.
Welch AA Kelaiditi E Jennings A Steves CJ Spector TD MacGregor A . Dietary magnesium is positively associated with skeletal muscle power and indices of muscle mass and may attenuate the association between circulating C-reactive protein and muscle mass in women. J Bone Miner Res. (2016) 31:317–25. 10.1002/jbmr.2692
46.
Welch A Skinner J Hickson M . Dietary magnesium may be protective for aging of bone and skeletal muscle in middle and younger older age men and women: cross-sectional findings from the UK biobank cohort. Nutrients. (2017) 9:1189. 10.3390/nu9111189
47.
Yang S-W Chen Y-Y Chen W-L . Association between oral intake magnesium and sarcopenia: a cross-sectional study. BMC Geriatr. (2022) 22:816. 10.1186/s12877-022-03522-5
48.
Van Dronkelaar C Van Velzen A Abdelrazek M Van Der Steen A Weijs PJM Tieland M . Minerals and sarcopenia; the role of calcium, iron, magnesium, phosphorus, potassium, selenium, sodium, and zinc on muscle mass, muscle strength, and physical performance in older adults: a systematic review. J Am Med Dir Assoc. (2018) 19:6–11. 10.1016/j.jamda.2017.05.026
49.
Wu D Wang H Wang W Qing C Zhang W Gao X et al . Association between composite dietary antioxidant index and handgrip strength in American adults: Data from National Health and Nutrition Examination Survey (NHANES, 2011-2014). Front Nutr. (2023) 10:1147869. 10.3389/fnut.2023.1147869
50.
Tezze C Sandri M Tessari P . Anabolic resistance in the pathogenesis of sarcopenia in the elderly: role of nutrition and exercise in young and old people. Nutrients. (2023) 15:73. 10.3390/nu15184073
51.
Ha E Zemel MB . Functional properties of whey, whey components, and essential amino acids: mechanisms underlying health benefits for active people (review). J Nutr Biochem. (2003) 14:251–8. 10.1016/S0955-2863(03)00030-5
52.
Otsuka Y Yamada Y Maeda A Izumo T Rogi T Shibata H et al . Effects of resistance training intensity on muscle quantity/quality in middle-aged and older people: a randomized controlled trial. J Cachexia Sarcopeni. (2022) 13:894–908. 10.1002/jcsm.12941
53.
Hurst C Robinson SM Witham MD Dodds RM Granic A Buckland C et al . Resistance exercise as a treatment for sarcopenia: prescription and delivery. Age Ageing. (2022) 51:003. 10.1093/ageing/afac003
54.
Barbalho SM Flato UAP Tofano RJ Goulart RDA Guiguer EL Detregiachi CRP et al . Physical exercise and myokines: relationships with sarcopenia and cardiovascular complications. Int J Mol Sci. (2020) 21:3607. 10.3390/ijms21103607
55.
Nocella C Cammisotto V Pigozzi F Borrione P Fossati C D'Amico A et al . Impairment between oxidant and antioxidant systems: short- and long-term implications for athletes' health. Nutrients. (2019) 11:353. 10.3390/nu11061353
56.
Jornayvaz FR Shulman GI . Regulation of mitochondrial biogenesis. Essays Biochem. (2010) 47:69–84. 10.1042/bse0470069
57.
Abruzzo PM Esposito F Marchionni C di Tullio S Belia S Fulle S et al . Moderate exercise training induces ROS-related adaptations to skeletal muscles. Int J Sports Med. (2013) 34:676–87. 10.1055/s-0032-1323782
58.
Prokopidis K Witard OC . Understanding the role of smoking and chronic excess alcohol consumption on reduced caloric intake and the development of sarcopenia. Nutr Res Rev. (2022) 35:197–206. 10.1017/S0954422421000135
59.
Locquet M Bruyère O Lengelé L Reginster JY Beaudart C . Relationship between smoking and the incidence of sarcopenia: the SarcoPhAge cohort. Public Health. (2021) 193:101–8. 10.1016/j.puhe.2021.01.017
60.
Thapaliya S Runkana A McMullen MR Nagy LE McDonald C Prasad SVN et al . Alcohol-induced autophagy contributes to loss in skeletal muscle mass. Autophagy. (2014) 10:677–90. 10.4161/auto.27918
61.
Juby AG . A healthy body habitus is more than just a normal BMI: Implications of sarcopenia and sarcopenic obesity. Maturitas. (2014) 78:243–4. 10.1016/j.maturitas.2014.05.013
62.
Axelrod CL Dantas WS Kirwan JP . Sarcopenic obesity: emerging mechanisms and therapeutic potential. Metabolism. (2023) 146:155639. 10.1016/j.metabol.2023.155639
Summary
Keywords
sarcopenia, oxidative balance score, NHANES, nutrition, lifestyle
Citation
Cai Z and Dong D (2024) Association of the oxidative balance score with sarcopenia among young and middle-aged adults: findings from NHANES 2011–2018. Front. Nutr. 11:1397429. doi: 10.3389/fnut.2024.1397429
Received
07 March 2024
Accepted
29 April 2024
Published
04 June 2024
Volume
11 - 2024
Edited by
Roberto Cannataro, University of Calabria, Italy
Reviewed by
Diana Marisol Abrego-Guandique, Magna Græcia University, Italy
Carlene Starck, FOODiQ Global, Australia
Updates
Copyright
© 2024 Cai and Dong.
This is an open-access article distributed under the terms of the Creative Commons Attribution License (CC BY). The use, distribution or reproduction in other forums is permitted, provided the original author(s) and the copyright owner(s) are credited and that the original publication in this journal is cited, in accordance with accepted academic practice. No use, distribution or reproduction is permitted which does not comply with these terms.
*Correspondence: Zhi Cai czcaizhi@163.com
†ORCID: Zhi Cai orcid.org/0000-0003-1541-3847
Disclaimer
All claims expressed in this article are solely those of the authors and do not necessarily represent those of their affiliated organizations, or those of the publisher, the editors and the reviewers. Any product that may be evaluated in this article or claim that may be made by its manufacturer is not guaranteed or endorsed by the publisher.