 Liu Zhiyi1†
 Zhou Shuhan1†Zhang Libing1†Li Jiaqi2Ding Xin3
 Qin Lingxi1Shi Yuan-Mei4
 Zhang Hong4
 Nie Jiaqi5Li Hui4*Fang Sanyou4*
- 1School of Traditional Chinese Medicine, Hubei University of Chinese Medicine, Wuhan, China
- 2Hospital of Stomatology Wuhan University, Wuhan, China
- 3School of Pharmacy, Hubei University of Chinese Medicine, Wuhan, China
- 4Taixing People’s Hospital, Taixing, China
- 5Xiaogan Center for Disease Control and Prevention, Xiaogan, China
Background: Chronic respiratory disease is an important public health problem in the United States and globally. Diet, an important part of a healthy lifestyle, is also relevant to chronic respiratory health. We aimed to explore the relationship between overall dietary quality and the risk of chronic respiratory disease (CRD), include chronic bronchitis (CB), emphysema and asthma.
Method: A total of 4,499 United States adults were extracted from the National Health and Nutrition Examination Survey (NHANES) in 2017–2018. Diet quality was assessed using 2 day, 24 h dietary recall data and quantified as the Healthy Diet Index (HEI)-2020 score. Binary logistic regression models, restricted cubic splines (RCS) and generalized additive modeling (GAM), the weighted quartile sum (WQS) and qgcom models were used to assess the relationship between HEI-2020 scores and risk of CB, emphysema and asthma.
Results: High HEI-2020 scores are associated with low risk of chronic respiratory disease (CB: 0.98, 0.97–0.99; emphysema: 0.98, 0.97–0.99; asthma: 0.98, 0.97–0.99) and consistent results across different dietary variable categorization (Tertile: CB: 0.58, 0.42–0.81; asthma: 0.51, 0.35–0.74; Quartile: CB: 0.57, 0.34–0.97; asthma: 0.56, 0.36–0.86) and different weighting models. Negative dose-response relationship between dietary quality and risk of chronic respiratory disease also shown in RCS and GAM models. The WQS and qgcom models also showed a healthy mixing effect of dietary components on respiratory disease, with high-quality proteins, vegetables, and fruits making the heaviest contributions.
Conclusion: Higher HEI-2020 scores were associated with lower risk of CB, emphysema, and asthma. Following Dietary Guidelines for Americans 2020–2025 could support enhanced respiratory health.
Introduction
Chronic bronchitis (CB) (1), emphysema (2) and asthma (3) are all among the most common chronic respiratory diseases (CRD) in the United States (4, 5). Asthma affects approximately 8% of U.S. adults (6). Chronic bronchitis and emphysema are both phenotypes of chronic obstructive pulmonary disease (COPD), which affects more than 15 million people across the U.S. and is the third leading cause of death in the U.S. and globally (6, 7).
Excluding genetic and allergic predispositions (8), the main risk factors for chronic respiratory diseases are infections or harmful substances in the environment (9). Prolonged inflammatory stress within the respiratory tract can induce tissue damage, culminating in the development of chronic pathologies (5). Regarding the prevention and treatment of chronic respiratory diseases, the relevant treatment guidelines have pointed out that there is currently no clear treatment drug, but more of a healthy lifestyle to improve the quality of life of patients (10, 11). The quality of diet is a pivotal component in the overall quality of life. In a study of dietary treatment of obese patients with COPD, rational restriction of energy intake was effective in improving patients’ BMI and muscle mass (12). This contributes to the development of guidelines for the health management of obese copd patients. The impact of diet on respiratory health may be derived from specific nutrients, specific foods, or a healthy diet, as also illustrated in the review on diet and COPD. Compared to nutrients, the protective effects of foods or healthy diets are more helpful in developing dietary guidelines (13).
In recent decades, there has been a growing body of research on diet and chronic disease (14–16), such as cognition, metabolic disease, cardiovascular disease. But few studies have explored the relationship between diet and respiratory and lung health. The healthy eating index (HEI) was developed and updated by the U.S. department of health and human services’ national cancer institute (NCI) and the U.S. department of agriculture (USDA) center for nutrition policy and promotion, as a quantitative measure of dietary quality for U.S. populations (17–19). It is a dietary quality indicator based on the Dietary Guidelines for Americans (DGA) (20). The HEI has been shown to relatively well reflect the dietary quality of the U.S. population and will be updated along with the DGA, which has gone through HEI-2005, HEI-2010, HEI-2015, and HEI-2020. HEI-2020 is currently the most recent version (21).
This study used the NHANES data to explore the relationship between HEI-2020 and the risk of CRD. Given the importance of diet to life and the high prevalence of respiratory diseases represented by asthma, chronic bronchitis, and emphysema in the U.S. population, this study has strong public health implications.
Materials and methods
Study sample
The NHANES database is a regularly conducted cross-sectional study from the Centers for Disease Control and Prevention’s (CDC’s) National Center for Health Statistics (NCHS) that investigates nutritional intake and health-related conditions of populations in the U.S. (22). The NHANES utilizes a complex, multistage sampling design to make the survey results well-representative of populations across the U.S. The data for this study were obtained from NHANES 2017–2018. The final sample, n = 4,499, was weighted to represent 103.6 million non-institutionalized adult U.S. population, and the process can be seen in Figure 1.
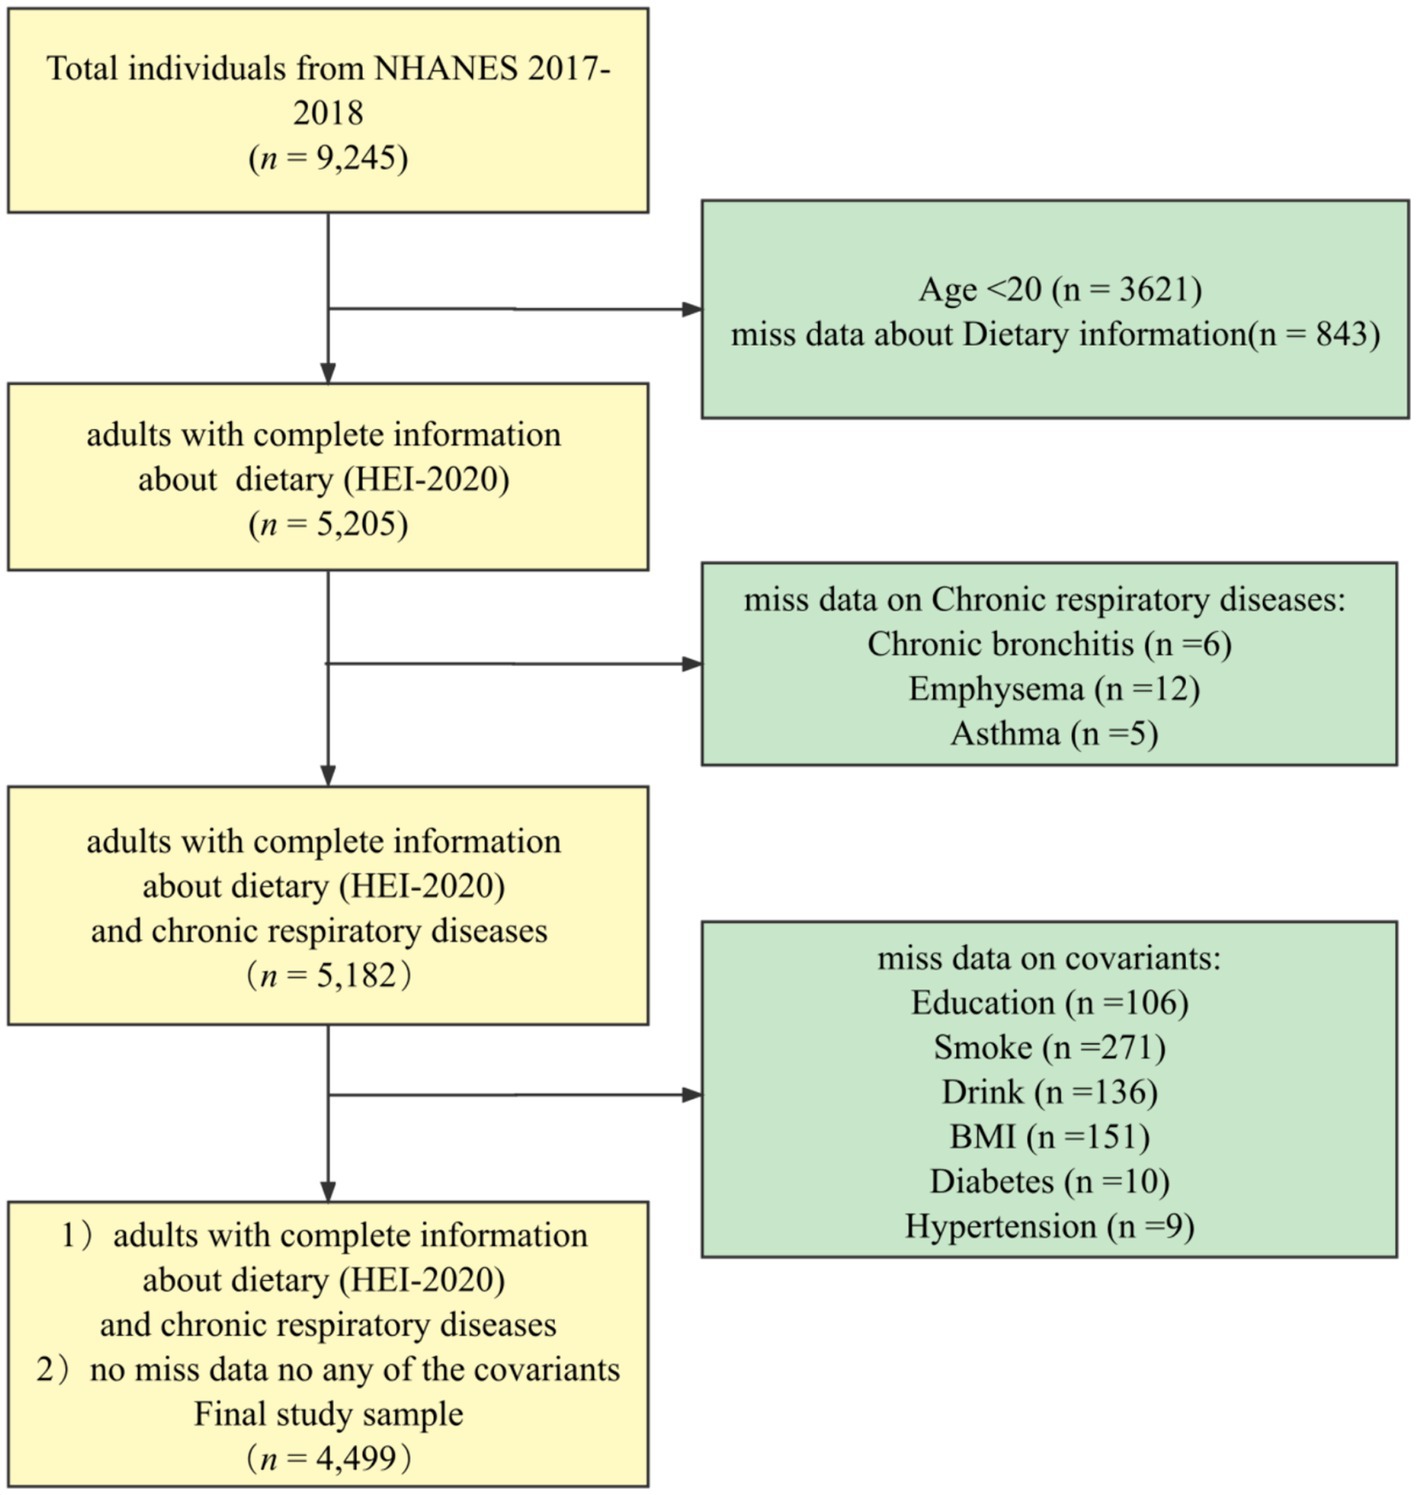
Figure 1. Flow chart.
Diet quality
The HEI-2020 is designed to evaluate adherence to the Dietary Guidelines for Americans (DGA) for the years 2020–2025, encompassing 13 distinct components: adequacy components (total vegetables, greens and beans, total fruits, whole fruits, whole grains, dairy, total protein foods, seafood, and plant proteins, as well as fatty acids) and moderation components (sodium, refined grains, saturated fats, and added sugars) (21). Each component has been assigned unique weights and distinct maximum scores. The HEI-2020 scores are scaled from 0 to 100, where a higher score indicates superior diet quality. For weighted Scott–Rao chi-square tests and weighted logistic regressions, HEI-2020 was used as continuous variable and categorical variable. Quartiles were used to categorize the HEI-2020 score into four groups, and record them as Q1(reference group), Q2, Q3, Q4 (23). Tertiles were also used to categorize the HEI-2020 score into three groups, and record them as T1(reference group), T2,T3 (24).
Chronic respiratory diseases
Three chronic respiratory diseases (chronic bronchitis (CB), emphysema, and asthma) were selected as outcome variables in this study. CB, emphysema, and asthma were all defined as non-patient groups and patient groups (25).
Covariates
In order to reduce the influence of confounding factors and obtain more reliable results, we referred to the relevant literature and selected demographic-sociological covariates [Sex, Age (26), Race (27), Education (28), Family income (29)], behavioral covariates [BMI status (30), Physical activity (31), Smoking status (32), Drinking status (15)], and chronic disease covariates [Hypertension (33), Diabetes (34)]. Physical activity is computationally defined through metabolic equivalent (MET). MET is the oxygen consumption required to maintain resting metabolism (35). According to the Physical Activity Questionnaire (PAQ) survey in NHANES included vigorous work-related activity (8MET), moderate work-related activity (4MET), walking or bicycling for transportation (4MET), vigorous amateur physical activity (8MET), and moderate amateur physical activity (4MET). Calculation formula (36):
Statistical analysis
The characteristics of different groups were tested using the χ2 tests and t-test. Weighted steps forward (likelihood ratio) binary logistic regression models were employed to evaluate the association between HEI-2020 scores and the risk of chronic bronchitis, emphysema, and asthma. Restricted cubic splines (RCS) were utilized to examine the dose-response relationship between HEI-2020 scores and chronic respiratory diseases conditions. The second approach is generalized additive modeling (GAM) regression, which assumes a smooth and possibly nonlinear association between HEI-2020 scores and chronic respiratory disease (37, 38). The effects of combined exposure to 13 dietary components of the HEI-2020 were assessed using the weighted quartile sum (WQS) regression model (39). The quantile G-computation method (qgcomp) was used to explore the joint and independent effects of HEI-2020 scores on the risk of chronic respiratory disease (40, 41). Examine the reliability of the results between dietary quality and CRD risk, with components of dietary quality included in the WQS and qgcom models as individual component scores rather than total scores. To analyze the overall health mixing effect of dietary components on CRD risk and the proportion of health contribution of each dietary component in the organized dietary structure.
Sensitivity analyses were applied to this study; the study sample was used as an unweighted sample, a directly weighted sample, and a weighted sample corrected for the three study populations by the Taylor Linear Method; HEI-2020 scores were applied as a continuous variable, a quartile categorized variable, and a tertile categorized variable included in a generalized linear model. RCS were used to test the dose-response relationship between HEI when used as a continuous variable and risk of chronic respiratory disease. GAM was used as a sensitivity analysis to validate the RCS results. The WQS model was used in order to further validate the HEI-2020 score with respect to chronic respiratory disease risk and to explore the weighting of dietary components contributing to respiratory health. Qgcomp modeling was used as a sensitivity analysis to validate the results of the WQS model.
All statistical tests were two-sided, and significance was considered at p < 0.05. All statistical analysis were performed with the R (version 4.1.2). RCS was implemented with the R package “rms” (version 6.3-0). GAM was implemented with the R package “gam” (version 1.22-2). WQS was implemented with the R package “gWQS” (version 3.0.4). qgcom was implemented with the R package “qgcom” (version 2.15.2).
Results
Characteristics of the study population
After screening the sample, a total sample of n = 4,499 was included. Weighted transformations represent 103.6 million of the U.S. non-institutionalized adult population of which 48.8% were male and 51.2% were female, with a mean HEI-2020 score of 52.92 ± 13.99 (Table 1). As seen in the characterization between the healthy population and the CRD population, adults with chronic respiratory disease were more likely to be older, have lower incomes, obesity, less physically active, have chronic illnesses, lower dietary quality.
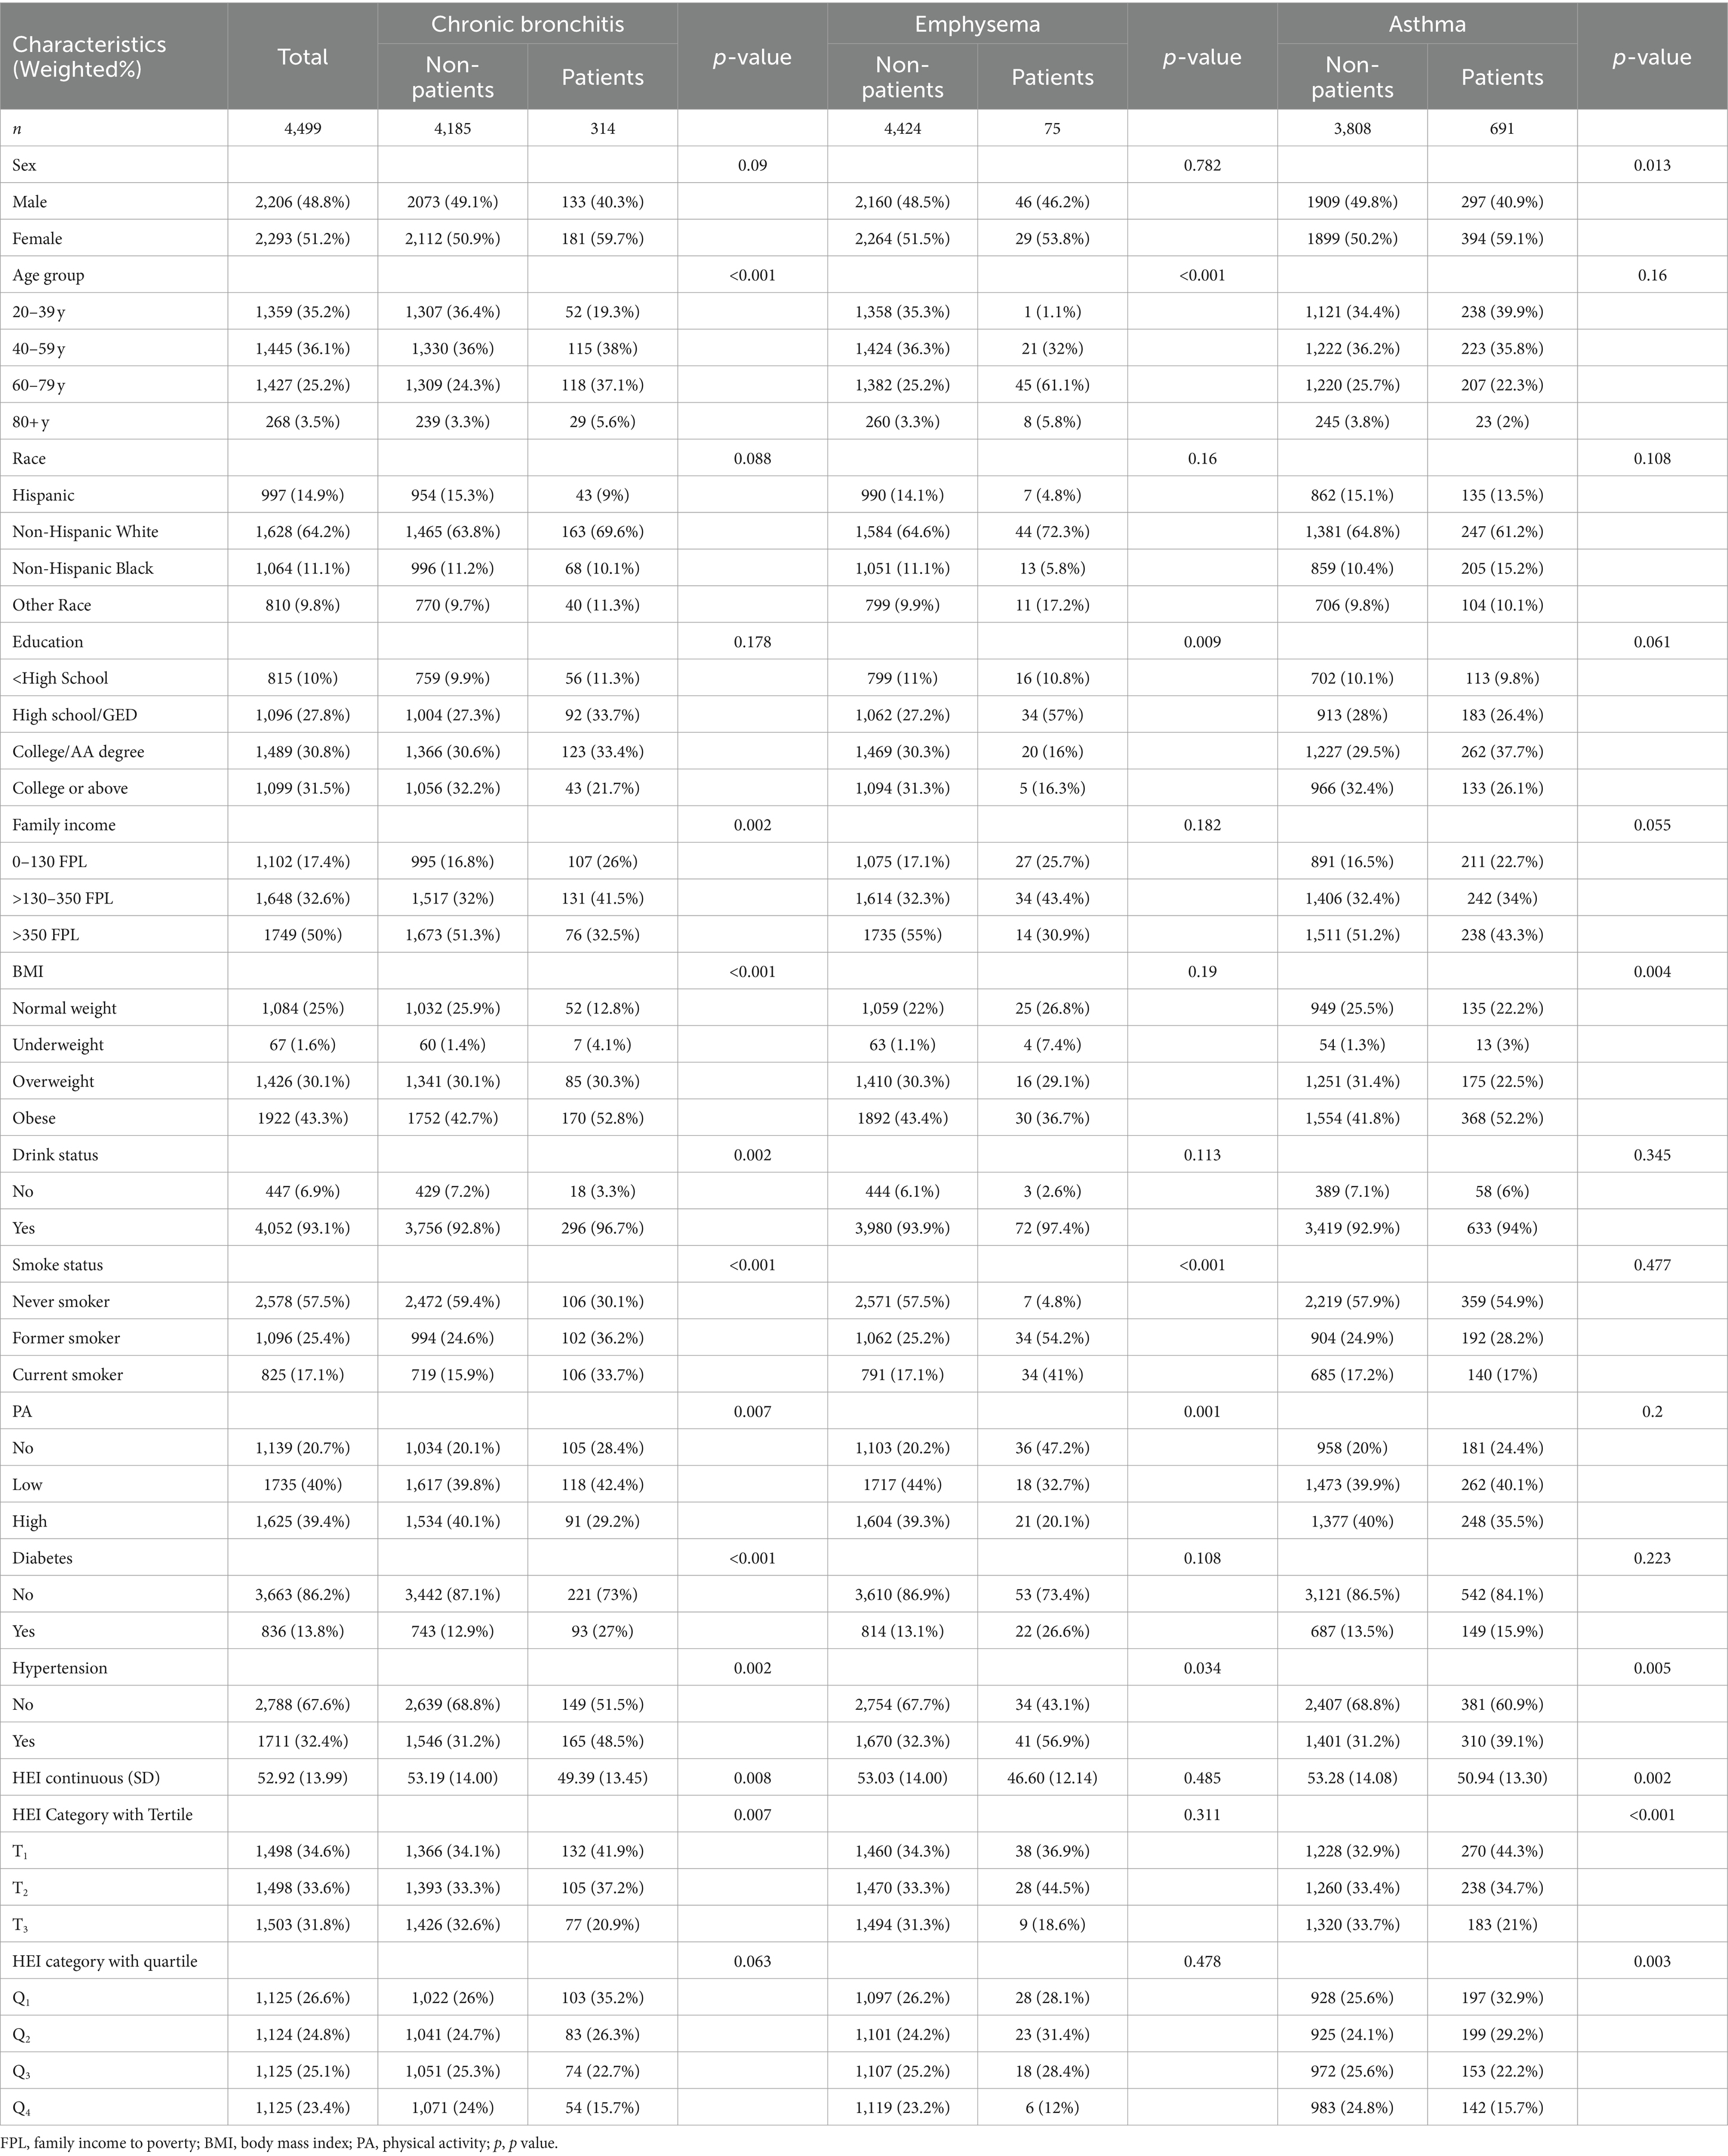
Table 1. The population characteristics among U.S. adults by the three chronic respiratory diseases.
Higher HEI-2020 scores is associated with a lower risk of CRD
A multifactorial stepwise logistic regression model was employed to examine the association between HEI-2020 scores and risk of CRD. All models adjusted for demographic-sociological covariates (Sex, Age, Education, Family income), behavioral covariates (BMI status, Physical activity, Smoking status, Drinking status), and chronic disease covariates (Hypertension, Diabetes). Table 2 shown relationship between higher HEI-2020 scores and a lower risk of CRD in both the three kinds of binary logistic regression model. Whether the study sample was weighted or not, the HEI-2020 score showed a healthy effect on the risk of all three CRD when used as a continuous variable (CB: 0.98, 0.97–0.99; emphysema: 0.98, 0.97–0.99; asthma: 0.98, 0.97–0.99). This relationship was not significantly altered after tertile and quartile categorization of HEI-2020 scores (Tertile: CB: 0.58, 0.42–0.81; asthma: 0.51, 0.35–0.74; Quartile: CB: 0.57, 0.34–0.97; asthma: 0.56, 0.36–0.86). It suggests that higher HEI-2020 scores are correlated with low risk of CRD. Suggests that neither changes in the proportion of the population in the study sample nor different ways of defining HEI-2020 (dietary quality) affect the association of high HEI-2020 scores with low CRD.
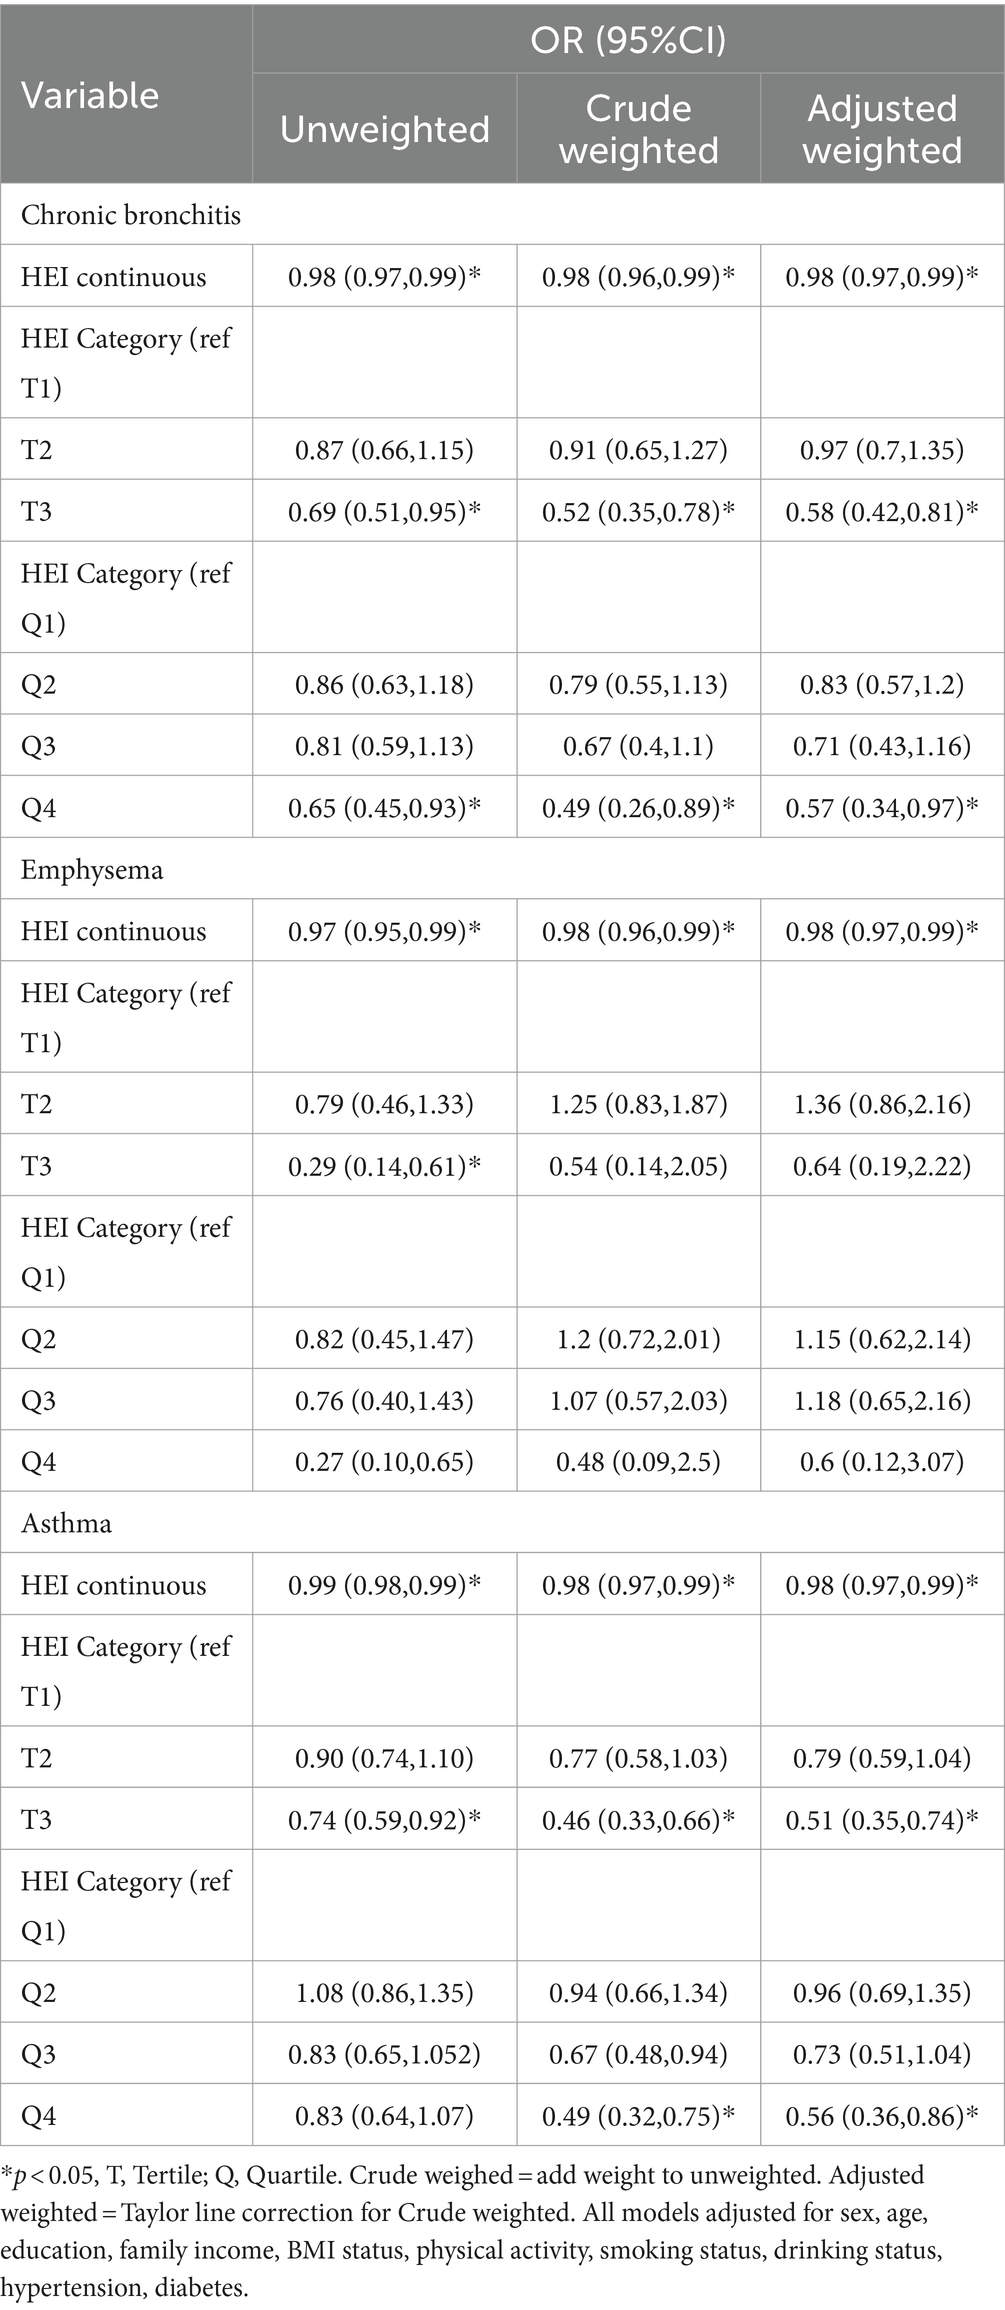
Table 2. Relationship between HEI-2020 and chronic respiratory disease among adults aged 20 years or older.
Dose-response relationship between HEI-2020 scores and risk of CRD
RCS was used to explore the dose–response relationship between HEI-2020 scores and the risk of three CRD. GAM was used as a sensitivity analysis to validate the results. The RCS results showed a negative dose-relative relationship between HEI and the risk of the three CRD in Figure 2; meanwhile, the GAM results also showed a same tendency (Figure 2).

Figure 2. Dose-response association between HEI-2020 (in continues) and chronic bronchitis/emphysema/asthma using restricted cubic splines (RCS) and generalized additive modeling (GAM) regression. The chronic bronchitis models of RCS (A) and GAM (B). The emphysema models of RCS (C) and GAM (D). The asthma models of RCS (E) and GAM (F). All models adjusted for sex, age, education, family income, BMI status, physical activity, smoking status, drinking status, hypertension, diabetes.
Mixed effects of 13 dietary components on CRD
Table 3 shows the mixed effects of the 13 dietary components of the HEI-2020 on the risk of CRD in the model of WQS and the model of qgcomp. The results of the WQS and qgcomp models showed that HEI-2020 scores still showed a significant protective effect between the three CRD when they were used as a mixing variable. Suggesting that the correlation between high dietary quality and low chronic respiratory risk is not altered by the inclusion of model definitions. The 13 dietary components of HEI-2020 have a healthy mixing effect on the respiratory tract. And the size of the contribution varied among the different food components.
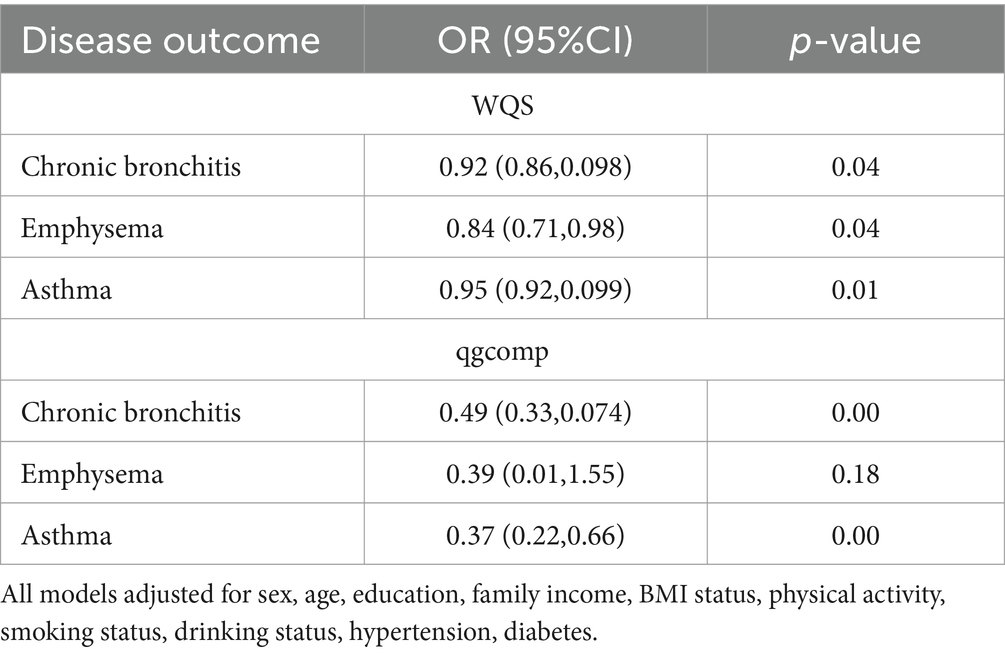
Table 3. Relationship between the mixed effects of the 13 dietary components of the HEI-2020 and chronic respiratory disease among adults aged 20 years or older.
Figure 3 shows the results of the mixed effects of dietary components on the risk of CRD in the WQS model. WQS results showed that Total Protein Foods, Seafood and Plant Proteins and Sodium had the largest health contribution group in the CB model, 24.66, 14.97, 13.31%, respectively; Seafood and Plant Proteins and Sodium had the largest health contribution group in the emphysema model, 26.27, 14.36%, respectively; and in the asthma model, Total Fruits, Refined Grains, and Fatty Acids made the greatest health contributions 18.55, 15.29, and 14.07%.
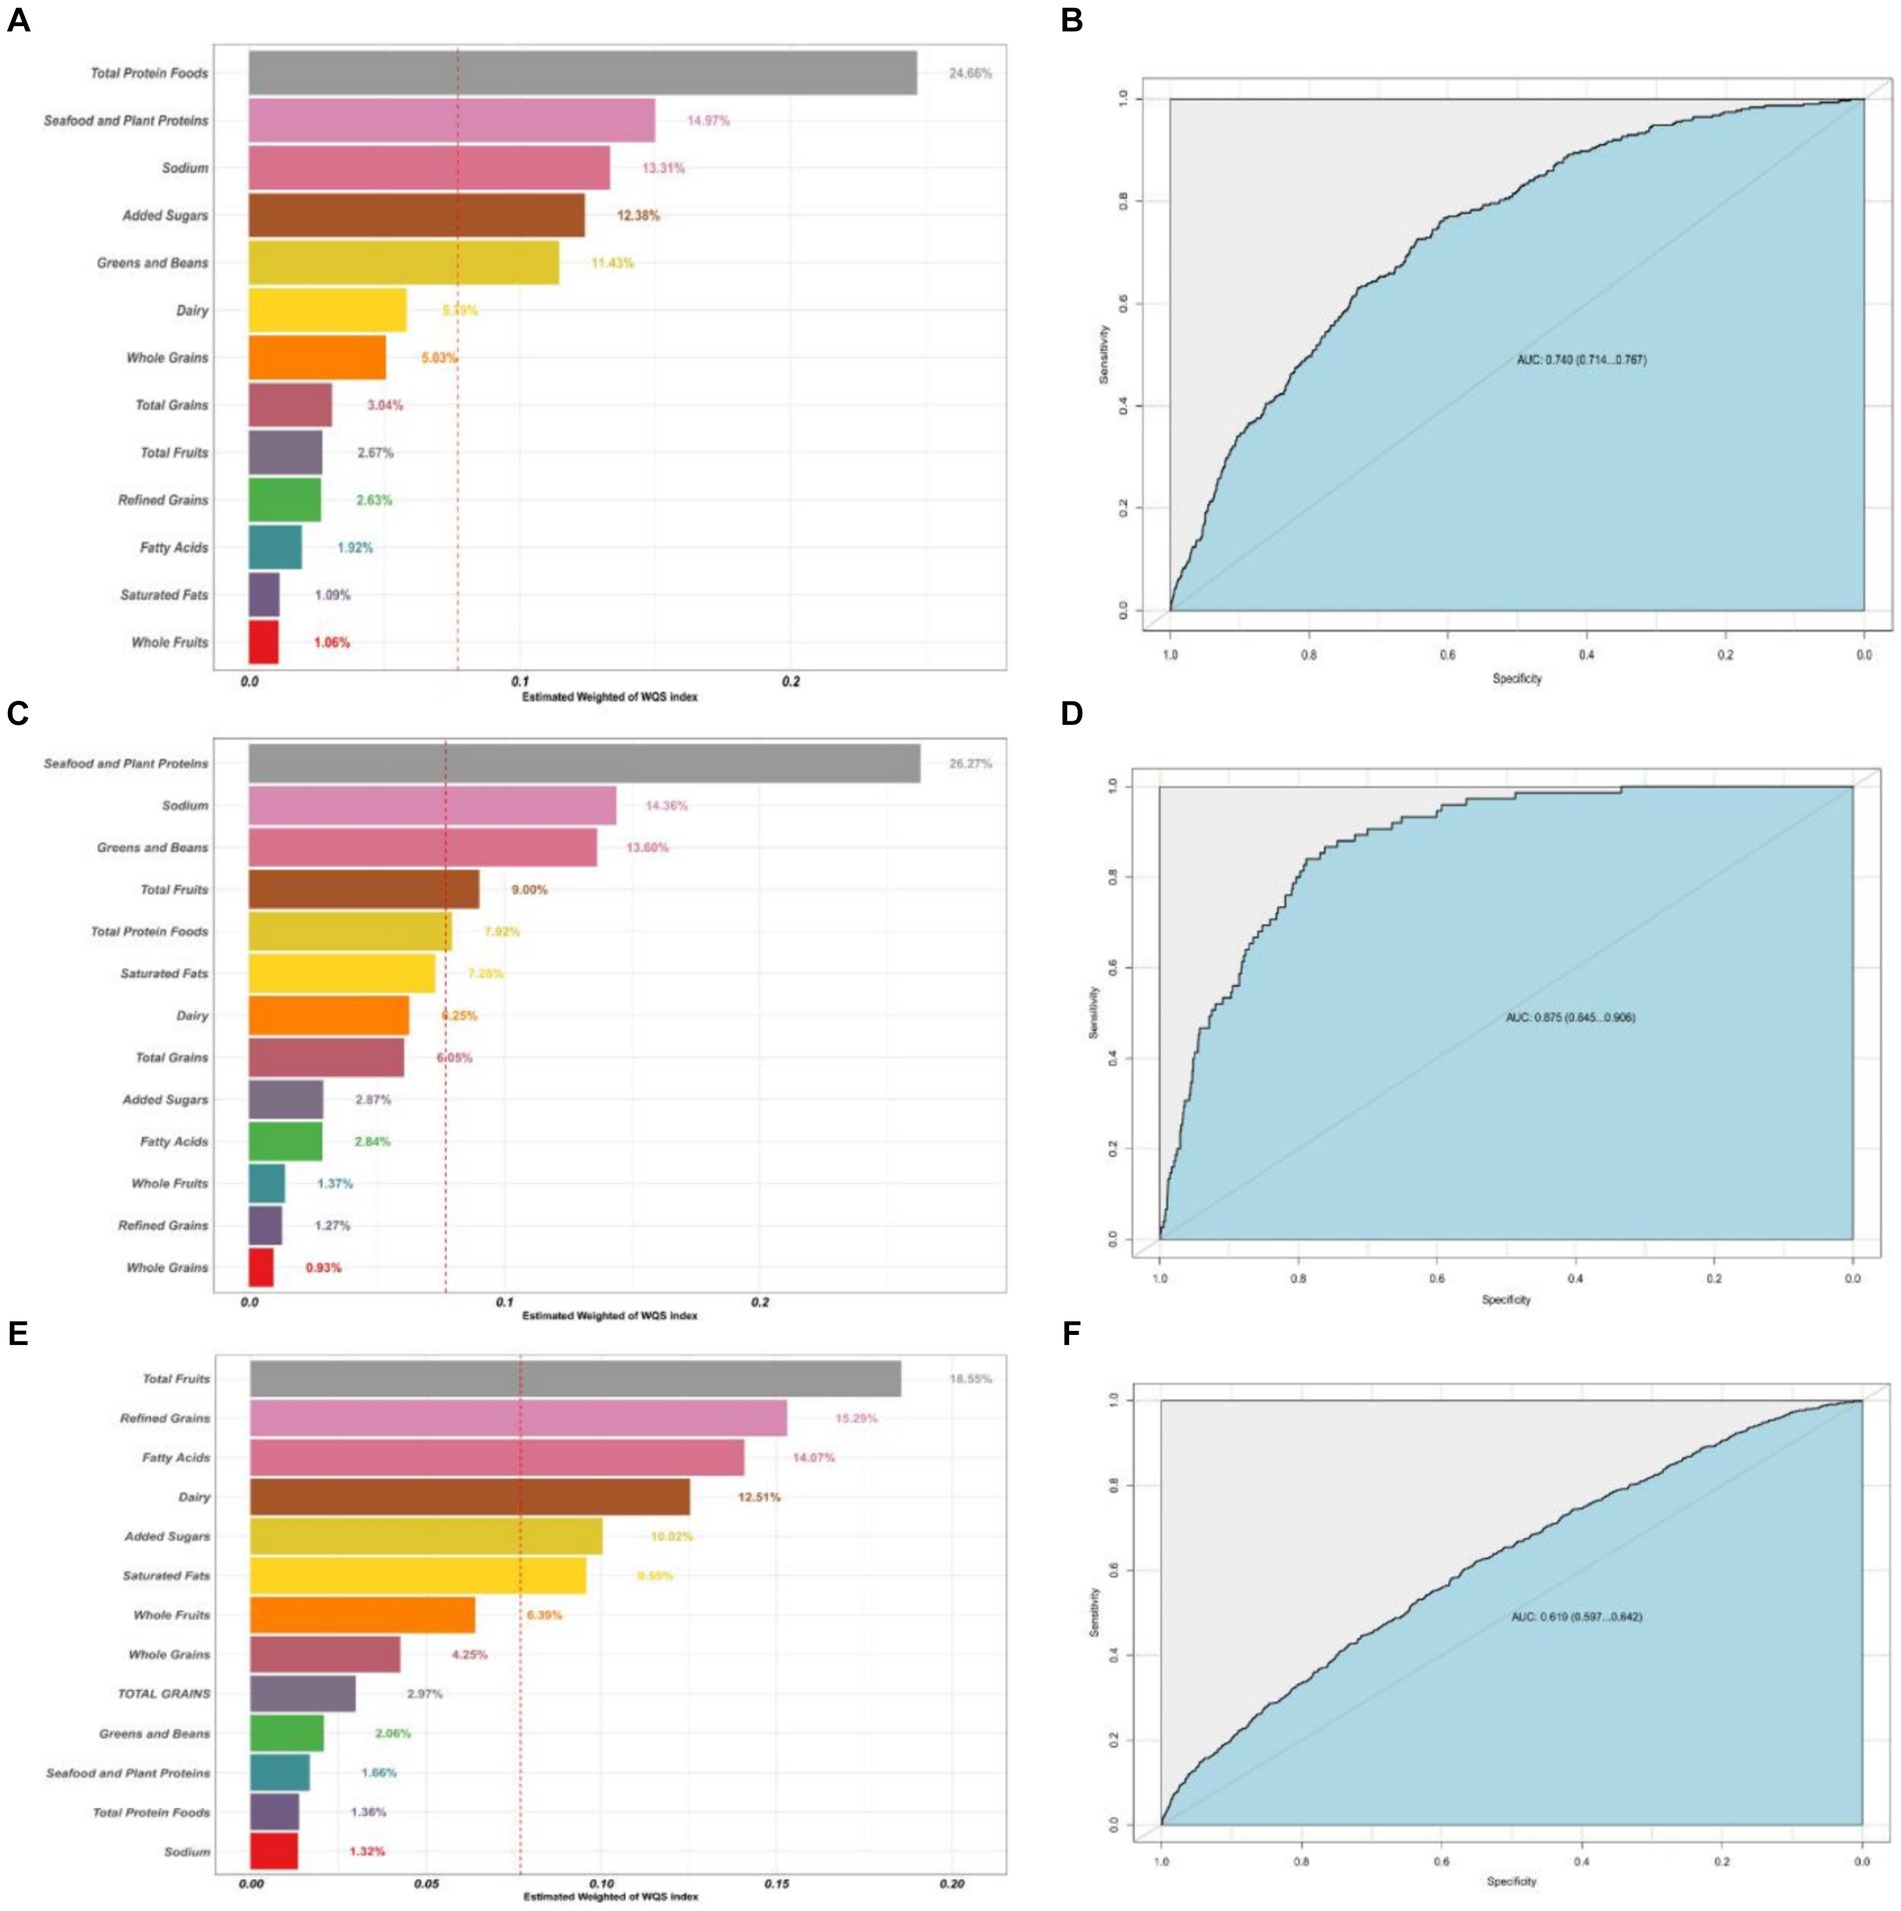
Figure 3. Contribution weights of dietary components in the WQS model of CB (A) and the AUCs of the WQS models (B). Contribution weights of dietary components in the WQS model of emphysema (C) and the AUCs of the WQS models (D). Contribution weights of dietary components in the WQS model of asthma (E) and the AUCs of the WQS models (F). All models adjusted for sex, age, education, family income, BMI status, physical activity, smoking status, drinking status, hypertension, diabetes.
Figure 4 shows the results of the mixed effects of dietary components on the risk of CRD in the qgcomp model. The results showed that the dietary components whose health contribution was the greatest in the three models of CRD were, Total Protein Foods; Seafood and Plant Proteins; and Whole Fruits, respectively.

Figure 4. Contribution weights of dietary components in the qgcomp model of CB (A) and the trends visualization of qgcomp model (B). Contribution weights of dietary components in the qgcomp model of emphysema (C) and the Trends Visualization of qgcomp model (D). Contribution weights of dietary components in the qgcomp model of asthma (E) and the Trends Visualization of qgcomp model (F). All models adjusted for sex, age, education, family income, BMI status, physical activity, smoking status, drinking status, hypertension, diabetes.
Discussion
Our study included 4,499 U.S. adult subjects who could represent 103.6 million non-institutionalized adult U.S. population after appropriate weighting. We have found, after multiple model validations, that higher dietary quality, as represented by the HEI-2020 score, is associated with lower risk of the three CRD (CB, emphysema and asthma) in the U.S. adult population. Among different population proportions, different HEI classification methods, and different analytical models, this result is stable. Negative dose-response relationships between HEI-2020 scores and risk of the three CRD were found in both the RCS and GAM models. The WQS and qgcomp similarly found a health effect of the HEI-2020 mixed effect for the three CRD. It suggesting that the relationship between dietary quality and risk of CRD is similarly independent of HEI-2020 in terms of model type and inclusion criteria in the model. In the mixed health effects of 13 dietary components on respiratory health from HEI-2020, Total Protein Foods were found to make the greatest health contribution to CB risk, Seafood and Plant Proteins made the greatest health contribution to emphysema risk; and fruits made the greatest health contribution to asthma risk.
Western dietary patterns rich in preserved and processed meat foods have also been associated with a higher risk of chronic respiratory disease, possibly due to the higher inflammatory stress associated with high sugar and salt intake associated with nitrite in processed foods (42, 43). A study of diets and COPD risk in U.S. adults found that the better the quality of the diet represented by the Dietary Approaches to Stop Hypertension (DASH) score and Mediterranean diets score, the lower the risk of COPD (44). Similarly, the health contributions of DASH diets and Mediterranean diets to lung health have likewise been reported in other studies (45–48). A study by Alwarith et al. also found that a plant-based diet prevented asthma attacks and improved symptoms, possibly because fruit and vegetable intake may mediate the release of cytokines, free radical damage, and immune responses associated with the onset and development of asthma (49). These results are consistent with the results of the present study. In contrast to these dietary patterns, the dietary patterns represented by the HEI, established by official U.S. agencies, are more appropriate for the U.S. population. The HEI’s quantification of dietary intake in terms of energy density is also more suitable for individual use.
In the present study, the dose–response relationship between dietary score and disease risk was also examined and sensitivity analyzed, and the RCS and GAM results showed a negative dose-response between dietary score and respiratory disease risk. This is also in line with the general perception of healthy diets in good health. Similarly, we used the mixed effects of the 13 dietary components to replace the total HEI-2020 score to further validate the association between dietary quality and respiratory disease risk, while exploring the contribution of different food groups in it. The results of WQS and G-computation modeling showed that there was a healthy mixing effect of the 13 dietary components of the HEI-2020 in respiratory disease risk with the trend of the relationship between HEI-2020 scores and respiratory disease risk. Appropriately elevated intake of total protein foods, seafood and plant proteins, and fruits reduced disease risk of CRD.
An observational study in Iceland found that low protein intake was associated with risk of malnutrition, length of hospitalization, and mortality in COPD patients (50). Another observational study from the National Lung Hospital (NLH) in Hanoi, Vietnam, also found a high prevalence of malnutrition among COPD patients, and that increasing energy- and protein-rich foods may help to improve the nutritional status and quality of life of Vietnamese COPD patients (51). Nutritional therapy has been shown to be effective in maintaining and improving muscle strength and exercise tolerance in malnourished COPD patients (52). Low body weight and low fat-free body weight (FFM) have been identified as poor prognostic factors in patients with COPD, and relevant populations and clinical trials have found that high-quality protein or supplementation with essential amino acids can increase FFM index and improve arterial oxygen levels (53, 54). A study of protein absorption and utilization in patients with COPD identified low protein intake, systemic inflammation, and hypertension as risk factors for lower postabsorptive protein balance in patients with COPD, and lower post-absorptive protein balance was associated with markers of poorer daily physical function (55). Two large cohort studies in the United States found higher marine fish intake was associated with a lower risk of COPD (56). These studies all reflect the healthy role of protein, seafood and fruit and vegetable intake in respiratory health.
This study has certain strengths, most notably, it utilized a multi-model sensitivity analysis design, with different sample population proportions, different ways of defining variables, and different models validating each other to make the results more realistic and reliable. The second is the use of a large U.S. Nutrition and Health Survey database, which is reliable and representative; and lastly, the use of the latest version of the Healthy Dietary Index, HEI-2020, which is based on DGA2020–2025, which is representative of the U.S. population’s dietary intake. As well, there are shortcomings in this study, the largest being that this was a cross-sectional study and could not validate the causal link between dietary quality and the risk of chronic respiratory disease. Secondly, definition of disease from my self-report, with possible recall bias that cannot be eliminated. Third, the study focused on the U.S. adult population, with insufficient extrapolation to pre-adult U.S. and non-U.S. populations.
The study found that high HEI-2020 scores were associated with low chronic respiratory risk, suggesting that improving the quality of the diet itself by following DGA 2020–2025 could help prevent the occurrence and exacerbation of chronic respiratory diseases.
Conclusion
Higher HEI scores are associated with lower risk of chronic respiratory disease, and this trend is more stable and reliable. More attention should be given to overall dietary intake of high-quality protein, seafood, vegetables, and fruits.
Data availability statement
The original contributions presented in the study are included in the article/supplementary material, further inquiries can be directed to the corresponding author.
Author contributions
LZ: Funding acquisition, Writing – original draft, Writing – review & editing. ZS: Data curation, Writing – original draft. ZL: Software, Writing – original draft. LJ: Data curation, Supervision, Writing – original draft. DX: Investigation, Software, Writing – original draft. QL: Investigation, Software, Writing – original draft. SY-M: Data curation, Visualization, Writing – review & editing. ZH: Data curation, Supervision, Writing – review & editing. NJ: Formal analysis, Methodology, Software, Supervision, Writing – review & editing. LH: Writing – original draft, Writing – review & editing. FS: Writing – review & editing.
Funding
The author(s) declare that financial support was received for the research, authorship, and/or publication of this article. This study has received grants from the Natural Science Foundation of Hubei Province (2023AFD138), Support Program for TCM Innovation Teams and Talents of the State Administration of Traditional Chinese Medicine (No: ZYYCXTD-D-202203), and Hubei University of Traditional Chinese Medicine “double first-class” construction of key categories of special research projects (5432-1005032204).
Conflict of interest
The authors declare that the research was conducted in the absence of any commercial or financial relationships that could be construed as a potential conflict of interest.
Publisher’s note
All claims expressed in this article are solely those of the authors and do not necessarily represent those of their affiliated organizations, or those of the publisher, the editors and the reviewers. Any product that may be evaluated in this article, or claim that may be made by its manufacturer, is not guaranteed or endorsed by the publisher.
References
1. Kim, V, and Criner, GJ. Chronic bronchitis and chronic obstructive pulmonary disease. Am J Respir Crit Care Med. (2013) 187:228–37. doi: 10.1164/rccm.201210-1843CI
2. Kheradmand, F, Zhang, Y, and Corry, DB. Contribution of adaptive immunity to human COPD and experimental models of emphysema. Physiol Rev. (2023) 103:1059–93. doi: 10.1152/physrev.00036.2021
3. Sockrider, M, and Fussner, L. What is asthma? Am J Respir Crit Care Med. (2020) 202:P25–6. doi: 10.1164/rccm.2029P25
4. Papi, A, Brightling, C, Pedersen, SE, and Reddel, HK. Asthma. Lancet. (2018) 391:783–800. doi: 10.1016/S0140-6736(17)33311-1
5. Christenson, SA, Smith, BM, Bafadhel, M, and Putcha, N. Chronic obstructive pulmonary disease. Lancet. (2022) 399:2227–42. doi: 10.1016/S0140-6736(22)00470-6
6. Gaffney, AW, Hawks, L, Bor, D, White, AC, Woolhandler, S, McCormick, D, et al. National Trends and disparities in health care access and coverage among adults with asthma and COPD: 1997–2018. Chest. (2021) 159:2173–82. doi: 10.1016/j.chest.2021.01.035
7. Global, regional, and national deaths, prevalence, disability-adjusted life years, and years lived with disability for chronic obstructive pulmonary disease and asthma, 1990–2015: a systematic analysis for the global burden of disease study 2015. Lancet Respir Med. (2017) 5:691–706. doi: 10.1016/S2213-2600(17)30293-X
8. Racanelli, AC, Kikkers, SA, Choi, AMK, and Cloonan, SM. Autophagy and inflammation in chronic respiratory disease. Autophagy. (2018) 14:221–32. doi: 10.1080/15548627.2017.1389823
9. Budden, KF, Shukla, SD, Rehman, SF, Bowerman, KL, Keely, S, Hugenholtz, P, et al. Functional effects of the microbiota in chronic respiratory disease. Lancet Respir Med. (2019) 7:907–20. doi: 10.1016/S2213-2600(18)30510-1
10. Cosío, BG, Hernández, C, Chiner, E, Gimeno-Santos, E, Pleguezuelos, E, Seijas, N, et al. Spanish COPD guidelines (GesEPOC 2021): non-pharmacological treatment update. Arch Bronconeumol. (2022) 58:345–51. doi: 10.1016/j.arbres.2021.08.010
11. Mirza, S, Clay, RD, Koslow, MA, and Scanlon, PD. COPD guidelines: a review of the 2018 GOLD report. Mayo Clin Proc. (2018) 93:1488–502. doi: 10.1016/j.mayocp.2018.05.026
12. McDonald, VM, Gibson, PG, Scott, HA, Baines, PJ, Hensley, MJ, Pretto, JJ, et al. Should we treat obesity in COPD? The effects of diet and resistance exercise training. Respirology. (2016) 21:875–82. doi: 10.1111/resp.12746
13. Smit, HA . Chronic obstructive pulmonary disease, asthma and protective effects of food intake: from hypothesis to evidence? Respir Res. (2001) 2:261–4. doi: 10.1186/rr65
14. Wang, K, Zhao, Y, Nie, J, Xu, H, Yu, C, and Wang, S. Higher HEI-2015 score is associated with reduced risk of depression: result from NHANES 2005-2016. Nutrients. (2021) 13:20348. doi: 10.3390/nu13020348
15. Tian, T, Zhang, J, Xie, W, Ni, Y, Fang, X, Liu, M, et al. Dietary quality and relationships with metabolic dysfunction-associated fatty liver disease (MAFLD) among United States adults, results from NHANES 2017–2018. Nutrients. (2022) 14:14505. doi: 10.3390/nu14214505
16. Shan, Z, Li, Y, Baden, MY, Bhupathiraju, SN, Wang, DD, Sun, Q, et al. Association between healthy eating patterns and risk of cardiovascular disease. JAMA Intern Med. (2020) 180:1090–100. doi: 10.1001/jamainternmed.2020.2176
17. Guenther, PM, Casavale, KO, Reedy, J, Kirkpatrick, SI, Hiza, HAB, Kuczynski, KJ, et al. Update of the healthy eating index: HEI-2010. J Acad Nutr Diet. (2013) 113:569–80. doi: 10.1016/j.jand.2012.12.016
18. Krebs-Smith, SM, Pannucci, TRE, Subar, AF, Kirkpatrick, SI, Lerman, JL, Tooze, JA, et al. Update of the healthy eating index: HEI-2015. J Acad Nutr Diet. (2018) 118:1591–602. doi: 10.1016/j.jand.2018.05.021
19. Lerman, JL, Herrick, KA, Pannucci, TRE, Shams-White, MM, Kahle, LL, Zimmer, M, et al. Evaluation of the healthy eating index-Toddlers-2020. J Acad Nutr Diet. (2023) 123:1307–19. doi: 10.1016/j.jand.2023.05.014
20. Phillips, JA . Dietary guidelines for Americans, 2020-2025. Workplace Health Saf. (2021) 69:395. doi: 10.1177/21650799211026980
21. Shams-White, MM, Pannucci, TRE, Lerman, JL, Herrick, KA, Zimmer, M, Meyers Mathieu, K, et al. Healthy eating Index-2020: review and update process to reflect the dietary guidelines for Americans, 2020-2025. J Acad Nutr Diet. (2023) 123:1280–8. doi: 10.1016/j.jand.2023.05.015
23. Nie, J, Deng, MG, Wang, K, Liu, F, Xu, H, Feng, Q, et al. Higher HEI-2015 scores are associated with lower risk of gout and hyperuricemia: results from the national health and nutrition examination survey 2007–2016. Front Nutr. (2022) 9:921550. doi: 10.3389/fnut.2022.921550
24. Heredia, NI, Zhang, X, Balakrishnan, M, Daniel, CR, Hwang, JP, McNeill, LH, et al. Physical activity and diet quality in relation to non-alcoholic fatty liver disease: a cross-sectional study in a representative sample of U.S. adults using NHANES 2017–2018. Prev Med. (2022) 154:106903. doi: 10.1016/j.ypmed.2021.106903
25. Rahman, HH, Niemann, D, and Munson-McGee, SH. Association between asthma, chronic bronchitis, emphysema, chronic obstructive pulmonary disease, and lung cancer in the US population. Environ Sci Pollut Res Int. (2023) 30:20147–58. doi: 10.1007/s11356-022-23631-3
26. Chen-Xu, M, Yokose, C, Rai, SK, Pillinger, MH, and Choi, HK. Contemporary prevalence of gout and hyperuricemia in the United States and decadal trends: the National Health and nutrition examination survey, 2007–2016. Arthritis Rheumatology. (2019) 71:991–9. doi: 10.1002/art.40807
27. Scales, CD, Smith, AC, Hanley, JM, and Saigal, CS. Prevalence of kidney stones in the United States. Eur Urol. (2012) 62:160–5. doi: 10.1016/j.eururo.2012.03.052
28. Scholes, S, and Bann, D. Education-related disparities in reported physical activity during leisure-time, active transportation, and work among US adults: repeated cross-sectional analysis from the National Health and nutrition examination surveys, 2007 to 2016. BMC Public Health. (2018) 18:1–10. doi: 10.1186/s12889-018-5857-z
29. Dong, L, Xie, Y, and Zou, X. Association between sleep duration and depression in US adults: a cross-sectional study. J Affect Disord. (2022) 296:183–8. doi: 10.1016/j.jad.2021.09.075
30. MacGregor, KA, Gallagher, IJ, and Moran, CN. Relationship between insulin sensitivity and menstrual cycle is modified by BMI, fitness, and physical activity in NHANES. J Clin Endocrinol Metab. (2021) 106:2979–90. doi: 10.1210/clinem/dgab415
31. Tian, X, Xue, B, Wang, B, Lei, R, Shan, X, Niu, J, et al. Physical activity reduces the role of blood cadmium on depression: a cross-sectional analysis with NHANES data. Environ Pollut. (2022) 304:119211. doi: 10.1016/j.envpol.2022.119211
32. ALHarthi, SSY, Natto, ZS, Midle, JB, Gyurko, R, O’Neill, R, et al. Association between time since quitting smoking and periodontitis in former smokers in the National Health and nutrition examination surveys (NHANES) 2009 to 2012. J Periodontol. (2019) 90:16–25. doi: 10.1002/JPER.18-0183
33. Santos, D, and Dhamoon, MS. Trends in antihypertensive medication use among individuals with a history of stroke and hypertension, 2005 to 2016. JAMA Neurol. (2020) 77:1382–9. doi: 10.1001/jamaneurol.2020.2499
34. Saydah, SH, Siegel, KR, Imperatore, G, Mercado, C, and Gregg, EW. The cardiometabolic risk profile of young adults with diabetes in the US. Diabetes Care. (2019) 42:1895–902. doi: 10.2337/dc19-0707
35. Mendes, M d A, da Silva, I, Ramires, V, Reichert, F, Martins, R, Ferreira, R, et al. Metabolic equivalent of task (METs) thresholds as an indicator of physical activity intensity. PLoS One. (2018) 13:e0200701. doi: 10.1371/journal.pone.0200701
36. Chen, L, Cai, M, Li, H, Wang, X, Tian, F, Wu, Y, et al. Risk/benefit tradeoff of habitual physical activity and air pollution on chronic pulmonary obstructive disease: findings from a large prospective cohort study. BMC Med. (2022) 20:70. doi: 10.1186/s12916-022-02274-8
37. Golub, JS, Brickman, AM, Ciarleglio, AJ, Schupf, N, and Luchsinger, JA. Association of Subclinical Hearing Loss with Cognitive Performance. JAMA Otolaryngol Head Neck Surg. (2020) 146:57–67. doi: 10.1001/jamaoto.2019.3375
38. Tao, C, Huang, Y, Huang, X, Li, Z, Fan, Y, Zhang, Y, et al. Association between blood manganese levels and visceral adipose tissue in the United States: a population-based study. Nutrients. (2022) 14:224770. doi: 10.3390/nu14224770
39. Chen, L, Sun, Q, Peng, S, Tan, T, Mei, G, Chen, H, et al. Associations of blood and urinary heavy metals with rheumatoid arthritis risk among adults in NHANES, 1999–2018. Chemosphere. (2022) 289:133147. doi: 10.1016/j.chemosphere.2021.133147
40. Wan, H, Jiang, Y, Yang, J, Ma, Q, Liu, L, Peng, L, et al. Sex-specific associations of the urinary fourteen-metal mixture with NAFLD and liver fibrosis among US adults: a nationally representative study. Ecotoxicol Environ Saf. (2022) 248:114306. doi: 10.1016/j.ecoenv.2022.114306
41. Yu, G, Jin, M, Huang, Y, Aimuzi, R, Zheng, T, Nian, M, et al. Environmental exposure to perfluoroalkyl substances in early pregnancy, maternal glucose homeostasis and the risk of gestational diabetes: a prospective cohort study. Environ Int. (2021) 156:106621. doi: 10.1016/j.envint.2021.106621
42. Guilleminault, L, Williams, E, Scott, H, Berthon, B, Jensen, M, and Wood, L. Diet and asthma: is it time to adapt our message? Nutrients. (2017) 9:111227. doi: 10.3390/nu9111227
43. van Iersel, LEJ, Beijers, RJHCG, Gosker, HR, and Schols, AMWJ. Nutrition as a modifiable factor in the onset and progression of pulmonary function impairment in COPD: a systematic review. Nutr Rev. (2022) 80:1434–44. doi: 10.1093/nutrit/nuab077
44. Wen, J, Gu, S, Wang, X, and Qi, X. Associations of adherence to the DASH diet and the Mediterranean diet with chronic obstructive pulmonary disease among US adults. Front Nutr. (2023) 10:1031071. doi: 10.3389/fnut.2023.1031071
45. Ardestani, ME, Onvani, S, Esmailzadeh, A, Feizi, A, and Azadbakht, L. Adherence to dietary approaches to stop hypertension (DASH) dietary pattern in relation to chronic obstructive pulmonary disease (COPD): a case-control study. J Am Coll Nutr. (2017) 36:549–55. doi: 10.1080/07315724.2017.1326858
46. Neelakantan, N, Koh, W-P, Yuan, J-M, and van Dam, RM. Diet-quality indexes are associated with a lower risk of cardiovascular, respiratory, and all-cause mortality among Chinese adults. J Nutr. (2018) 148:1323–32. doi: 10.1093/jn/nxy094
47. Dominguez, LJ, Di Bella, G, Veronese, N, and Barbagallo, M. Impact of Mediterranean diet on chronic non-communicable diseases and longevity. Nutrients. (2021) 13:62028. doi: 10.3390/nu13062028
48. Gutiérrez-Carrasquilla, L, Sánchez, E, Hernández, M, Polanco, D, Salas-Salvadó, J, Betriu, À, et al. Effects of Mediterranean diet and physical activity on pulmonary function: a cross-sectional analysis in the ILERVAS project. Nutrients. (2019) 11:20329. doi: 10.3390/nu11020329
49. Alwarith, J, Kahleova, H, Crosby, L, Brooks, A, Brandon, L, Levin, SM, et al. The role of nutrition in asthma prevention and treatment. Nutr Rev. (2020) 78:928–38. doi: 10.1093/nutrit/nuaa005
50. Ingadottir, AR, Beck, AM, Baldwin, C, Weekes, CE, Geirsdottir, OG, Ramel, A, et al. Association of energy and protein intakes with length of stay, readmission and mortality in hospitalised patients with chronic obstructive pulmonary disease. Br J Nutr. (2018) 119:543–51. doi: 10.1017/S0007114517003919
51. Nguyen, HT, Collins, PF, Pavey, TG, Nguyen, NV, Pham, TD, and Gallegos, DL. Nutritional status, dietary intake, and health-related quality of life in outpatients with COPD. Int J Chron Obstruct Pulmon Dis. (2019) 14:215–26. doi: 10.2147/COPD.S181322
52. Collins, PF, Stratton, RJ, and Elia, M. Nutritional support in chronic obstructive pulmonary disease: a systematic review and meta-analysis. Am J Clin Nutr. (2012) 95:1385–95. doi: 10.3945/ajcn.111.023499
53. Engelen, MPKJ, Rutten, EPA, de Castro, CLN, Wouters, EFM, Schols, AMWJ, et al. Supplementation of soy protein with branched-chain amino acids alters protein metabolism in healthy elderly and even more in patients with chronic obstructive pulmonary disease. Am J Clin Nutr. (2007) 85:431–9. doi: 10.1093/ajcn/85.2.431
54. Dal Negro, RW, Aquilani, R, Bertacco, S, Boschi, F, Micheletto, C, and Tognella, S. Comprehensive effects of supplemented essential amino acids in patients with severe COPD and sarcopenia. Monaldi Arch Chest Dis. (2010) 73:25–33. doi: 10.4081/monaldi.2010.310
55. Cruthirds, CL, Deutz, NEP, Harrykissoon, R, Zachria, AJ, and Engelen, MPKJ. A low postabsorptive whole body protein balance is associated with markers of poor daily physical functioning in chronic obstructive pulmonary disease. Clin Nutr. (2022) 41:885–93. doi: 10.1016/j.clnu.2022.02.018
Keywords: HEI-2020, chronic bronchitis, emphysema, astham, NHANES
Citation: Zhiyi L, Shuhan Z, Libing Z, Jiaqi L, Xin D, Lingxi Q, Yuan-Mei S, Hong Z, Jiaqi N, Hui L and Sanyou F (2024) Association of the Healthy Dietary Index 2020 and its components with chronic respiratory disease among U.S. adults. Front. Nutr. 11:1402635. doi: 10.3389/fnut.2024.1402635
Edited by:
Sui Kiat Chang, Universiti Tunku Abdul Rahman, MalaysiaReviewed by:
Siew Siew Lee, University of Nottingham Malaysia Campus, MalaysiaSiew Tin Tan, International Medical University, Malaysia
Copyright © 2024 Zhiyi, Shuhan, Libing, Jiaqi, Xin, Lingxi, Yuan-Mei, Hong, Jiaqi, Hui and Sanyou. This is an open-access article distributed under the terms of the Creative Commons Attribution License (CC BY). The use, distribution or reproduction in other forums is permitted, provided the original author(s) and the copyright owner(s) are credited and that the original publication in this journal is cited, in accordance with accepted academic practice. No use, distribution or reproduction is permitted which does not comply with these terms.
*Correspondence: Li Hui, bGlodWlfYmVhdXR5XzEwMDZAMTYzLmNvbQ==; Fang Sanyou, NTc3ODA4NzYzQHFxLmNvbQ==
†These authors have contributed equally to this work