 Fatemeh S. Hosseini1
 Ali Nikparast
 Elahe Etesami
 Fatemeh Javaheri-Tafti
 Golaleh Asghari
- 1Department of Nutrition, Science and Research Branch, Islamic Azad University, Tehran, Iran
- 2Department of Clinical Nutrition & Dietetics, Faculty of Nutrition Science and Food Technology, Shahid Beheshti University of Medical Sciences, Tehran, Iran
- 3Cancer Research Center, Shahid Beheshti University of Medical Sciences, Tehran, Iran
Background/aim: Current evidence indicates a correlation between the inflammatory potential of diet and the risk of cancer and cancer-specific mortality. This study aimed to assess the association between empirical dietary inflammatory pattern (EDIP), which has recently been designed based on the inflammatory potential of the diet, and the risk of cancer and cancer-specific mortality.
Methods: A systematic literature search was conducted across the PubMed/Medline, Scopus, and Web of Science databases from January 2016 to March 2024. A random effects model was used to calculate the pooled effect size (ES) and 95% confidence intervals (95% CI). Heterogeneity between studies was assessed using the Cochran Q test and the I2 statistic.
Results: From the initial 229 records, 24 prospective cohort studies with 2,683,350 participants and 37,091 cancer incidence cases, as well as 20,819 cancer-specific mortality, were included in our study. Pooled results indicated a significant association between higher adherence to the EDIP and an increased risk of total cancer (ES: 1.10; 95% CI: 1.05–1.15; I2 = 41.1), colorectal cancer (ES: 1.19; 95% CI: 1.11–1.27; I2 = 41.1), and liver cancer (ES: 1.48; 95% CI: 1.14–1.94; I2 = 36.9). However, no significant association between increased adherence to the EDIP and an increased risk of ovarian or endometrial cancer was found. Furthermore, greater adherence to the EDIP was significantly associated with an increased risk of cancer-specific mortality (ES: 1.18; 95% CI: 1.05–1.33; I2 = 45.4).
Conclusion: Our results showed that a diet with higher inflammatory properties is associated with an increased risk of cancer and cancer-specific mortality.
Systematic review registration: PROSPERO registration no. CRD42024496912.
Introduction
The incidence of cancer is increasing at a concerning rate (1), and in 2015, it stood as the second most common cause of death, resulting in over 8.7 million fatalities worldwide (2). Cancer is associated with high rates of disability and premature mortality, also imposing a significant economic burden on healthcare systems (3, 4). Therefore, it is imperative to take a stand and find appropriate approaches to prevent this devastating illness.
According to the body of research, significant evidence supports the notion that low-grade chronic inflammation, characterized by the persistent rise of inflammatory cells and pro-inflammatory mediators, has a considerable impact on the increased risk of cancer and cancer-specific mortality (5). Several inflammatory mediators, such as C-reactive protein (CRP) and cytokines, including IL-1 (interleukin-1), IL-6, and TNF-α (tumor necrosis factor-alpha), have been reported to exert carcinogenesis effects through activation of downstream signaling pathways (6). The activation of these pathways may further facilitate angiogenesis and suppress the anti-tumor immune response (5, 6). On the other hand, according to existing research, diet plays an important role in regulating inflammation and the levels of inflammatory cytokines in the bloodstream (7–9). Therefore, assessing the inflammatory potential of diet and its ability to alter and regulate inflammation status can help manage and modify the levels of inflammatory biomarkers. In this context, in the recent decade, the inflammatory potential of diet indicators, such as the dietary inflammatory index (DII) (10), characterized as a literature-derived and population-based indicator, has been evaluated to determine the association between diet-related inflammation and the risk of morbidities such as cancer (11) and mortality (12). This index was developed based on a literature review of original articles between 1950 and 2010 that evaluated the effects of 45 dietary components, including macronutrients, micronutrients, flavonoids, spices, and other bioactive components, on the six most established inflammatory markers, IL-1β, IL-4, IL-6, IL-10 (as an anti-inflammatory component), TNF-α, and CRP (13). It should be noted that the DII index has several limitations. The DII is based on nutrients that cannot be accurately estimated due to different food compositions. Moreover, the DII focuses on single nutrients; however, individuals consume nutrients together in the form of food groups.
In the context of this framework, several new indices have been developed, including the Inflammatory Score of the Diet, the Anti-Inflammatory Diet Index, the Dietary and Lifestyle Inflammation Scores, and the Empirical Dietary Inflammatory Pattern (EDIP) (13). Among these, the EDIP, developed by Tabung et al., has attracted increased attention in recent years (14). This diet index is an empirically data-driven dietary pattern score (i.e., derived from a regression model fit a particular dataset) and identifies a dietary pattern according to 18 food groups, which are the most predictive for pro-inflammatory markers, including IL-6, TNF-α, and CRP (14). Furthermore, it should be noted that the EDIP has been validated to be highly effective in predicting inflammation biomarkers in three Harvard cohorts (14).
Recently, several observational studies have been conducted to assess the association between adherence to EDIP and the risk of cancer and cancer-specific mortality; however, their results have been inconclusive (15–19). In the Women’s Health Initiative, greater adherence to EDIP was significantly associated with a higher risk of total and site-specific cancer (including colorectal, endometrial, and breast cancer) (15). In contrast, findings from two prospective studies, including the Nurses’ Health Study I and Nurses’ Health Study II, revealed no significant association between greater adherence to EDIP and the risk of endometrial cancer (16). Regarding cancer-specific mortality, Li et al. (17) reported a significant association between greater adherence to EDIP and the risk of cancer-specific mortality; however, other studies did not find any significant association (18, 19). Therefore, our study aimed to conduct a systematic review and meta-analysis of prospective studies to investigate whether adherence to the EDIP can be associated with an increased risk of cancer and cancer-specific mortality.
Method
Research registry and standard guidelines
The current study was officially registered on the PROSPERO database with registration ID CRD42024496912 and was conducted in compliance with the PRISMA (Preferred Reporting Items for Systematic Reviews and Meta-Analysis) (see Supplementary Appendix S1) (20) and MOOSE (Meta-analysis of Observational Studies in Epidemiology) guidelines (21). The employed methodology for the search strategy, inclusion and exclusion criteria, and data extraction and analysis procedure were also based on the PECO framework, which stands for Population, Exposure, Comparator, and Outcome (Table 1). Briefly, prospective studies evaluating the association between adherence to the EDIP and the increased risk of total or site-specific cancer (as the primary outcome) and cancer-specific mortality (as the secondary outcome) among adults were included.
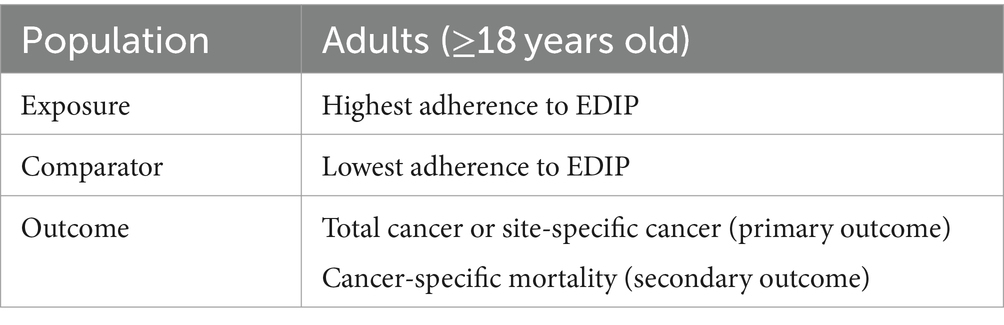
Table 1. Description of population, exposure, comparator, and outcome (PECO).
Data sources and search method
One researcher (EE) employed electronic searches of Scopus, PubMed/MEDLINE, and ISI Web of Science (WOS) databases to perform a comprehensive systematic review of the existing literature. An electronic systematic search was conducted from January 2016 to March 2024 and limited to English publications. We also imposed a time restriction due to the fact that the EDIP score was developed by Tabung et al. and published in 2016 (14). The methods employed for conducting electronic systematic database searches are delineated in Supplementary Table S1. In addition, the same researcher (EE) conducted a thorough manual search of the reference lists of all the included studies and relevant review articles to ensure that our search was comprehensive and that we did not miss any potentially relevant articles.
Inclusion and exclusion criteria
Studies with the following conditions were included in our systematic review and meta-analysis: (1) individuals who were 18 years of age and above; (2) the study design was prospective; (3) adherence to the EDIP was assessed as the exposure of interest; (4) the outcomes of interest included the risk of total cancer, site-specific, and cancer-specific mortality; and (5) studies reported the adjusted estimates (including odds ratio (OR), hazard ratio (HR), or relative risk (RR)), along with the corresponding 95% confidence interval (CI) as the effect size (ES) for the association between EDIP adherence and the risk of total and site-specific and cancer-specific mortality.
Publications were excluded from our study if there were (1) duplicated studies; (2) systematic review and meta-analysis; (3) clinical trial; (4) case reports, case series, editorials, commentaries, notes, letters, and conference abstracts; (5) animal, in vivo, and in vitro studies; (6) conducted among newborns, children, adolescents, pregnant mothers, and breastfeeding women population; (7) not available in full-text format; (8) studies that examined our outcome of interest in participants with the disease at baseline; and (9) insufficient data (without relevant ES and 95% CI for our primary and secondary outcomes).
Two investigators (FSH and EE) independently implemented a two-step selection process to find eligible studies. The first stage involved screening titles and abstracts of the identified studies. The second stage involved evaluating the full-length publications deemed relevant. Any discrepancies encountered during the investigation were resolved through constructive discussions with an additional investigator (GA).
Quality assessment
The quality of the included studies was assessed using the Newcastle-Ottawa Scale (NOS) in the present systematic review and meta-analysis (22). The NOS is a tool that was developed specifically for assessing the quality of non-randomized studies. The assessment of the quality of included studies in this scale is determined by a star system, which is determined by three criteria as follows: (1) selection of the study participants; (2) comparability of the groups; and (3) assessment of either the exposure or outcome of interest. Each item is subject to a maximum rating of one star, except for the comparability item, which can be awarded up to two stars. Publications scoring seven or higher were designated as high quality and low risk of bias. At the same time, those scoring below seven were classified as low quality and high risk of bias publications.
Data extraction
Two researchers, FJ and FSH, independently conducted an extensive evaluation of each eligible study. The data extracted from eligible studies were as follows: author’s name, publication year, identification of cohort (country and study name), sample characteristics (total and sex-stratified sample size) and number of cases, baseline age and body mass index (BMI) of participants, follow-up duration, person-years, dietary intake assessment method, outcome assessment method, outcome (total cancer, site-specific or cancer-specific mortality), variables adjusted in the multivariate analysis, fully adjusted ES with corresponding 95% CI for risk of total cancer, site-specific or cancer-specific mortality across adherence to EDIP categories. Additionally, any inconsistencies were addressed by discussing with a senior author supervising the work (GA).
Statistical analysis
Descriptive analysis was used to summarize the characteristics and the demographic details of the participants of the included studies. In order to begin the pooled ES estimate for the risk of total cancer, cancer-specific, or cancer mortality, we used the RR and corresponding 95% CI as the effect sizes for the main analysis. In addition, the HR reported in the original studies was considered equivalent to the relative risks (23). Furthermore, studies that reported effect sizes as odds ratios were converted to relative risk using the formula: RR = OR/[(1 − P0) + (P0 × OR)], in which P0 indicates the incidence of the outcome of interest in the non-exposed group according to the method of Zhang et al. (24). The pooled ES of total cancer, cancer-specific, or cancer mortality risk were calculated for the highest compared to the lowest adherence as well as per-SD increases in adherence to the EDIP using the DerSimonian and Laird random-effects model, which accounts for variation within and between studies (heterogeneity) (25). The Cochran Q test (P-heterogeneity) (26) and the I2 statistic (27) were used to evaluate the proportion of total variation attributable to heterogeneity between studies. When there was variation within the group, the level of significance for Cochran’s Q was deemed to be p < 0.10 (26). As per the I2 metrics, 25, 50, and 75% heterogeneity correspond to low, medium, and high degrees of heterogeneity, respectively (28). Subgroup and meta-regression analyses were performed to identify the potential source of the heterogeneity. Subgroup analyses were conducted based on the following factors: age (<55/>55 years), gender (men/women), number of population (<100,000/>100,000), outcome assessment method (medical record/pathologic report), body mass index (normal weight/overweight or obese), baseline type 2 diabetes mellitus (T2DM) status (yes/no), and adjustment for major confounders (total energy intake, supplement used, alcohol consumption, smoking status, physical activity, and family history of cancer). Sensitivity analysis was conducted to evaluate the robustness of the findings and determine whether the final pooled effect sizes were impacted by single or multiple publications using the one-study exclusion (leave-one-out) method. Publication bias was tested by visually inspecting the funnel plot and employing Egger’s regression test (29). All statistical analyses were performed utilizing STATA 17.0 (Stata Corporation, College Station, Texas, USA) software. A p-value <0.05 was considered as statistically significant.
Results
Literature search
Figure 1 briefly outlines the process of selecting relevant studies and obtaining references from electronic databases. During the initial electronic database search, we identified 229 relevant studies. Of these, 106 were from PubMed/MEDLINE, 63 from Scopus, and 60 from ISI Web of Sciences. After excluding duplicate publications (N = 100) and conducting a thorough screening of titles and abstracts to ensure relevance, a total of 27 publications were identified as potentially relevant and underwent comprehensive full-text evaluation. After the full-text evaluation, one study was excluded due to the lack of exposure to our interest, one was excluded due to the lack of outcome, and one was excluded due to insufficient data. Finally, 24 studies were included in our analysis (15–19, 30–48). Out of the 24 included studies, 16 reported the ES for the risk of cancer (15, 16, 31–36, 38–41, 45–48), six reported the ES for cancer-specific mortality, and two reported the ES for both the risk of cancer and cancer-specific mortality (19, 30).
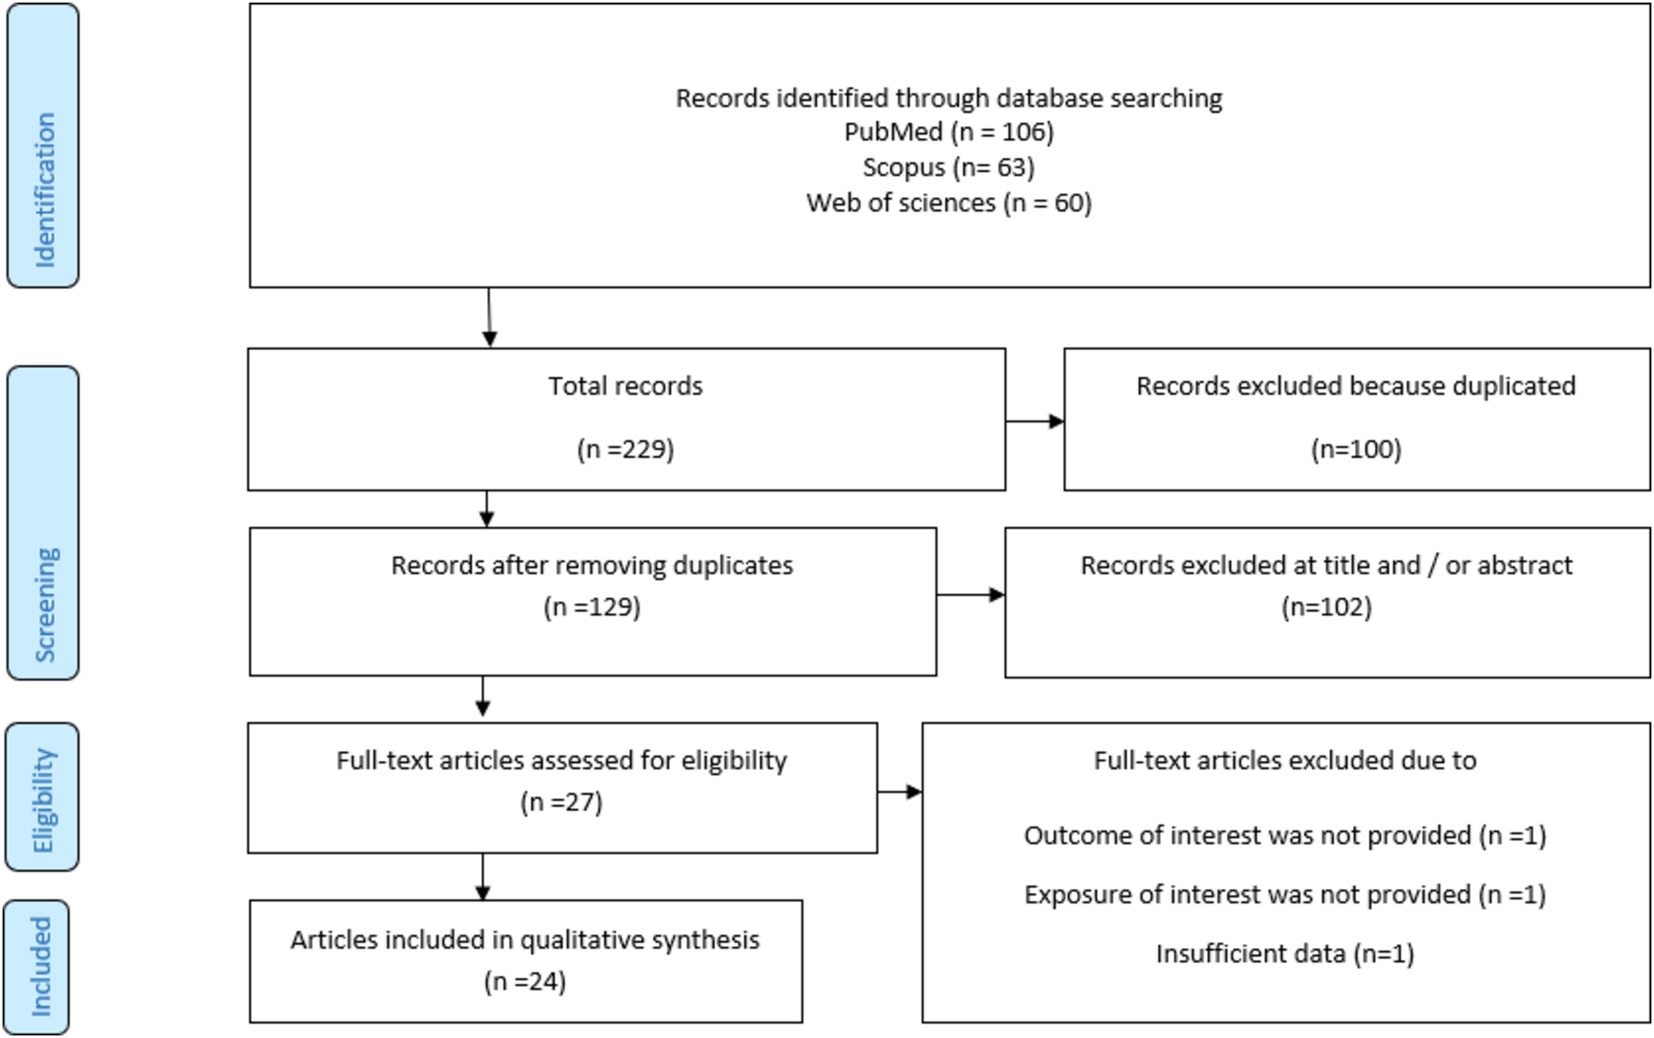
Figure 1. Flowchart of the included studies.
Characteristics of the included studies
The characteristics of the included studies are presented in Table 2. All the included studies were conducted in the United States and were published between 2017 and 2023, involving a total of 2,683,350 participants. The majority of the included studies were high quality.
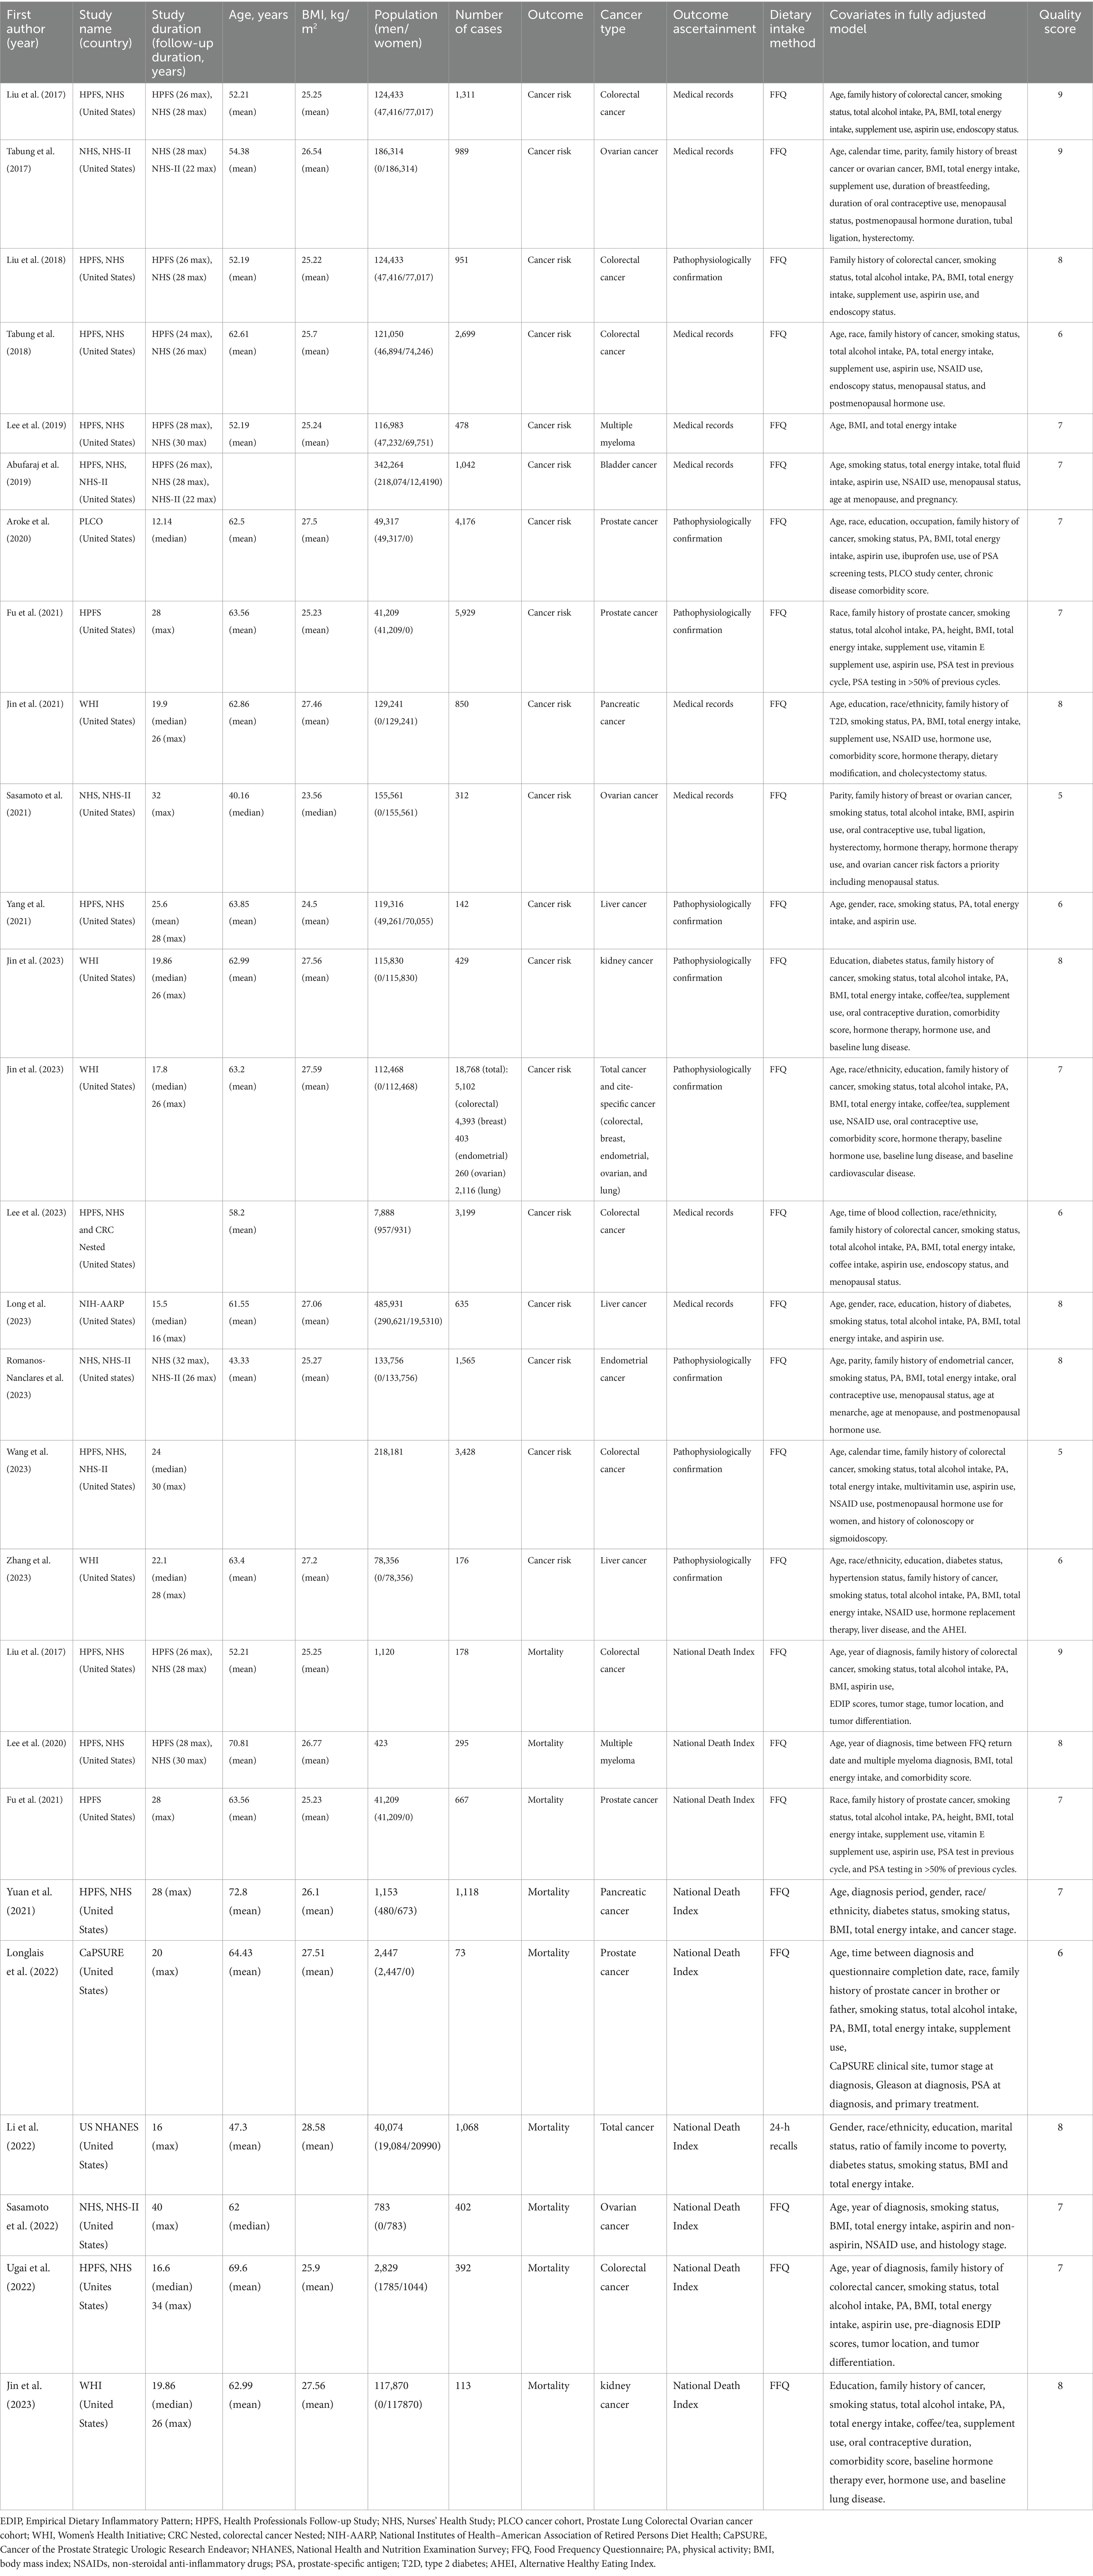
Table 2. Characteristics of included studies.
Cancer incidence
Eighteen studies evaluated the EDIP–cancer risk relationship with seven categories of cancer types, including gastrointestinal cancers [colorectal (15, 30, 32, 33, 45, 47), liver (41, 46, 48), pancreatic (39)], urological cancers [prostate (36, 38), bladder cancer (34), kidney cancer (19)], ovarian cancer [(15, 31, 40), endometrial cancer (15, 16), breast cancer (15), multiple myeloma (35), and lung cancer (15)]. These studies enrolled 2,662,531 participants, ranging from 1,048 to 485,931. Over a 16- to 32-year follow-up period, a total of 37,091 cases of cancer were documented, including 13,196 cases of colorectal cancer, 953 cases of liver cancer, 850 cases of pancreatic cancer, 10,105 cases of prostate cancer, 1,042 cases of bladder cancer, 429 cases of kidney cancer, 478 cases of multiple myeloma, 4,393 cases of breast cancer, 1,968 cases of endometrial cancer, 1,561 cases of ovarian cancer, and 176 cases of lung cancer. These studies employed a food frequency questionnaire (FFQ) to calculate the EDIP score. The mean age and BMI at baseline ranged from 38.43 to 63.85 and 24.5 to 27.59, respectively. Cancer incidence was obtained from medical reports in nine studies (30, 31, 33–35, 39, 40, 45, 46), and nine studies from pathology reports (15, 16, 19, 32, 36, 38, 41, 47, 48). The majority of the included studies controlled for some conventional risk factors, including total energy intake (n = 17), supplement use (n = 9), alcohol consumption (n = 11), smoking (n = 15), physical activity (n = 13), and family history of cancer (n = 13).
Cancer-specific mortality
Nine studies assessed the association between adherence to the EDIP and the risk of cancer-specific mortality (17–19, 30, 37, 38, 42–44), covering seven categories of cancer-specific mortality, including colorectal cancer (30, 44), prostate cancer (38, 43), pancreatic cancer (42), multiple myeloma (35), ovarian cancer (40), and kidney cancer (19). The studies included a total of 20,819 participants, ranging from 423 to 117,870. During a follow-up period spanning 16–40 years, a total of 5,006 cancer-specific mortality cases were recorded. These cases included 570 cases of colorectal cancer mortality, 740 cases of prostate cancer mortality, 1,118 cases of pancreatic cancer mortality, 295 cases of multiple myeloma mortality, 1,102 cases of ovarian cancer mortality, and 113 cases of kidney cancer mortality. Of the nine studies that evaluated the EDIP–cancer-specific mortality relationship, eight utilized the FFQ (18, 19, 30, 37, 38, 42–44), and one employed a 24-h recall questionnaire (17) to calculate the EDIP. The mean age and BMI of the participants at baseline exhibited a range between 47.3 and 72.3 years and 25.23 and 28.58 years, respectively. Cancer-specific mortality was obtained from the national death index in all included studies. Most of the included studies controlled for several conventional risk factors, including total energy intake (n = 8), supplement usage (n = 3), alcohol consumption (n = 5), smoking (n = 7), physical activity (n = 6), as well as family history of cancer (n = 4).
EDIP and cancer incidence
Figure 2 provides the pooled multivariate-adjusted ESs from the random-effects meta-analysis of the highest compared to the lowest categories of EDIP adherence and the risk of cancer. Twenty-five ES from 14 studies (15, 16, 30–34, 36, 39–41, 46–48) were included. The pooled ES was 1.10 (95% CI: 1.05–1.15), with a medium degree of heterogeneity (I2 = 41.1; P-heterogeneity = 0.018). Subgroup analysis showed that the quality of the studies and adjustment for alcohol consumption were all potential sources of heterogeneity (Table 3). The increased risk of cancer incidence also remained significant after stratification by age (<55, >55), gender (men/women), outcome assessment method (medical report/pathologic report), BMI (normal weight/overweight or obese), baseline T2DM status, quality of studies, and adjustment for total energy intake, supplement use, alcohol consumption, smoking status, physical activity, and family history of cancer (Table 3). In addition, according to the pooled stratified analysis by the number of participants, a significant association was found between greater adherence to the EDIP and an increased risk of cancer among studies with more than 100,000 participants. However, no significant association was observed for studies with less than 100,000 participants (Table 3). Follow-up duration stratified analysis also showed that a significant association was observed between greater EDIP adherence and an increased risk of cancer among studies with more than 20 years of follow-up. However, no significant association was observed for studies with less than 20 years of follow-up (Table 3).
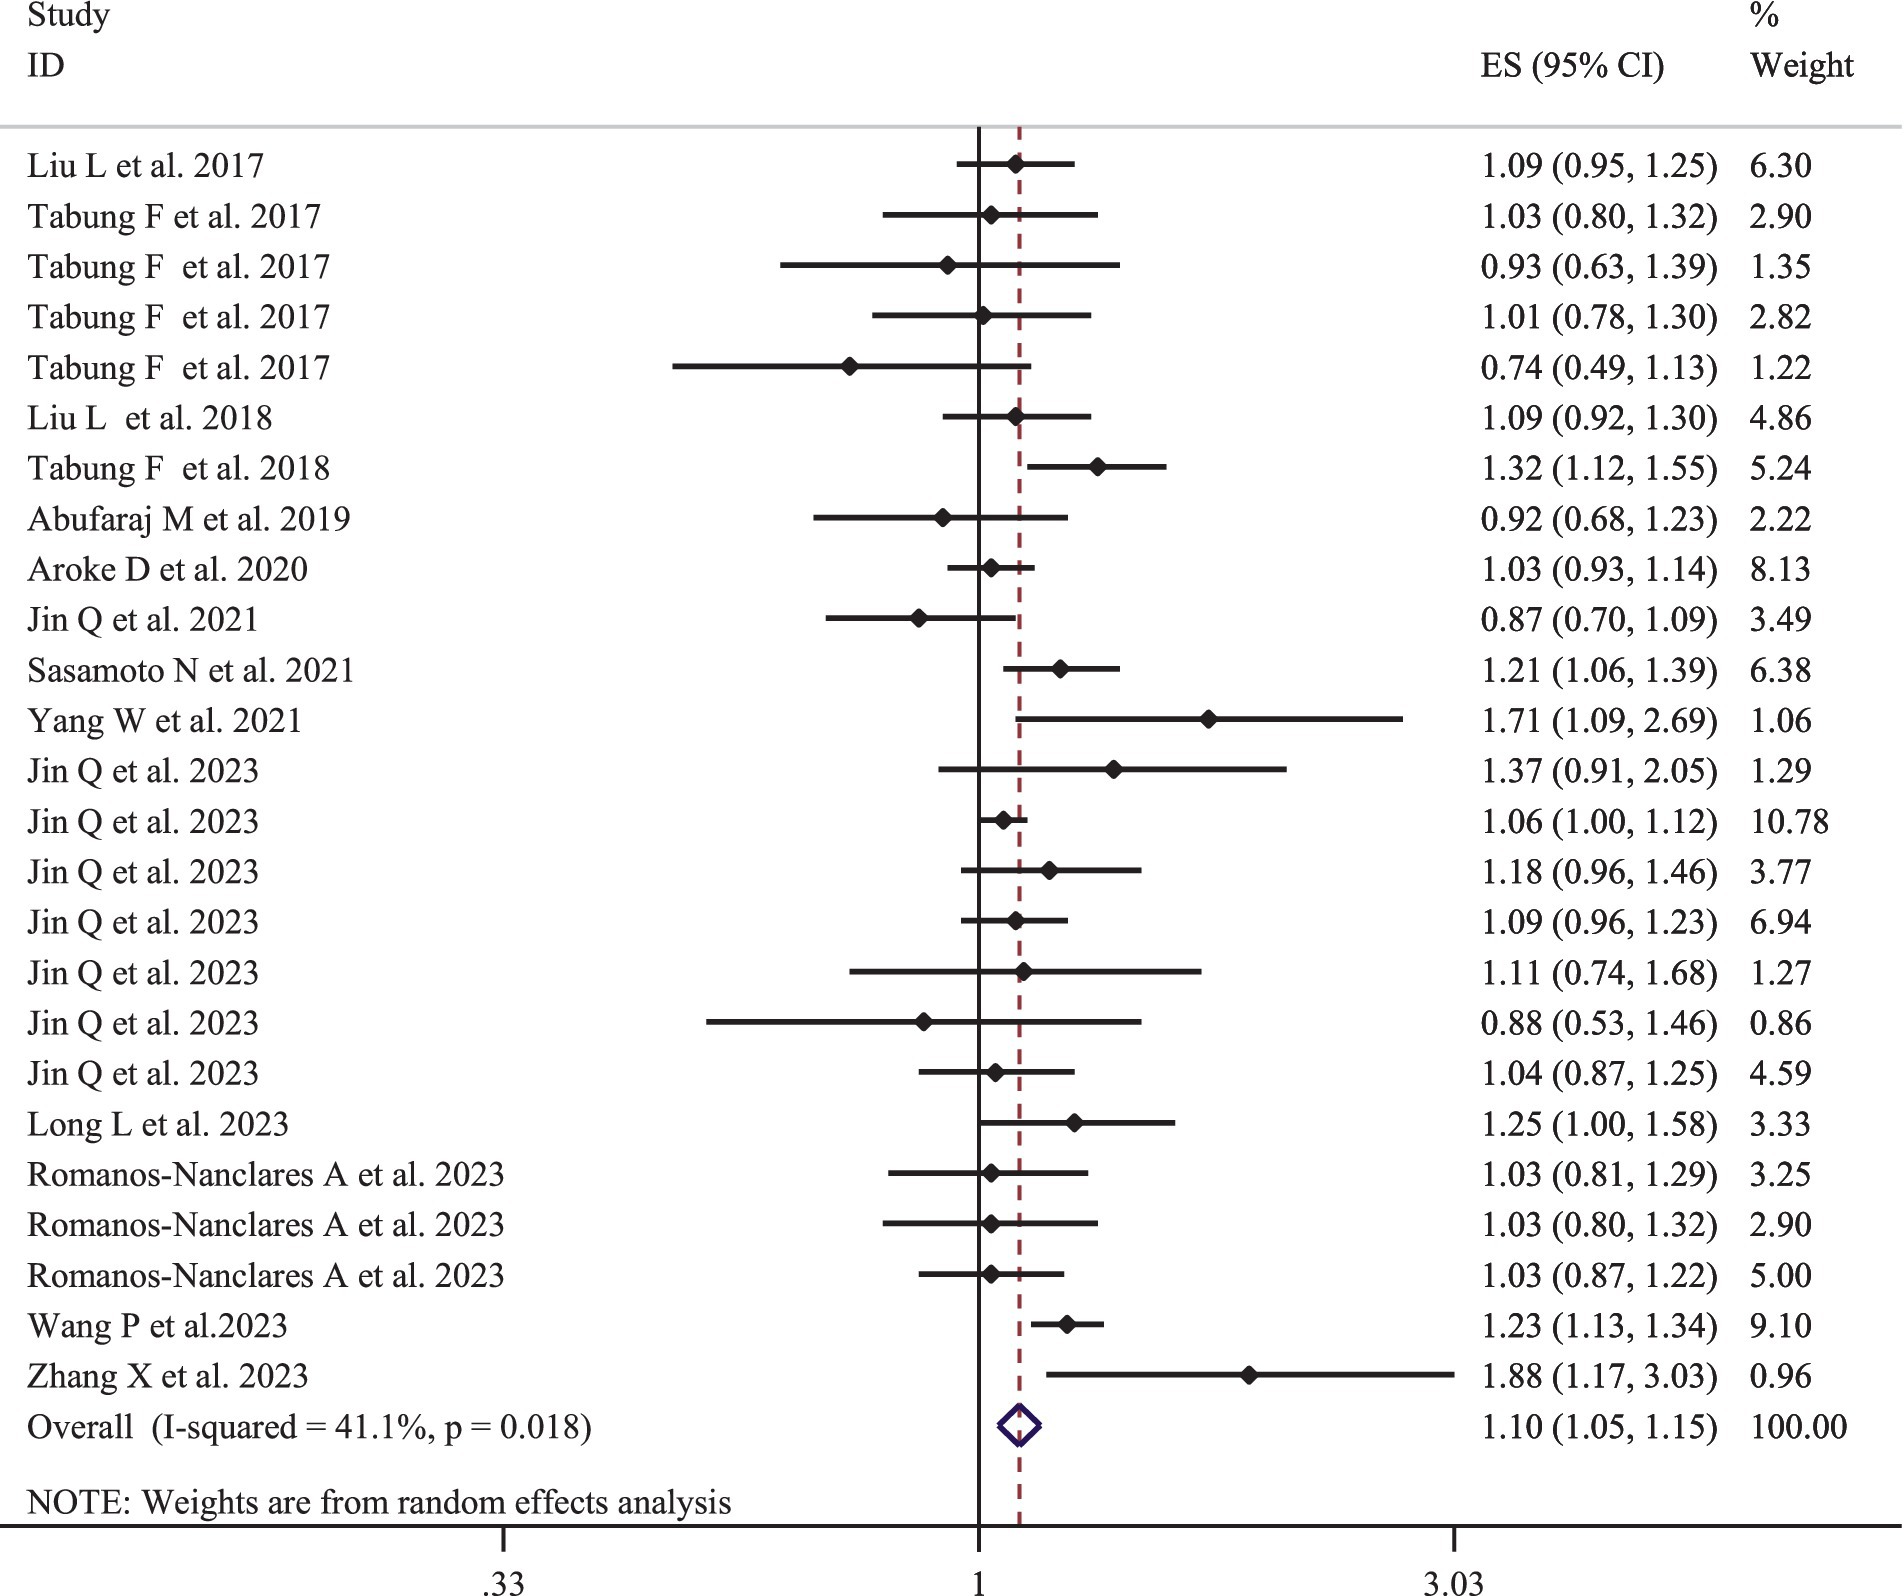
Figure 2. Forest plots with overall multi-variable adjusted effect sizes from the random-effects meta-analysis of the highest compared to lowest adherence to empirical dietary inflammatory pattern and the risk of cancer.
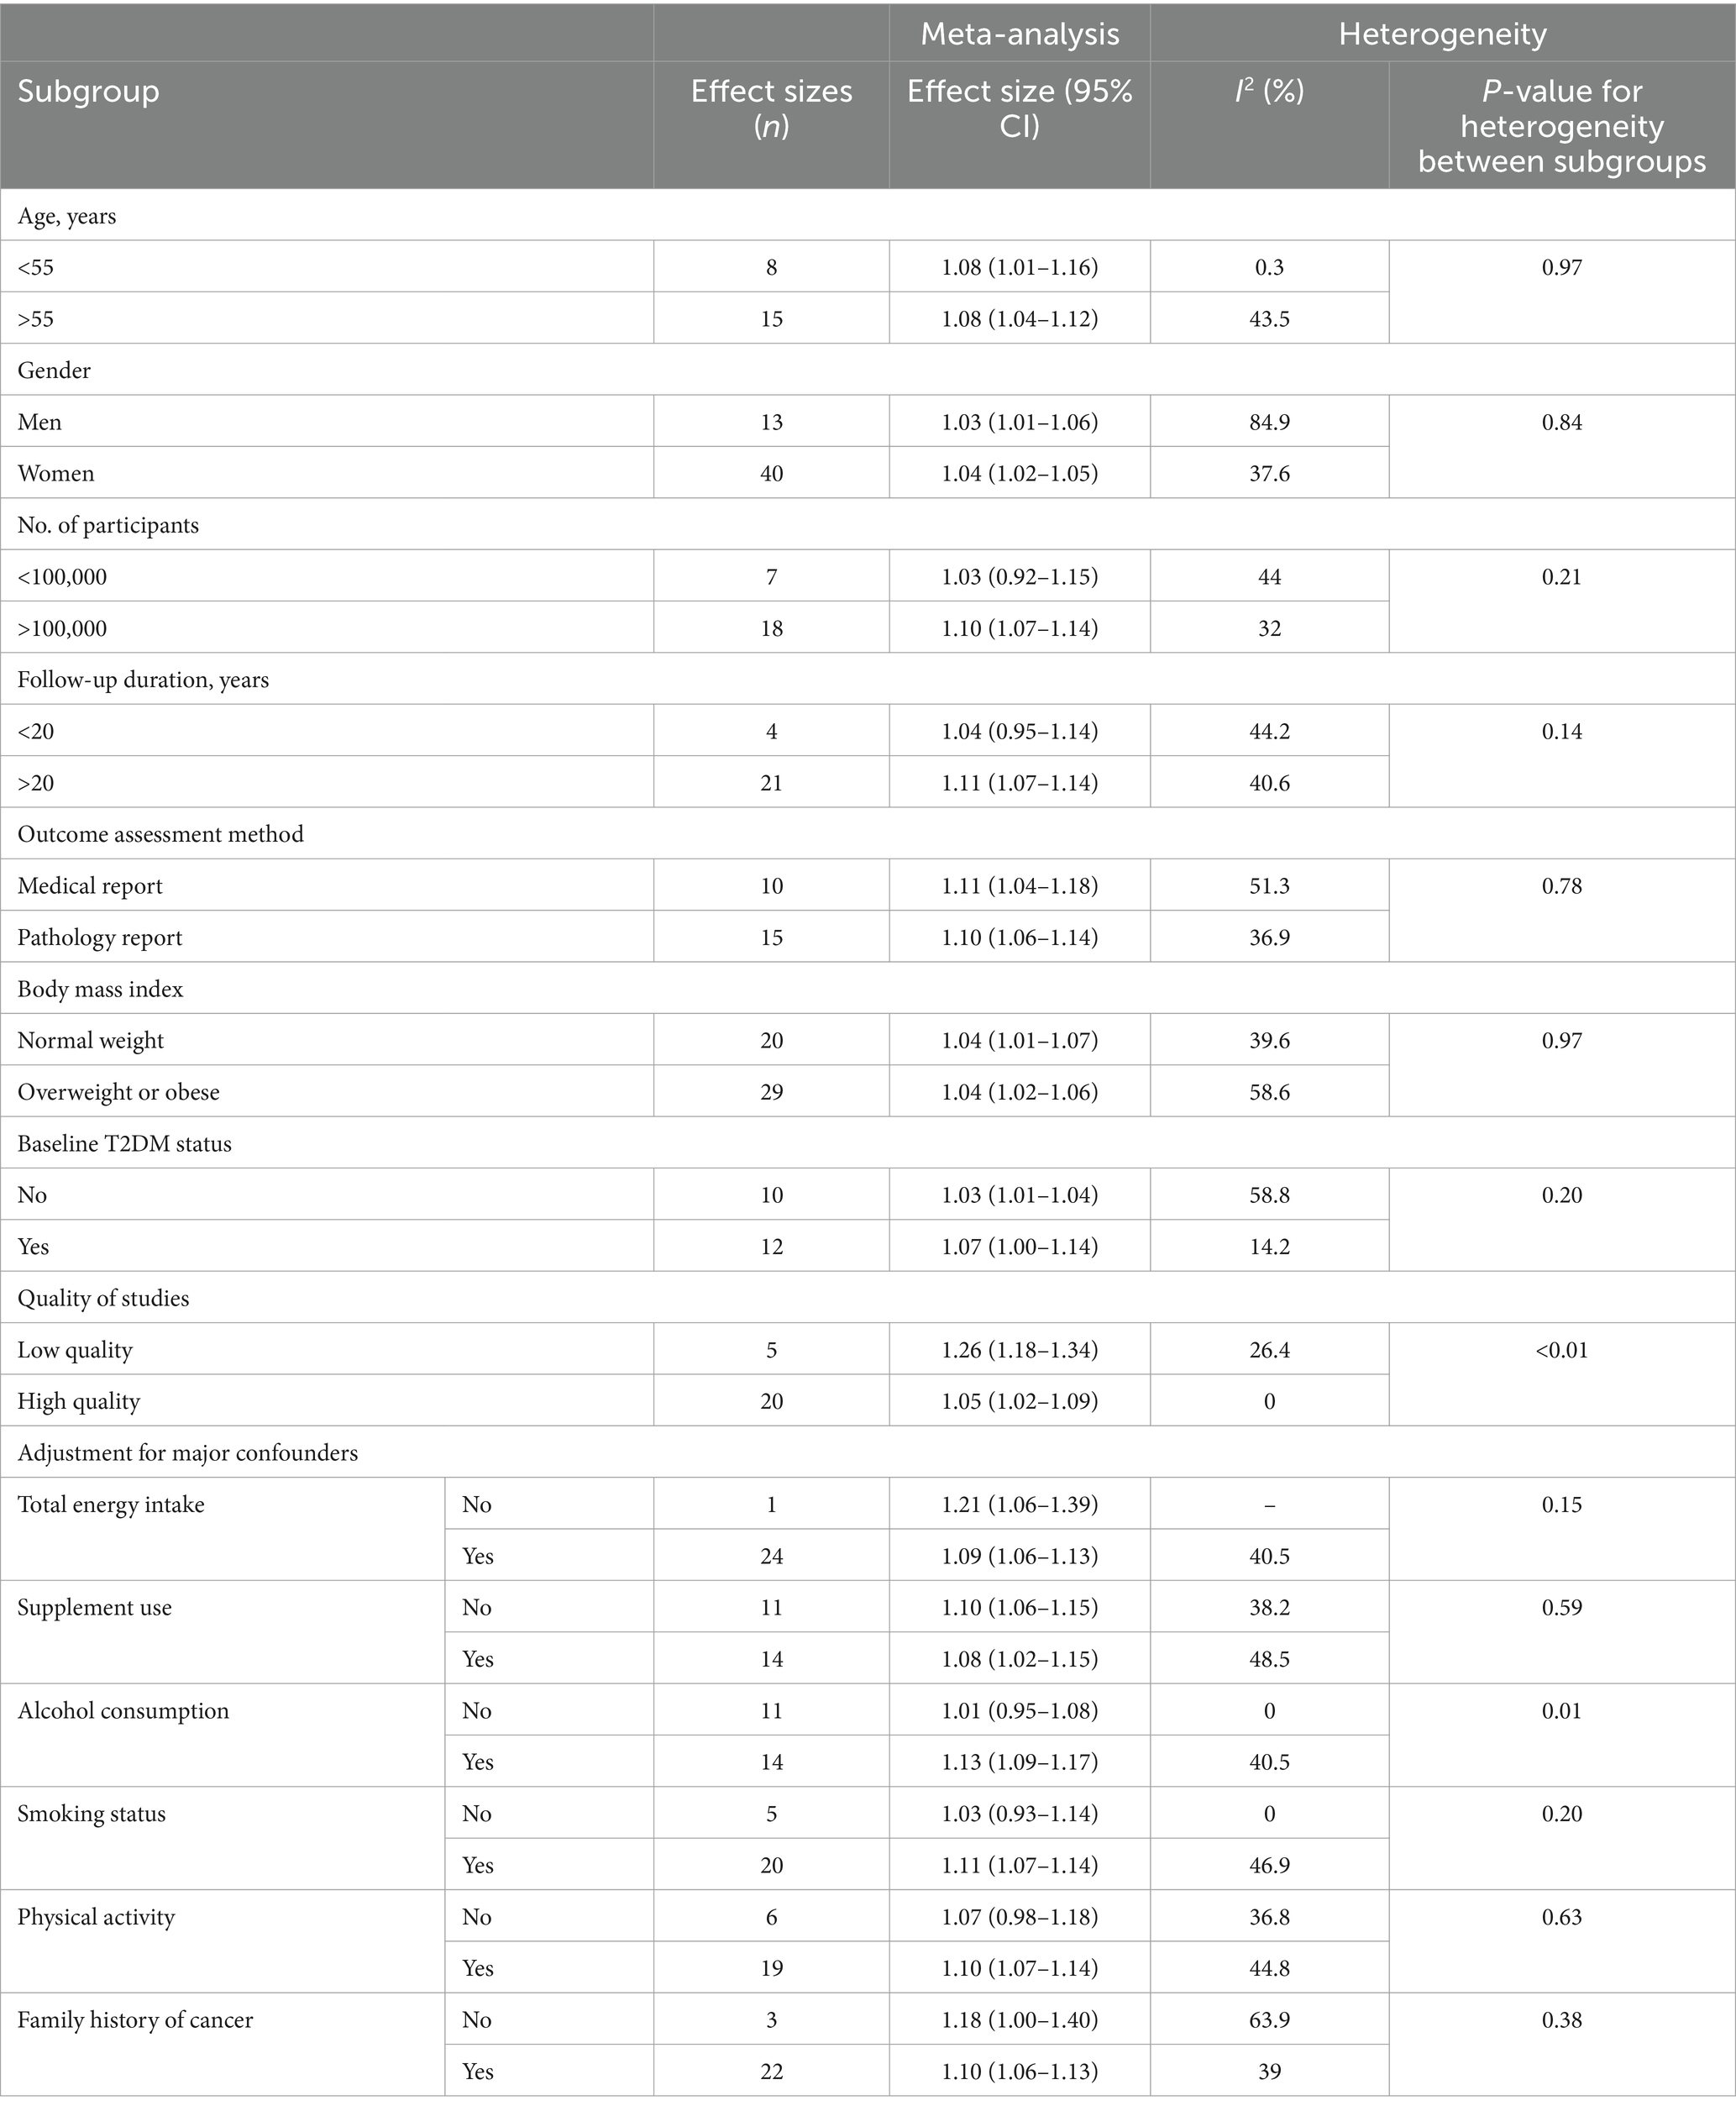
Table 3. Subgroup analysis of the association between highest compared to lowest adherence to the empirical dietary inflammatory pattern and risk of cancer incidence (n = 2,662,531).
According to the sensitivity analysis using the random-effects model, the overall ESs regarding the association between greater adherence to the EDIP and the risk of cancer did not depend on a single study (95% CI: 1.04–1.16) (Supplementary Figure S1).
The meta-regression association between greater adherence to the EDIP and the risk of cancer based on age and BMI is presented in Supplementary Figures S2, S3. According to these findings, age and BMI were not significant sources of heterogeneity in these associations (all p-values >0.05).
Supplementary Figure S4 provides an assessment of publication bias, displaying the funnel plots of ESs for greater adherence to the EDIP and the risk of cancer, which shows no asymmetry. It also includes results from Egger’s and Begg’s tests. When the funnel plot was visually inspected, no evidence of publication bias was observed, which was also confirmed using Egger’s and Begg’s tests (all p-values >0.05).
Supplementary Figure S5 presents the pooled multivariate-adjusted ESs from the random-effects meta-analysis of the per-SD increases in adherence to the EDIP and the risk of cancer. Fifteen ESs from seven studies (15, 16, 35, 36, 38, 39, 45) were included. The pooled ES was 1.03 (95% CI: 1.01–1.06), with a high degree of heterogeneity (I2 = 62.3; P-heterogeneity <0.01).
The pooled multivariable-adjusted ES from the random-effects meta-analysis of the association between the highest compared to the lowest adherence to the EDIP and the risk of site-specific cancer are represented in Table 4. There was a significant association between greater adherence to the EDIP and the risk of colorectal cancer (ES: 1.19; 95% CI: 1.11–1.15; I2 = 41.1) and liver cancer (ES: 1.48; 95% CI: 1.14–1.94; I2 = 36.9). However, no significant association between greater adherence to the EDIP and the risk of ovarian cancer (ES: 1.03; 95% CI: 0.90–1.19; I2 = 32.6) and endometrial cancer (ES: 1.04; 95% CI: 0.87–1.25; I2 = 0) was found (Table 4).
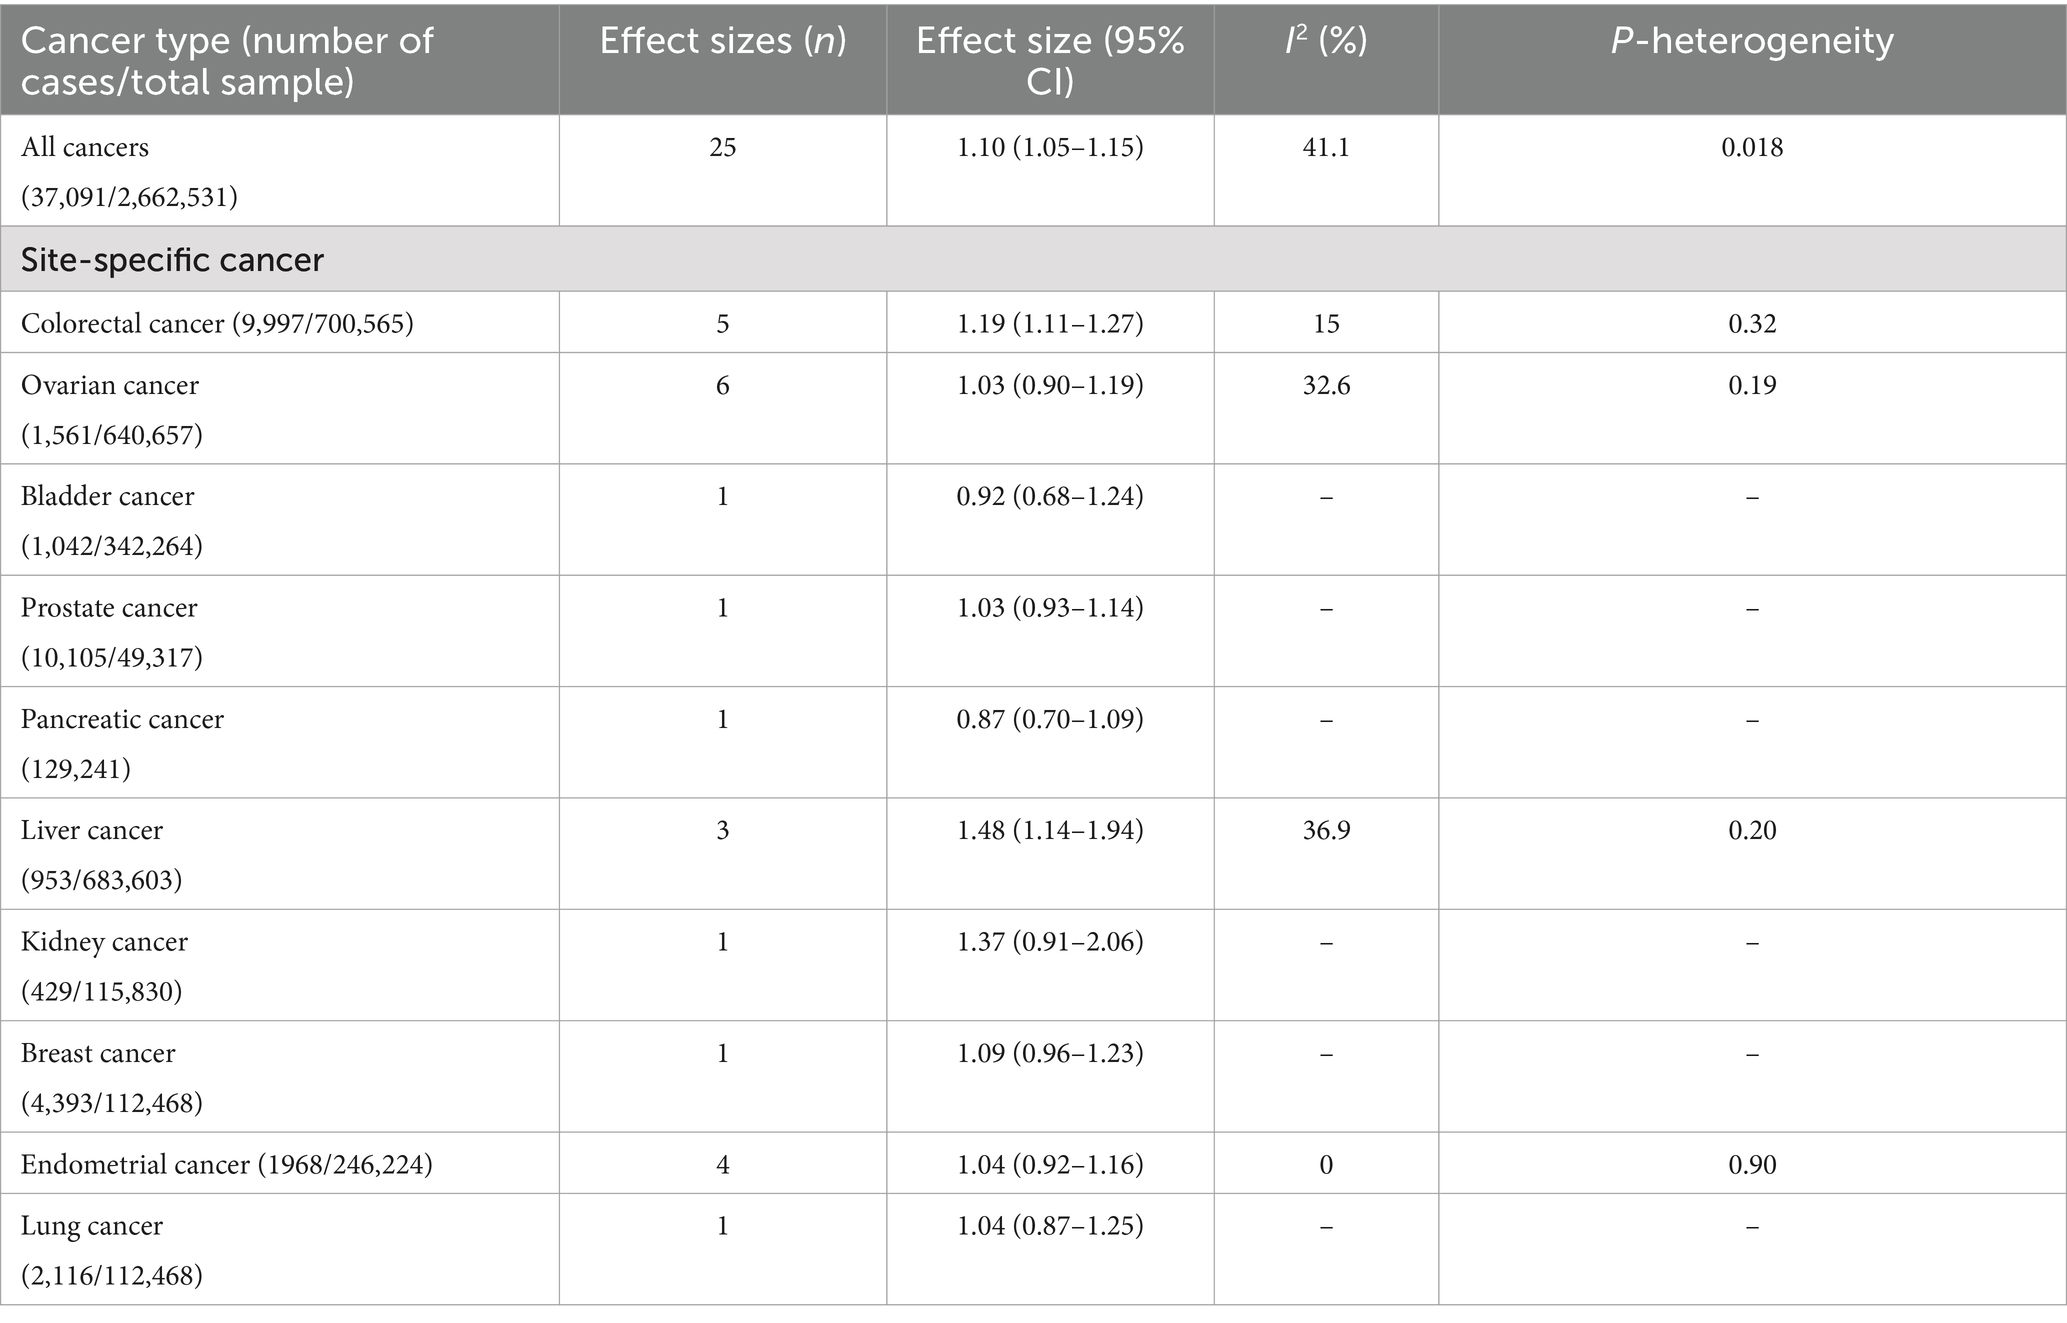
Table 4. Empirical dietary inflammatory pattern in relation to site-specific cancer incidence based on analysis of the highest compared to lowest adherence.
EDIP and cancer-specific mortality
Figure 3 represents the pooled multivariate-adjusted ES from the random-effects meta-analysis of adherence to the highest compared to the lowest EDIP and the risk of cancer-specific mortality. Thirteen ESs from the eight studies (17–19, 30, 37, 42–44) were included. The pooled ES was 1.18 (95% CI: 1.05–1.33), with a medium degree of heterogeneity (I2 = 45.4; P-heterogeneity = 0.038). Subgroup analysis showed that the number of participants and adjustment for physical activity and family history of cancer were all potential sources of heterogeneity (Supplementary Table S3). The increased risk of cancer-specific mortality also remained significant after stratification by age (<55, >55), gender (men/women), number of participants (<100,000, >100,000), follow-up duration (<20 years, >20 years), dietary intake assessment method (FFQ, 24-h recall questionnaire), and adjustment for total energy intake, alcohol consumption, smoking status, physical activity, and family history of cancer (Supplementary Table S3).
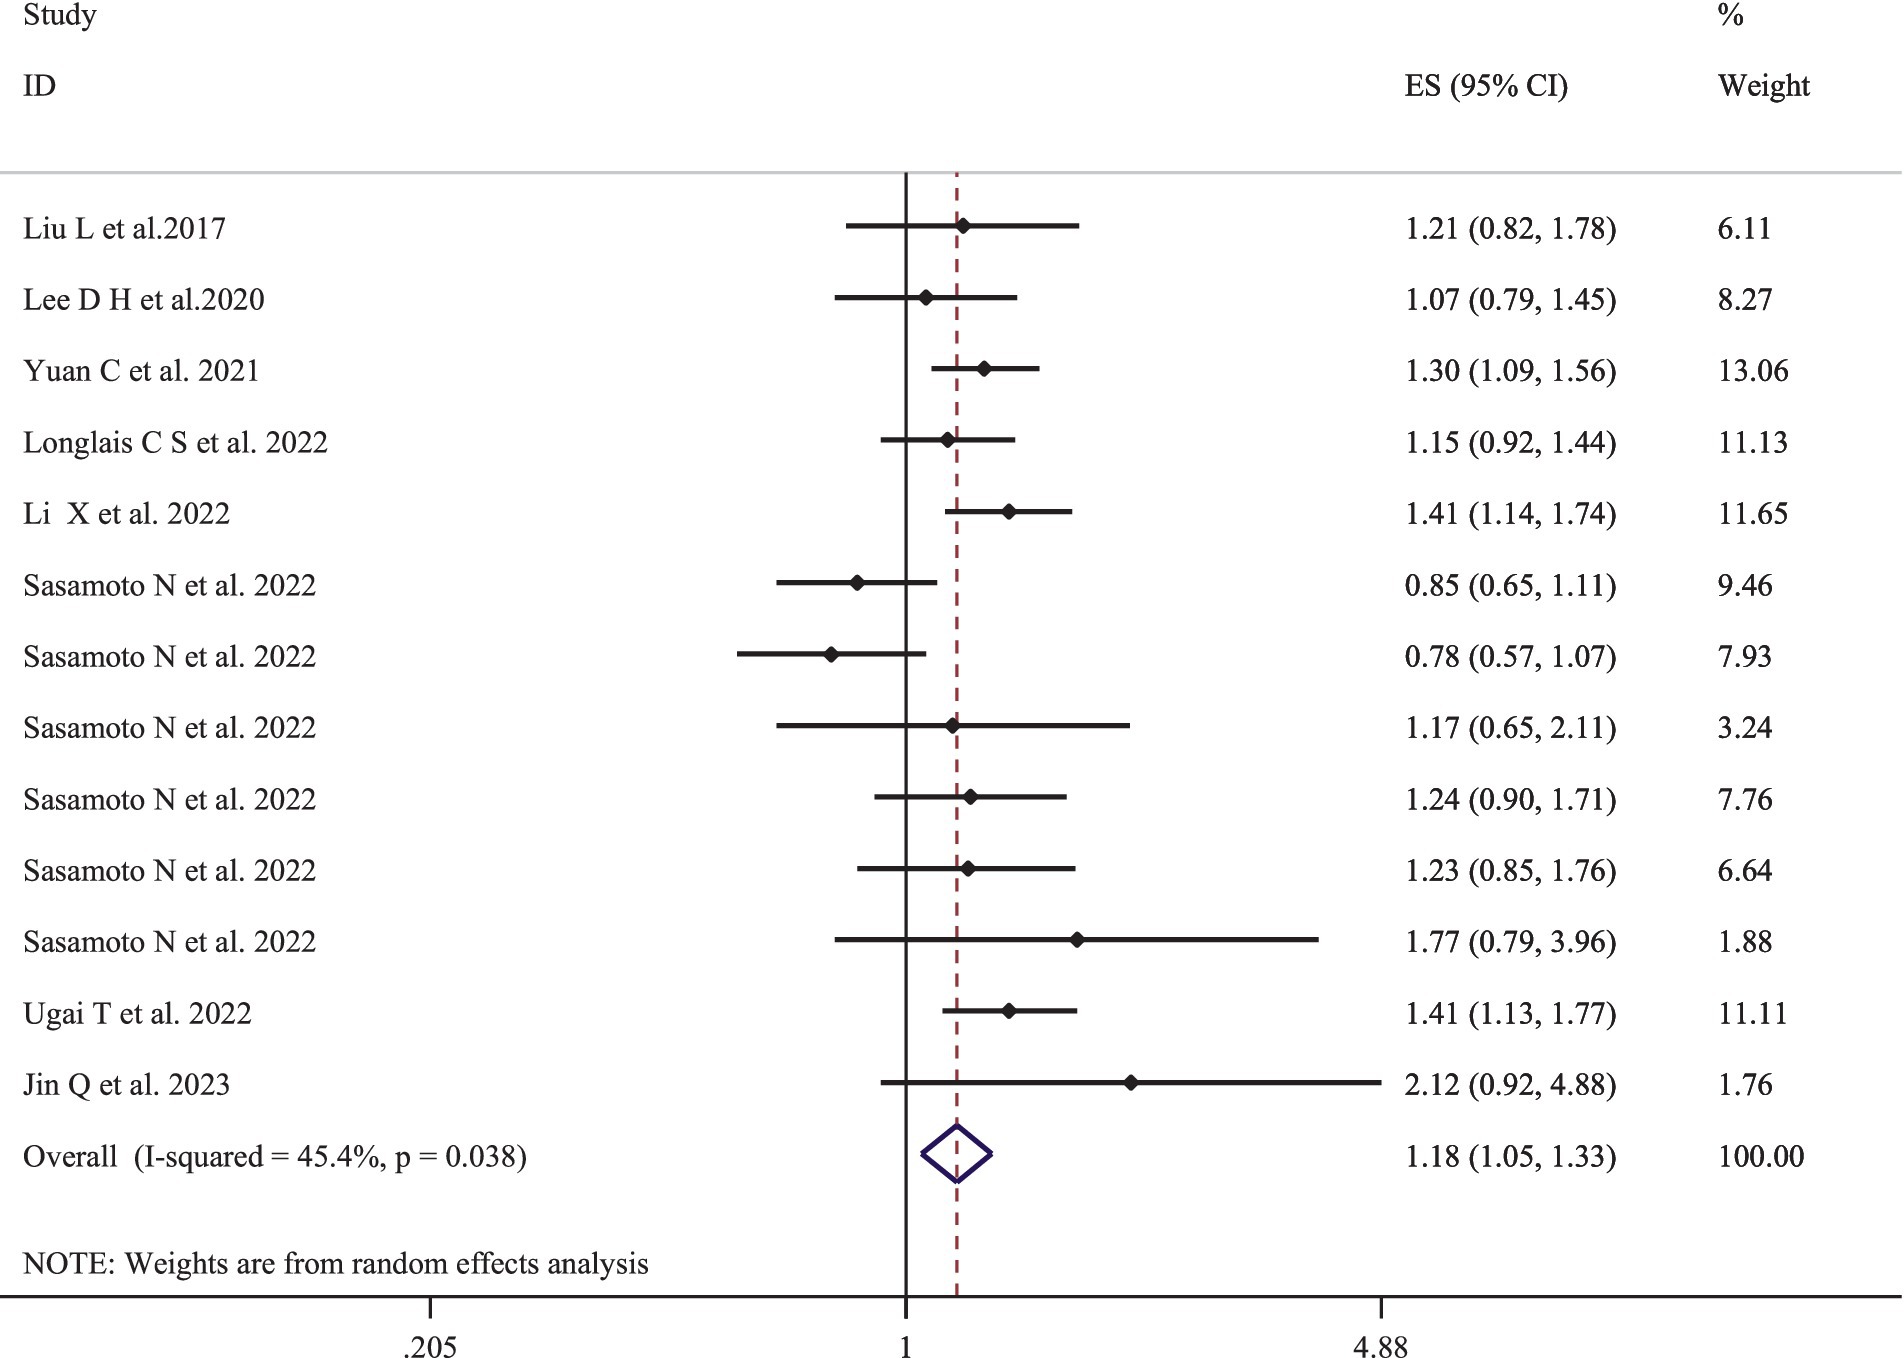
Figure 3. Forest plots with overall multi-variable adjusted effect sizes from the random-effects meta-analysis of the highest compared to lowest adherence to empirical dietary inflammatory pattern and the risk of cancer-specific mortality.
Based on sensitivity analysis, the overall ES regarding the association between greater adherence to the EDIP and the risk of cancer-specific mortality did not rely on a single study (95% CI: 1.04–1.16) (Supplementary Figure S6).
The meta-regression association between greater adherence to the EDIP and the risk of cancer-specific mortality based on age and BMI is provided in Supplementary Figures S7, S8. The results of the analysis revealed that neither age nor BMI were found to be significant sources of heterogeneity (all p-values >0.05).
Supplementary Figure S9 presents a thorough evaluation of publication bias by displaying the funnel plots of ESs comparing greater adherence to the EDIP and the risk of cancer-specific mortality without any asymmetry, along with Egger’s and Begg’s tests. Upon visual inspection of the funnel plot, no evidence of publication bias was found, which was further confirmed using Egger’s and Begg’s tests (all p-values >0.05).
Supplementary Figure S10 shows the multivariate-adjusted ES from the random-effects meta-analysis of adherence to per-SD increases in EDIP adherence and the risk of cancer-specific mortality. Five ESs from the five studies (17, 19, 35, 38, 43) were included in the meta-analysis of the per-SD increases in adherence to EDIP and the risk of cancer-specific mortality. The pooled ES was 1.14 (95% CI: 1.02–1.28), with a high degree of heterogeneity (I2 = 73.4; P-heterogeneity <0.01).
Discussion
This systematic review and meta-analysis aimed to assess the association between greater adherence to the EDIP and the risk of cancer and cancer-specific mortality. Our results showed that greater adherence to the EDIP was significantly associated with a 10% increase in risk of cancer incidence with a medium degree of heterogeneity. Our subgroup analysis showed that the significant positive association between greater adherence to the EDIP and the risk of cancer remained unchanged except for studies with fewer than 100,000 participants and less than 20 years of follow-up. Our findings also indicate that higher adherence to the EDIP is significantly associated with an increased risk of colorectal and liver cancer. However, we did not find a significant association between EDIP adherence and the risk of ovarian or endometrial cancer. We showed that greater adherence to the EDIP was significantly associated with an 18% increase in the risk of cancer-specific mortality. Furthermore, we found that the significant positive association between greater adherence to the EDIP and risk of cancer mortality remained unchanged except for studies adjusted for supplement intake.
The current study’s findings of an association between dietary inflammatory potential and the risk of cancer are consistent with previous studies. In 2018, a meta-analysis that pooled data from 44 epidemiologic studies involving more than one million participants found that the highest adherence to the DII was significantly associated with a 58% increased risk of total cancer compared to the lowest adherence (49). Additionally, the aforementioned meta-analysis demonstrated that for each SD increase in the DII, the risk of cancer significantly increased by 13% (49). Another meta-analysis which pooled the 38 observational studies showed that a higher level of DII adherence was significantly associated with a 32% higher risk of total cancer incidence (50). According to our findings, we showed that greater adherence to the EDIP was significantly associated with a higher risk of colorectal cancer and liver cancer by 19 and 48%, respectively. In this context, a recent meta-analysis that pooled data from 12 studies demonstrated that greater adherence to the DII was significantly associated with a 16% higher risk of colorectal cancer (51). Recently, another meta-analysis evaluating the association between adherence to pro-inflammatory diets and the risk of liver cancer showed that greater adherence to pro-inflammatory diets was significantly associated with a 2.35-fold increased risk of liver cancer (52). Our study did not reveal a significant association between adherence to the EDIP and the risk of ovarian or endometrial cancer. In this context, in 2021, a meta-analysis conducted by Yang et al. evaluated adherence to pro-inflammatory diets (including four studies considered the DII as the exposure and two studies considered the EDIP as the exposure) and the risk of ovarian cancer (53). In line with our findings, according to the aforementioned meta-analysis, no significant association between greater adherence to the EDIP and the risk of ovarian cancer was found. Furthermore, a recent meta-analysis evaluated adherence to the DII and the risk of gynecological cancers (54). In contrast to our findings, this meta-analysis showed that greater adherence to the DII was significantly associated with a higher risk of endometrial cancer. It is important to note that this meta-analysis pooled data from two studies to evaluate this association, which may lead to limited statistical power, and future studies are needed to investigate associations between adherence to pro-inflammatory diets and the risk of endometrial cancer.
Findings of an association between adherence to the EDIP and the risk of cancer-specific mortality from the current study are consistent with previous studies. In 2022, a meta-analysis evaluated the association between adherence to the DII and the risk of all-cause and cause-specific mortality demonstrated that the highest adherence to the DII compared to the lowest one was significantly associated with a 7% higher risk of cancer-specific mortality (12). In addition, the authors showed that per 1-unit DII increase was significantly associated with a 2% higher risk of cancer-specific mortality (12). Furthermore, Zahedi et al., in the framework of the meta-analysis, showed that higher adherence to the DII was significantly associated with a 16% higher risk of cancer-specific mortality (50).
Several potential mechanisms may explain the association between inflammation and an increased risk of cancer as well as cancer-specific mortality. It has been shown that there is a strong association between chronic inflammation and different types of cancers (55–57). Research findings suggest that approximately 20% of all cancer-related deaths can be attributed to inflammation and chronic infections (58). However, the mechanisms underlying these relationships have not been fully characterized. The infiltration of leukocytes, accumulation of macrophages, and activation of transcription factors, particularly nuclear factor kappa-light-chain enhancer of activated B cells (NF-κB), are pathways that can bring about inappropriate gene expression, enhanced cell proliferation, and resistance to apoptosis in initiated cells (58). These mechanisms may ultimately lead to the development and dissemination of tumor cells (58). In this context, it is vital to recognize that the activation of NF-κB pathways serves as a crucial mechanism, playing a pivotal role in mediating the link between inflammation and carcinogenesis (59).
The possible mechanisms through which dietary features are associated with inflammatory status remain incompletely specified. In the EDIP scoring system, processed meat, red meat, organ meat, fish, refined grains, high-energy beverages, and tomato intake are pro-inflammatory components (14). Red meat and processed meat, being rich sources of saturated fat and heme iron, can be significant dietary risk factors contributing to increased risk of cancer and cancer-specific mortality (60–62). Red and processed meats, characterized by higher levels of saturated and trans fatty acids, have been linked to heightened oxidative stress and elevated plasma concentrations of inflammatory biomarkers, notably C-reactive protein (63, 64). Additionally, saturated fatty acids activate inflammatory genes through mechanisms such as NF-κB activation, protein kinase C, and mitogen-activated protein kinases (65). Moreover, trans fatty acids increase the activation of the TNF system, leading to heightened inflammation (66). The heme iron present in red and processed meat has been shown to have detrimental effects on our bodies (60, 62, 67). It can lead to cell damage, cell death, increased growth of epithelial cells, oxidative damage to lipids, generation of free radicals, formation of DNA adducts in epithelial cells, and promotion of the formation of N-nitroso compounds, which are known to contribute to the development of cancer (67). Furthermore, the consumption of refined grains and high-energy beverages, due to their higher energy and carbohydrate content, may result in weight gain and exacerbate inflammatory conditions (68–70). According to the EDIP components, fish (other than dark meat fish) and tomatoes have a positive association with inflammatory markers, whereas pizza was inversely related (14). This may suggest that it pertains to fish preparation methods, although this information was not gathered by Tabung et al. (14). For example, fish that is well-done, browned, fried, grilled, or barbecued may be more pro-inflammatory and associated with a higher risk of chronic diseases (71). The oils commonly used for deep frying are low in n-3 fatty acids due to the oxidation of these acids (72). Additionally, prior to the regulation of trans fats in the United States, these oils also contained high amounts of trans fats, which are known to be pro-inflammatory (72). Three clinical trials were conducted to investigate the effect of tomato intake on the serum level of systemic inflammatory markers, yielding conflicting findings (73–75). One study reported that tomato juice supplementation can significantly increase the serum levels of adiponectin and reduce inflammatory adipokine levels independently of body fat reduction (74). However, it is worth noting that several other studies have not demonstrated a significant impact of tomato consumption on reducing the serum levels of IL-6, CRP, and other inflammatory markers (73, 75). It is possible that the potential benefits of a tomato-rich diet may not be directly related to the inflammation process. It should be noted that tomato paste has 2.5–4 times greater bioavailable lycopene content compared to fresh tomatoes, and lycopene has shown anti-inflammatory properties (53). Lycopene has demonstrated anti-inflammatory properties, which could clarify the reverse connection between pizza and inflammatory markers (76).
We acknowledge that our study has its strengths and limitations. This is the first systematic review and meta-analysis evaluating the association between adherence to EDIP and the risk of cancer and cancer-specific mortality using data from 24 prospective cohort studies. We performed subgroup analysis based on various confounding factors to elucidate the sources of variation among the included studies. In addition, most of the included studies controlled for factors that could affect the association between adherence to the EDIP and the risk of cancer and cancer-specific mortality. However, there are certain limitations that need to be mentioned. First, the self-reported nature of dietary intake using the FFQ in the included studies, coupled with the lack of repeated measurements of dietary intake in the majority of the studies, may lead to measurement errors and misclassifications; second, even after adjusting for various confounding factors among the included studies, it is not possible to entirely rule out unmeasured or residual confounding factors; third, due to a limited number of included studies in some subgroup analyses based on outcome site-specific cancer, we were unable to perform a meta-analysis for all site-specific cancers; and finally, it should be noted that the EDIP score was developed and validated using data from the Nurses’ Health Study in the United States, which restricts its application to other countries with differing medical and dietary characteristics.
Conclusion
In conclusion, the present systematic review and meta-analysis suggest that a diet with higher inflammatory properties, represented by the EDIP, is associated with an increased risk of cancer and cancer-specific mortality. It may be beneficial to validate the EDIP in other countries and assess the relationship between adherence to the EDIP and the risk of all site-specific cancers.
Data availability statement
The original contributions presented in the study are included in the article/Supplementary material, further inquiries can be directed to the corresponding author.
Author contributions
FH: Conceptualization, Data curation, Formal analysis, Funding acquisition, Investigation, Methodology, Project administration, Resources, Software, Supervision, Validation, Visualization, Writing – original draft. AN: Writing – original draft, Writing – review & editing. EE: Conceptualization, Data curation, Investigation, Writing – original draft. FJ-T: Data curation, Writing – original draft. GA: Writing – original draft, Writing – review & editing.
Funding
The author(s) declare financial support was received for the research, authorship, and/or publication of this article. This study was supported in part by Grant No. 43010013-1 from the Shahid Beheshti University of Medical Sciences. Shahid Beheshti University of Medical Sciences had no role in the design or conduct of the study, the collection, analysis, or interpretation of the data, or the preparation, review, or approval of the manuscript.
Conflict of interest
The authors declare that the research was conducted in the absence of any commercial or financial relationships that could be construed as a potential conflict of interest.
Publisher’s note
All claims expressed in this article are solely those of the authors and do not necessarily represent those of their affiliated organizations, or those of the publisher, the editors and the reviewers. Any product that may be evaluated in this article, or claim that may be made by its manufacturer, is not guaranteed or endorsed by the publisher.
Supplementary material
The Supplementary material for this article can be found online at: https://www.frontiersin.org/articles/10.3389/fnut.2024.1462931/full#supplementary-material
References
1. Ferlay, J, Steliarova-Foucher, E, Lortet-Tieulent, J, Rosso, S, Coebergh, J-WW, Comber, H, et al. Cancer incidence and mortality patterns in Europe: estimates for 40 countries in 2012. Eur J Cancer. (2013) 49:1374–403. doi: 10.1016/j.ejca.2012.12.027
2. Fitzmaurice, C, Allen, C, Barber, RM, Barregard, L, Bhutta, ZA, Brenner, H, et al. Global, regional, and national cancer incidence, mortality, years of life lost, years lived with disability, and disability-adjusted life-years for 32 cancer groups, 1990 to 2015: a systematic analysis for the global burden of disease study. JAMA Oncol. (2017) 3:524–48. doi: 10.1001/jamaoncol.2016.5688
3. Lortet-Tieulent, J, Soerjomataram, I, Lin, CC, Coebergh, JWW, and Jemal, A. US burden of cancer by race and ethnicity according to disability-adjusted life years. Am J Prev Med. (2016) 51:673–81. doi: 10.1016/j.amepre.2016.07.039
4. Parohan, M, Sadeghi, A, Khatibi, SR, Nasiri, M, Milajerdi, A, Khodadost, M, et al. Dietary total antioxidant capacity and risk of cancer: a systematic review and meta-analysis on observational studies. Crit Rev Oncol Hematol. (2019) 138:70–86. doi: 10.1016/j.critrevonc.2019.04.003
5. Nøst, TH, Alcala, K, Urbarova, I, Byrne, KS, Guida, F, Sandanger, TM, et al. Systemic inflammation markers and cancer incidence in the UK biobank. Eur J Epidemiol. (2021) 36:841–8. doi: 10.1007/s10654-021-00752-6
6. Michels, N, van Aart, C, Morisse, J, and Huybrechts, I. Chronic inflammation toward Cancer incidence: an epidemiological systematic review. J Global Oncol. (2018) 4:1–36. doi: 10.1200/jgo.18.56200
7. Esmaillzadeh, A, Kimiagar, M, Mehrabi, Y, Azadbakht, L, Hu, FB, and Willett, WC. Dietary patterns and markers of systemic inflammation among Iranian women. J Nutr. (2007) 137:992–8. doi: 10.1093/jn/137.4.992
8. Shivappa, N, Steck, SE, Hurley, TG, Hussey, JR, Ma, Y, Ockene, IS, et al. A population-based dietary inflammatory index predicts levels of C-reactive protein in the seasonal variation of blood cholesterol study (SEASONS). Public Health Nutr. (2014) 17:1825–33. doi: 10.1017/S1368980013002565
9. Motamedi, A, Askari, M, Mozaffari, H, Homayounfrar, R, Nikparast, A, Ghazi, ML, et al. Dietary inflammatory index in relation to type 2 diabetes: a Meta-analysis. Int J Clin Pract. (2022) 2022:1–14. doi: 10.1155/2022/9953115
10. Shivappa, N, Hébert, JR, Rietzschel, ER, De Buyzere, ML, Langlois, M, Debruyne, E, et al. Associations between dietary inflammatory index and inflammatory markers in the Asklepios study. Br J Nutr. (2015) 113:665–71. doi: 10.1017/S000711451400395X
11. Jayedi, A, Emadi, A, and Shab-Bidar, S. Dietary inflammatory index and site-specific cancer risk: a systematic review and dose-response meta-analysis. Adv Nutr. (2018) 9:388–403. doi: 10.1093/advances/nmy015
12. Zhang, J, Feng, Y, Yang, X, Li, Y, Wu, Y, Yuan, L, et al. Dose–response Association of Dietary Inflammatory Potential with all-cause and cause-specific mortality. Adv Nutr. (2022) 13:1834–45. doi: 10.1093/advances/nmac049
13. Bahr, LS, Franz, K, and Mähler, A. Assessing the (anti)-inflammatory potential of diets. Curr Opinion Clin Nutr Metab Care. (2021) 24:402–10. doi: 10.1097/MCO.0000000000000772
14. Tabung, FK, Smith-Warner, SA, Chavarro, JE, Wu, K, Fuchs, CS, Hu, FB, et al. Development and validation of an empirical dietary inflammatory index. J Nutr. (2016) 146:1560–70. doi: 10.3945/jn.115.228718
15. Jin, Q, Shi, N, Lee, DH, Rexrode, KM, Manson, JE, Balasubramanian, R, et al. Hyperinsulinemic and pro-inflammatory dietary patterns and Metabolomic profiles are associated with increased risk of Total and site-specific cancers among postmenopausal women. Cancers. (2023) 15:1–24. doi: 10.3390/cancers15061756
16. Romanos-Nanclares, A, Tabung, FK, Sinnott, JA, Trabert, B, De Vivo, I, Playdon, MC, et al. Inflammatory and insulinemic dietary patterns and risk of endometrial cancer among US women. J Natl Cancer Inst. (2023) 115:311–21. doi: 10.1093/jnci/djac229
17. Li, X, Chen, B, Zhang, J, Li, M, Zhang, Z, Zhu, Y, et al. Association of dietary inflammatory potential with risk of overall and cause-specific mortality. Br J Nutr. (2022) 127:1878–87. doi: 10.1017/S0007114521002907
18. Sasamoto, N, Wang, T, Townsend, MK, Eliassen, AH, Tabung, FK, Giovannucci, EL, et al. Pre-diagnosis and post-diagnosis dietary patterns and survival in women with ovarian cancer. Br J Cancer. (2022) 127:1097–105. doi: 10.1038/s41416-022-01901-8
19. Jin, Q, Gheeya, J, Nepal, S, Shi, N, Folefac, E, Webb, MZ, et al. Associations of dietary patterns with kidney cancer risk, kidney cancer-specific mortality and all-cause mortality among postmenopausal women. Br J Cancer. (2023) 129:1978–87. doi: 10.1038/s41416-023-02469-7
20. Moher, D, Liberati, A, Tetzlaff, J, and Altman, DG. PRISMA group* t. preferred reporting items for systematic reviews and meta-analyses: the PRISMA statement. Ann Intern Med. (2009) 151:264–9. doi: 10.7326/0003-4819-151-4-200908180-00135
21. Stroup, DF, Berlin, JA, Morton, SC, Olkin, I, Williamson, GD, Rennie, D, et al. Meta-analysis of observational studies in epidemiology: a proposal for reporting. JAMA. (2000) 283:2008–12. doi: 10.1001/jama.283.15.2008
22. Stang, A . Critical evaluation of the Newcastle-Ottawa scale for the assessment of the quality of nonrandomized studies in meta-analyses. Eur J Epidemiol. (2010) 25:603–5. doi: 10.1007/s10654-010-9491-z
23. Symons, M, and Moore, D. Hazard rate ratio and prospective epidemiological studies. J Clin Epidemiol. (2002) 55:893–9. doi: 10.1016/S0895-4356(02)00443-2
24. Zhang, J, and Yu, KF. What's the relative risk? A method of correcting the odds ratio in cohort studies of common outcomes. JAMA. (1998) 280:1690–1. doi: 10.1001/jama.280.19.1690
25. Jackson, D, White, IR, and Thompson, SG. Extending DerSimonian and Laird's methodology to perform multivariate random effects meta-analyses. Stat Med. (2010) 29:1282–97. doi: 10.1002/sim.3602
26. Cumpston, M, Li, T, Page, MJ, Chandler, J, Welch, VA, Higgins, JP, et al. Updated guidance for trusted systematic reviews: a new edition of the Cochrane handbook for systematic reviews of interventions. Cochrane Database Syst Rev. (2019) 2019:1–2. doi: 10.1002/14651858.ED000142
27. Higgins, JP, and Thompson, SG. Quantifying heterogeneity in a meta-analysis. Stat Med. (2002) 21:1539–58. doi: 10.1002/sim.1186
28. Higgins, J, Thompson, S, and Altman, DG. Measuring inconsistency in meta-analyses. BMJ. (2003) 327:557–60. doi: 10.1136/bmj.327.7414.557
29. Egger, M, Smith, GD, Schneider, M, and Minder, C. Bias in meta-analysis detected by a simple, graphical test. BMJ. (1997) 315:629–34. doi: 10.1136/bmj.315.7109.629
30. Liu, L, Nishihara, R, Qian, ZR, Tabung, FK, Nevo, D, Zhang, X, et al. Association between inflammatory diet pattern and risk of colorectal carcinoma subtypes classified by immune responses to tumor. Gastroenterology. (2017) 153:1517–30.e14. doi: 10.1053/j.gastro.2017.08.045
31. Tabung, FK, Huang, T, Giovannucci, EL, Smith-Warner, SA, Tworoger, SS, and Poole, EM. The inflammatory potential of diet and ovarian cancer risk: results from two prospective cohort studies. Br J Cancer. (2017) 117:907–11. doi: 10.1038/bjc.2017.246
32. Liu, L, Tabung, FK, Zhang, X, Nowak, JA, Qian, ZR, Hamada, T, et al. Diets that promote Colon inflammation associate with risk of colorectal carcinomas that contain Fusobacterium nucleatum. Clinical Gastroenterol Hepatol. (2018) 16:1622–31.e3. doi: 10.1016/j.cgh.2018.04.030
33. Tabung, FK, Liu, L, Wang, W, Fung, TT, Wu, K, Smith-Warner, SA, et al. Association of Dietary Inflammatory Potential with Colorectal Cancer Risk in men and women. JAMA Oncol. (2018) 4:366–73. doi: 10.1001/jamaoncol.2017.4844
34. Abufaraj, M, Tabung, FK, Shariat, SF, Moschini, M, Devore, E, Papantoniou, K, et al. Association between inflammatory potential of diet and bladder Cancer risk: results of 3 United States prospective cohort studies. J Urol. (2019) 202:484–9. doi: 10.1097/JU.0000000000000279
35. Lee, DH, Fung, TT, Tabung, FK, Colditz, GA, Ghobrial, IM, Rosner, BA, et al. Dietary pattern and risk of multiple myeloma in two large prospective US cohort studies. JNCI Cancer Spectr. (2019) 3:1–9. doi: 10.1093/jncics/pkz025
36. Aroke, D, Folefac, E, Shi, N, Jin, Q, Clinton, SK, and Tabung, FK. Inflammatory and Insulinemic dietary patterns: influence on circulating biomarkers and prostate Cancer risk. Cancer Prev Res (Phila). (2020) 13:841–52. doi: 10.1158/1940-6207.CAPR-20-0236
37. Lee, DH, Fung, TT, Tabung, FK, Marinac, CR, Devore, EE, Rosner, BA, et al. Prediagnosis dietary pattern and survival in patients with multiple myeloma. Int J Cancer. (2020) 147:1823–30. doi: 10.1002/ijc.32928
38. Fu, BC, Tabung, FK, Pernar, CH, Wang, W, Gonzalez-Feliciano, AG, Chowdhury-Paulino, IM, et al. Insulinemic and inflammatory dietary patterns and risk of prostate cancer. Eur Urol. (2021) 79:405–12. doi: 10.1016/j.eururo.2020.12.030
39. Jin, Q, Hart, PA, Shi, N, Joseph, JJ, Donneyong, M, Conwell, DL, et al. Dietary patterns of Insulinemia, inflammation and Glycemia, and pancreatic Cancer risk: findings from the Women's Health Initiative. Cancer Epidemiol Biomarkers Prevent. (2021) 30:1229–40. doi: 10.1158/1055-9965.EPI-20-1478
40. Sasamoto, N, Wang, T, Townsend, MK, Hecht, JL, Eliassen, AH, Song, M, et al. Prospective analyses of lifestyle factors related to energy balance and ovarian Cancer risk by infiltration of tumor-associated macrophages. Cancer Epidemiol Biomarkers Prevent. (2021) 30:920–6. doi: 10.1158/1055-9965.EPI-20-1686
41. Yang, W, Sui, J, Zhao, L, Ma, Y, Tabung, FK, Simon, TG, et al. Association of Inflammatory and Insulinemic Potential of diet and lifestyle with risk of hepatocellular carcinoma. Cancer Epidemiol Biomarkers Prevent. (2021) 30:789–96. doi: 10.1158/1055-9965.EPI-20-1329
42. Yuan, C, Morales-Oyarvide, V, Khalaf, N, Perez, K, Tabung, FK, Ho, GYF, et al. Prediagnostic inflammation and pancreatic Cancer survival. J Natl Cancer Inst. (2021) 113:1186–93. doi: 10.1093/jnci/djab040
43. Langlais, CS, Graff, RE, Van Blarigan, EL, Kenfield, SA, Neuhaus, J, Tabung, FK, et al. Postdiagnostic inflammatory, Hyperinsulinemic, and insulin-resistant diets and lifestyles and the risk of prostate Cancer progression and mortality. Cancer Epidemiol Biomark Prevent. (2022) 31:1760–8. doi: 10.1158/1055-9965.EPI-22-0147
44. Ugai, T, Liu, L, Tabung, FK, Hamada, T, Langworthy, BW, Akimoto, N, et al. Prognostic role of inflammatory diets in colorectal cancer overall and in strata of tumor-infiltrating lymphocyte levels. Clin Transl Med. (2022) 12:e1114. doi: 10.1002/ctm2.1114
45. Lee, DH, Jin, Q, Shi, N, Wang, F, Bever, AM, Li, J, et al. Dietary inflammatory and Insulinemic potentials, plasma metabolome and risk of colorectal Cancer. Meta. (2023) 13:1–14. doi: 10.3390/metabo13060744
46. Long, L, Liu, X, Petrick, J, Liu, W, Lee, JK, Liao, L, et al. Dietary inflammatory and insulinemic potential, risk of hepatocellular carcinoma, and chronic liver disease mortality. JNCI Cancer Spectr. (2023) 7:1–10. doi: 10.1093/jncics/pkad023
47. Wang, P, Song, M, Eliassen, AH, Wang, M, and Giovannucci, EL. Dietary patterns and risk of colorectal cancer: a comparative analysis. Int J Epidemiol. (2023) 52:96–106. doi: 10.1093/ije/dyac230
48. Zhang, X, Zhao, L, Christopher, CN, Tabung, FK, Bao, W, Garcia, DO, et al. Association of dietary insulinemic and inflammatory potential with risk of liver cancer and chronic liver disease mortality in postmenopausal women: a prospective cohort study. Am J Clin Nutr. (2023) 118:530–7. doi: 10.1016/j.ajcnut.2023.07.009
49. Li, D, Hao, X, Li, J, Wu, Z, Chen, S, Lin, J, et al. Dose-response relation between dietary inflammatory index and human cancer risk: evidence from 44 epidemiologic studies involving 1,082,092 participants. Am J Clin Nutr. (2018) 107:371–88. doi: 10.1093/ajcn/nqx064
50. Zahedi, H, Djalalinia, S, Asayesh, H, Mansourian, M, Esmaeili Abdar, Z, Mahdavi Gorabi, A, et al. A higher dietary inflammatory index score is associated with a higher risk of incidence and mortality of Cancer: a comprehensive systematic review and Meta-analysis. Int J Prev Med. (2020) 11:15. doi: 10.4103/ijpvm.IJPVM_332_18
51. Syed Soffian, SS, Mohammed Nawi, A, Hod, R, Ja'afar, MH, Isa, ZM, Chan, HK, et al. Meta-analysis of the association between dietary inflammatory index (DII) and colorectal Cancer. Nutrients. (2022) 14:1–16. doi: 10.3390/nu14081555
52. Chen, K, Yang, F, Zhu, X, Qiao, G, Zhang, C, Tao, J, et al. Association between pro-inflammatory diet and liver cancer risk: a systematic review and meta-analysis. Public Health Nutr. (2023) 26:2780–9. doi: 10.1017/S1368980023002574
53. Yang, J, Ma, J, Jin, Y, Cheng, S, Huang, S, and Wang, Y. Dietary inflammatory index and ovarian Cancer risk: a Meta-analysis. Nutr Cancer. (2022) 74:796–805. doi: 10.1080/01635581.2021.1931366
54. Liu, ZY, Gao, XP, Zhu, S, Liu, YH, Wang, LJ, Jing, CX, et al. Dietary inflammatory index and risk of gynecological cancers: a systematic review and meta-analysis of observational studies. J Gynecol Oncol. (2019) 30:e23. doi: 10.3802/jgo.2019.30.e23
55. Ernst, P . The role of inflammation in the pathogenesis of gastric cancer. Aliment Pharmacol Ther. (1999) 13:13–8. doi: 10.1046/j.1365-2036.1999.00003.x
56. Hamada, S, Masamune, A, and Shimosegawa, T. Inflammation and pancreatic cancer: disease promoter and new therapeutic target. J Gastroenterol. (2014) 49:605–17. doi: 10.1007/s00535-013-0915-x
57. Monteleone, G, Pallone, F, and Stolfi, C. The dual role of inflammation in colon carcinogenesis. Int J Mol Sci. (2012) 13:11071–84. doi: 10.3390/ijms130911071
58. Porta, C, Larghi, P, Rimoldi, M, Totaro, MG, Allavena, P, Mantovani, A, et al. Cellular and molecular pathways linking inflammation and cancer. Immunobiology. (2009) 214:761–77. doi: 10.1016/j.imbio.2009.06.014
59. Karin, M, and Greten, FR. NF-κB: linking inflammation and immunity to cancer development and progression. Nat Rev Immunol. (2005) 5:749–59. doi: 10.1038/nri1703
60. Farvid, MS, Sidahmed, E, Spence, ND, Mante Angua, K, Rosner, BA, and Barnett, JB. Consumption of red meat and processed meat and cancer incidence: a systematic review and meta-analysis of prospective studies. Eur J Epidemiol. (2021) 36:937–51. doi: 10.1007/s10654-021-00741-9
61. Wang, X, Lin, X, Ouyang, YY, Liu, J, Zhao, G, Pan, A, et al. Red and processed meat consumption and mortality: dose–response meta-analysis of prospective cohort studies. Public Health Nutr. (2016) 19:893–905. doi: 10.1017/S1368980015002062
62. Mohammadzadeh, M, Bahrami, A, Ghafouri-Taleghani, F, Khalesi, S, Abdi, F, and Hejazi, E. Dietary iron and the risk of lung cancer. Int J Vitam Nutr Res. (2023) 94:264–74. doi: 10.1024/0300-9831/a000789
63. Azadbakht, L, and Esmaillzadeh, A. Red meat intake is associated with metabolic syndrome and the plasma C-reactive protein concentration in women. J Nutr. (2009) 139:335–9. doi: 10.3945/jn.108.096297
64. Ley, SH, Sun, Q, Willett, WC, Eliassen, AH, Wu, K, Pan, A, et al. Associations between red meat intake and biomarkers of inflammation and glucose metabolism in women. Am J Clin Nutr. (2014) 99:352–60. doi: 10.3945/ajcn.113.075663
65. Kennedy, A, Martinez, K, Chuang, C-C, LaPoint, K, and McIntosh, M. Saturated fatty acid-mediated inflammation and insulin resistance in adipose tissue: mechanisms of action and implications. J Nutr. (2009) 139:1–4. doi: 10.3945/jn.108.098269
66. Mozaffarian, D, Pischon, T, Hankinson, SE, Rifai, N, Joshipura, K, Willett, WC, et al. Dietary intake of trans fatty acids and systemic inflammation in women. Am J Clin Nutr. (2004) 79:606–12. doi: 10.1093/ajcn/79.4.606
67. Gamage, S, Dissabandara, L, Lam, AK-Y, and Gopalan, V. The role of heme iron molecules derived from red and processed meat in the pathogenesis of colorectal carcinoma. Crit Rev Oncol Hematol. (2018) 126:121–8. doi: 10.1016/j.critrevonc.2018.03.025
68. Gregor, MF, and Hotamisligil, GS. Inflammatory mechanisms in obesity. Annu Rev Immunol. (2011) 29:415–45. doi: 10.1146/annurev-immunol-031210-101322
69. Gaesser, GA . Whole grains, refined grains, and Cancer risk: a systematic review of Meta-analyses of observational studies. Nutrients. (2020) 12:3756. doi: 10.3390/nu12123756
70. Fardet, A, and Boirie, Y. Associations between food and beverage groups and major diet-related chronic diseases: an exhaustive review of pooled/meta-analyses and systematic reviews. Nutr Rev. (2014) 72:741–62. doi: 10.1111/nure.12153
71. He, K, Xun, P, Brasky, TM, Gammon, MD, Stevens, J, and White, E. Types of fish consumed and fish preparation methods in relation to pancreatic cancer incidence: the VITAL cohort study. Am J Epidemiol. (2013) 177:152–60. doi: 10.1093/aje/kws232
72. Echarte, M, Zulet, MA, and Astiasaran, I. Oxidation process affecting fatty acids and cholesterol in fried and roasted salmon. J Agric Food Chem. (2001) 49:5662–7. doi: 10.1021/jf010199e
73. Blum, A, Monir, M, Khazim, K, Peleg, A, and Blum, N. Tomato-rich (Mediterranean) diet does not modify inflammatory markers. University of Toronto Press, Toronto, ON (2007). p. E70–E74, 30
74. Li, Y-F, Chang, Y-Y, Huang, H-C, Wu, Y-C, Yang, M-D, and Chao, P-M. Tomato juice supplementation in young women reduces inflammatory adipokine levels independently of body fat reduction. Nutrition. (2015) 31:691–6. doi: 10.1016/j.nut.2014.11.008
75. Noa Markovits, M, and Yishai, Levy M. The effect of tomato-derived lycopene on low carotenoids and enhanced systemic inflammation and oxidation in severe obesity. Wiley Online Library (2009).
76. Marcotorchino, J, Romier, B, Gouranton, E, Riollet, C, Gleize, B, Malezet-Desmoulins, C, et al. Lycopene attenuates LPS-induced TNF-α secretion in macrophages and inflammatory markers in adipocytes exposed to macrophage-conditioned media. Mol Nutr Food Res. (2012) 56:725–32. doi: 10.1002/mnfr.201100623
Keywords: EDIP, cancer, cancer-specific mortality, meta-analysis, empirical dietary inflammatory pattern
Citation: Hosseini FS, Nikparast A, Etesami E, Javaheri-Tafti F and Asghari G (2024) The association between empirical dietary inflammatory pattern and risk of cancer and cancer-specific mortality: a systematic review and meta-analysis of prospective cohort studies. Front. Nutr. 11:1462931. doi: 10.3389/fnut.2024.1462931
Edited by:
Jean-Marc A. Lobaccaro, Université Clermont Auvergne, FranceReviewed by:
Xiaobin Gu, First Affiliated Hospital of Zhengzhou University, ChinaDenisse Castro-Eguiluz, National Council of Science and Technology (CONACYT), Mexico
Copyright © 2024 Hosseini, Nikparast, Etesami, Javaheri-Tafti and Asghari. This is an open-access article distributed under the terms of the Creative Commons Attribution License (CC BY). The use, distribution or reproduction in other forums is permitted, provided the original author(s) and the copyright owner(s) are credited and that the original publication in this journal is cited, in accordance with accepted academic practice. No use, distribution or reproduction is permitted which does not comply with these terms.
*Correspondence: Golaleh Asghari, Z19hc2doYXJpQGhvdG1haWwuY29t