 Yunxia Feng
 Yuan Li
 Shuo Chen4
- 1Department of Nephrology, Mianyang Central Hospital, University of Electronic Science and Technology of China, Mianyang, China
- 2Department of Anesthesiology, Affiliated Hospital of Zunyi Medical University, College of Anesthesiology, Zunyi Medical University, Zunyi, China
- 3Department of Anesthesiology, Mianyang Hospital of Traditional Chinese Medicine, Mianyang, China
- 4Department of Critical Care Medicine, Mianyang Central Hospital, University of Electronic Science and Technology of China, Mianyang, China
Introduction: The association between serum vitamin A (VA) levels and outcomes in chronic kidney disease (CKD) patients remains unclear.
Methods: This was a population-based cohort study. CKD participants from the National Health and Nutrition Examination Survey (NHANES) database were included for analysis. The primary outcome was all-cause mortality. Person correlation analysis and Cox regression models were used to assess the relation between serum VA levels and all-cause mortality among individuals with CKD.
Results: There were 689 participants included in this study. The serum VA level was 2.45 ± 1.06 μmol/L. The overall mortality was 43.69%. The participants in the nonsurvival group had higher serum VA levels than those in the survival group (2.18 ± 0.82 vs. 2.78 ± 1.24 μmol/L, p < 0.01). Serum VA concentrations were positively correlated with serum creatinine levels (r = 0.56, p < 0.01) and urea nitrogen (r = 0.58, p < 0.01) but negatively correlated with eGFR (r = −0.56, p < 0.01). The serum VA level was independently related to all-cause mortality (hazard ratio (HR) = 1.15, [95% CI: 1.01–1.31], p = 0.03). The Kaplan–Meier survival analysis suggested that the survival probability was lower in participants with serum VA levels exceeding 2.09 μmol/L than in participants with serum VA levels below 2.09 μmol/L (p < 0.0001).
Conclusion: A high serum VA was independently related to all-cause mortality in CKD patients. VA requirements for patients with CKD is worth studies in the future.
1 Introduction
Chronic kidney disease (CKD) is a progressive chronic condition characterized by a gradual decline in renal function (1). Approximately 10–15% of the world’s population suffers from CKD (2), affecting more than 25 million adults in the United States (3). The increasing incidence of CKD also represents a major public health burden in East Asia (4). In South Korea, the prevalence of CKD among individuals aged 20 and above is 8.2% (5). Annually, CKD is responsible for the deaths of 120 million people and results in 2.8 billion years of life lost (6). Furthermore, the global incidence of CKD is increasing (7–9). A study on the global kidney disease burden reported a 41.5% increase in CKD-related mortality from 1990 to 2017 (2). By 2040, CKD is projected to become the fifth leading cause of death worldwide, with the highest expected increase among all causes of death (10). In addition, CKD is also associated with comorbidities such as cardiovascular diseases and infections (11). Despite recent advancements in slowing disease progression and managing comorbidities, CKD patients are still at high risk of mortality (12). Early intervention and treatment are crucial for improving patient survival (13). Therefore, identifying biomarkers associated with CKD mortality is essential for early intervention in high-risk populations.
Vitamin A (VA), a group of fat-soluble micronutrients, including retinol, retinoic acid, and retinol ester, plays an important role in health (14, 15). Studies have reported that VA can serve as a nutritional indicator and is associated with the severity of the disease (16, 17). Recently, experimental studies have revealed that retinoic acid can alleviate kidney damage and inhibit kidney fibrosis (18–20). In addition, the kidneys play a key role in maintaining VA homeostasis in the body. Retinol is filtered by the renal glomerulus, with over 99% being reabsorbed by the proximal tubules (21). Animal studies have shown that impaired renal function can increase urinary retinol excretion (22). Whether the serum VA is related to long-term outcomes in the CKD population remains unclear. The aim of this study was to investigate the association between serum VA levels and long-term outcomes in patients with CKD. In this study, we found that higher serum VA correlated with lower eGFR, and higher serum creatinine and urea nitrogen in the CKD population. Furthermore, high serum VA levels were associated with increased all-cause mortality in the CKD population.
2 Materials and methods
2.1 Study population
The National Health and Nutrition Examination Survey (NHANES) is a population-based cross-sectional survey that investigates epidemiological information about the health and nutritional status of the US population. The survey collected data through interviews at home, physical examinations in mobile centers, and laboratory tests. The National Centre for Health Statistics (NCHS) ethics review board approved the NHANES protocol, and the data provided by the NHANES were anonymized and publicly available. All participants provided informed consent. Detailed information about the NHANES can be found at https://www.cdc.gov/nchs/nhanes.
In this study, we screened CKD participants who underwent serum VA level testing between 1999 and 2018. Serum VA levels were measured in the 1999–2000, 2001–2002, 2003–2004, 2005–2006, and 2017–2018 cycles, with a total of 37,153 participants. Based on self-reported CKD diagnoses, we identified 697 participants. Those without serum creatinine levels and those with missing follow-up data were excluded, resulting in a final sample of 689 participants. The data collection flow is illustrated in Figure 1.
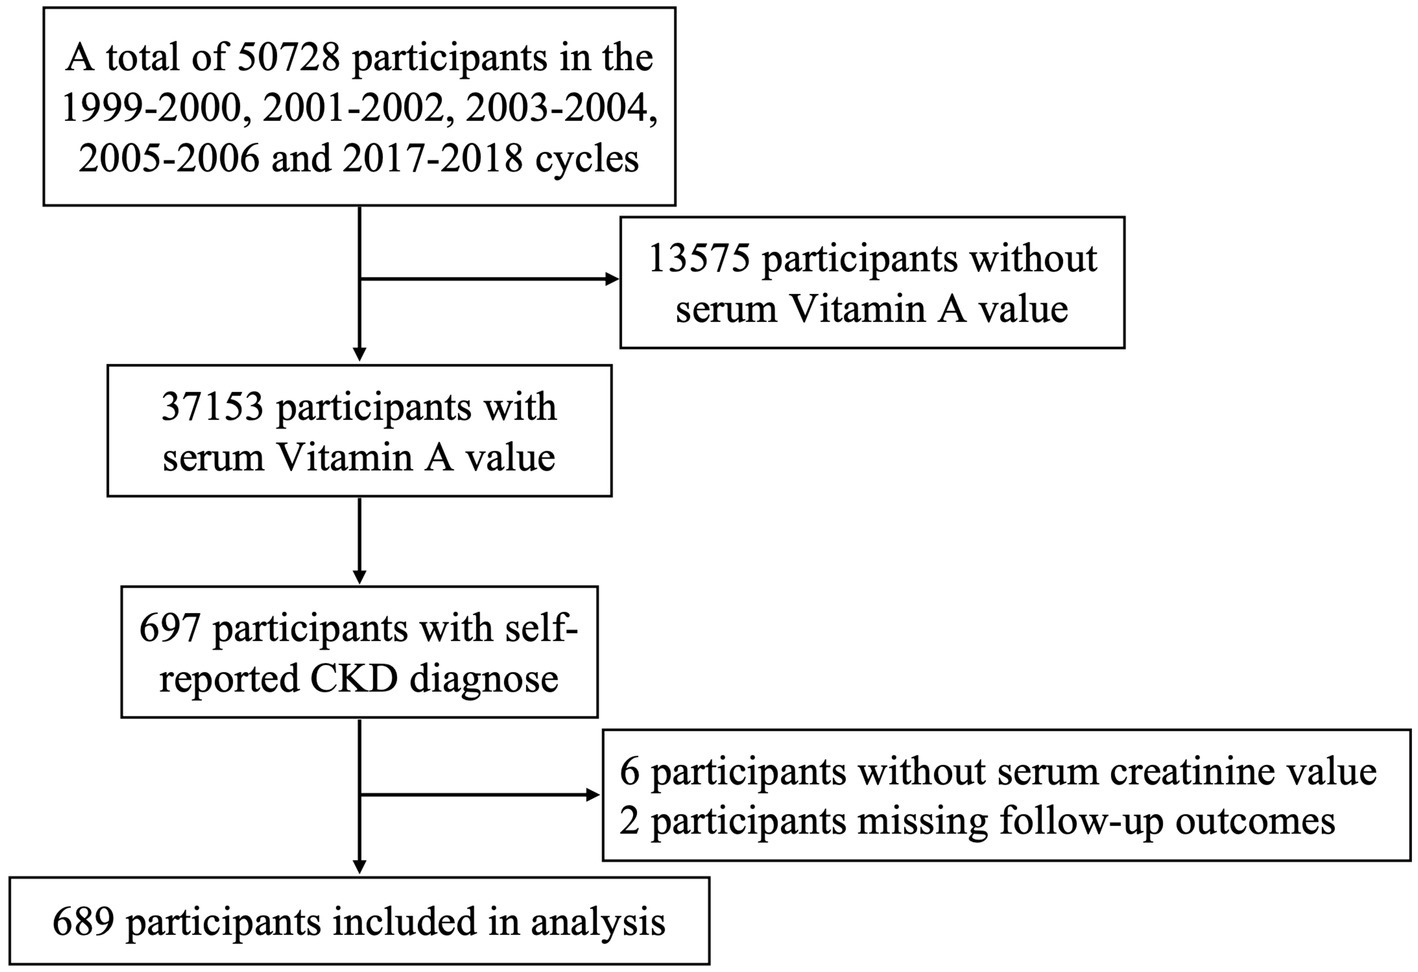
Figure 1. The flow chart of study participants.
2.2 Data collection
We collected demographic characteristics such as sex, age, and race, as well as socioeconomic factors such as education level (less than 9th grade, 9–11th grade, high school graduate/GED or equivalent, some college or AA degree, college graduate or above) and the ratio of family income to poverty (dividing Family Income by the Poverty Threshold). Self-reported dialysis history within the past 12 months was collected. Body mass index (BMI) was calculated by dividing the weight (in kg) by the squared height (in m2). All serum specimens were processed, stored, and shipped to the Division of Laboratory Sciences in National Center for Environmental Health for analysis. Laboratory indicators, including serum creatinine (Cr), blood urea nitrogen (BUN), and serum VA levels, were also collected. The estimated glomerular filtration rate (eGFR) was calculated using the four-variable modification of diet in renal disease (MDRD) equation (23). Additionally, we collected data on dietary VA intake. Dietary intakes of vitamin A were calculated using USDA’s Food and Nutrient Database for Dietary Studies 2017–2018 (FNDDS 2017–2018).
2.3 Primary outcome
The primary outcome was all-cause mortality among CKD patients. The all-cause mortality rate data for the NHANES cohort came from the NCHS records prior to December 31, 2019.
2.4 Statistical analysis
Normally distributed continuous data are represented by the mean ± standard deviation (SD), while nonnormally distributed data are represented by the interquartile range. Categorical variables are represented by frequencies and percentages. Student’s t test and the Kruskal–Wallis H test were used to compare continuous variables, while the chi–square test was used to compare categorical variables. We used 3 Cox regression models to evaluate the associations between serum VA levels and all-cause mortality among CKD patients. Model 1 was an unadjusted crude model. Model 2 was adjusted for age, sex, and race. In Model 3, we adjusted for age, sex, race, education level, and serum creatinine. The detailed associations between serum VA levels and risk of mortality were assessed by restricted cubic spline curves based on Cox regression models. The number of knots was set as 4 in the current study because 4 knots are a good compromise between flexibility and overfitting and could provide sufficient fit of the model (24).
We divided the CKD participants into two groups: the group with serum vitamin A levels less than 2.09 μmol/L (the upper limit of normal range of serum vitamin A) and the group with serum VA levels greater than 2.09 μmol/L. Kaplan–Meier (KM) curves were used to assess differences in survival between the two groups of participants with CKD. Pearson correlation was performed to analyze the correlation between serum VA levels and serum creatinine (Cr), blood urea nitrogen (BUN), and eGFR. We also analyzed the association between serum VA levels and all-cause mortality in CKD patients who received dialysis treatment.
All the statistical analyses were performed using R software (version 4.3.1). A two-tailed p value <0.05 was considered to indicate statistical significance.
3 Results
The baseline characteristics are shown in Table 1. Among the 689 participants, the median age was 64.0 (50.0, 75.0) years. The serum VA level was 2.45 ± 1.06 μmol/L. Serum VA levels exceeded 2.09 μmol/L in 399 (57.91%) participants (Figure 2B). Serum VA concentrations gradually increased with progression of chronic kidney disease (Figure 2C). The dietary intake of VA was 436.0 (229.0, 710.0) mcg. By the end of the follow-up, a total of 301 participants had died, with a mortality of 43.69%. The age of the nonsurvival group was greater than that of the survival group (70.0 (61, 79) vs. 57 (43, 69.25) years, p < 0.01). There were significant differences between the two groups in terms of sex, race, and education level. There were no significant differences between the two groups in terms of family income to poverty, BMI, and VA intake. The eGFR in the nonsurvival group was significantly lower than that in the survival group (52.21 ± 35.18 vs. 74.85 ± 38.37 mL/min/1.73 m2, p < 0.01). The participants in the nonsurvival group had higher serum VA levels than those in the survival group (2.78 ± 1.24 vs. 2.18 ± 0.82 μmol/L, p < 0.01).
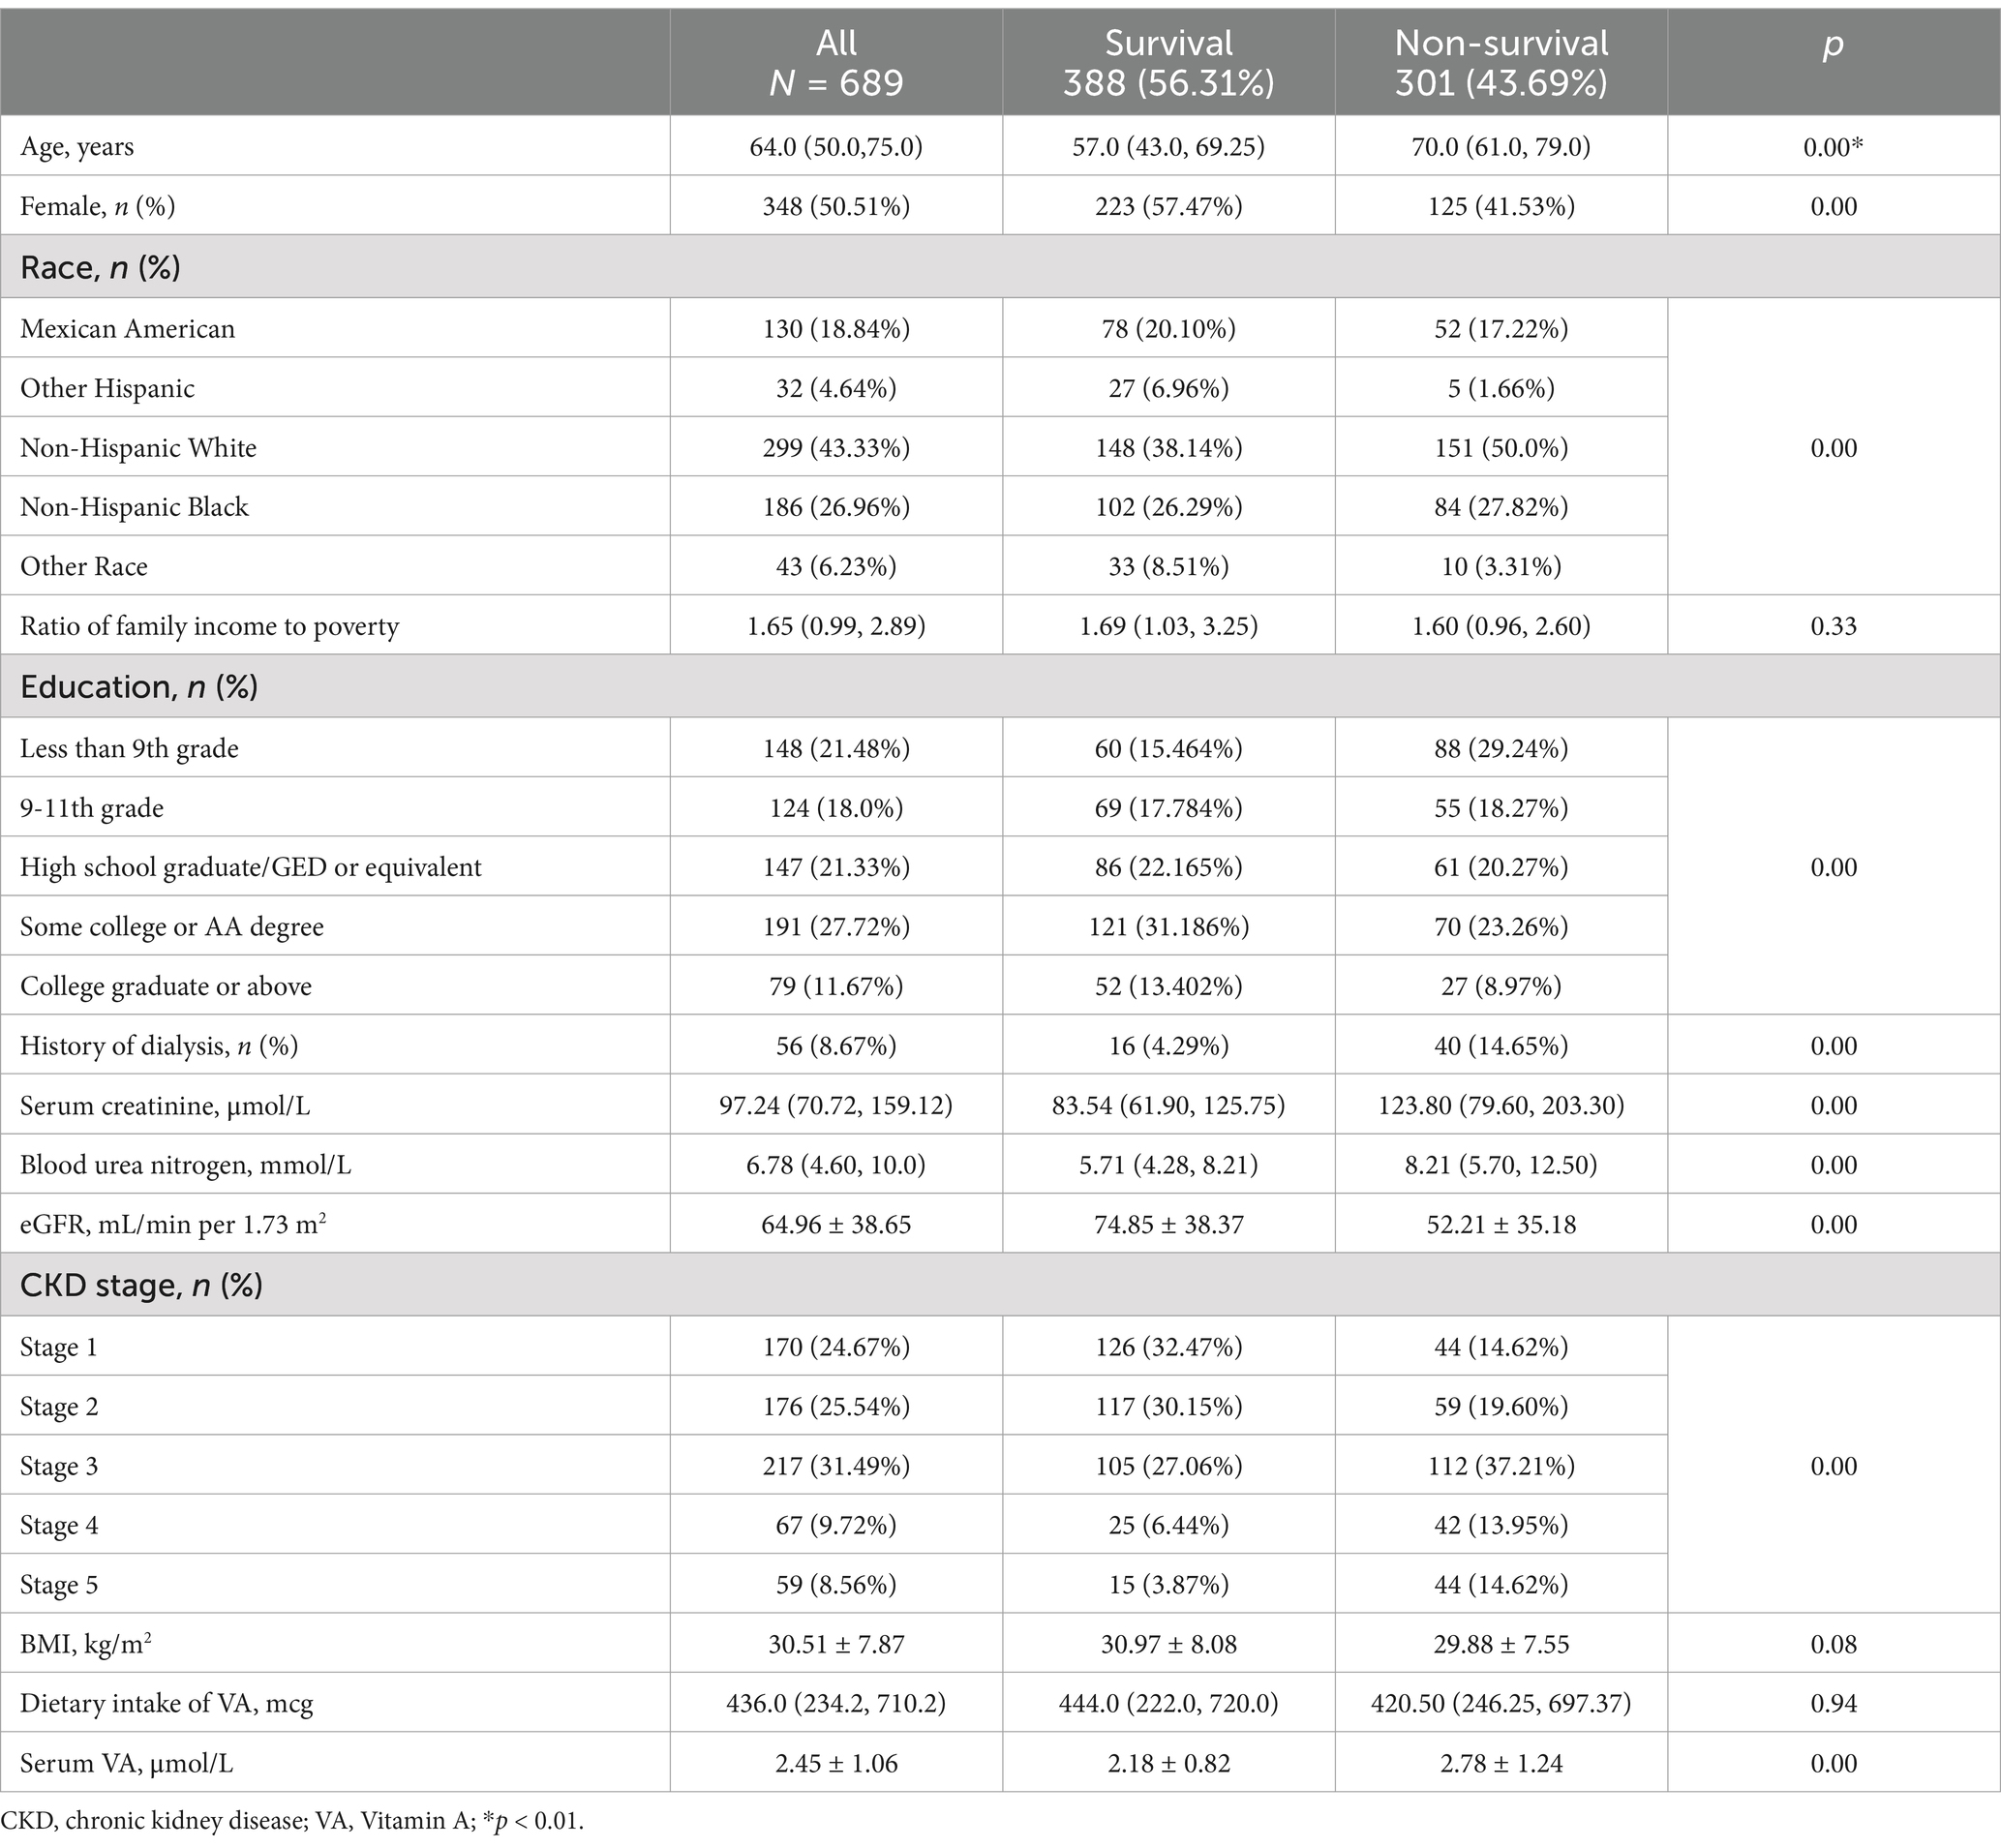
Table 1. Baseline characteristics of the 689 participants with CKD.
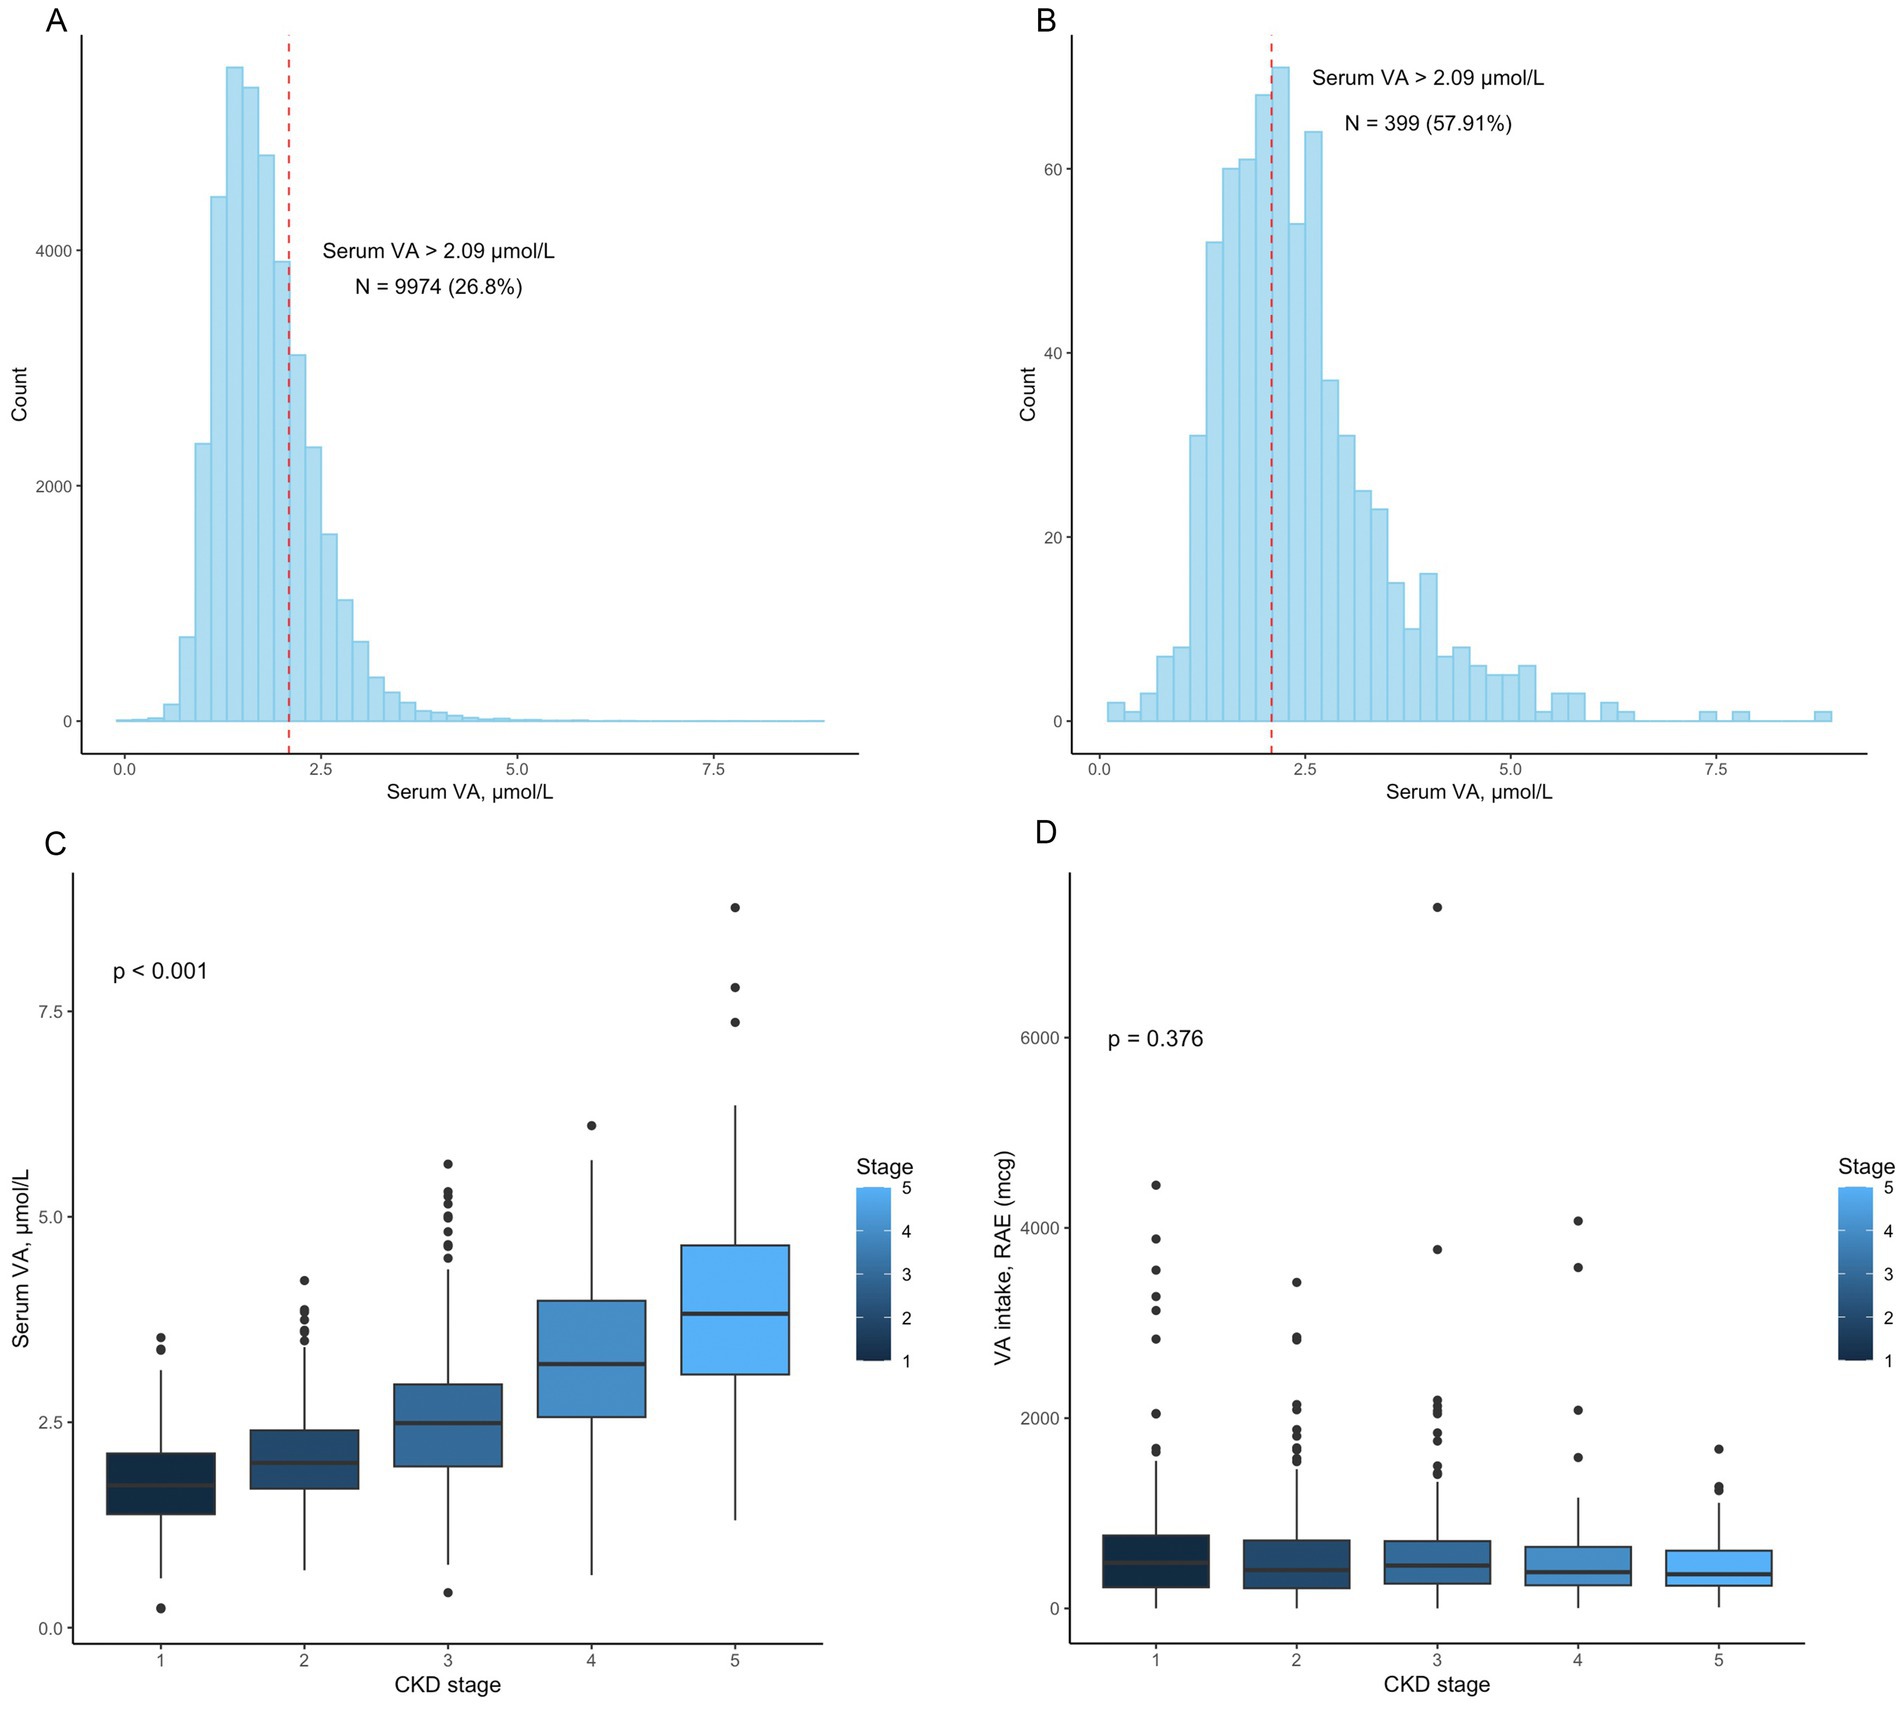
Figure 2. (A) The distribution of vitamin A levels in the 37153 participants. A total of 9974 (26.80%) patients had vitamin A levels that exceeded 2.09 μmol/L; (B) The distribution of vitamin A levels in the 689 participants. A total of 399 (57.91%) patients had vitamin A levels that exceeded 2.09 μmol/L; (C) Serum vitamin A levels in patients with different CKD stages (p < 0.001); (D) Vitamin A intake in patients with different CKD stages (p = 0.376).
We performed Pearson correlation to explore the correlation between serum VA levels and creatinine, urea nitrogen, and eGFR (Figure 3). The results showed that serum VA concentrations were positively correlated with serum creatinine levels, with a correlation coefficient of 0.56 (p < 0.01). VA levels were also positively correlated with urea nitrogen, with a correlation coefficient of r = 0.58 (p < 0.01). However, the serum vitamin A concentration was negatively correlated with the eGFR, with a correlation coefficient of r = −0.56 (p < 0.01).
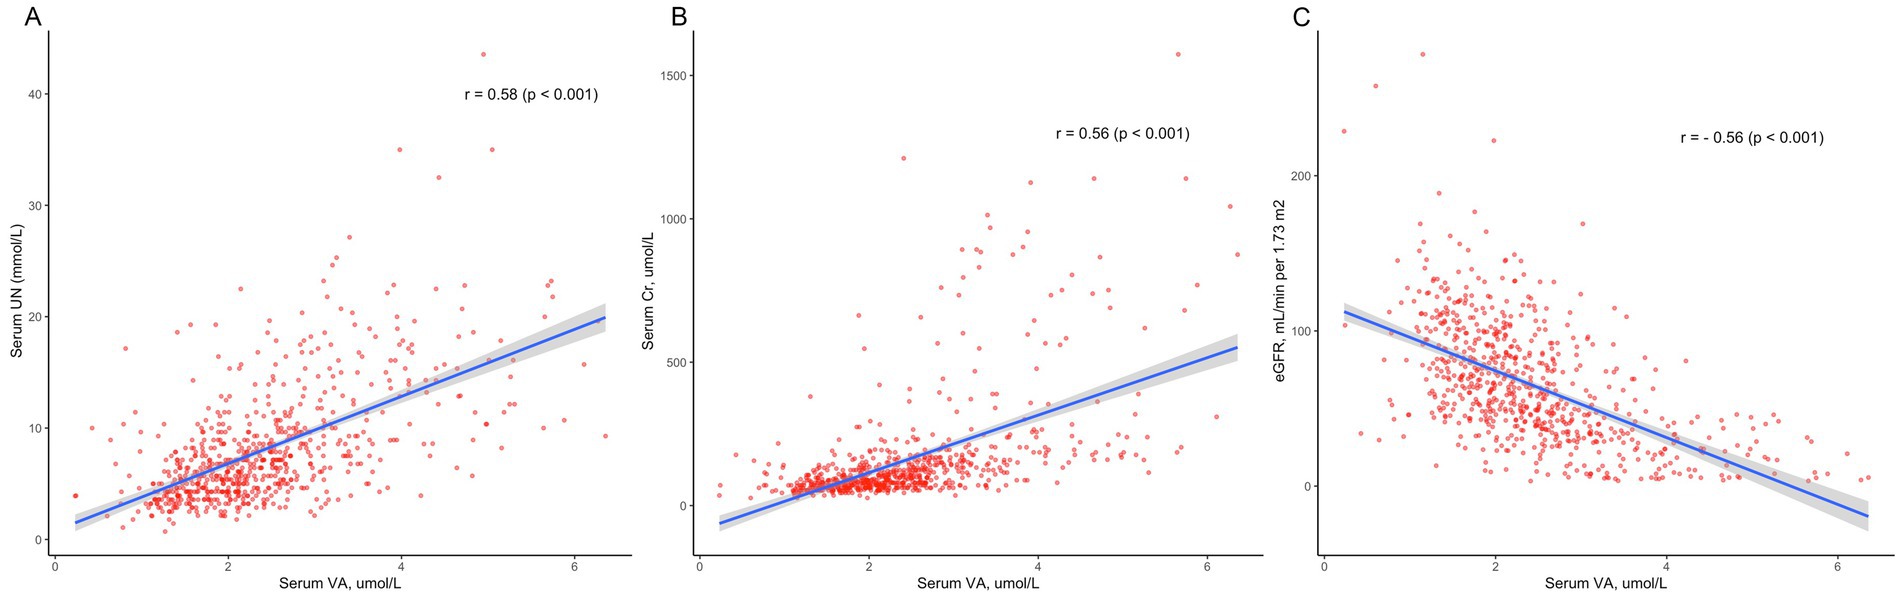
Figure 3. The correlation between serum vitamin A levels and kidney function. (A) Serum vitamin A levels were positively correlated with serum creatinine (Cr) levels (r = 0.56, p < 0.01). (B) Serum vitamin A levels were positively correlated with urea nitrogen (UN; r = 0.58, p < 0.01). (C) Serum vitamin A concentrations were negatively correlated with the eGFR (r = −0.56, p < 0.01).
We conducted univariate Cox regression analysis (Table 2), and the results showed that serum VA levels were related to mortality (hazard ratio (HR) = 1.37, 95% confidence interval (CI): 1.26–1.50, p < 0.01). Sex, age, race, education level and serum creatinine were related to all-cause mortality in the univariate analysis. After adjustment for age, sex, and race in the model 2, serum VA levels were associated with increased risk of mortality [HR = 1.24 (95% CI: 1.13–1.37)]. In the model 3, the serum VA level was independently related to all-cause mortality, with a HR = 1.15 (95% CI: 1.01–1.31, p = 0.03). In the restricted cubic spline analysis, VA levels >2.22 μmol/L were associated with increased risk of mortality in the rude model (Figure 4A). In the adjusted cubic spline, VA levels >2.22 μmol/L and <1.05 μmol/L were associated with increased risk of mortality (Figure 4B).
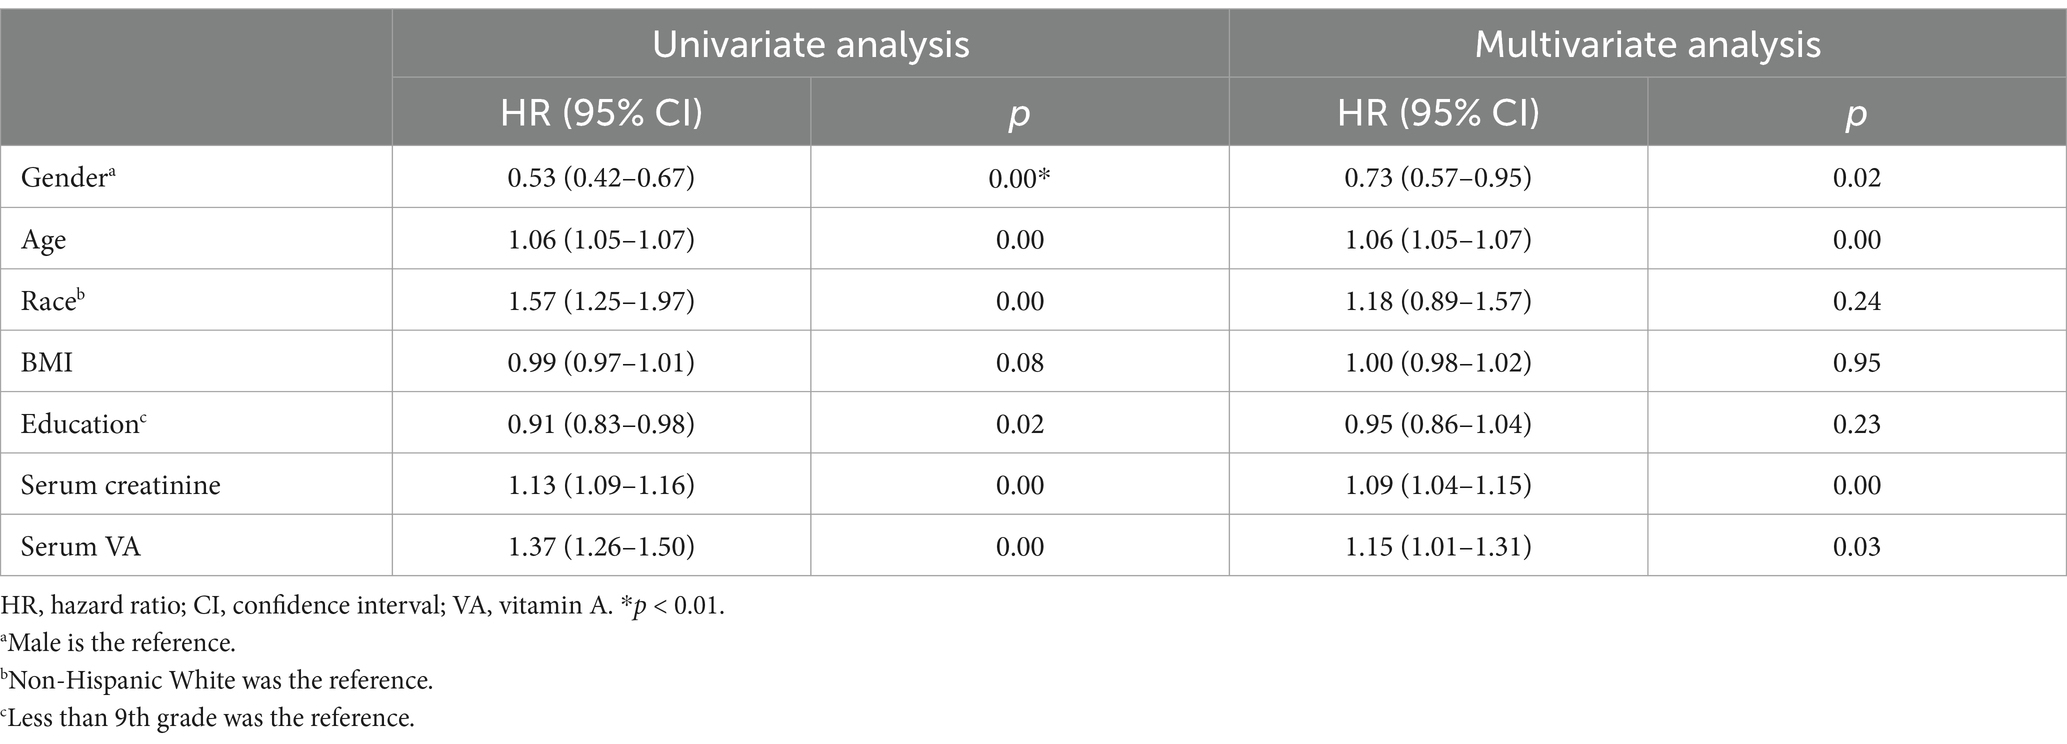
Table 2. Cox regression analyses for association between factors and all-cause mortality.
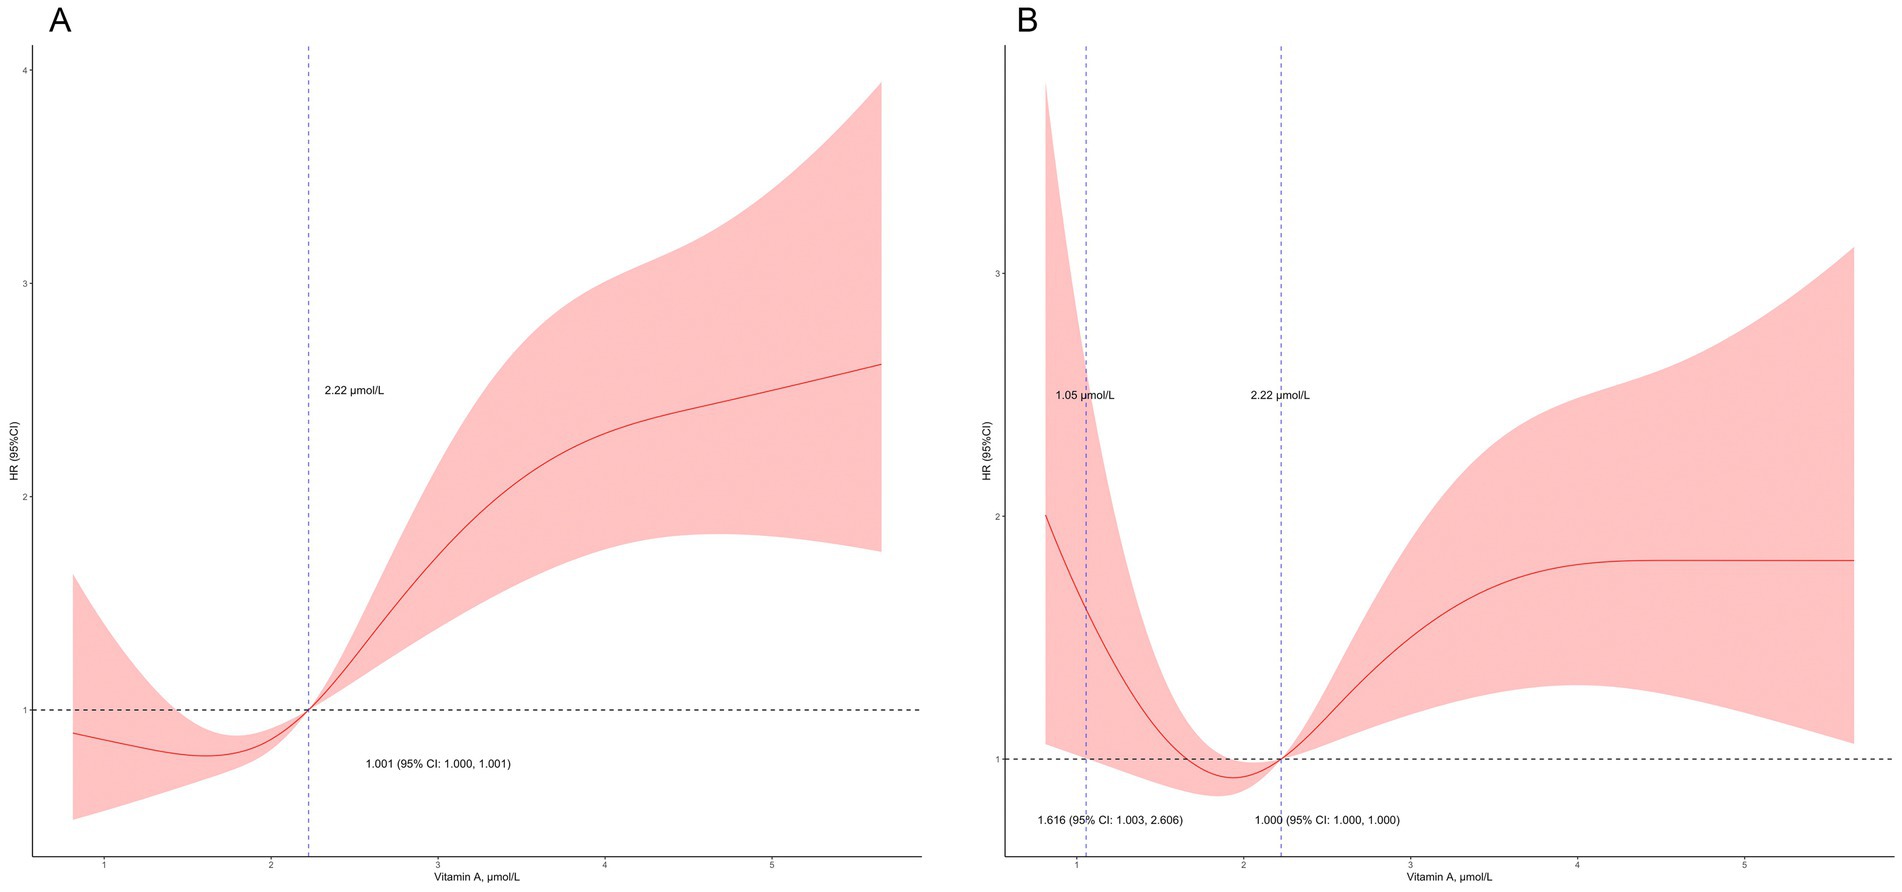
Figure 4. Detailed association between serum vitamin A levels and mortality. (A) Vitamin A levels >2.22 μmol/L was related to increased risk of mortality; (B) Vitamin A levels >2.22 μmol/L and <1.05 μmol/L were related to increased risk of mortality in the adjusted model (adjusted for age, sex, race, education level, and serum creatinine).
Figure 5 shows the Kaplan–Meier survival curves for participants with serum VA levels below 2.09 μmol/L and participants with serum VA levels exceeding 2.09 μmol/L. The results of the KM analysis suggested that the survival probability was lower in participants with serum VA levels exceeding 2.09 μmol/L than in participants with serum VA levels below 2.09 μmol/L. According to the log-rank test, this difference was highly statistically significant (p < 0.0001).
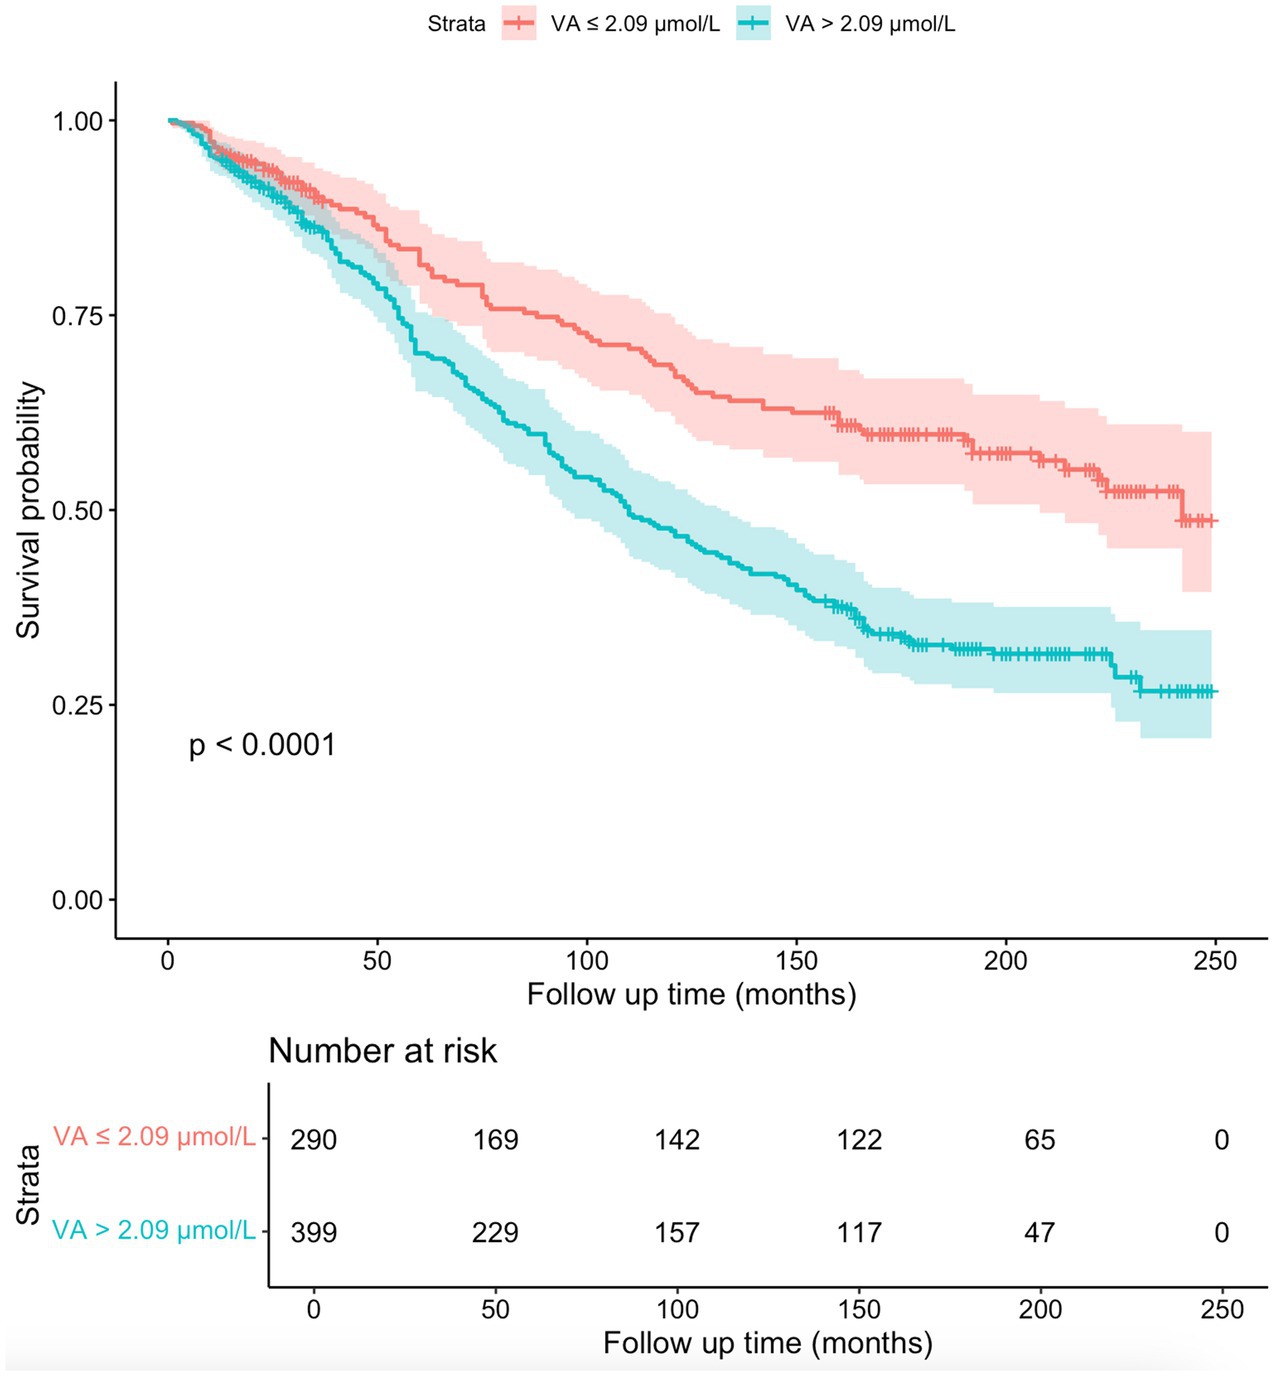
Figure 5. The Kaplan–Meier survival curves for the 689 participants. The survival probability was lower in participants with serum VA levels exceeding 2.09 μmol/L than in participants with serum VA levels below 2.09 μmol/L (p < 0.0001).
We performed a subgroup analysis of CKD patients who received dialysis treatment. Fifty-six (8.67%) participants had a history of dialysis within the past 12 months (Table 1). The characteristics of the 56 patients are shown in Table 3. All-cause mortality was 71.43%. A total of 87.50% of participants had a serum VA level exceeding 2.09 μmol/L (Figure 6). The serum VA level in participants with a history of dialysis (3.66 ± 1.45 μmol/L) was much greater than that in the CKD population (2.45 ± 1.06 μmol/L). The serum VA level in the survival group was slightly greater than that in the nonsurvival group (3.78 ± 1.46 vs. 3.61 ± 1.46 μmol/L), but the difference was not significant. Among the 56 participants, the difference in survival probability was not significant between participants with serum vitamin A levels exceeding 2.09 μmol/L and participants with serum vitamin A levels below 2.09 μmol/L (p = 0.25).
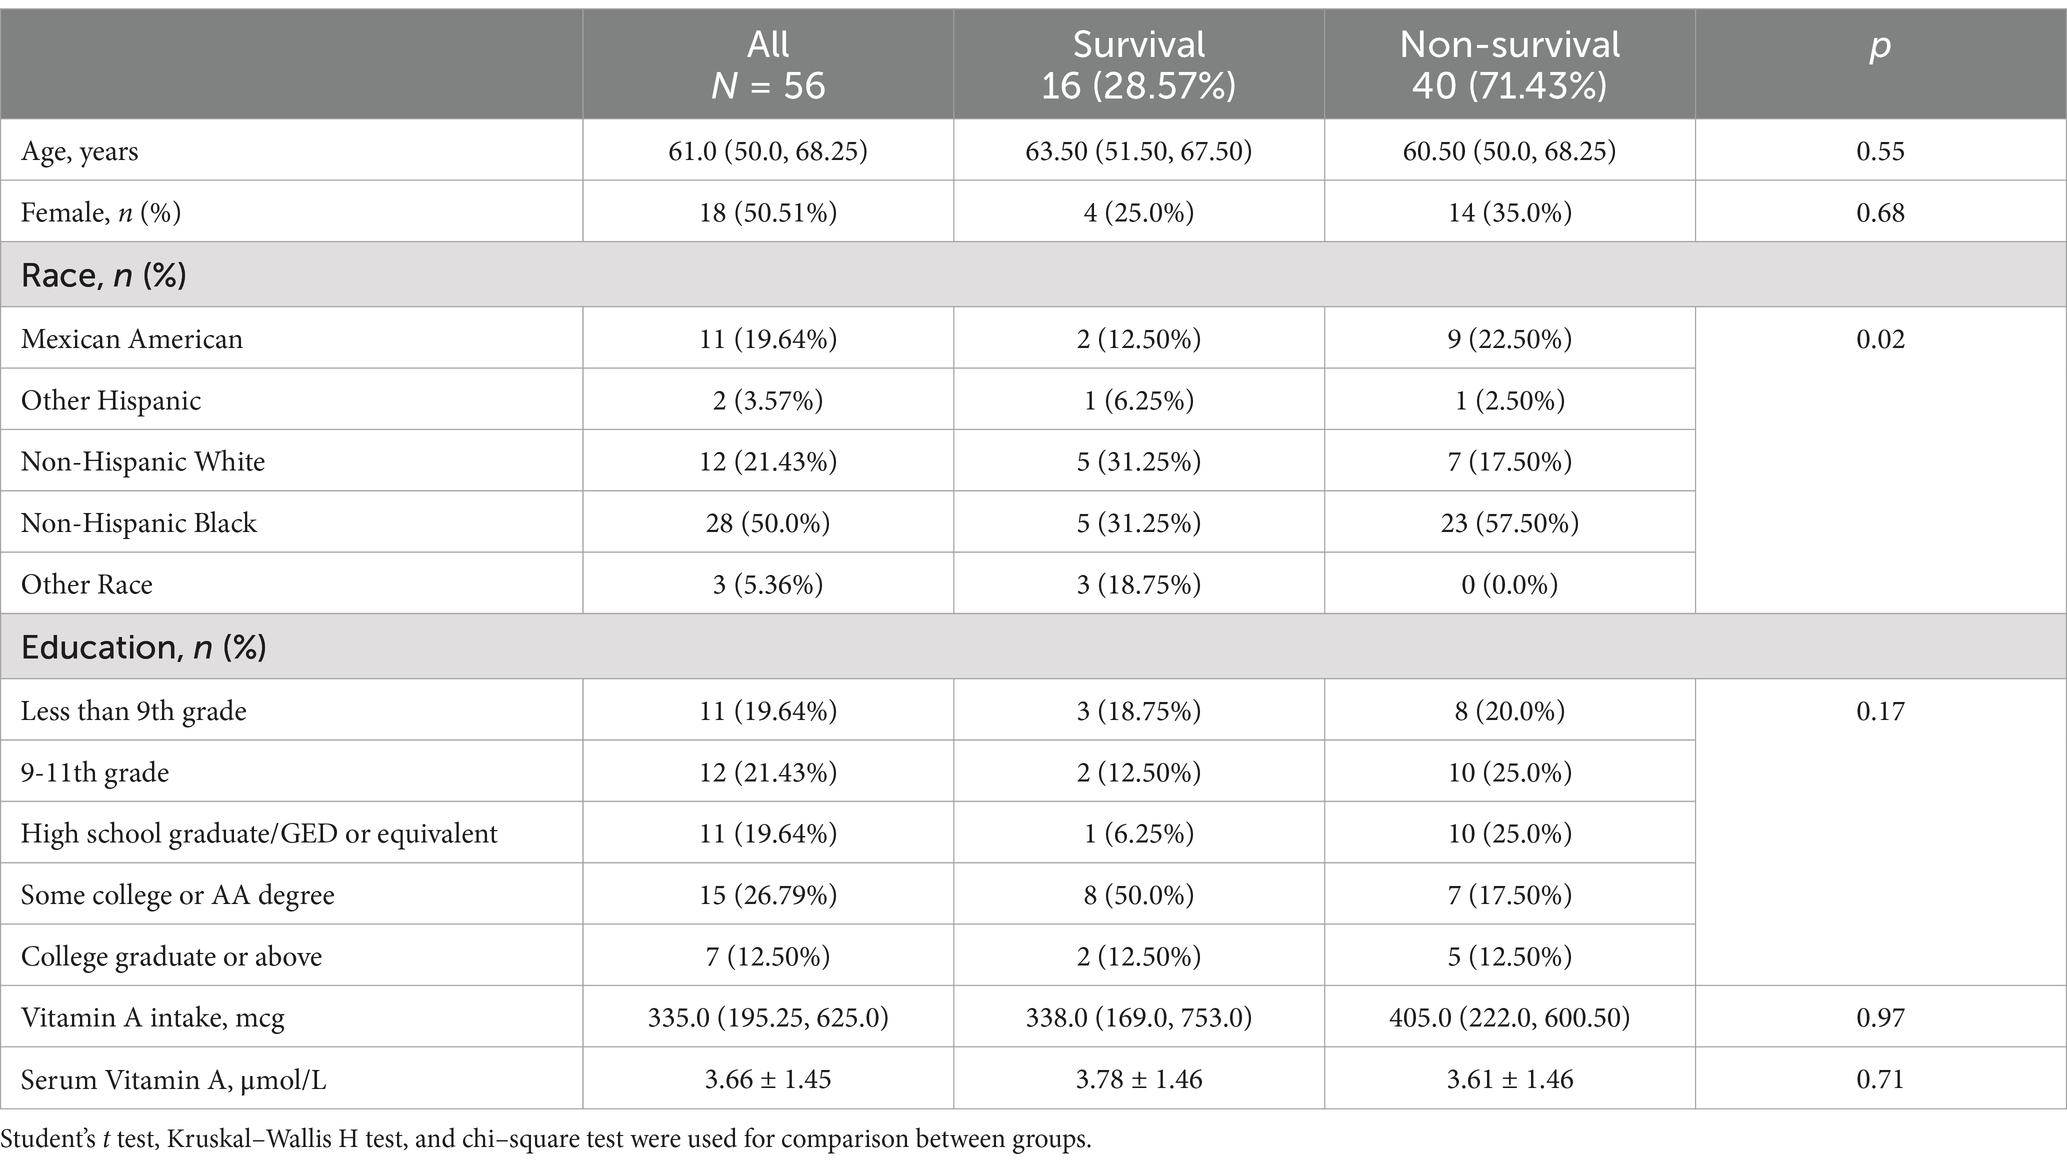
Table 3. The characteristics of the 56 CKD participants with History of dialysis.
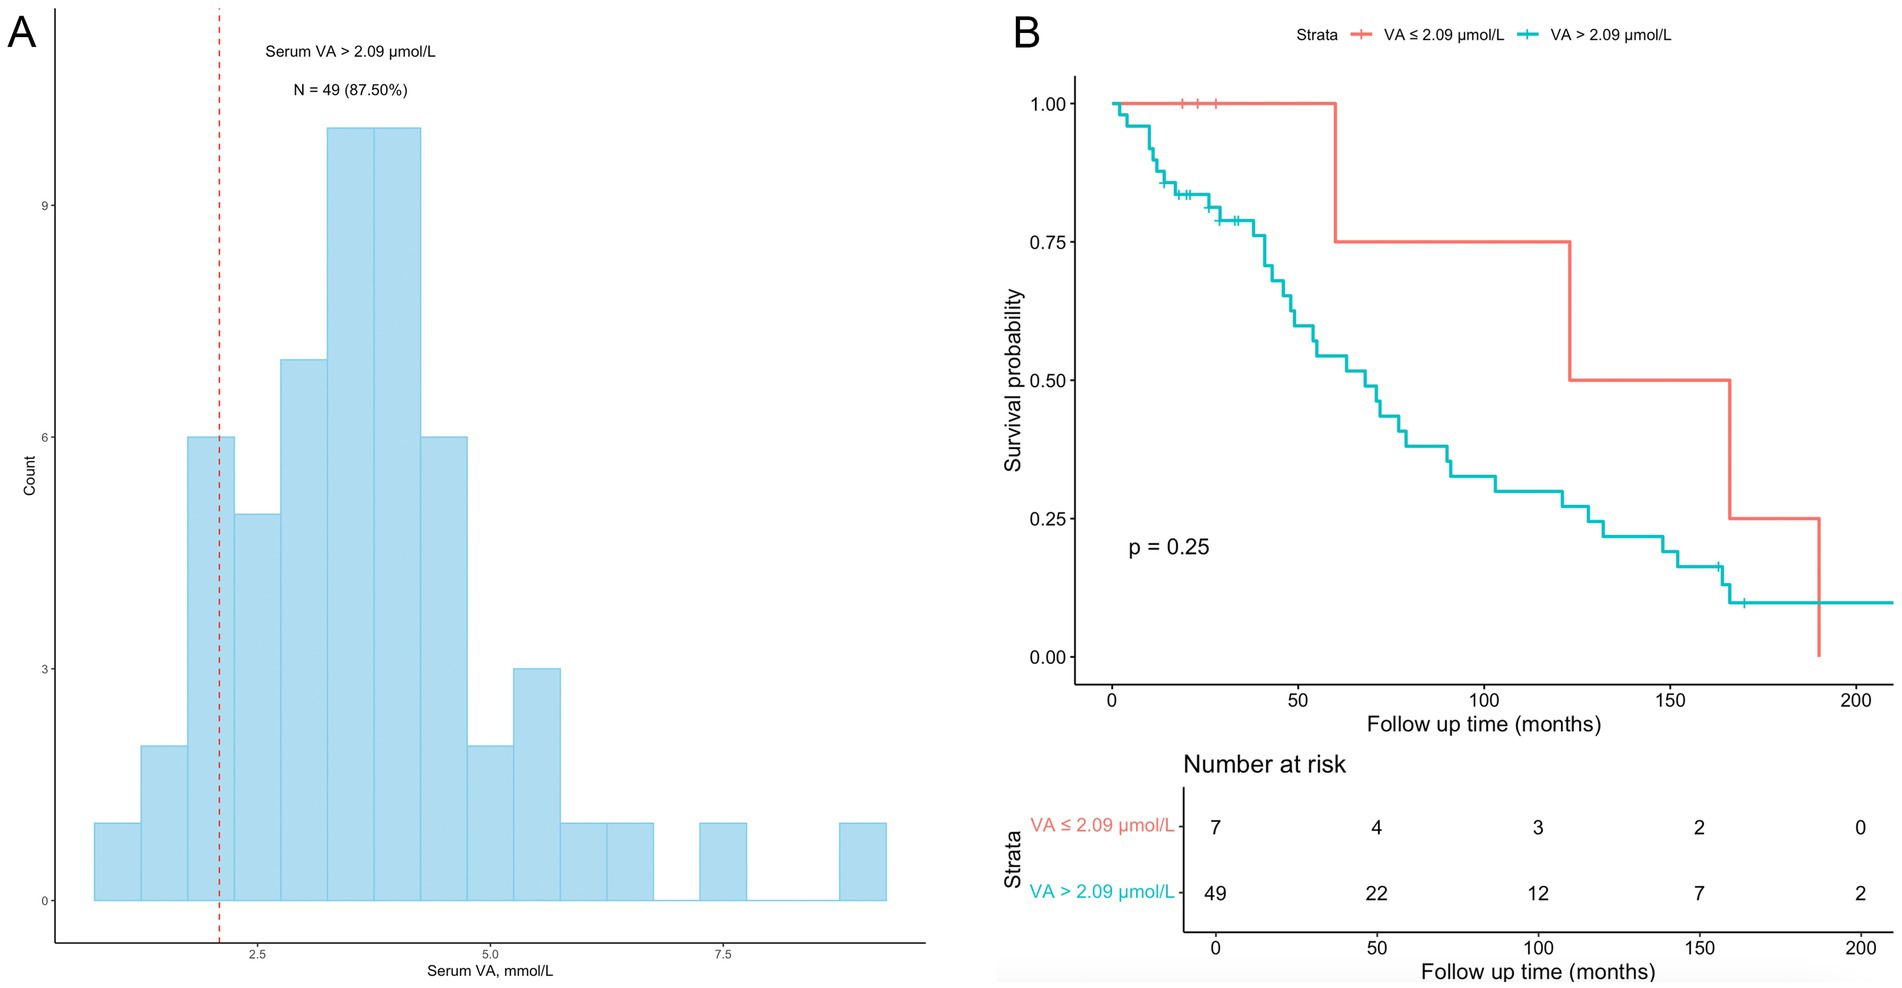
Figure 6. Subgroup analyses among CKD patients with a history of dialysis. (A) the distribution of vitamin A levels among the 56 participants with a history of dialysis; 49 (87.50%) had vitamin A levels exceeding 2.09 μmol/L. (B) Kaplan–Meier survival curves for the 56 participants; the difference in survival probability was not significant between participants with serum vitamin A levels exceeding 2.09 μmol/L and participants with serum vitamin A levels below 2.09 μmol/L (p = 0.25).
4 Discussion
This study analyzed the association between serum VA levels and all-cause mortality in CKD patients in the NHANES database. The results showed that the serum VA level in the nonsurvival group of CKD patients was greater than that in the survival group. Correlation analysis revealed that the serum VA was negatively correlated with the eGFR and positively correlated with the creatinine and urea nitrogen levels. Serum VA levels were independently related to all-cause mortality with nonlinear pattern among the CKD population.
The kidney plays an important role in maintaining the homeostasis of serum VA levels. Retinol can be filtered out of the glomerulus, after which most of the retinol is reabsorbed by the proximal renal tubules. Animal experiments have revealed that damage to the proximal renal tubules can increase the concentration of retinol binding protein and retinol in the urine, leading to increase in loss of retinol (25). However, the serum VA level in our study population was 2.45 ± 1.06 μmol/L, higher than the recommended upper limit of the serum VA level (2.09 μmol/L) (14). More than half of the participants had serum VA levels greater than 2.09 μmol/L, while there is only 12% of NHANES general population had serum VA levels exceeding 2.09 μmol/L (26), suggesting that renal function insufficiency can lead to an increase in serum VA levels. CKD patients often suffer from glomerular damage (27). Although tubular damage can lead to excessive loss of VA, glomerular damage prevents serum VA from being filtered through the glomerulus, leading to the accumulation of VA in serum (28). In our study, we found that the serum VA level was negatively correlated with the eGFR (r = −0.56) and positively correlated with the creatinine and urea nitrogen levels, suggesting that the increase in the circulating VA level is closely related to the decline in glomerular filtration function.
Previous studies have explored the relationship between serum VA levels and the outcome of CKD patients (29). The study followed up 261 dialysis CKD patients for 5 years, and showed that the serum VA level was increased in CKD patients, which is consistent with the results of our study. However, the study revealed that a low serum vitamin A level was an independent predictor of poor prognosis, and a high vitamin A level was related to a lower all-cause mortality risk (HR = 0.733, 95% CI: 0.599–0.896) and cardiovascular mortality risk (HR = 0.694, 95% CI: 0.511–0.942), which is different from our study. In our study, we found that higher serum VA was independently related to all-cause mortality in the CKD population. In addition, we identified participants who received dialysis treatment and found that the serum VA level in the survival group was slightly lower than that in the nonsurvival group (3.78 ± 1.46 vs. 3.62 ± 1.47 μmol/L). Though survival analysis did not reveal a relationship between the serum vitamin A concentration and mortality in participants who received dialysis, the significance of high serum VA levels in dialysis CKD patients may be different from that in nondialysis CKD patients.
In this study, the serum VA level in the nonsurvival group was greater than that in the survival group in the CKD population, but there was no significant difference in the amount of VA intake between the two groups, suggesting that the possible explanation for the increase in the circulating VA level in CKD patients was VA accumulation. Although experimental studies have revealed that retinoic acid can alleviate kidney damage and inhibit kidney fibrosis (18–20), higher VA levels are not associated with better outcomes in this study. More importantly, the serum VA levels in most CKD patients were greater than the upper limit of the recommended level of 2.09 μmol/L, suggesting that the amount of VA in the circulation among CKD patients may exceed tissue needs. Currently, optimal serum VA levels, as well as amounts of daily VA intake, have not been defined for CKD patients (30). As hypervitaminosis A has potential toxicity (31), vitamin A requirements for patients with CKD is worth studies in the future.
This study has several limitations. First, the diagnosis of CKD was based on patient self-reports, which may not be accurate. Second, the date of CKD onset cannot be determined in the NHANES database. Whether a long duration of CKD leads to a high serum VA level should be further studied. Third, we revealed that high serum levels may differentially affect the outcomes of dialysis CKD patients and nondialysis CKD patients. However, there are few cases of dialysis. We failed to reveal a significant relationship between serum vitamin A levels and outcomes in CKD patients with a history of dialysis.
5 Conclusion
In conclusion, this study revealed that serum VA levels in CKD patients were correlated with kidney function. Higher serum VA levels were correlated with lower eGFRs and higher serum creatinine and urea nitrogen levels in the CKD population. Furthermore, a high serum VA was independently related to all-cause mortality in CKD patients. Whether the recommended daily intake of VA needs to be adapted for CKD patients requires further study.
Data availability statement
The datasets presented in this study can be found in online repositories. The names of the repository/repositories and accession number(s) can be found below: https://www.cdc.gov/nchs/nhanes.
Ethics statement
The studies involving humans were approved by National Centre for Health Statistics (NCHS) ethics review board approved. The studies were conducted in accordance with the local legislation and institutional requirements. The participants provided their written informed consent to participate in this study.
Author contributions
YF: Conceptualization, Data curation, Formal analysis, Methodology, Project administration, Writing – original draft, Writing – review & editing. YL: Data curation, Formal analysis, Investigation, Methodology, Writing – original draft. SC: Data curation, Formal analysis, Investigation, Methodology, Software, Writing – original draft. NH: Formal analysis, Software, Writing – original draft. DL: Project administration, Resources, Writing – original draft.
Funding
The author(s) declare that financial support was received for the research, authorship, and/or publication of this article. This study was found by Research Project of Mianyang Central Hospital in 2019 (2019YJ13) and Research Project of Mianyang Municipal Health Commission in 2019 (201938).
Conflict of interest
The authors declare that the research was conducted in the absence of any commercial or financial relationships that could be construed as a potential conflict of interest.
Publisher’s note
All claims expressed in this article are solely those of the authors and do not necessarily represent those of their affiliated organizations, or those of the publisher, the editors and the reviewers. Any product that may be evaluated in this article, or claim that may be made by its manufacturer, is not guaranteed or endorsed by the publisher.
References
1. Chen, TK, Knicely, DH, and Grams, ME. Chronic kidney disease diagnosis and management: a review. JAMA. (2019) 322:1294–304. doi: 10.1001/jama.2019.14745
2. Bikbov, B, Purcell, CA, Levey, AS, Smith, M, Abdoli, A, Abebe, M, et al. Global, regional, and national burden of chronic kidney disease, 1990–2017: a systematic analysis for the global burden of disease study 2017. Lancet. (2020) 395:709–33. doi: 10.1016/S0140-6736(20)30045-3
3. Coresh, J, Selvin, E, Stevens, LA, Manzi, J, Kusek, JW, Eggers, P, et al. Prevalence of chronic kidney disease in the United States. JAMA. (2007) 298:2038–47. doi: 10.1001/jama.298.17.2038
4. Song, Y, Lobene, AJ, Wang, Y, and Hill Gallant, KM. The DASH diet and Cardiometabolic health and chronic kidney disease: a narrative review of the evidence in east Asian countries. Nutrients. (2021) 13:984. doi: 10.3390/nu13030984
5. Park, JI, Baek, H, and Jung, HH. Prevalence of chronic kidney disease in Korea: the Korean National Health and nutritional examination survey 2011-2013. J Korean Med Sci. (2016) 31:915–23. doi: 10.3346/jkms.2016.31.6.915
6. Kalantar-Zadeh, K, Jafar, TH, Nitsch, D, Neuen, BL, and Perkovic, V. Chronic kidney disease. Lancet. (2021) 398:786–802. doi: 10.1016/S0140-6736(21)00519-5
7. Liu, Y, He, Q, Li, Q, Tian, M, Li, X, Yao, X, et al. Global incidence and death estimates of chronic kidney disease due to hypertension from 1990 to 2019, an ecological analysis of the global burden of diseases 2019 study. BMC Nephrol. (2023) 24:352. doi: 10.1186/s12882-023-03391-z
8. Francis, A, Harhay, MN, Ong, ACM, Tummalapalli, SL, Ortiz, A, Fogo, AB, et al. Chronic kidney disease and the global public health agenda: an international consensus. Nat Rev Nephrol. (2024) 20:473–85. doi: 10.1038/s41581-024-00820-6
9. Jadoul, M, Aoun, M, and Masimango, IM. The major global burden of chronic kidney disease. Lancet Glob Health. (2024) 12:e342–3. doi: 10.1016/S2214-109X(24)00050-0
10. Foreman, KJ, Marquez, N, Dolgert, A, Fukutaki, K, Fullman, N, McGaughey, M, et al. Forecasting life expectancy, years of life lost, and all-cause and cause-specific mortality for 250 causes of death: reference and alternative scenarios for 2016-40 for 195 countries and territories. Lancet. (2018) 392:2052–90. doi: 10.1016/S0140-6736(18)31694-5
11. Evans, M, Lewis, RD, Morgan, AR, Whyte, MB, Hanif, W, Bain, SC, et al. A narrative review of chronic kidney disease in clinical practice: current challenges and future perspectives. Adv Ther. (2022) 39:33–43. doi: 10.1007/s12325-021-01927-z
12. Li, Y, Ning, Y, Shen, B, Shi, Y, Song, N, Fang, Y, et al. Temporal trends in prevalence and mortality for chronic kidney disease in China from 1990 to 2019: an analysis of the global burden of disease study 2019. Clin Kidney J. (2023) 16:312–21. doi: 10.1093/ckj/sfac218
13. Xie, Y, Bowe, B, Mokdad, AH, Xian, H, Yan, Y, Li, T, et al. Analysis of the global burden of disease study highlights the global, regional, and national trends of chronic kidney disease epidemiology from 1990 to 2016. Kidney Int. (2018) 94:567–81. doi: 10.1016/j.kint.2018.04.011
14. Carazo, A, Macáková, K, Matoušová, K, Krčmová, LK, Protti, M, and Mladěnka, P. Vitamin A update: forms, sources, kinetics, detection, function, deficiency, therapeutic use and toxicity. Nutrients. (2021) 13:13. doi: 10.3390/nu13051703
15. Al Tanoury, Z, Piskunov, A, and Rochette-Egly, C. Vitamin A and retinoid signaling: genomic and nongenomic effects. J Lipid Res. (2013) 54:1761–75. doi: 10.1194/jlr.R030833
16. Zhang, X, Yang, K, Chen, L, Liao, X, Deng, L, Chen, S, et al. Vitamin A deficiency in critically ill children with sepsis. Crit Care. (2019) 23:267. doi: 10.1186/s13054-019-2548-9
17. Tanumihardjo, SA. Vitamin A: biomarkers of nutrition for development. Am J Clin Nutr. (2011) 94:658s–65s. doi: 10.3945/ajcn.110.005777
18. Chiba, T, Skrypnyk, NI, Skvarca, LB, Penchev, R, Zhang, KX, Rochon, ER, et al. Retinoic acid signaling coordinates macrophage-dependent injury and repair after AKI. J Am Soc Nephrol. (2016) 27:495–508. doi: 10.1681/ASN.2014111108
19. Wu, J, Zheng, C, Wan, X, Shi, M, McMillan, K, Maique, J, et al. Retinoic acid alleviates cisplatin-induced acute kidney injury through activation of autophagy. Front Pharmacol. (2020) 11:987. doi: 10.3389/fphar.2020.00987
20. DiKun, KM, Tang, XH, Fu, L, Choi, ME, Lu, C, and Gudas, LJ. Retinoic acid receptor α activity in proximal tubules prevents kidney injury and fibrosis. Proc Natl Acad Sci USA. (2024) 121:e2311803121. doi: 10.1073/pnas.2311803121
21. Raila, J, Willnow, TE, and Schweigert, FJ. Megalin-mediated reuptake of retinol in the kidneys of mice is essential for vitamin A homeostasis. J Nutr. (2005) 135:2512–6. doi: 10.1093/jn/135.11.2512
22. Rojo-Trejo, MH, Robles-Osorio, ML, and Sabath, E. Liposoluble vitamins A and E in kidney disease. World J Nephrol. (2022) 11:96–104. doi: 10.5527/wjn.v11.i3.96
23. Levey, AS, Bosch, JP, Lewis, JB, Greene, T, Rogers, N, and Roth, D. A more accurate method to estimate glomerular filtration rate from serum creatinine: a new prediction equation. Modification of diet in renal disease study group. Ann Intern Med. (1999) 130:461–70. doi: 10.7326/0003-4819-130-6-199903160-00002
24. Frank, EH. Regression modeling strategies with applications to linear models, logistic and ordinal regression, and survival analysis. New York: Springer (2015).
25. Waikar, SS, and Bonventre, JV. Biomarkers for the diagnosis of acute kidney injury. Nephron Clin Pract. (2008) 109:c192–7. doi: 10.1159/000142928
26. Min, KB, and Min, JY. Relation of serum vitamin A levels to all-cause and cause-specific mortality among older adults in the NHANES III population. Nutr Metab Cardiovasc Dis. (2014) 24:1197–203. doi: 10.1016/j.numecd.2014.06.004
27. Chen, TK, Hoenig, MP, Nitsch, D, and Grams, ME. Advances in the management of chronic kidney disease. BMJ. (2023) 383:e074216. doi: 10.1136/bmj-2022-074216
28. Jing, J, Isoherranen, N, Robinson-Cohen, C, Petrie, I, Kestenbaum, BR, and Yeung, CK. Chronic kidney disease alters vitamin A homeostasis via effects on hepatic RBP4 protein expression and metabolic enzymes. Clin Transl Sci. (2016) 9:207–15. doi: 10.1111/cts.12402
29. Kalousová, M, Kubena, AA, Kostírová, M, Vinglerová, M, Ing, OM, Dusilová-Sulková, S, et al. Lower retinol levels as an independent predictor of mortality in long-term hemodialysis patients: a prospective observational cohort study. Am J Kidney Dis. (2010) 56:513–21. doi: 10.1053/j.ajkd.2010.03.031
30. Ikizler, TA, Burrowes, JD, Byham-Gray, LD, Campbell, KL, Carrero, JJ, Chan, W, et al. KDOQI clinical practice guideline for nutrition in CKD: 2020 update. Am J Kidney Dis. (2020) 76:S1–s107. doi: 10.1053/j.ajkd.2020.05.006
Keywords: chronic kidney disease, vitamin A, all-cause mortality, NHANSE, cohort study
Citation: Feng Y, Li Y, Chen S, Hu N and Liao D (2024) Vitamin A is associated with all-cause mortality in patients with chronic kidney disease: a population-based cohort study. Front. Nutr. 11:1469844. doi: 10.3389/fnut.2024.1469844
Edited by:
Salvatore Vaccaro, IRCCS Local Health Authority of Reggio Emilia, ItalyReviewed by:
Ruoran Wang, Sichuan University, ChinaJenny Vilchis-Gil, Hospital Infantil de México Federico Gómez, Mexico
Copyright © 2024 Feng, Li, Chen, Hu and Liao. This is an open-access article distributed under the terms of the Creative Commons Attribution License (CC BY). The use, distribution or reproduction in other forums is permitted, provided the original author(s) and the copyright owner(s) are credited and that the original publication in this journal is cited, in accordance with accepted academic practice. No use, distribution or reproduction is permitted which does not comply with these terms.
*Correspondence: Yunxia Feng, ZmVuZ3l1bnhpYTI5QDEyNi5jb20=