 Anuja Phalle
 Devaki Gokhale
- Department of Nutrition and Dietetics, Symbiosis School of Culinary Arts and Nutritional Sciences, Symbiosis International (Deemed) University, Pune, India
Introduction: Recent developments in Artificial Intelligence (AI) and Machine Learning (ML) technologies have opened new avenues for their applications in dietary assessments. Conventional dietary assessment methods are time-consuming, labor-driven, and have high recall bias. AI-assisted tools can be user-friendly and provide accurate dietary data. Hence, this review aimed to explore the applications of AI-assisted dietary assessment tools in real-world settings that could potentially enhance Next-Gen nutrition care delivery.
Materials and methods: A total of 17,613 original, full-text articles using keywords such as “artificial intelligence OR food image analysis OR wearable devices AND dietary OR nutritional assessment,” published in English between January 2014 and September 2024 were extracted from Scopus, Web of Science, and PubMed databases. All studies exploring applications of AI-assisted dietary assessment tools with human participation were included; While methodological/developmental research and studies without human participants were excluded as this review specifically aimed to explore their applications in real-world scenarios for clinical purposes. In the final phase of screening, 66 articles were reviewed that matched our inclusion criteria and the review followed PRISMA-ScR reporting guidelines.
Results: We observed that existing AI-assisted dietary assessment tools are integrated with mobile/web-based applications to provide a user-friendly interface. These tools can broadly be categorized as “Image-based” and “Motion sensor-based.” Image-based tools allow food recognition, classification, food volume/weight, and nutrient estimation whereas, Motion sensor-based tools help capture eating occasions through wrist movement, eating sounds, jaw motion & swallowing. These functionalities capture the dietary data regarding the type of food or beverage consumed, calorie intake, portion sizes, frequency of eating, and shared eating occasions as real-time data making it more accurate as against conventional dietary assessment methods. Dietary assessment tools integrated with AI and ML could estimate real-time energy and macronutrient intake in patients with chronic conditions such as obesity, diabetes, and dementia. Additionally, these tools are non-laborious, time-efficient, user-friendly, and provide fairly accurate data free from recall/reporting bias enabling clinicians to offer personalized nutrition.
Conclusion: Therefore, integrating AI-based dietary assessment tools will help improve the quality of nutrition care and navigate next-gen nutrition care practices. More studies are required further to evaluate the efficacy and accuracy of these tools.
1 Introduction
Nutrition Care Process (NCP) transitioned from face-to-face to Tele-nutrition consultations following the COVID-19 pandemic (1, 2), which inherently motivated the scientific community to develop innovative, technology-based tools to facilitate healthcare professionals. With the advancements in technologies such as Artificial Intelligence (AI) and Machine Learning (ML), efforts have been directed toward extending their applications to the field of nutrition (3, 4). However, much of the emphasis has been given to investigating various techniques using machine learning (ML), and deep neural networks that are required for app development rather than to check its feasibility to enhance nutrition care practices in real-world settings.
Dietary assessment is the primary step of NCP, requiring the collection and analysis of data, including dietary information (5). It is crucial for accurate nutritional diagnosis, optimum nutrition delivery, and faster patient recovery. Various conventional dietary assessment tools including 24-h dietary recall, 3-day food diary, and food frequency questionnaires (FFQ) have been used extensively in nutrition practice (6). However, healthcare professionals such as dietitians and nutritionists face challenges in obtaining accurate data using these conventional tools. For e.g., conventional tools are time-consuming, and labor-intensive, with a higher recall bias. Further, patients forget or misreport the consumption of snacks, especially unhealthy foods (7).
AI-assisted dietary assessment tools are user-friendly and can provide objective and accurate data rather than subjective information from self-reported questionnaires. ML and deep neural networks are the backbones of most AI-assisted tools (8, 9). To make these tools user-friendly, they have been integrated with various devices including smartphones, and other wearable devices like smartwatches/fitness trackers. Increased technological dependence observed in today’s modern society can be leveraged for active health and nutritional monitoring. Moreover, trends and heightened behaviors related to food photography were observed among the population post COVID-19 pandemic (10, 11). This behavior could be strengthened to promote real-time tracking of patient’s eating patterns and behaviors primarily using AI-assisted dietary assessment tools.
The potential clinical significance of AI-assisted dietary assessment tools cannot be overemphasized. For e.g., close monitoring of food intake in hospitalized patients is paramount to prevent malnutrition which is often underdiagnosed in this group (12–14). This can enhance nutrition care and improve patient’s quality of life in hospitalized settings. Furthermore, clinical conditions like Type I or insulin-dependent Type II diabetes require careful recording, adjusting, and monitoring of carbohydrate intake to ensure better glycemic control. Invigilating the nutrition status and dietary patterns of notable segments of the population such as children, adolescents, young adults, females of reproductive age, and pregnant women is essential. Previously, potential applications of AI-assisted dietary assessment tools have been reviewed with emphasis on the underlying technologies and methodologies of these tools (9, 15, 16) rather than studying possible applications in real-world settings. Furthermore, there is a lack of knowledge about challenges and research gaps regarding applications of AI-assisted dietary assessment tools. Therefore, we aimed to review the existing literature for its scope and highlight the shortcomings of these AI-based dietary assessment tools. Specifically, this scoping review focuses on AI-assisted dietary assessment tools that can potentially help assess and objectively monitor the dietary intake of humans in real-world scenarios as well as their relevance in clinical conditions in enhancing Next-Gen nutrition care.
2 Methods
The authors performed an extensive literature search using Scopus, Web of Science, and PubMed databases to include articles published in the last 10 years (2014 to 4th September 2024). A total of 17,613 original, full-text articles published in English were extracted using the keywords “artificial intelligence OR food image analysis OR computer vision-assisted OR wearable devices AND dietary OR nutritional assessment.” All studies (Experimental, Proof-of-concept, Pilot/Validation, Cross-sectional, Randomized Controlled Trial, Observational, Comparative, Exploratory, and Qualitative studies) exploring applications of AI-assisted dietary assessment tools and human participation were included; While methodological/developmental research studies were excluded as this review specifically aimed to explore their applications in real-world clinical use. We did not restrict ourselves to specific outcomes of interest, as we aimed to cover the state-of-the-art literature. In phase I, all articles were screened for title and abstract considering the inclusion–exclusion criteria (see Supplementary Table 1). 568 full-text articles were screened in phase II, and 66 were eligible for this review. Further, the reference list of all articles and published reviews was checked for eligibility (Refer to Supplementary Figure S1 for flowchart). Both the reviewers independently reviewed the articles, and the disagreements were resolved through mutual discussion. The review followed PRISMA-ScR reporting guidelines (Refer to Supplementary Table 2) and findings from studies were synthesized using a narrative approach. The literature was appraised and collated for applicability, feasibility, accuracy, and benefits to critical segments of the population in a real-world scenario.
3 A brief overview of AI-assisted dietary assessment (DA) tools
Advanced AI-assisted Dietary Assessment Tools are primarily based on technologies such as ML, Natural Language Processing (NLP), Deep Learning, Computer Vision, and Artificial Neural Networks including Convoluted Neural Networks (CNN). These technologies generally help in image classification, segmentation, recognition, and prediction (17). Current DA tools can broadly be classified as ‘Image-based’ and ‘Motion Sensor-based’ (See Figure 1) Food Image Recognition (FIR) is an extensively common feature of Image-based Dietary Assessment (IBDA) tools. IBDA tools are deployed through mobile/web applications, where the user snaps a picture of the meal through a mobile phone’s camera and gets the nutrients and volume estimation as an output. In between these steps, multiple other steps including image pre-processing, segmentation, food classification, volume estimation, and calculation of nutrients by establishing connections with appropriate nutritional databases (18). Another approach used in AI-assisted DA tools captures dietary data using sensor-based wearable devices. This technology enables the passive and objective method of obtaining dietary data. The wearable device detects a motion (hand, jaw motion, speech recognition) or captures images passively which are then processed further to provide output to the user. Various wearable devices such as e-buttons, smartwatches, and eyeglasses have been exploited in performing dietary assessments (19). Since this review explores potential applications in real-world settings in the human population, we present the existing literature based on population characteristics rather than a technology/feature-centered narrative.
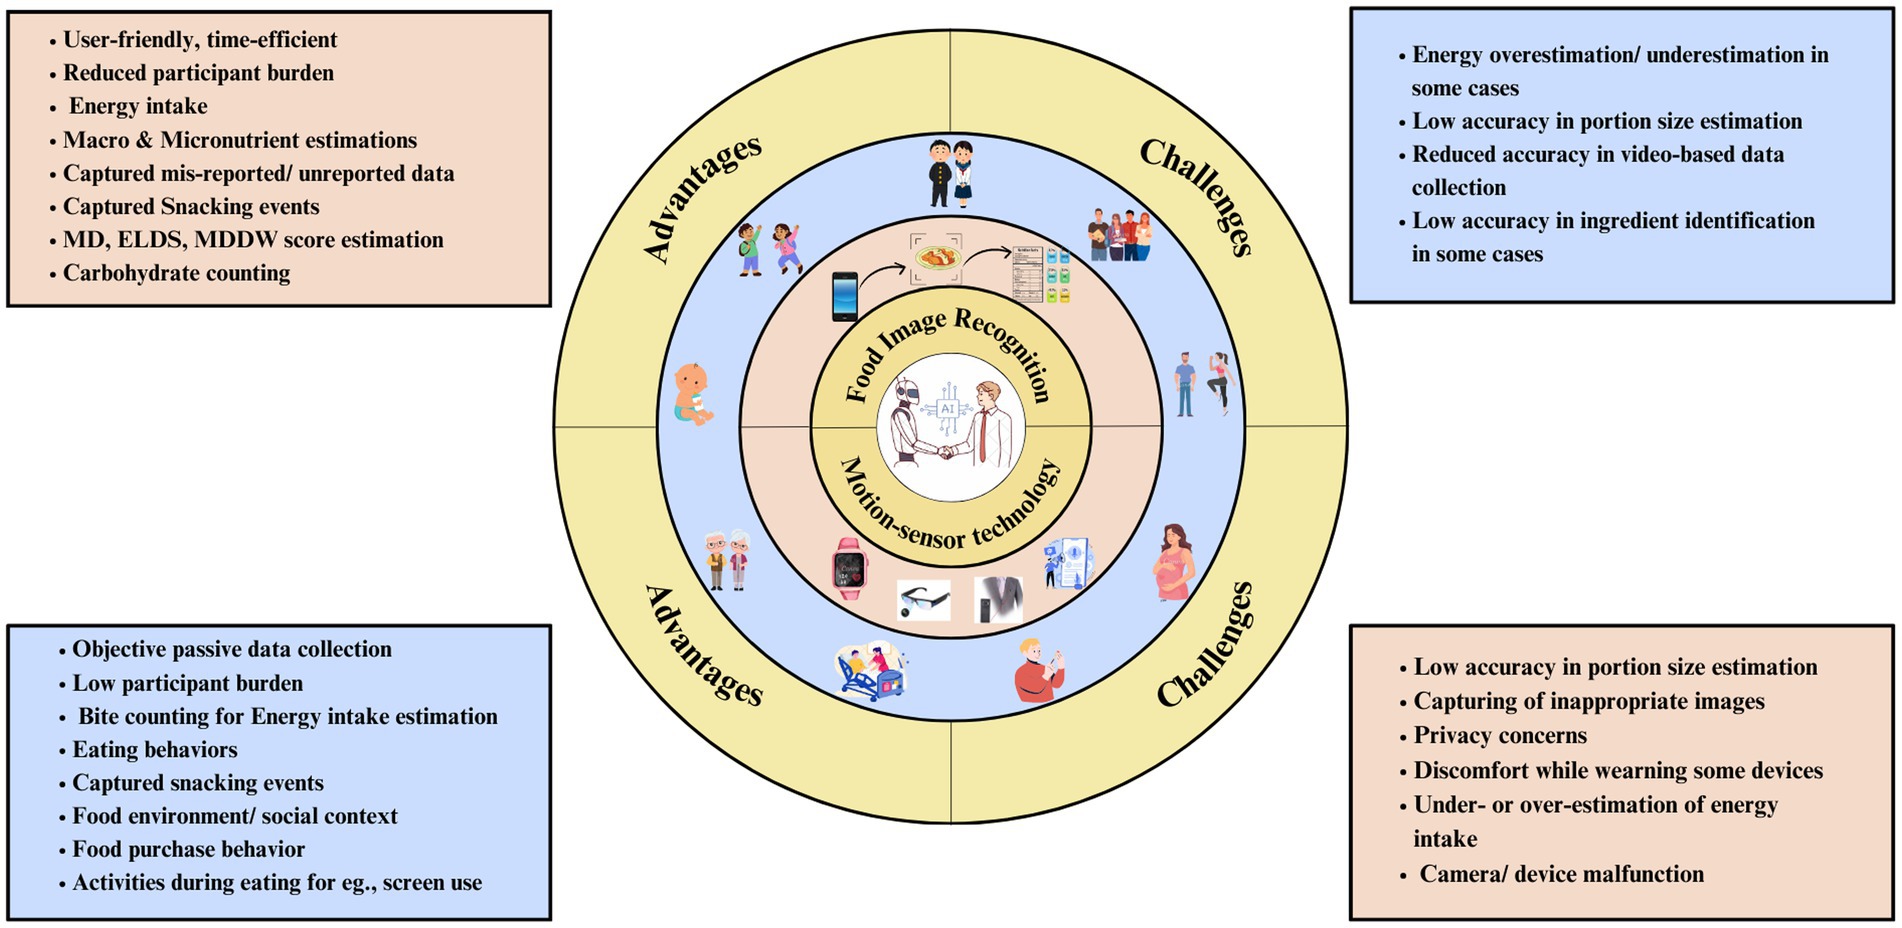
Figure 1. Overview of AI-assisted dietary assessment tools.
3.1 For children & adolescents
Performing dietary assessments in children and adolescents is very challenging. Conventional dietary assessment tools capture dietary data from parents/caregivers leading to recall bias, misreporting, and under-reporting. However, very few studies have explored the challenges in dietary data reporting among children in the past with only two reviews highlighting the gap in this domain (20, 21). Adolescents tend to underreport more than young children, especially those with overweight and obesity. The issue of underreporting has been observed to reduce in young children when parents help them in data reporting, however, any subjective reporting can introduce recall or reporting bias. AI-assisted tools may help mitigate these challenges for this group providing more reliable and accurate data. We identified 12 eligible articles, of which 7 explored ‘IBDA’ and 5 implemented ‘Wearables’ to perform dietary assessments in children and adolescents (Table 1).
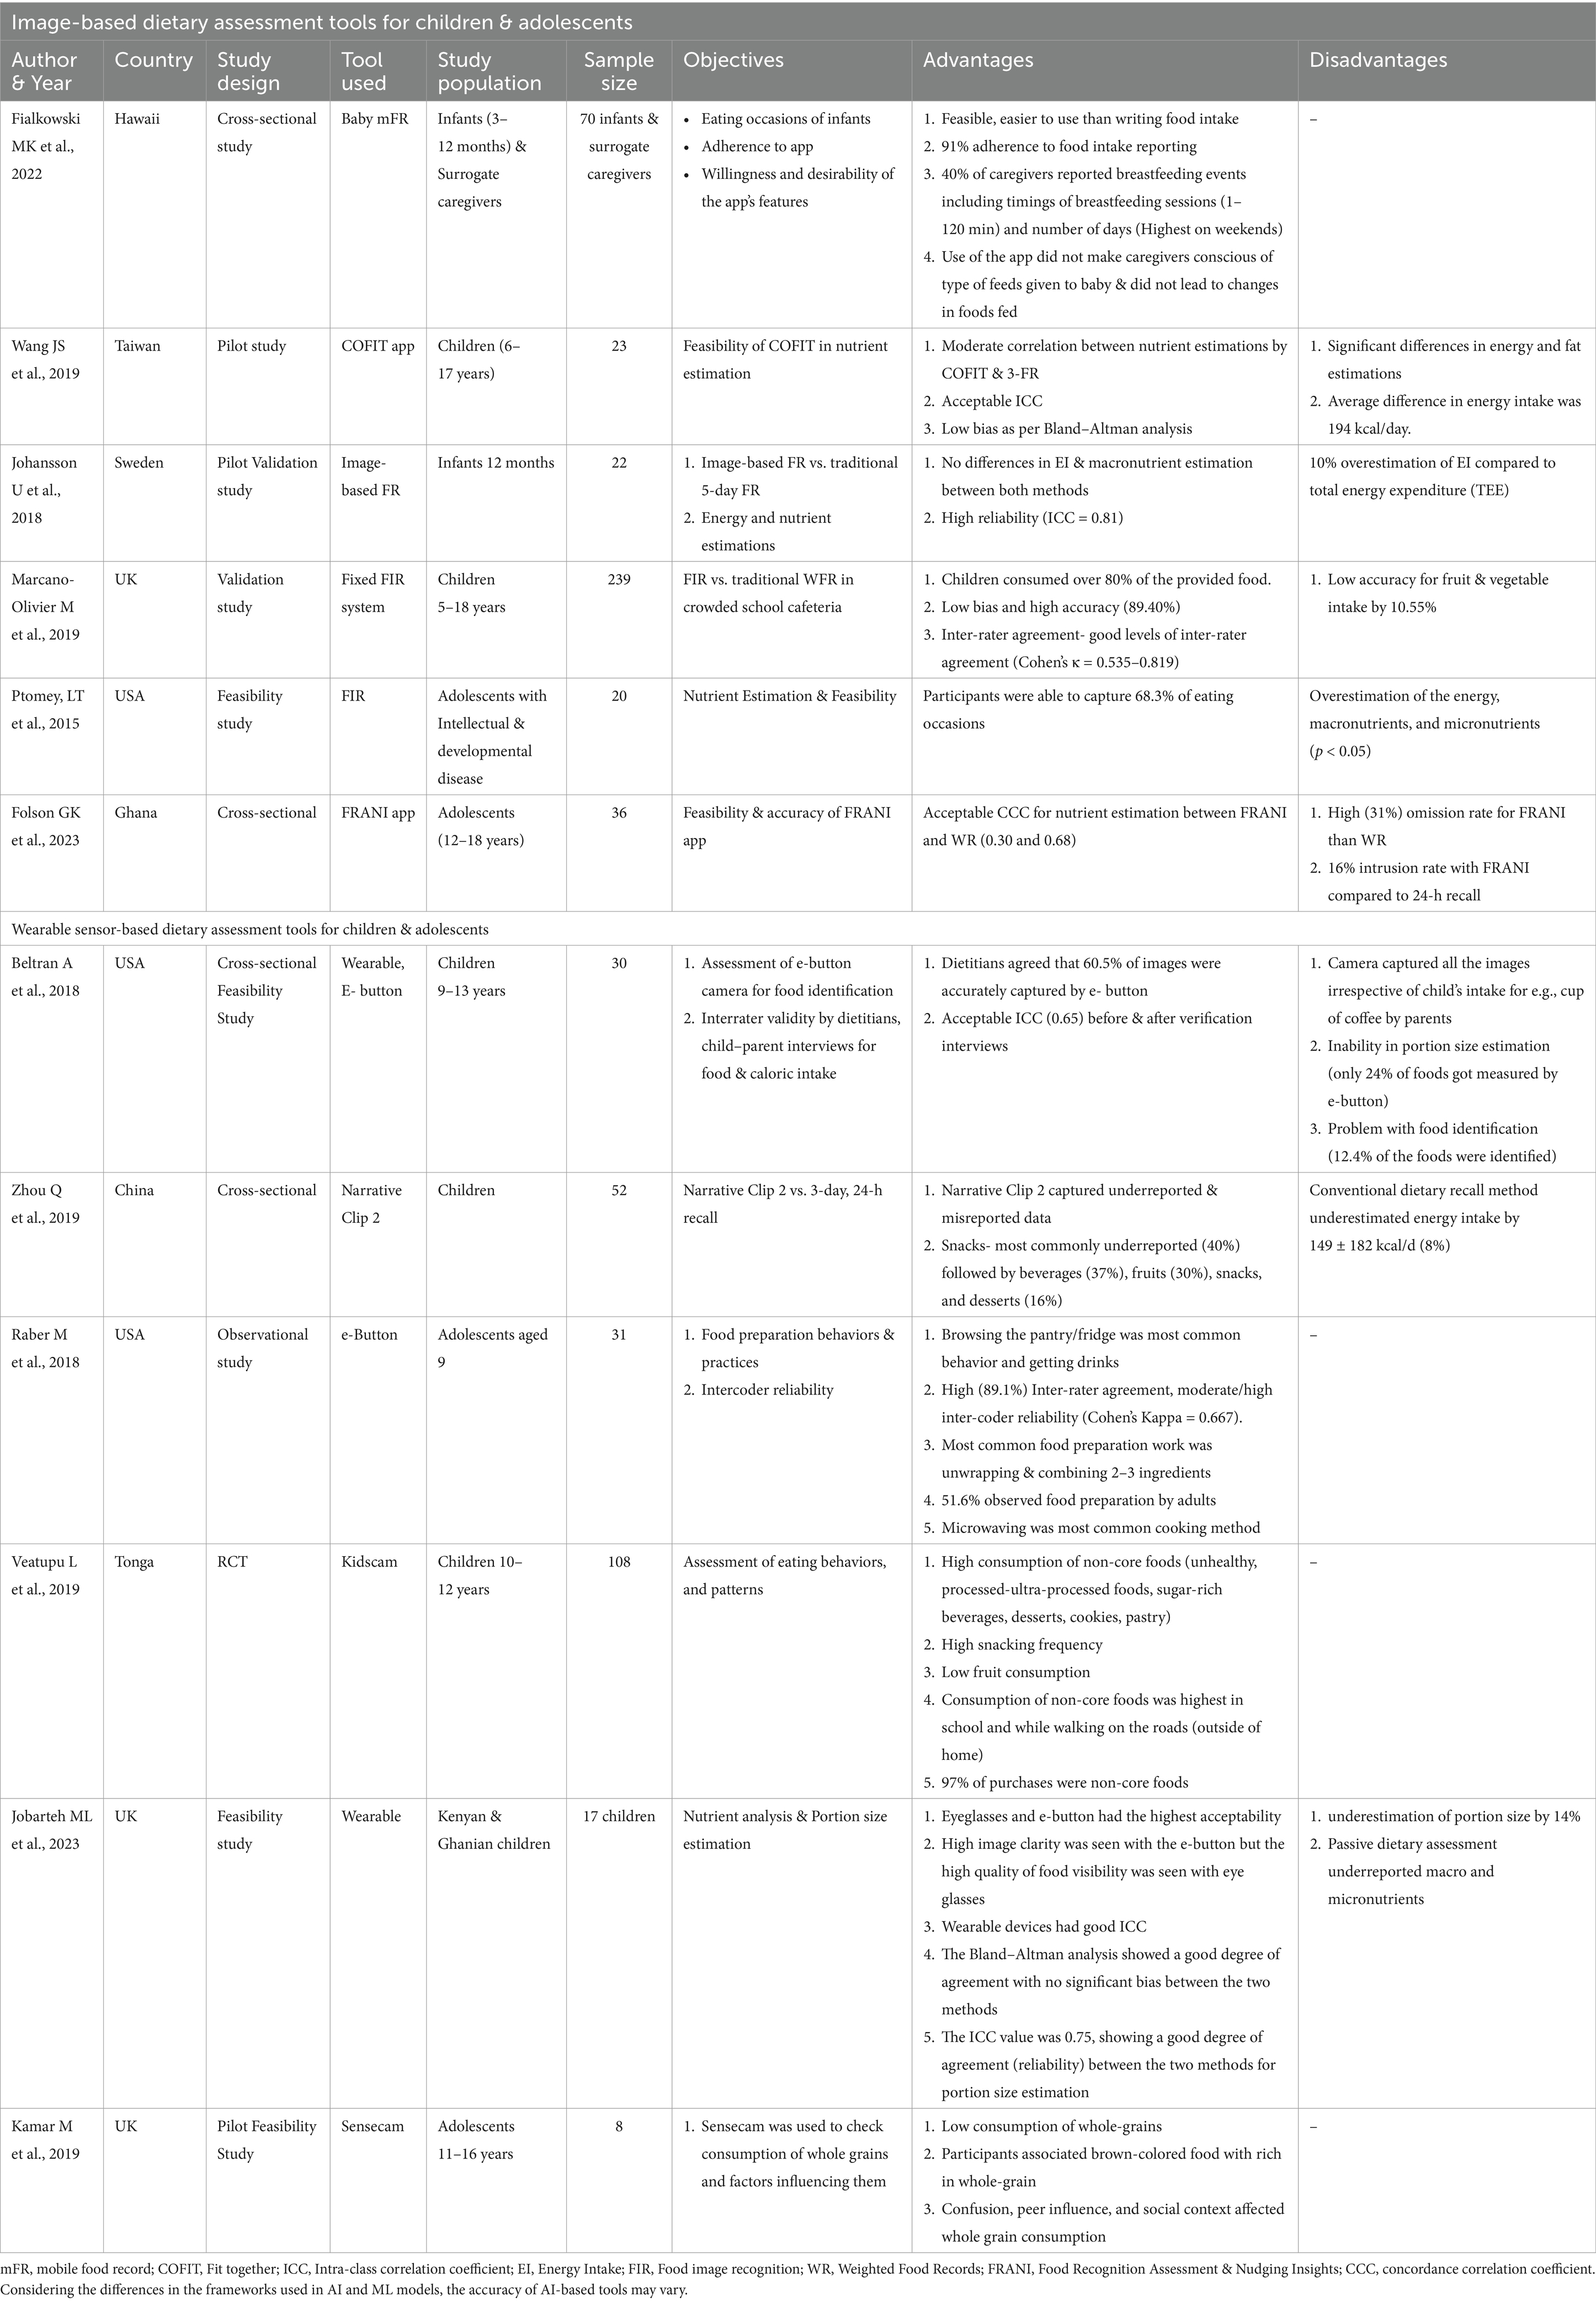
Table 1. AI-assisted dietary assessment tools for children and adolescents.
3.1.1 Image-based dietary assessment
A cross-sectional study by Fialkowski et al. (22) assessed the feasibility and user-friendliness of the ‘baby mobile Food Recording (mFR) app by asking surrogate reporters like caregivers to record the eating occasions of 70 infants (3–12 months). A majority (94%) of surrogates recorded the infant’s dietary intake using the mFR app and 75% of the before-after images were visible. Only 40% of surrogates recorded breastfeeding events but the data gave insights into breastfeeding days and duration. Although breastfeeding events occurred every day, the duration ranged between 1 and 120 min with longer breastfeeding duration observed on weekends. Surrogates reported that the app was feasible and user-friendly and they would prefer taking food images rather than writing. Furthermore, using the app did not make surrogate reporters conscious about feeding compositions and did not change the infant’s feeding pattern, thus enabling the capturing of actual data. Another study from Sweden compared nutrient estimation (energy and macronutrient) using image-based food records (FR) with conventional food records for 5 days. Additionally, the study validated the image-based FR by estimating total energy expenditure (TEE) using doubly labeled water (DLW). Energy intake estimated by image-assisted FR (3,905 ± 476 kJ/day) was no different than conventional FR (3,902 ± 476 kJ/day) and had a high (0.81) intra-class correlation coefficient (ICC). This indicates high reliability with image-based FR. However, 10% of the overestimation of energy intake with image-based FR was observed compared to TEE estimated using DLW (23).
A pilot study was conducted among 23 Taiwanese children (6–17 years) to check the feasibility and accuracy of the COFIT (meaning fit together) image-based FR app against the conventional written FR. Energy intake estimated using COFIT (1,584.88 ± 369.03 kcal/day) was significantly (p ≤ 0.001) lower than written FR (1,779.11 ± 316.29 kcal/day). For other macronutrients (except fat) and micronutrient estimations with a moderate correlation (0.27–0.97) between both methods. Bland–Altman plots were within the acceptable limits of agreement, indicating small variability in nutrient estimation by the COFIT app (24). Similarly, the UK study assessed the validity and accuracy of the digital image-capture method to estimate the food consumption of 239 children (5–18 years) in a school café as opposed to conventional weighted records (WR). 80% of the food served for lunch and dinner at the café was consumed by children. The accuracy of food group estimation was similar with minor bias; however, significantly low accuracy (10.88%) was observed for the fruits & vegetable group (t = 2.893, p = 0.004). Nevertheless, overall good inter-rater agreement (Cohen’s κ = 0.535–0.819) indicated better reliability of the digital image capture method (25).
A cross-sectional study validated the FRANI (Food Recognition Assessment & Nudging Insights) app against conventional weighted records and multiple-pass 24-h dietary recall among 36 Ghanaian adolescents. The FRANI app was equally good at estimating energy intakes within a 10% equivalence bound like conventional weighted records and even better than 24-h recall, which was accurate at a 20% equivalence bound. Micronutrients such as folate, iron, zinc, niacin, and vitamin B6 were accurately estimated within 15% bounds by the FRANI app except for vitamin A and B12 which had wider equivalence bounds (>30%). The rates of omission (31%) and intrusion (16%) errors were higher concerning food consumption episodes for FRANI and WR compared to 24-h recall which had lower omission (21%) and intrusion rates (13%) (26). Another feasibility study explored whether digital images help improve energy and nutrient estimation compared to conventional 3-day food records (FR) among adolescents with Intellectual and Developmental Disorders (IDD). Participants could record 68.3 ± 31.7% of eating occasions. Digital images could detect incorrect portion size (37.4%), missing data (28.2%), forgotten food intake, and false positive intake (2.3%) which were not captured in conventional 3-day FR. Significant differences in intakes of energy, carbohydrate, protein, and fat were observed (p < 0.05 for all), wherein digital images captured a lot (20%) of under-reported, misreported data as opposed to 3-day FR. The study concluded that adolescents with IDD could easily capture food images and this method may be feasible for estimating their nutrient intake (27).
Overall, the image-based method was user-friendly and feasible for dietary assessment in infants, children, and adolescents including those with IDD. Capturing an infant’s true dietary intake including breastfeeding events (which is challenging otherwise) with an image-based app provided objective data collection. The nutrient estimation with the image-based method in children had minor variations, but within acceptable limits, indicating fair reliability. The dietary intake of adolescents is often a tricky task for healthcare professionals however, image-based apps appear to ease out their task by providing fairly accurate estimates of energy, macronutrients, and most micronutrients. Further, this method detected 20% of the misreported and unreported dietary data compared to conventional tools. Therefore, image-based dietary assessment tools may be next-gen tools for healthcare professionals.
3.1.2 Wearable sensor-based dietary assessment
A wearable e-button device was evaluated for feasibility and accuracy for 2-days among 30 children against child–parent dyad interviews. E-button is a wearable button-shaped device with a mini camera that captures the food images every 4 s apart. This device accurately detected around 60.5% of images and had acceptable inter-class correlation agreement (0.65). Child–parent interviews by dietitians confirmed that 77% of foods were accurately identified by e-button, however, 12.4% of foods were not detected by e-button for incorrect camera position, dark settings, blurred images, and camera malfunctions. Furthermore, the e-button could not always detect the true food intake of a child leading to the capturing of false-positive images for instance, the child did not consume the food but helped in food preparation, gave cookies to a sibling, or happened to be sitting at a table where parent’s cup of coffee was kept. Concerning portion size, 67.8% of food portions were estimated using an e-button. Significant differences in energy intake were observed where dietitians underestimated energy, further child–parent dyad verification interviews revealed an energy intake of 287.8 kcal which was neither detected by e-button nor dietitians (28). A feasibility study from the UK investigated the validity of 3 different wearables (An e-button, an Automated Ingestion Monitor (AIM) eye-glasses device, and an ear-worn Bluetooth device with a mini camera) against traditional weighted food records among Ghanaian and Kenyan-origin children (n = 17). Children showed a higher preference for AIM devices than e-button. High image clarity was seen in the e-button however, the AIM device showed high visibility of the food plate. Wearable devices could fairly estimate portion size (r = 0.75, p = 0.01) and good (0.75) inter-class correlation coefficient (ICC) indicating high reliability, however, they underestimated the portion sizes by 14%. Concerning energy, macronutrients, and micronutrient estimation, wearable devices showed good ICC agreement values ranging between 0.67 and 0.91 (29). Similar findings were observed in a Chinese study among 52 children which assessed the feasibility of a Narrative Clip 2 wearable camera device worn for 7 days compared to a 3-day 24-h recall. Significant differences were observed in energy and nutrient estimations between both methods wherein 3-day 24-h dietary recall significantly underestimated energy, macronutrients, and micronutrients, however high correlations were observed between them (0.69–0.97, p < 0.001). Probably, because children often may not clearly remember the portion size the way they can remember what they eat when reporting 24-h dietary recall. This is where image-assisted dietary assessment tools can be advantageous in preventing the underreporting and misreporting of dietary data (30).
We found three studies that extended the applications of wearable devices to identify food behaviors, eating patterns, food environment, and whole-grain consumption rather than only exploring the feasibility and accuracy, thus providing different dimensions to its usage in real-world settings. An observational study among 31 American adolescents (9–13 years) captured food preparation and practices using e-Button showed a high inter-rater agreement (89.1%) and good inter-coder reliability (Cohen’s Kappa = 0.67). The ordinary food-related behaviors were checking in the fridge (71%) or pantry (51.6%), fetching the drinks (58.1%) and clearing the dishes (71%). The most common food preparation activities were mixing ingredients to prepare the dish (45.2%), opening the food packs (41.9%), watching adults cook (51.6%), and microwaving (22.6%). Overall, the e-button was effective in recording food-related behaviors and preparation activities, however, image processing required 2 h for processing. Nevertheless, the device was in the nascent stage, and being improvised further (31). A randomized control trial among 36 Tongan children investigated the pattern and context of traditional Tongan me’akai foods using Kids’Cam-a wearable camera device. The study reported the highest consumption of non-traditional foods (67.7%) twice more frequently (4.5 [95% CI 3.3, 6.7] times/day) than traditional Tongan foods (2.3 [95% CI 1.8, 2.9]). Importantly, a large portion of non-traditional foods were consumed as snacks mostly unhealthy (33.8%) such as cakes/cookies/desserts (21.6%) and confectionary items (25.6%). Additionally, identifying the contexts that promote unhealthy non-traditional foods/snack consumption is crucial in planning interventions and policy-making. This study explored the same wherein, unhealthy foods were commonly eaten at home (1.3 times), at school (3.5), and highest while walking outside on roads (5 times). Regarding food purchasing, children bought (97.7%) unhealthy foods as observed through images (32). Similarly, a pilot feasibility study assessed the contexts that can impact whole grain consumption among adolescents using SenseCam-a wearable camera. Most factors that prevented the consumption of whole grains were taste, availability at home, and outside the home in different settings, confusion regarding whole grains, and peer and social influence. Adolescents related brown-colored foods as whole grains and had negative taste perceptions of whole grains. They mostly ate whole grains (brown bread) at home rather than outside due to the greater availability of refined grains (white bread). Adolescents mostly related consumption of whole grain foods during diet interventions otherwise they feared being mocked for making odd choices in a social context (33). Using passive data collection methods wearables facilitate an in-depth understanding of various aspects that can significantly influence dietary intake which has never been possible with conventional dietary assessment tools.
In summary, wearable devices in children and adolescents can be viable options for understanding their eating behaviors, particularly snacking. However, these devices may underestimate the nutrients and portion sizes consumed especially when the food consumed is small in size or due to poor image quality and small. Additionally, capturing the true food intake of children was not always possible (28). Moreover, wearables were shown to be efficient in capturing a lot of other information rather than just food images, for e.g., food environments. Therefore, we conclude that wearables may be efficiently used for understanding different aspects of food rather than nutrient estimation until the accuracy is improved further.
3.2 For healthy and pregnant women
Womanhood is a challenging stage of life and requires optimal nutrition during each phase. Malnutrition (under and overnutrition) has become increasingly prevalent among women. Pregnancy is the crucial phase of a woman’s life wherein nutritional requirements increase substantially to meet the demands of a growing fetus. Past literature highlights the discrepancies in actual nutritional intake and recommended guidelines, indicating that most pregnant women do not meet the requirements. This issue is serious among pregnant women from low-middle-income countries (LMICs), therefore capturing their actual objective intake becomes of utmost importance in preventing negative consequences. Further adolescents and healthy women, like other adults, also tend to underreport or misreport during conventional dietary assessments. We narrate the findings from eight articles that explored the use of AI-assisted DA tools among women (Table 2).
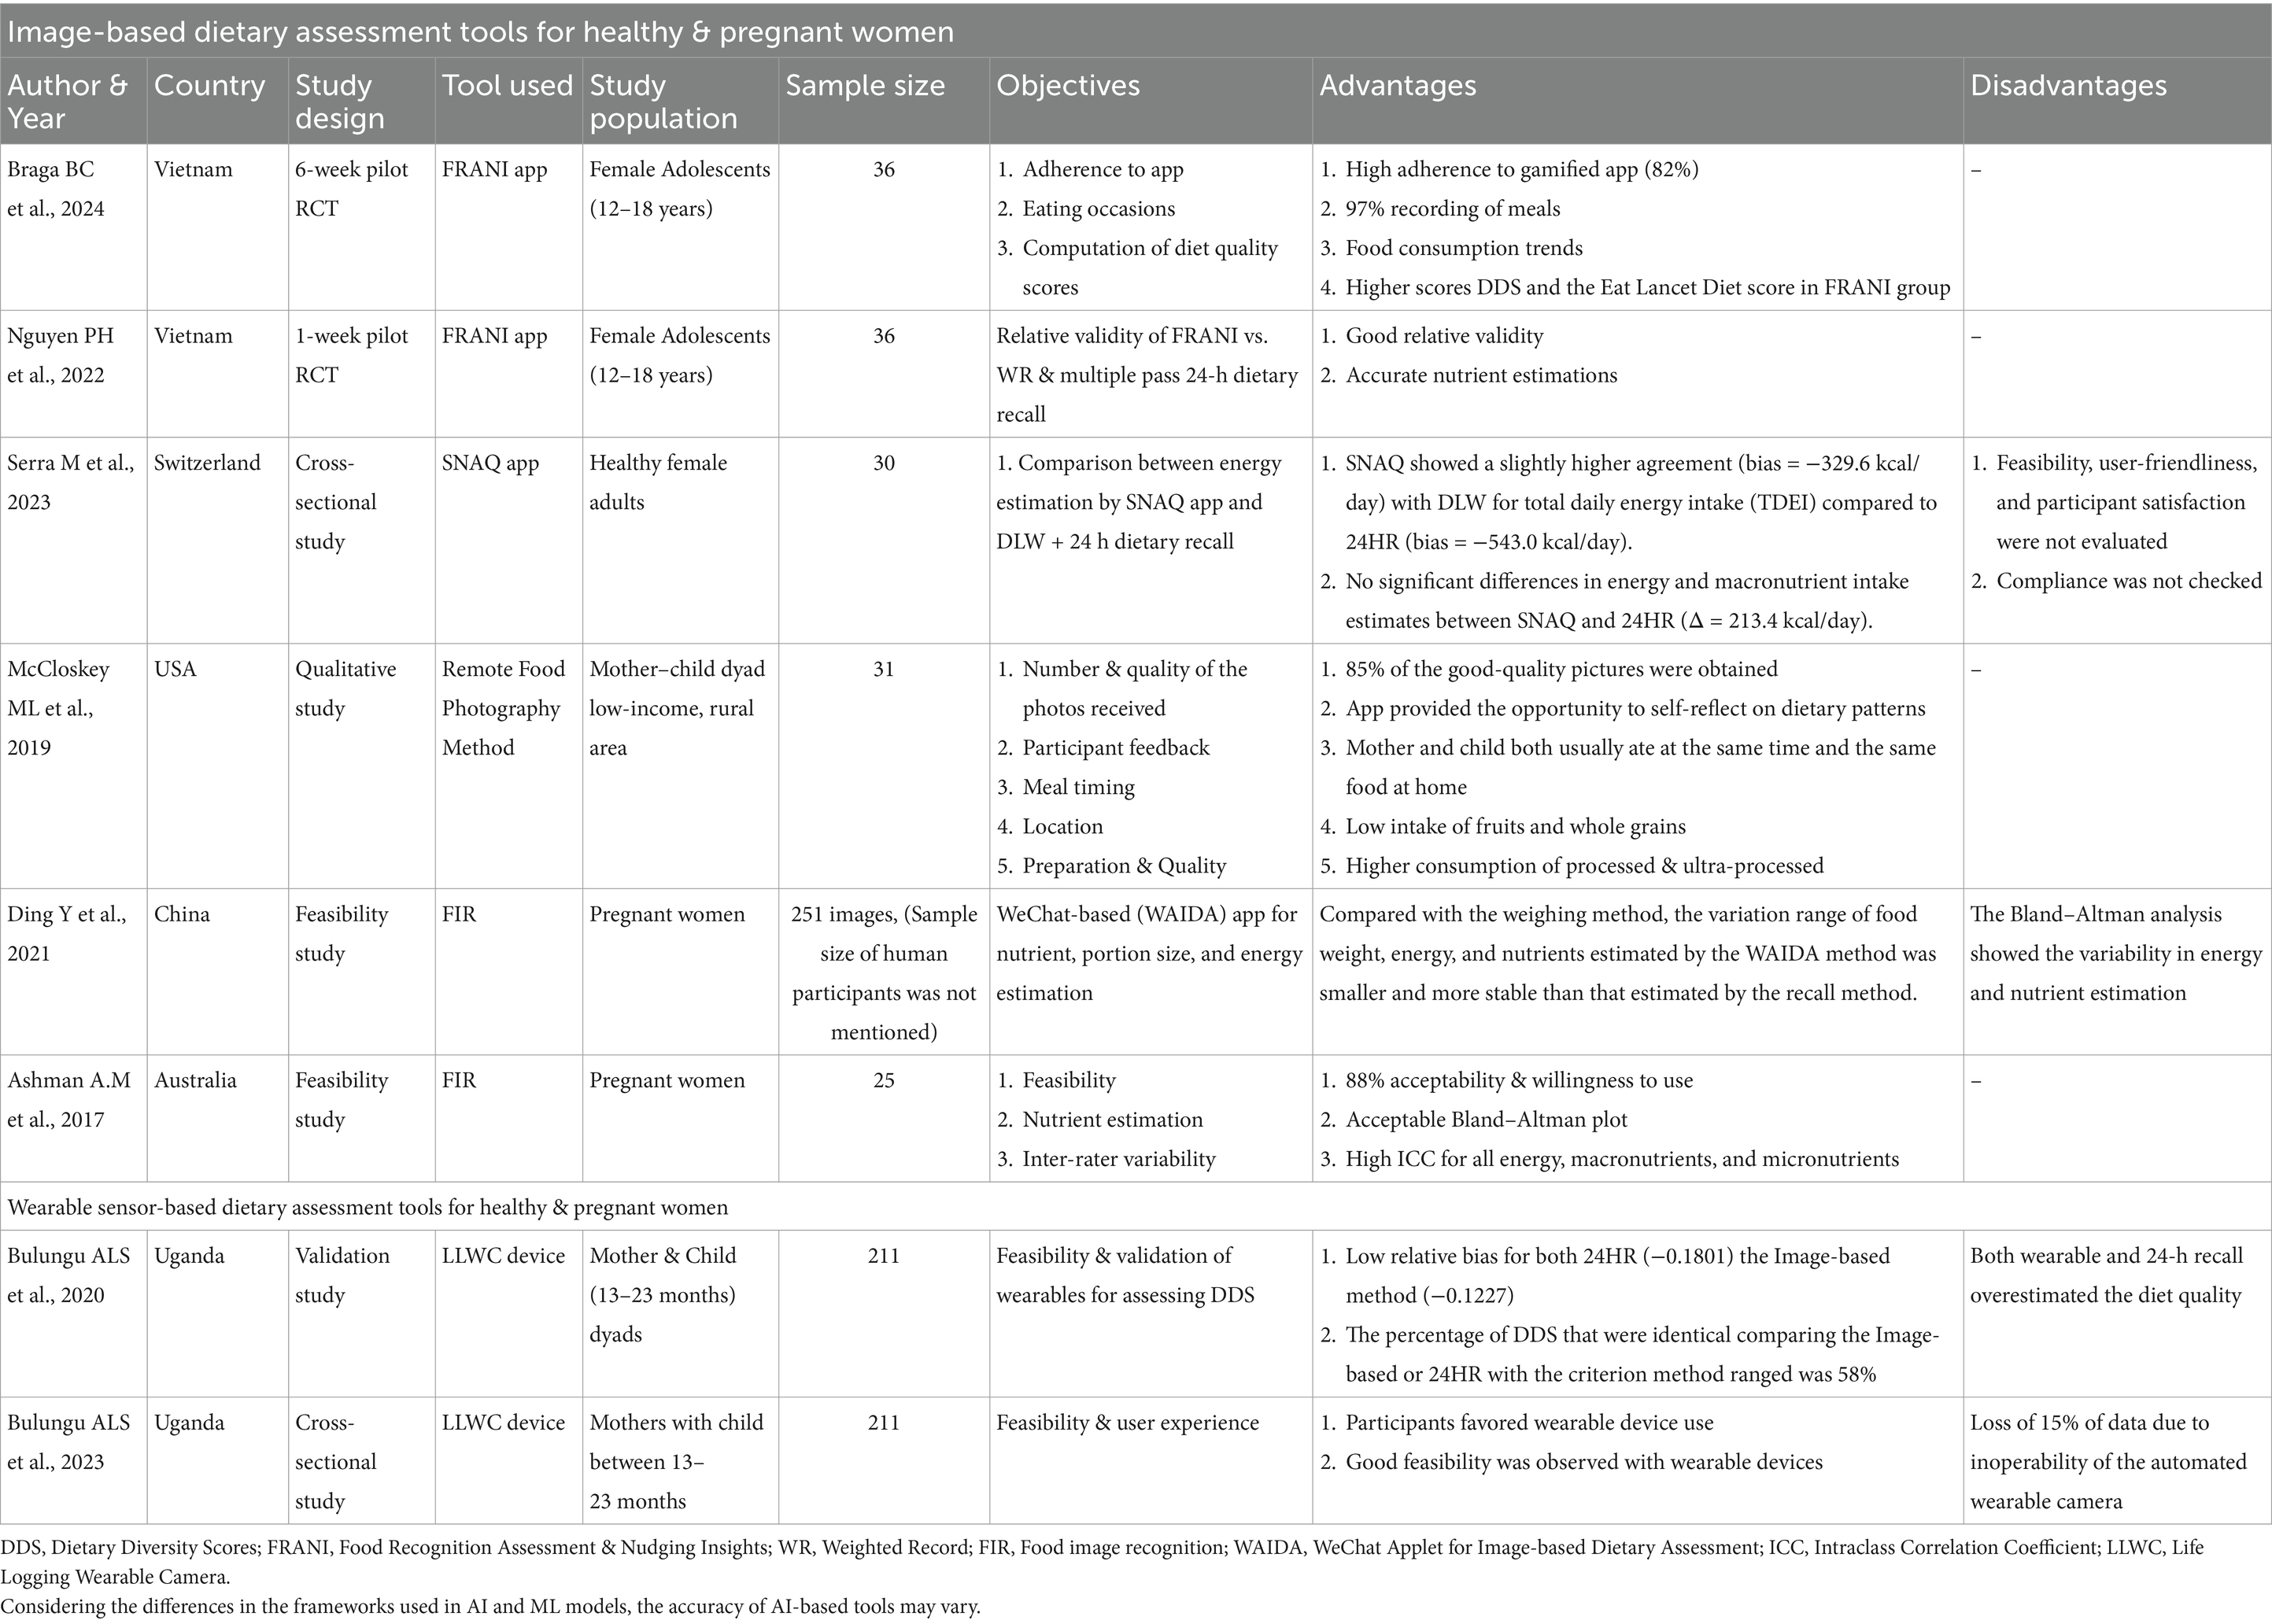
Table 2. AI-assisted dietary assessment tools for healthy & pregnant women.
3.2.1 Image-based dietary assessment
A randomized pilot study among Vietnamese and Ghanaian adolescent females (n = 36) assessed the feasibility of the FRANI (Food Recognition Assistance and Nudging Insight) app to capture their food choices and diet quality. This gamified app had high adherence (82%) and participants recorded 97% of the meals consumed. The study reported that most participants had low Minimum Dietary Diversity for Women (MDDW) and Eat Lancet Diversity Score (ELDS) meaning adolescent females did not consume most of the food groups (34). The same FRANI application was checked for relative validity by Nguyen et al. (35) against the weighted records and multi-pass 24-h recall. Energy, macronutrients, and micronutrient estimations were between 10 and 20% equivalence bounds using FRANI and weighted records showing a good correlation between both methods (concordance correlation coefficient [CCC]-0.60 and 0.81). However, a higher correlation (CCC-0.70–0.89) was observed for 24-h recall and weighted records. A cross-sectional study among 30 healthy females validated energy and macronutrient estimation by the SNAQ image recognition app with the gold standard Doubly Labeled Water (DLW) technique and 24-h dietary recall. SNAQ app and 24-h recall tended to underestimate the energy intake compared to DLW. However, total energy intake estimated using SNAQ had a higher agreement with DLW with a bias of −239.6 kcal/day compared to 24-h recall which had a larger bias (−543 kcal/day) (36).
Two studies evaluated the use of IBDA among pregnant women and those experiencing motherhood. A study among Australian pregnant women examined the relative validity of DietBytes to estimate energy and nutrient intake. No significant differences between energy, macronutrients, and micronutrient estimations were seen between DietBytes and 24-h recall, indicating acceptable Bland–Altman plots with minimum bias. Further, the high ICC (0.93, p < 0.001) for energy, and macronutrients (ICC-0.865–0.932, p < 0.05) was attended between dietitians for DietByte. Participants (88%) favored using DietBytes and 84% showed satisfaction with the app (37). Another study of pregnant Chinese women demonstrated the applicability of WAIDA (WeChat-based app for image-based dietary assessment) against the conventional weighted food records. Portion size estimations by WAIDA (0.825) were significantly (<0.001) correlated with the weighted food records (0.520). Furthermore, energy and nutrient estimations by WAIDA were closer to weighted records, indicating good accuracy (38).
In a qualitative study of 31 mother–child dyads, the feasibility of the Remote Food Photography Method was evaluated. Participants could send 85% of good-quality pictures that revealed meal times wherein mother and child usually had meals only a few minutes apart. 20% of the foods were takeaway items indicating consumption of convenience, processed, and ultra-processed foods. Further, most of the meals (47%) eaten by the mother were from disposable plates and takeaway containers (39).
3.2.2 Wearable sensor-based dietary assessment
Only two studies used wearable cameras to assess their feasibility and validity among mothers with infants. A cross-sectional study from Uganda, evaluated the validity of Life-logging wearable cameras (LLWC) to calculate Diet Diversity Scores (DDS), thus measuring maternal and child (n = 211 pairs) diet quality against weighted food records and conventional 24-h recall. The mean diet diversity (MDD) scores of mothers were higher when calculated using LLWC (42.3%) and 24-h recall (41.1%) as compared to weighted food records (47.2%). Both the methods, LLWC and 24-h recall had a low relative bias of −0.1227. Although the LLWC method showed low relative bias, it demonstrated moderate reliability (Cohen’s κ coefficient-0.59) compared to 24-h recall which had higher reliability (Cohen’s κ coefficient-0.68). Therefore, LLWC and 24-h recall could accurately estimate the DDS, however, both methods overestimated the scores more than direct weighted food records (40). Further the same group of researchers in 2023, examined the feasibility of LLWC devices in rural Eastern Uganda in collecting the dietary data of 211 mothers. Most participants rated LLWC devices as very good (56%) and good (36%). Importantly, 29% of participants reported LLWC as the less preferred method for reasons such as privacy invasion, fear associated with the device, and emotional burden in handling other’s reactions to device use. However, these results were not significantly higher than those who rated other methods as least preferred. This study also reported the technical challenges observed by researchers. For e.g., 15% data loss was a drawback of this method owing to inoperability, camera malfunction, forgetting to wear the device, and accidental video recording by the device (41).
Overall, IBDA and passive wearable camera devices were equally good, even slightly better than conventional methods in estimating portion sizes, energy, macronutrients, and micronutrients. The other findings from these studies showed that AI-assisted dietary assessment tools could calculate the diet quality scores, and analyze the meal times, meal composition, and intakes of unhealthy foods among adolescents, pregnant women, and mothers from LMICs. We conclude that these objective, passive data collection methods for dietary assessment were feasible and fairly accurate for use in this group.
3.3 For healthy adults
We observed that the applicability of AI-assisted dietary assessment tools was extensively studied in healthy, young-middle-aged adults than any other age group/health condition. There have been significantly more challenges in obtaining dietary data from young adults (18–35 years). For e.g., young adults tend to underreport and misreport snacking events (42–44). AI-assisted dietary assessments may be beneficial in capturing true information regarding unhealthy eating behaviors and patterns among adults (Table 3).
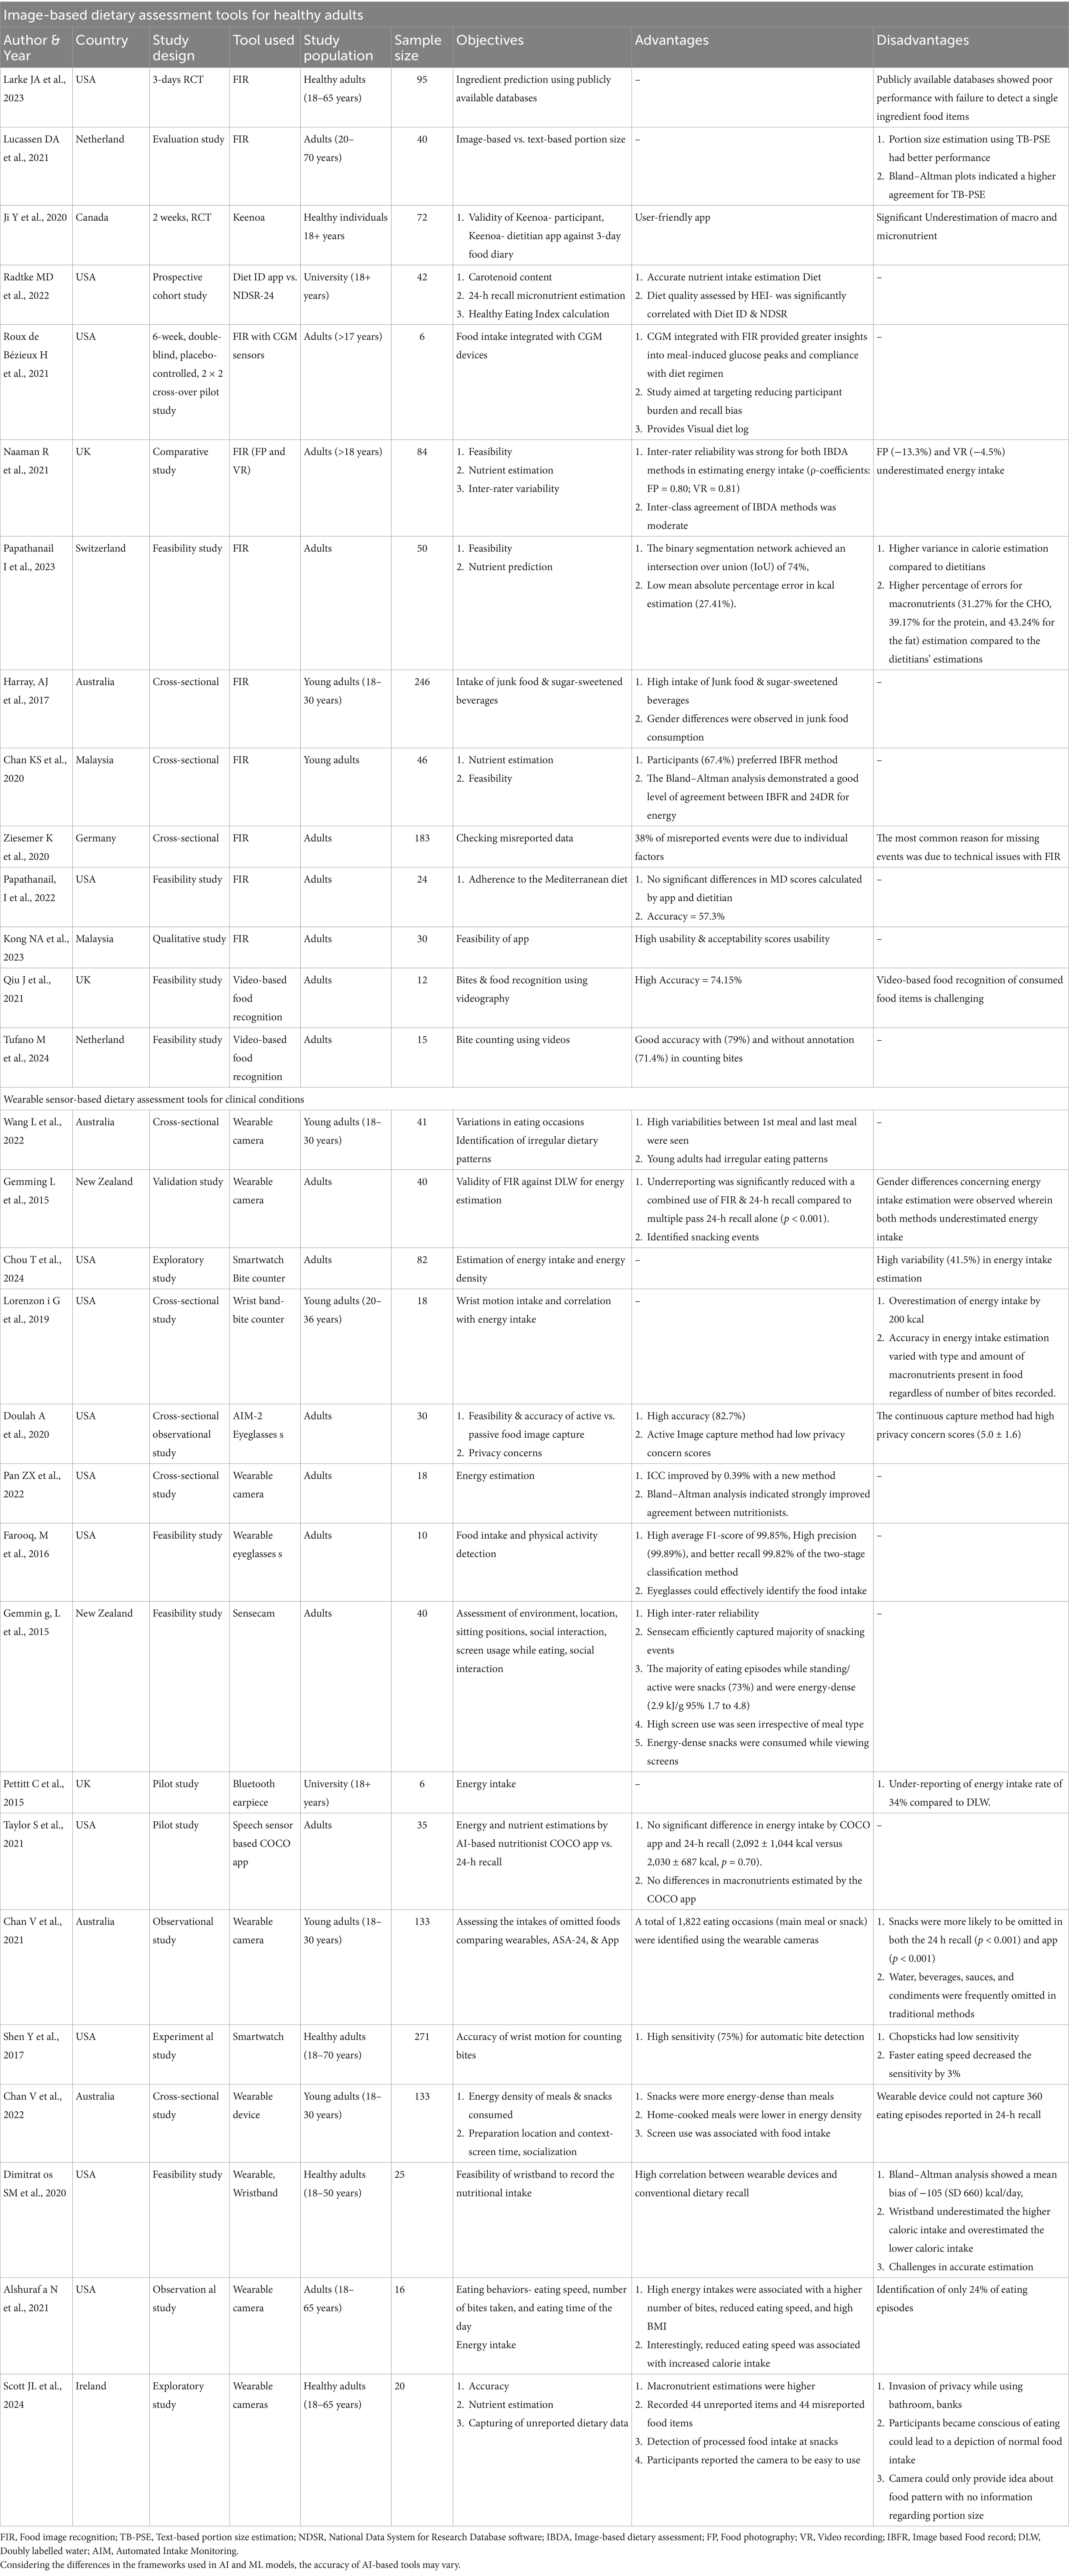
Table 3. AI-assisted dietary assessment tools for healthy adults.
3.3.1 Image-based dietary assessment
We summarized the findings from 17 studies that investigated the use of IBDA in healthy adults. A recent randomized controlled trial among 95 adults was conducted to compare the feasibility of the SNAPMe (Surveying Nutrient Assessment with Photographs of Meals) app against conventional automated self-administered (ASA24) food records. 67% of participants preferred using the SNAPMe app while 85% confirmed that it captured their true intake. Participant burden was significantly low in both methods according to 78% of the participants. Regarding the food ingredients, SNAPMe showed poor performance in identifying single ingredients. Further, its integration with publicly available databases remained inefficient underscoring the significance of developing a high-quality, large database (45).
A study from the Netherlands evaluated the efficacy of portion size estimation using image-based or text-based methods and ASA-24. Portion sizes estimated using image-based methods for all foods and drinks varied significantly from true intake (46). In terms of estimating nutrients, studies presented mixed findings wherein few IBDA apps were better than others. In a recent study, the Diet ID app was validated with 24-h dietary recall. The energy, macronutrients and micronutrients estimated using Diet ID were significantly correlated with 24-h recall. Furthermore, the study also aimed to check the efficacy of Diet ID in estimating carotenoid intake. Diet ID carotenoid estimations were as reliable as plasma & skin carotenoid concentrations (47). Similar findings were observed with the image-based food records (IBFR) app. In this study, the nutrient estimations using the IBFR app were compared with conventional 24-h recall. The Bland–Altman plot showed good agreement and a strong correlation between both methods. Further 67.4% of participants favored the IBFR method over 24-h recall (48). In contrast, a randomized controlled trial by Ji et al. (49), reported the difference in nutrient estimations with the Keenoa-image recognition app and a 3-day food diary (3DFD). The intake of energy, macronutrients, and micronutrients differed significantly from 3DFD with Bland–Altman plots showing poor agreements for these crucial nutrients. Nevertheless, the Keenoa app was perceived as user-friendly by more than half (58.2%) of the participants.
The majority of the studies showed acceptable to strong inter-rater agreements meaning high accuracy and low variations in recognizing true foods or nutrient estimations despite few shortcomings (50, 51). A study by Naaman et al. (50) investigated the efficiency of IBDA methods such as food photography and video recording against weighted food records in 84 healthy adults. The study reported high inter-rater reliability for image-based (0.80) and video-recording-based (0.81) energy estimation. However, image-based (−13.3%) and video-recording (−4.5%) methods underestimated energy intake. Compared to weighted food records, IBDA methods were user-friendly, time-efficient, practical, and enjoyable (p < 0.05 for all). In another feasibility study, the goFOOD application was assessed for feasibility and accuracy. 69% liked using this app and 83.3% of them found it to be user-friendly. A higher accuracy of image segmentation (food recognition) (IoU-74%) was observed with goFOOD. Moreover, the app achieved a lower mean absolute error (27.41%) in energy intake calculations, but the error percentages were higher for all macronutrients (31–43%). Additionally, the goFOOD app overestimated the energy and nutrients (51).
Two studies checked the efficacy of image and video-based apps in counting bites consumed by participants. A study by Qiu et al. (52), comparing photo-based and video-based estimation of bites consumed, showed video-based method can accurately count the bites up to 74.15%. Additionally, the study concluded that recognizing visible foods is easier than detecting consumed food items resulting in a 25% decrease in accuracy levels. Similarly, in another study, counting bites from videography was 79% accurate with annotation and 71.4% without annotation (53). Only one qualitative study was conducted in this population which reported that IBDA apps were more acceptable, user-friendly, and feasible to use among this population (54).
Few studies showed the feasibility of IBDA for assessments of different dietary behaviors. For e.g., an Australian study using the IBDA app revealed a higher intake of junk food and sugar-sweetened beverages among young adults (3.7 ± 2.0) servings per day (55). Another cross-sectional study among adults aimed to perform Ecological Momentary Analysis (EMA) using image-based dietary assessment methods. In the EMA approach, the study of food environment, and social context are studied rather than only focusing on an individual’s food intake, therefore providing insights into factors that trigger certain eating behaviors. The study found underreporting of the snacks was a common missing data and actual context has a lot to do with eating behaviors (56). Another feasibility study examined the utility of the IBDA app in calculating Mediterranean diet (MD) scores against those calculated by dietitians. In this study, the mean precision of 57.3% was achieved with the IBDA app. Additionally, this food recognition system precisely calculated MD scores, whereas self-administered 24-h recall overestimated the MD scores (57).
Only one study attempted to integrate an image recognition app with data obtained from a Continuous Glucose Monitoring (CGM) device. The study concluded that integrating CGM devices with IBDA enlightened individuals about meal-induced glucose spikes, and adherence to dietary intervention. Additionally, it provided a visual representation of food intake and relative glucose monitoring data. Such breakthrough technological innovations can be highly effective and encouraging for individuals and healthcare providers (58).
3.3.2 Wearable sensor-based dietary assessment
A total of 16 explored the feasibility of integrating wearable-sensor-based dietary assessment tools among healthy adults. A study by Gemming et al. (59) validated SenseCam—a wearable camera device and 24-h dietary recall against the DLW technique. This study reported a high underestimation of energy intake in men (17%) and women (13%) when measured only using SenseCam as opposed to SenseCam plus 24-h recall which was observed to reduce the underestimations (men %, women %). The proportion of underreporting in men (8%) and women (6%) was reduced significantly in SenseCam plus 24-h recall than the conventional 24-h recall alone (p < 0.001). Additionally, SenseCam could identify the unreported snacks (265 foods). The study concluded that using advanced AI-assisted DA in combination with conventional tools enhances data accuracy.
Three studies recorded the food intake using wearable eyeglasses (60, 61). A study by Doulah et al. (60), validated a unique AIM-2 (Automatic Ingestion Monitor) wearable eyeglasses to detect eating events without invading the user’s privacy. AIM-2 device had a high accuracy (82.7%) in detecting eating events. Furthermore, the study showed high privacy concerns scores for continuous capture (5.0 ± 1.6) versus image-capturing (1.9 ± 1.7) only during eating events on a 7-point Likert scale. Another study using wearable eyeglasses assessed the novel functionality of capturing the food consumed during physical activity. The study showed two-stage classification system was better (F-1 score-99.85%) and had higher precision (99.89%) and recall (99.82%) than the single classification. This means that wearable eyeglasses could accurately predict eating events during physical activity (61). Another cross-sectional study using the AIM-2 wearable device showed an improved ICC by 0.39 in agreement with the Bland–Altman analysis (62).
Wearable devices often help capture eating behaviors and occasions. A study from the USA provided wearable cameras to 16 adults to record the association between the number of bites, eating speed, and energy intake. The study concluded that reduced eating speed and a high number of bites consumed correlated with high BMI and energy intake. Interestingly, a reduction in eating speed does not necessarily mean low energy intake as slow eating speed was observed mainly with screen use. Despite these observations, wearable cameras could identify only 24% of eating events (63). Another study counted bites with the help of a smartwatch. This method had good sensitivity (75%) and a prediction rate of 89%. However, sensitivity was significantly reduced by faster eating speed and chopstick use (64). A cross-sectional study from Australia among young adults explored intra-individual differences in eating timings using a wearable camera device for 3 days. The results indicated high variabilities in their eating events and patterns, indicating irregular dietary patterns among adults (65).
About five studies exploring nutrient estimation through different wearable devices, presented mixed findings. A wrist-band bite counter device overestimated the energy intake varied with the amount & type of macronutrient present regardless of the number of bites recorded (66). Another study combining the two technologies such as the bite counter with IBDA, reported higher variability in estimations of energy intake with the bite counter (41.5%) compared to IBDA (23.4%) (67). Similar findings were observed in the UK study investigating the wearable Bluetooth earpiece against the DLW method to estimate energy intake among adults. The energy intake was underestimated by almost 34% when calculated using a wearable Bluetooth earpiece (68). A feasibility study from the USA reported that wearable wristbands significantly underestimated high-calorie and overestimated low-calorie intake with a bias of −150 ± 660 kcal/day as per Bland–Altman plots. The study reported challenges in accuracy and high variability with wristbands (69). In contrast, a speech-assisted (using the NLP model) app (nutritionist COCO) estimated energy and macronutrients, similar to that obtained from 24-h recall (70).
Snacking is common among young adults leading to increased energy consumption, mostly associated with higher screen usage. The Australian cross-sectional study showed the same using wearable cameras, where snacks had higher energy density than home-cooked meals and snacking episodes were significantly associated with screen use. Contrary to the notion, this study reported that wearable cameras could not capture 360 eating events reported in 24-h recall (71). Further, wearable cameras overestimated macronutrients in some cases, but were found to be useful in capturing 44 unreported and misreported items. Additionally, wearable cameras were efficient in the detection of processed food intake during snacking without any bias. However, the study noted a few downsides to this approach as it may lead to an invasion of privacy and make participants conscious of eating thus affecting the capture of true intake (72).
3.4 For hospitalized patients and clinical conditions
Malnutrition is often underdiagnosed in critically ill hospitalized patients and greatly affects disease prognosis, length of stay, and overall quality of life (12–14). Critical assessment and monitoring of food intake in critically ill/hospitalized patients is paramount. Performing dietary assessments in hospitalized patients and those with clinical conditions has been challenging wherein the conventional tools fail to capture the objective and true dietary data. AI-assisted dietary assessment tools may potentially benefit these vulnerable populations and provide accurate information (Tables 4, 5).
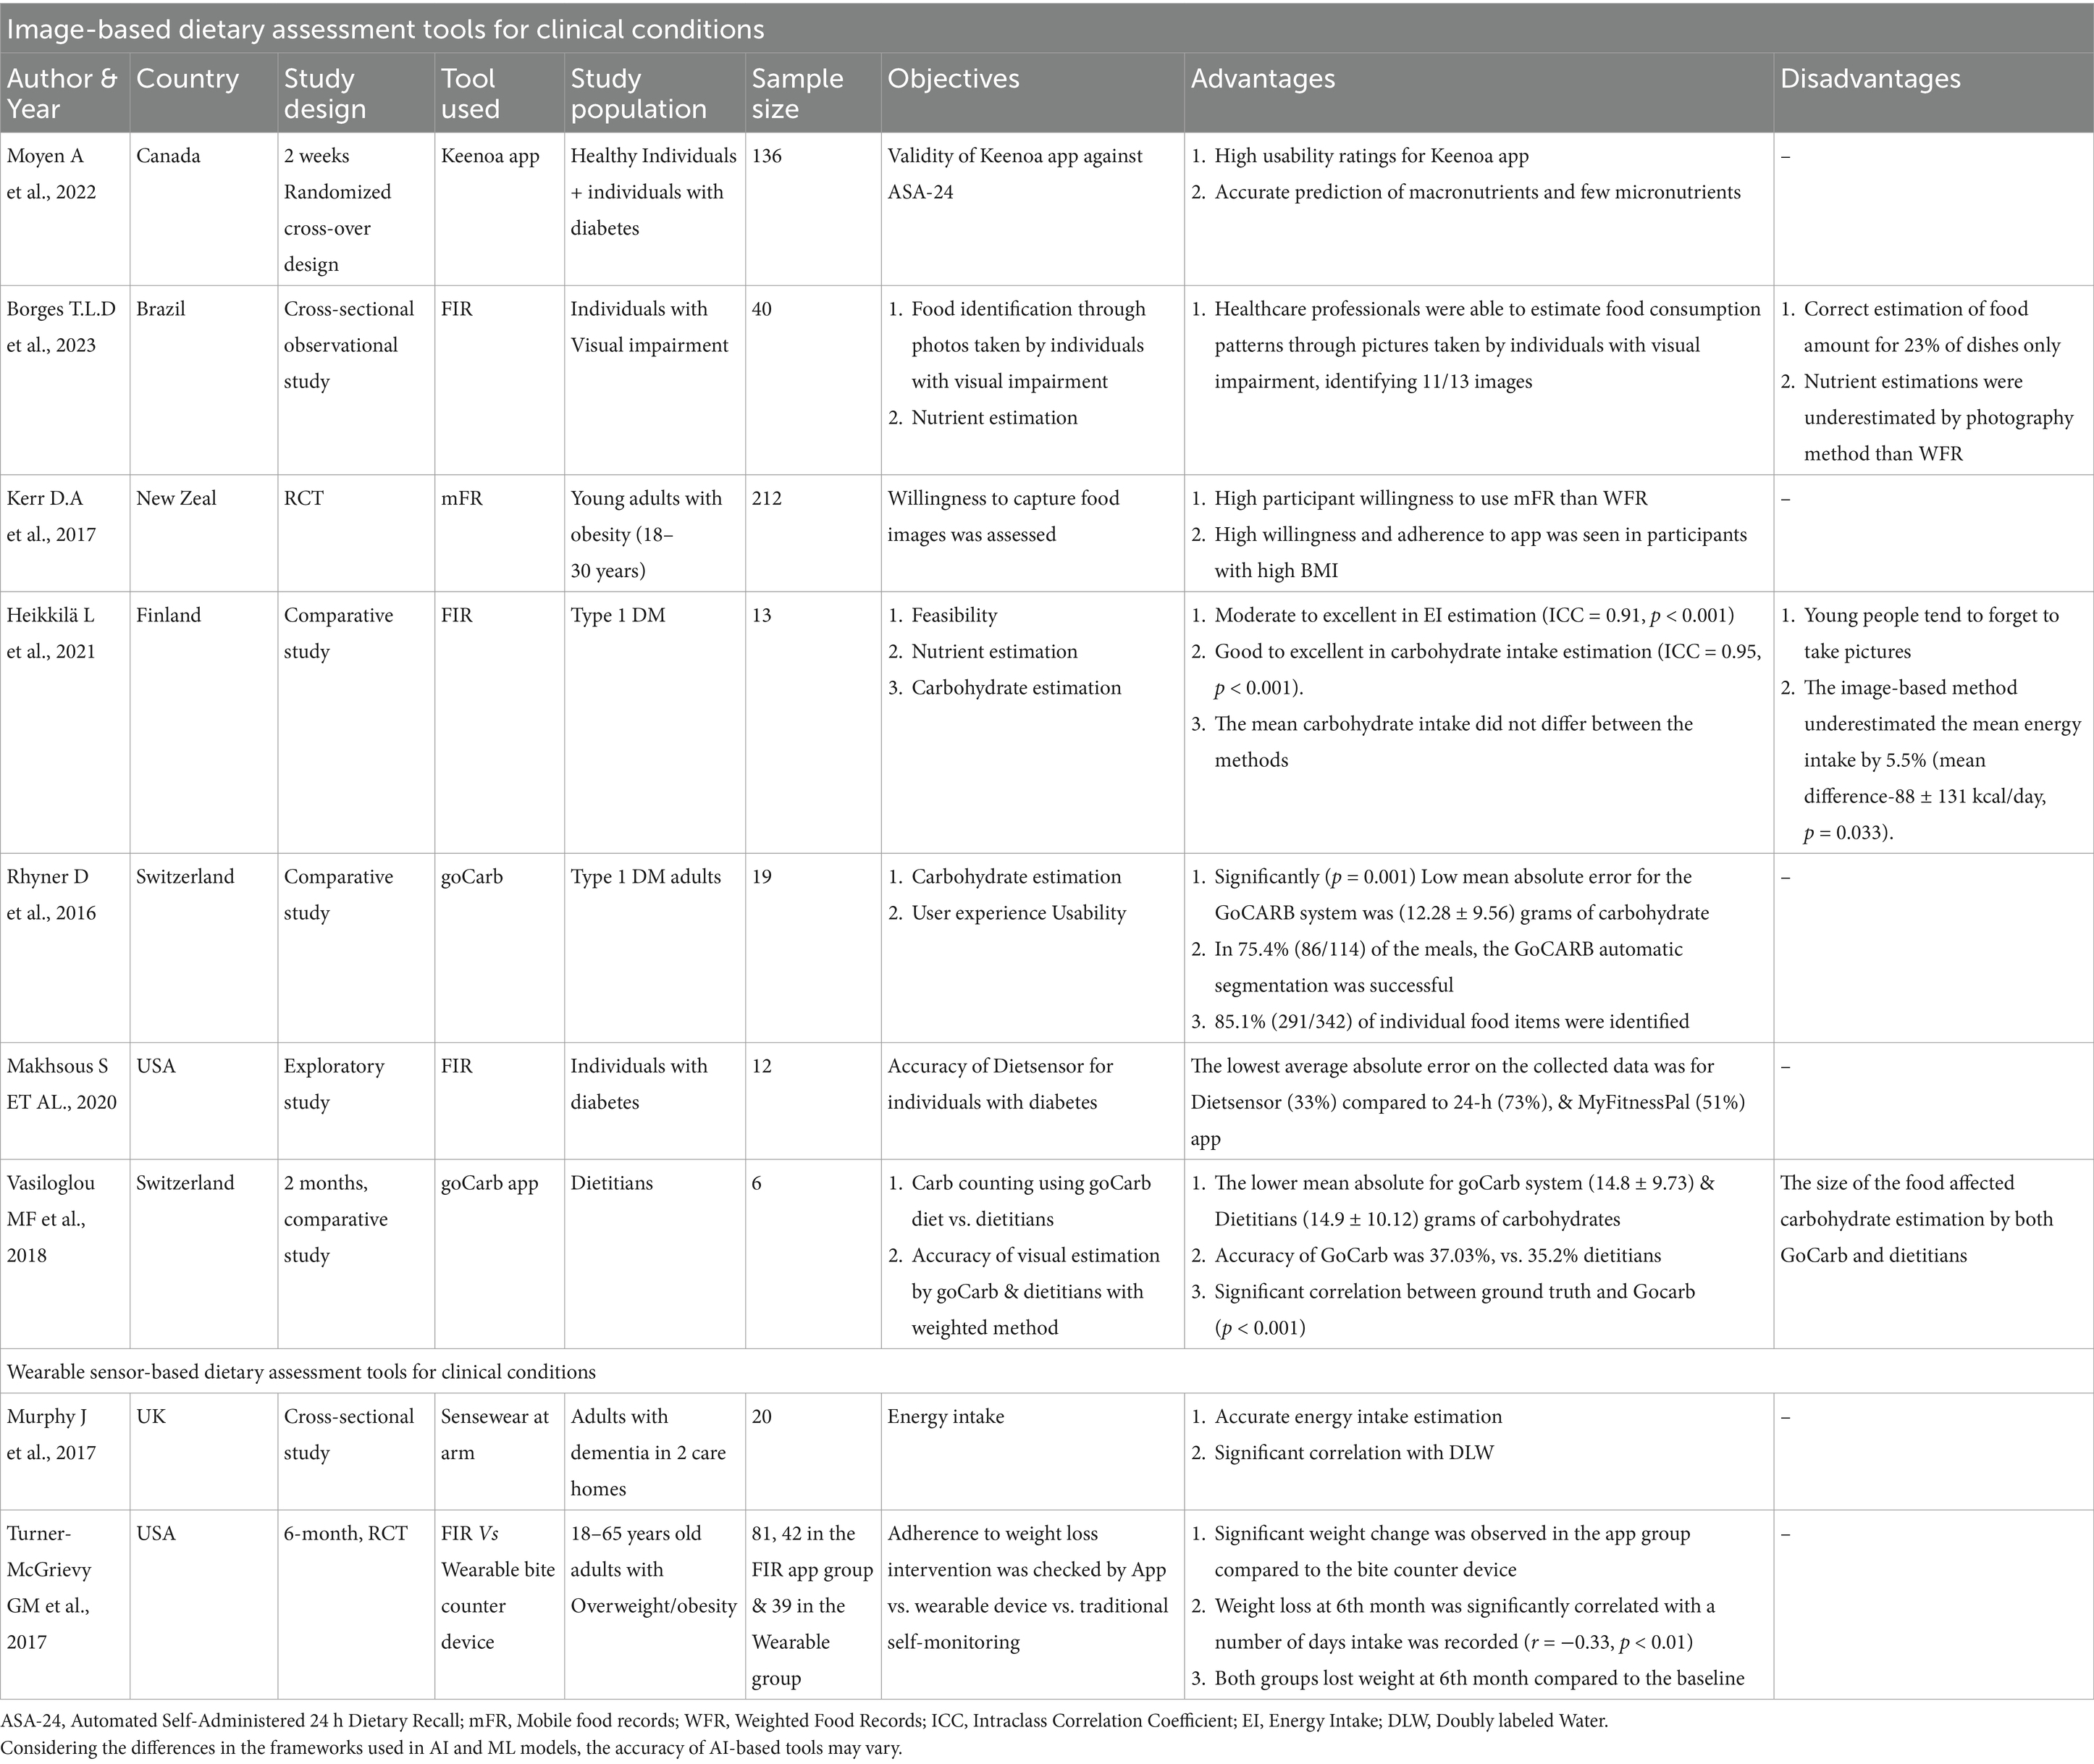
Table 4. AI-assisted dietary assessment tools for clinical conditions.
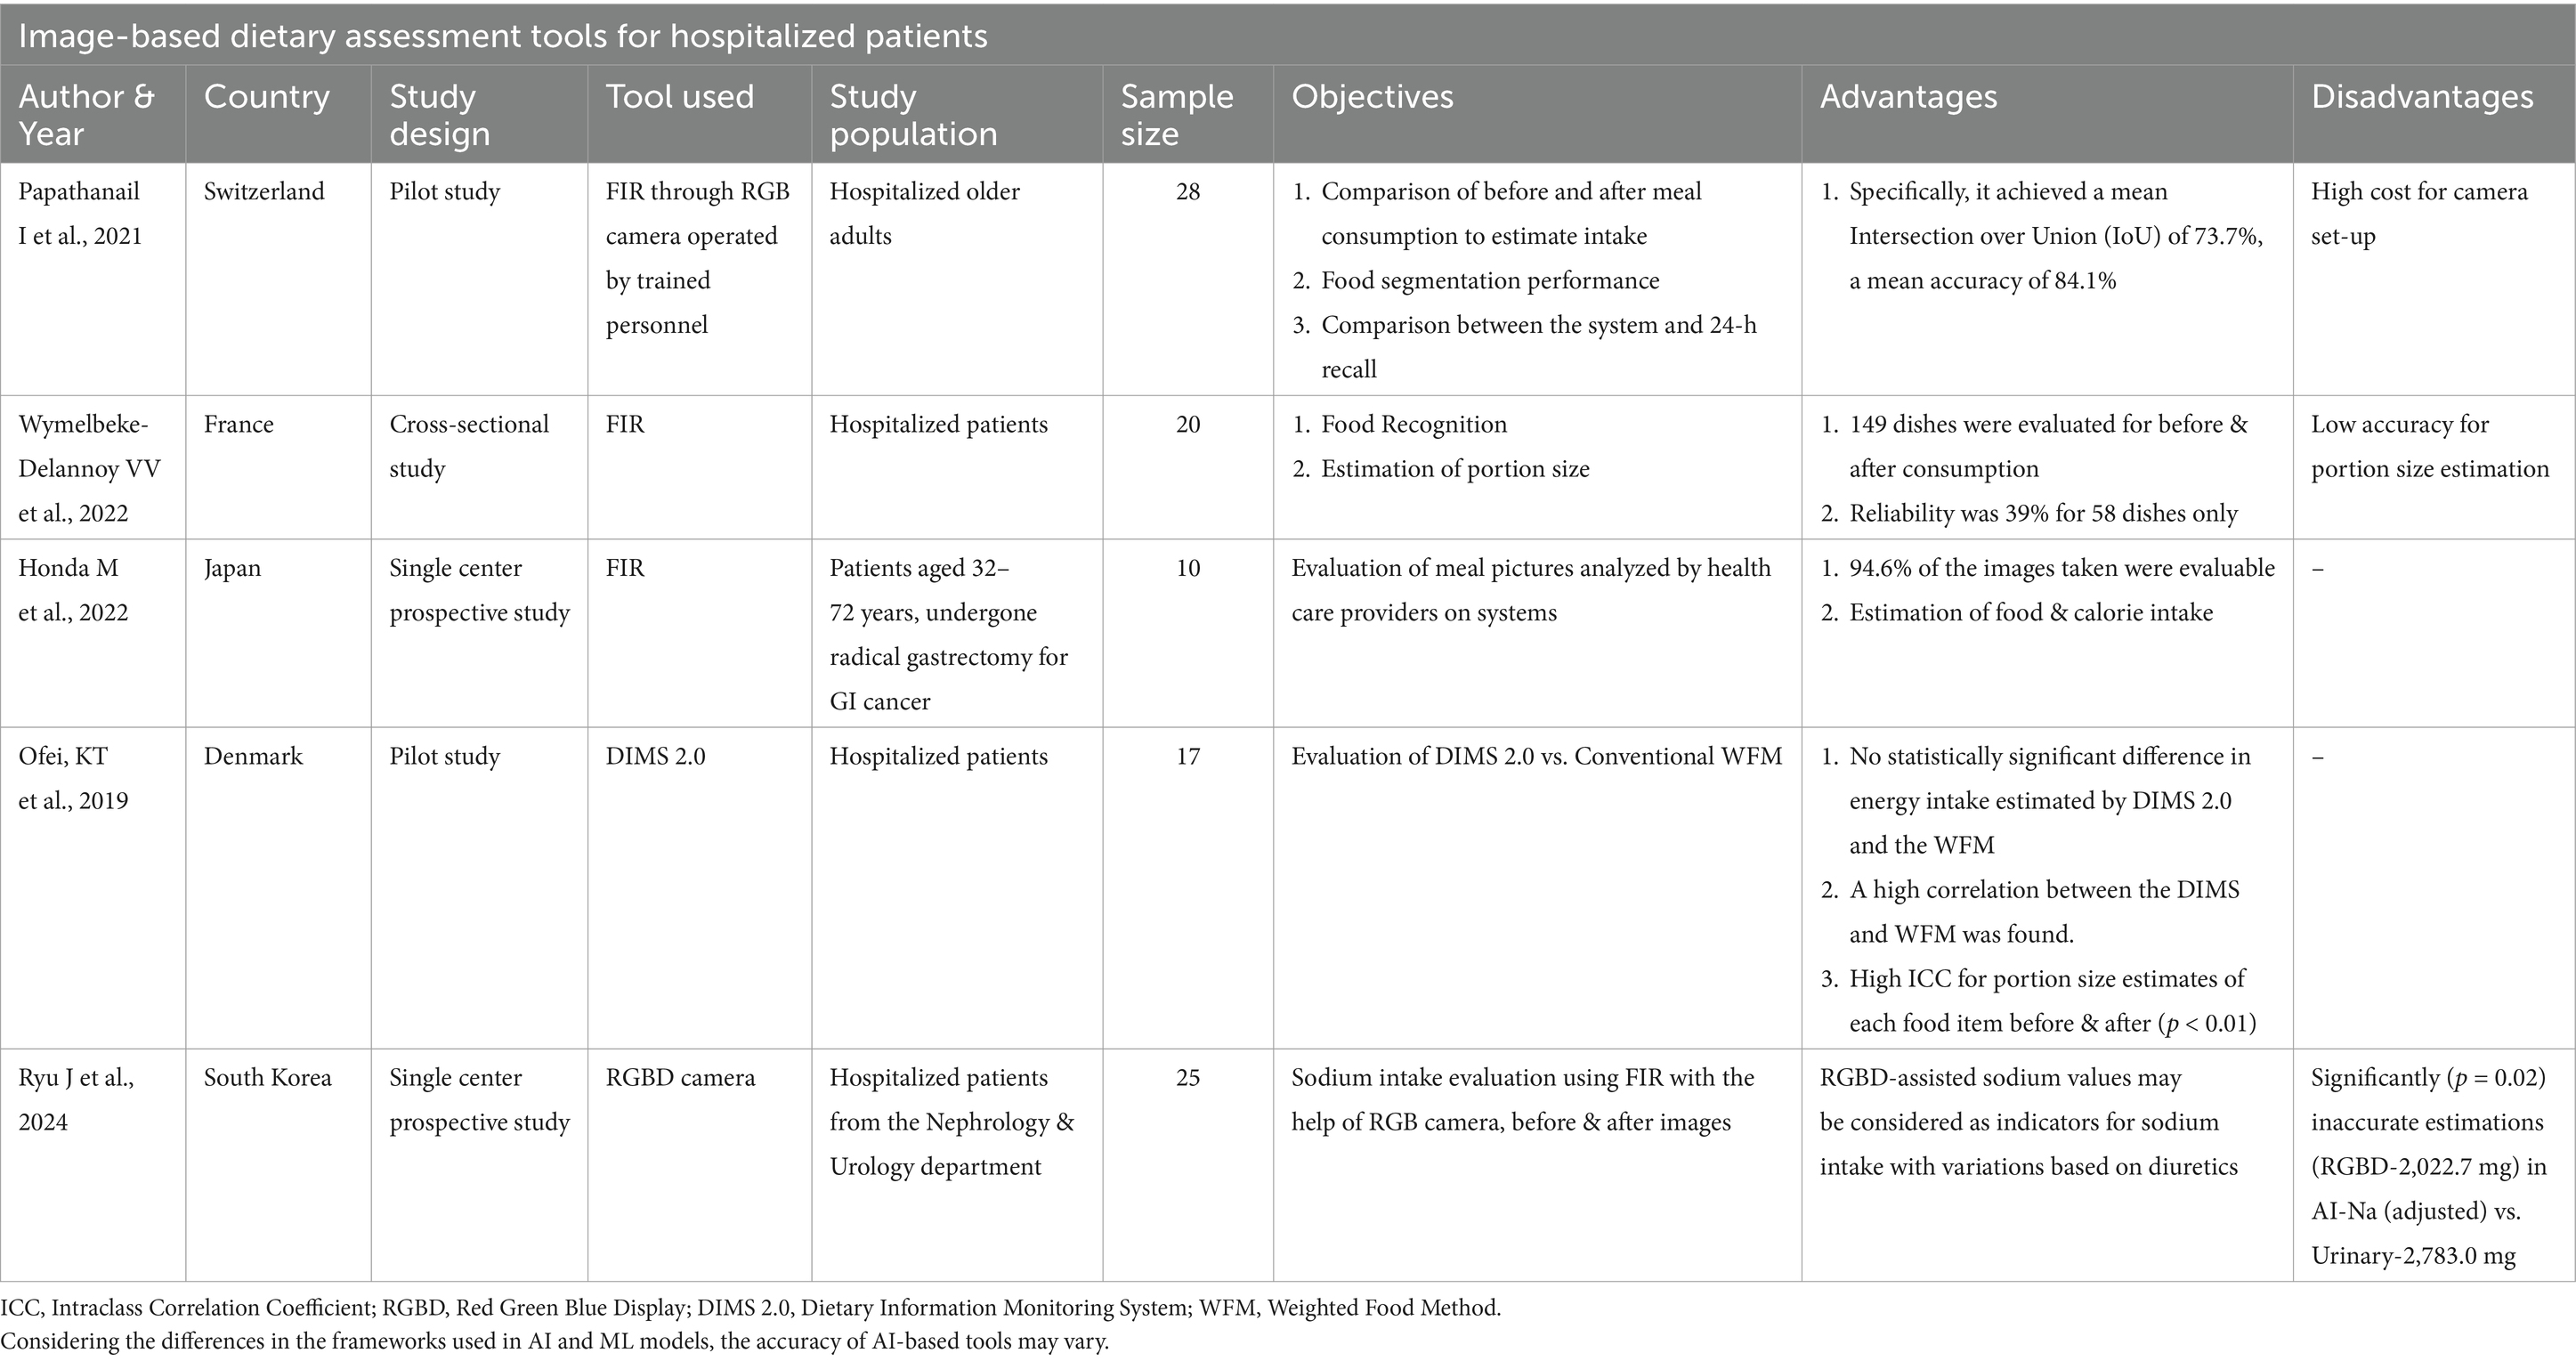
Table 5. AI-assisted dietary assessment tools for hospitalized patients.
3.4.1 Image-based dietary assessment
We found four studies that tested the performance, accuracy, and nutrient estimation capacity of IDBA among hospitalized patients. Each of these studies concluded that IDBA may be used effectively in hospital settings in the future by addressing the existing challenges in methodologies. A pilot study from Denmark showed that Dietary Intake Monitoring System (DIMS) 2.0 effectively calculated energy intake when compared to the conventional method without systemic bias. Further DIMS 2.0 computed portion size before (0.88) and after (0.99) consumption with significantly high ICC agreement (p < 0.01) (73).
Similar findings were noted among 28 hospitalized older adults by Papathanail et al. (74) where the food image recognition system had a high mean accuracy of 84.1% and system surpassed the trained staff in nutrient estimation. In contrast, the IBDA system showed low reliability (39%) for around 58/149 dishes checked for portion-size estimation before & after (75). A single-center feasibility trial was conducted among hospitalized patients who underwent GI surgery to estimate portion size and nutrient intake. Around 94.6% of the images were evaluated by a food recognition system and provided fair estimates of food and nutrient intake (76). A South Korean single-centered prospective study explored the application of an AI-based dietary sodium detection system. The study reported significant differences in sodium estimations by AI-based and 24-h urinary sodium and concluded that sodium intake is affected by various factors thereby leading to inaccurate estimations by AI-based system (77).
Dietary assessments among individuals with diabetes are of prime significance and can help analyze their dietary pattern, adherence, and even estimation of carbohydrate intake which becomes important specifically for individuals with Type I diabetes and those taking insulin. We observed five studies conducted using IBDA apps among individuals with diabetes. A 2-week randomized controlled trial showed that the Keenoa app had high usability ratings with an accurate prediction of all macronutrients. However, the accuracy was high for only a few micronutrients (78). Similarly, another exploratory study from the US reported that DietSensor accurately estimated nutrient intakes of individuals with diabetes with lower absolute error (33%) compared to conventional 24-h recall (73%) (79). On the other hand, a comparative study from Finland reported that IBDA significantly underestimated energy intake by 5.5% (p = 0.033). Nevertheless, IBDA efficiently computed carbohydrate intake with an excellent level of agreement (ICC = 0.95, p < 0.001) (80). Equivalently, GoCARB- an image-based carbohydrate-counting app showed a remarkable performance (p = 0.001) with the lowest mean absolute error of 12.28 ± 9.56 g compared to conventional tools (27.89 ± 38.20). Moreover, GoCARB recognized about 85.1% of food items accurately (81). In another study by Vasiloglou et al. (82), comparing GoCARB versus experienced dietitians reported consistent findings wherein the GoCARB system (mean absolute error- 14.8 ± 9.73) matched the carbohydrate estimation to that of experienced dietitians (14.9 ± 10.12). The accuracy of GoCARB was 37.03%, almost outperforming dietitians (35.2%). In a study among individuals with overweight/obesity, the results indicated a higher willingness (OR-1.68, 95% CI-1.02–2.77) to capture images for more days (>14 days) rather than written records (83). Only one study evaluated the application of IBDA among individuals with visual impairment. Unlike previous findings, this system frequently underestimated the nutrients and estimated the correct food amounts only for 23% of items. Nevertheless, it was observed that healthcare professionals successfully identified food consumption (11/13 food items) from images captured by the individuals with visual impairment (84).
3.4.2 Wearable sensor-based dietary assessment
A Wearable Sensewear armband worn by older adults with dementia was used to investigate whether arm movements can be correlated with energy intake. This study showed promising results wherein energy intake significantly (p < 0.05) correlates with total energy expenditure (85). Another 6-month randomized controlled trial assessed and monitored the adherence to diet intervention and calculated weight loss through a food recognition app and a wearable bite counter device. A significant correlation (r = −0.33, p < 0.01) was observed between weight and the frequency of intake recording (number of days). In conclusion, measuring and monitoring dietary intake significantly improved adherence to intervention leading to greater weight loss among individuals with overweight/obesity (86).
3.5 Other studies
Two studies exploring the utility of IBDA and wearable devices conducted in different populations are reviewed here. An observational study evaluated the eating behaviors of 20 families using a wearable smartwatch. Overall, the compliance rate was 89.3% for all the captured eating movements and 76.5% of movements were true positives with a precision of 0.77 (87). Another mixed-methods study among dietitians who used voice and image-assisted apps reported that capturing snacks and recipe recording was challenging. Additionally, dietitians experienced discomfort in capturing food photos in social settings (88) (Table 6).
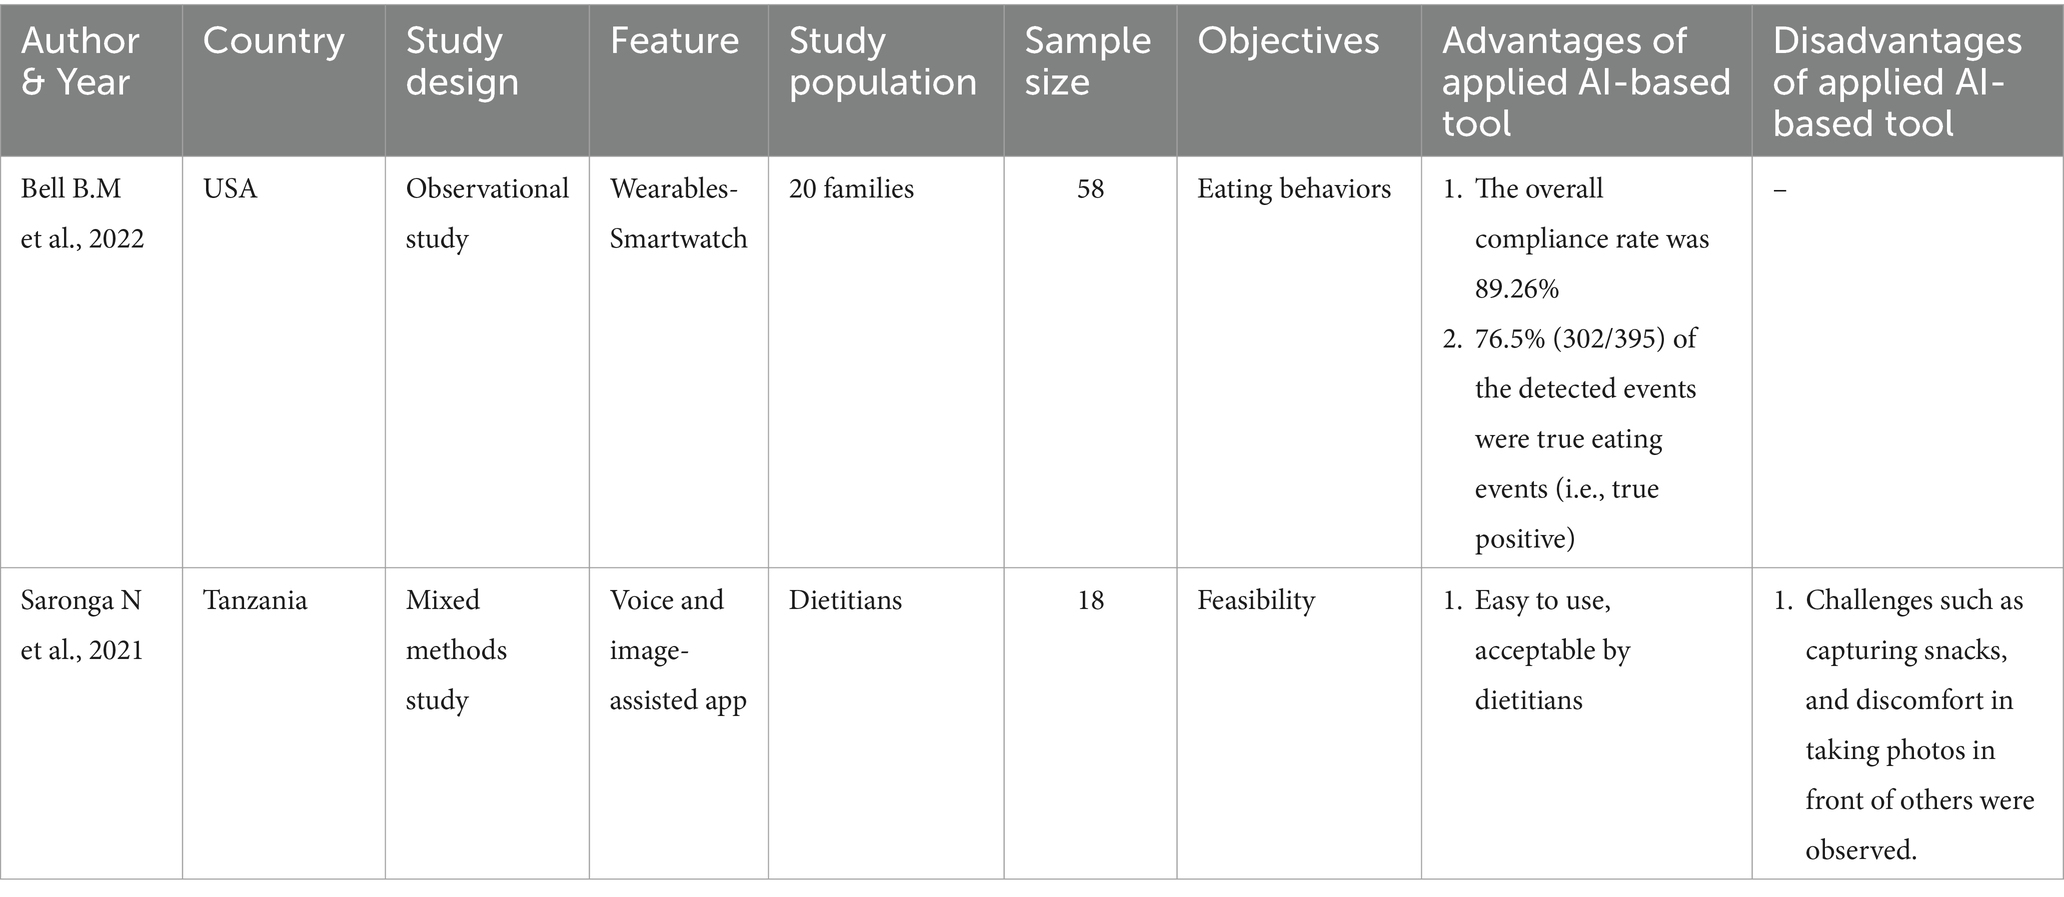
Table 6. AI-assisted dietary assessment tools (Studies among other populations).
4 Strengths and limitations of AI-assisted dietary assessment tools
We observed a developmental trend with AI-assisted dietary assessment tools in recent years following the COVID-19 pandemic. AI-assisted dietary assessment tools were user-friendly, time-efficient, feasible for usage in real-world settings, and highly favored by human participants. Most of the image-based and sensor-based (wearables) tools had accuracy ranging between 60 and 95%. Energy macronutrient and micronutrient estimations were as precise as those with conventional tools such as 24-h dietary recall. In some cases, it was even more precise than conventional tools when validated against gold-standard methods like DLW. Both image-based and sensor-based assessments captured more data than just the food intake and nutrient estimations. For e.g., food environments, social context, peer influence, shopping behavior, physical activities during eating, eating behaviors, and snacking events. AI-based dietary assessments could successfully identify misreported and unreported food intake. Few studies demonstrated the use of AI-based dietary assessments integrated to calculate dietary scores such as Mediterranean diet scores, Eat-Lancet Diversity Scores, and Minimum Dietary Diversity for Women. Furthermore, we described the potential applications of AI-based tools for vulnerable populations. Although these tools were beneficial, no technology is without limitations. The portion size estimations using wearable devices were inaccurate, wherein small portion sizes were consistently overestimated. Few AI-assisted tools either underestimated or overestimated the energy requirements. Technical malfunctions of the wearable devices caused the loss of data and some devices were more convenient to use than others. Importantly, privacy is the major concern for passive, automated, wearable devices that capture images continuously. Few studies reported capturing pictures other than participants’ food intake (for e.g., use of lavatory). Only one study developed a method of eating event-specific capturing of data ensuring high privacy to participants. It must be noted that each of these studies had specific objectives and were developed using different machine-learning models and frameworks which can significantly affect the performance of these AI-assisted tools. In other words, the lack of uniformity in the underlying frameworks of the apps and wearables may affect our conclusion making it difficult to generalize the findings. A few inherent limitations of this study must be acknowledged while interpreting the results. We could not assess the quality and risk of bias considering the lack of uniformity in research settings, design, study samples, and the evaluated outcomes in these studies. Nevertheless, our study highlights the research gaps while presenting the current state of evidence. It is worth noting that these technologies are still evolving, and more rigorous scientific efforts can be directed at testing the applications of these AI-based tools in real-world clinical settings.
5 Conclusion
In summary, various Image-based and Motion sensor-based AI-assisted dietary assessment tools exist with wider functionalities such as food identification, classification, calorie estimation, eating frequencies, and shared eating occasions. Such high-end functionalities can be efficiently used in hospitals, clinics, and tele-nutrition practices. Furthermore, AI-assisted dietary assessment tools are user-friendly, time-efficient, and can facilitate early nutrition intervention leading to rapid patient recovery. Therefore, integrating AI-based dietary assessment tools will not only help improve the quality of nutrition care but also navigate next-gen nutrition care practices. More studies are required to further evaluate the efficacy and accuracy of these tools. Additionally, we recommend training healthcare professionals in the optimum utilization of AI-assisted dietary assessment technologies to upgrade their clinical practices.
Author contributions
AP: Conceptualization, Data curation, Formal analysis, Investigation, Visualization, Writing - original draft, Writing - review & editing. DG: Conceptualization, Methodology, Project administration, Resources, Supervision, Validation, Visualization, Writing – review & editing.
Funding
The author(s) declare that no financial support was received for the research, authorship, and/or publication of this article.
Conflict of interest
The authors declare that the research was conducted in the absence of any commercial or financial relationships that could be construed as a potential conflict of interest.
Generative AI statement
The authors declare that no Gen AI was used in the creation of this manuscript.
Publisher’s note
All claims expressed in this article are solely those of the authors and do not necessarily represent those of their affiliated organizations, or those of the publisher, the editors and the reviewers. Any product that may be evaluated in this article, or claim that may be made by its manufacturer, is not guaranteed or endorsed by the publisher.
Supplementary material
The Supplementary material for this article can be found online at: https://www.frontiersin.org/articles/10.3389/fnut.2025.1518466/full#supplementary-material
References
1. Gnagnarella, P, Ferro, Y, Monge, T, Troiano, E, Montalcini, T, Pujia, A, et al. Telenutrition: changes in professional practice and in the nutritional assessments of Italian dietitian nutritionists in the COVID-19 era. Nutrients. (2022) 14:1359. doi: 10.3390/nu14071359
2. Farid, D. COVID-19 and telenutrition: remote consultation in clinical nutrition practice. Curr Dev Nutr. (2020) 4:nzaa124. doi: 10.1093/cdn/nzaa124
3. Miyazawa, T, Hiratsuka, Y, Toda, M, Hatakeyama, N, Ozawa, H, Abe, C, et al. Artificial intelligence in food science and nutrition: a narrative review. Nutr Rev. (2022) 80:2288–300. doi: 10.1093/nutrit/nuac033
4. Theodore Armand, TP, Nfor, KA, Kim, JI, and Kim, HC. Applications of artificial intelligence, machine learning, and deep learning in nutrition: a systematic review. Nutrients. (2024) 16:1073. doi: 10.3390/nu16071073
5. Lewis, SL, Miranda, LS, Kurtz, J, Larison, LM, Brewer, WJ, and Papoutsakis, C. Nutrition care process quality evaluation and standardization tool: the next frontier in quality evaluation of documentation. J Acad Nutr Diet. (2022) 122:650–60. doi: 10.1016/j.jand.2021.07.004
6. Dao, MC, Subar, AF, Warthon-Medina, M, Cade, JE, Burrows, T, Golley, RK, et al. Dietary assessment toolkits: an overview. Public Health Nutr. (2019) 22:404–18. doi: 10.1017/S1368980018002951
7. Baghlaf, K. Traditional dietary assessment tools verses technology-based methods in children and adolescence. An updated review. Prog Nutr. (2022) 24:e2022017. doi: 10.23751/pn.v24i1.11107
8. Shonkoff, E, Cara, KC, Pei, X, Chung, M, Kamath, S, Panetta, K, et al. AI-based digital image dietary assessment methods compared to humans and ground truth: a systematic review. Ann Med. (2023) 55:2273497. doi: 10.1080/07853890.2023.2273497
9. Dalakleidi, KV, Papadelli, M, Kapolos, I, and Papadimitriou, K. Applying image-based food-recognition systems on dietary assessment: a systematic review. Adv Nutr. (2022) 13:2590–619. doi: 10.1093/advances/nmac078
10. Andersen, T, Byrne, DV, and Wang, QJ. How digital food affects our analog lives: the impact of food photography on healthy eating behavior. Front Psychol. (2021) 12:634261. doi: 10.3389/fpsyg.2021.634261
11. The Hindu. (2020). Available at: https://www.thehindu.com/life-and-style/food/food-photography-emerges-as-a-popular-covid-19-lockdown-activity/article32504673.ece (Accessed December 10, 2024).
12. Osooli, F, Abbas, S, Farsaei, S, and Adibi, P. Identifying critically ill patients at risk of malnutrition and underfeeding: a prospective study at an academic hospital. Adv Pharm Bull. (2019) 9:314–20. doi: 10.15171/apb.2019.037
13. Lee, ZY, and Heyland, DK. Determination of nutrition risk and status in critically ill patients: what are our considerations? Nutr Clin Pract. (2019) 34:96–111. doi: 10.1002/ncp.10214
14. Ferguson, CE, Tatucu-Babet, OA, Amon, JN, Lee-anne, SC, Malacria, L, Htoo, IM, et al. Dietary assessment methods for measurement of oral intake in acute care and critically ill hospitalized patients: a scoping review. Nutr Res Rev. (2023):1–14. doi: 10.1017/S0954422423000288
15. Russo, S, and Bonassi, S. Prospects and pitfalls of machine learning in nutritional epidemiology. Nutrients. (2022) 14:1705. doi: 10.3390/nu14091705
16. Salinari, A, Machì, M, Armas Diaz, Y, Cianciosi, D, Qi, Z, Yang, B, et al. The application of digital technologies and artificial intelligence in healthcare: an overview on nutrition assessment. Diseases. (2023) 11:97. doi: 10.3390/diseases11030097
17. Boushey, CJ, Spoden, M, Zhu, FM, Delp, EJ, and Kerr, DA. New mobile methods for dietary assessment: review of image-assisted and image-based dietary assessment methods. Proc Nutr Soc. (2017) 76:283–94. doi: 10.1017/S0029665116002913
18. Hossin, M, and Sulaiman, MN. A review on evaluation metrics for data classification evaluations. Int J Data Min Knowl Manage Process. (2015) 5:01–11. doi: 10.5121/ijdkp.2015.5201
19. Wang, L, Allman-Farinelli, M, Yang, JA, Taylor, JC, Gemming, L, Hekler, E, et al. Enhancing nutrition care through real-time, sensor-based capture of eating occasions: a scoping review. Front Nutr. (2022) 9:852984. doi: 10.3389/fnut.2022.852984
20. Walker, JL, Ardouin, S, and Burrows, T. The validity of dietary assessment methods to accurately measure energy intake in children and adolescents who are overweight or obese: a systematic review. Eur J Clin Nutr. (2018) 72:185–97. doi: 10.1038/s41430-017-0029-2
21. Burrows, TL, Martin, RJ, and Collins, CE. A systematic review of the validity of dietary assessment methods in children when compared with the method of doubly labeled water. J Am Diet Assoc. (2010) 110:1501–10. doi: 10.1016/j.jada.2010.07.008
22. Fialkowski, MK, Kai, J, Young, C, Langfelder, G, Ng-Osorio, J, Shao, Z, et al. An active image-based Mobile food record is feasible for capturing eating occasions among infants ages 3–12 months old in Hawai ‘i. Nutrients. (2022) 14:1075. doi: 10.3390/nu14051075
23. Johansson, U, Venables, M, Öhlund, I, and Lind, T. Active image-assisted food records in comparison to regular food records: a validation study against doubly labeled water in 12-month-old infants. Nutrients. (2018) 10:1904. doi: 10.3390/nu10121904
24. Wang, JS, Hsieh, RH, Tung, YT, Chen, YH, Yang, C, and Chen, YC. Evaluation of a technological image-based dietary assessment tool for children during pubertal growth: a pilot study. Nutrients. (2019) 11:2527. doi: 10.3390/nu11102527
25. Marcano-Olivier, M, Erjavec, M, Horne, PJ, Viktor, S, and Pearson, R. Measuring lunchtime consumption in school cafeterias: a validation study of the use of digital photography. Public Health Nutr. (2019) 22:1745–54. doi: 10.1017/S136898001900048X
26. Folson, GK, Bannerman, B, Atadze, V, Ador, G, Kolt, B, McCloskey, P, et al. Validation of mobile artificial intelligence technology–assisted dietary assessment tool against weighed records and 24-hour recall in adolescent females in Ghana. J Nutr. (2023) 153:2328–38. doi: 10.1016/j.tjnut.2023.06.001
27. Ptomey, LT, Willis, EA, Goetz, JR, Lee, J, Sullivan, DK, and Donnelly, JE. Digital photography improves estimates of dietary intake in adolescents with intellectual and developmental disabilities. Disabil Health J. (2015) 8:146–50. doi: 10.1016/j.dhjo.2014.08.011
28. Beltran, A, Dadabhoy, H, Ryan, C, Dholakia, R, Jia, W, Baranowski, J, et al. Dietary assessment with a wearable camera among children: feasibility and intercoder reliability. J Acad Nutr Diet. (2018) 118:2144–53. doi: 10.1016/j.jand.2018.05.013
29. Jobarteh, ML, McCrory, MA, Lo, B, Triantafyllidis, KK, Qiu, J, Griffin, JP, et al. Evaluation of acceptability, functionality, and validity of a passive image-based dietary intake assessment method in adults and children of Ghanaian and Kenyan origin living in London, UK. Nutrients. (2023) 15:4075. doi: 10.3390/nu15184075
30. Zhou, Q, Wang, D, Mhurchu, CN, Gurrin, C, Zhou, J, Cheng, Y, et al. The use of wearable cameras in assessing children's dietary intake and behaviours in China. Appetite. (2019) 139:1–7. doi: 10.1016/j.appet.2019.03.032
31. Raber, M, Patterson, M, Jia, W, Sun, M, and Baranowski, T. Utility of eButton images for identifying food preparation behaviors and meal-related tasks in adolescents. Nutr J. (2018) 17:1–10. doi: 10.1186/s12937-018-0341-2
32. Veatupu, L, Puloka, V, Smith, M, McKerchar, C, and Signal, L. Me’akai in Tonga: exploring the nature and context of the food Tongan children eat in Ha’apai using wearable cameras. Int J Environ Res Public Health. (2019) 16:1681. doi: 10.3390/ijerph16101681
33. Kamar, M, Charlotte, E, and Siobhan, H-J. Factors influencing British adolescents’ intake of whole grains: a pilot feasibility study using sensecam assisted interviews. Nutrients. (2019) 11:2620. doi: 10.3390/nu11112620
34. Braga, BC, Nguyen, PH, Tran, LM, Hoang, NT, Bannerman, B, Doyle, F, et al. Feasibility of using an artificial intelligence-based telephone application for dietary assessment and nudging to improve the quality of food choices of female adolescents in Vietnam: evidence from a randomized pilot study. Curr Dev Nutr. (2024) 8:102063. doi: 10.1016/j.cdnut.2023.102063
35. Nguyen, PH, Tran, LM, Hoang, NT, Trương, DTT, Tran, THT, Huynh, PN, et al. Relative validity of a mobile AI-technology–assisted dietary assessment in adolescent females in Vietnam. Am J Clin Nutr. (2022) 116:992–1001. doi: 10.1093/ajcn/nqac216
36. Serra, M, Alceste, D, Hauser, F, Hulshof, PJ, Meijer, HA, Thalheimer, A, et al. Assessing daily energy intake in adult women: validity of a food-recognition mobile application compared to doubly labelled water. Front Nutr. (2023) 10:1255499. doi: 10.3389/fnut.2023.1255499
37. Ashman, AM, Collins, CE, Brown, LJ, Rae, KM, and Rollo, ME. Validation of a smartphone image-based dietary assessment method for pregnant women. Nutrients. (2017) 9:73. doi: 10.3390/nu9010073
38. Ding, Y, Lu, X, Xie, Z, Jiang, T, Song, C, and Wang, Z. Evaluation of a novel WeChat applet for image-based dietary assessment among pregnant women in China. Nutrients. (2021) 13:3158. doi: 10.3390/nu13093158
39. McCloskey, ML, Johnson, SL, Bekelman, TA, Martin, CK, and Bellows, LL. Beyond nutrient intake: use of digital food photography methodology to examine family dinnertime. J Nutr Educ Behav. (2019) 51:547–555.e1. doi: 10.1016/j.jneb.2019.01.020
40. Bulungu, AL, Palla, L, Priebe, J, Forsythe, L, Katic, P, Varley, G, et al. Validation of a life-logging wearable camera method and the 24-h diet recall method for assessing maternal and child dietary diversity. Br J Nutr. (2021) 125:1299–309. doi: 10.1017/S0007114520003530
41. Bulungu, AL, Palla, L, Nambooze, J, Priebe, J, Forsythe, L, Katic, P, et al. Automated wearable cameras for improving recall of diet and time use in Uganda: a cross-sectional feasibility study. Nutr J. (2023) 22:7. doi: 10.1186/s12937-022-00828-3
42. Locks, LM, Shah, M, Bhaise, S, Hibberd, PL, and Patel, A. Assessing the diets of young children and adolescents in India: challenges and opportunities. Front Pediatr. (2022) 10:725812. doi: 10.3389/fped.2022.725812
43. Kant, AK, and Graubard, BI. 40-year trends in meal and snack eating behaviors of American adults. J Acad Nutr Diet. (2015) 115:50–63. doi: 10.1016/j.jand.2014.06.354
44. Poobalan, AS, Aucott, LS, Clarke, A, and Smith, WCS. Diet behaviour among young people in transition to adulthood (18–25 year olds): a mixed method study. Health Psychol Behav Med Open Access J. (2014) 2:909–28. doi: 10.1080/21642850.2014.931232
45. Larke, JA, Chin, EL, Bouzid, YY, Nguyen, T, Vainberg, Y, Lee, DH, et al. Surveying nutrient assessment with photographs of meals (SNAPMe): a benchmark dataset of food photos for dietary assessment. Nutrients. (2023) 15:4972. doi: 10.3390/nu15234972
46. Lucassen, DA, Willemsen, RF, Geelen, A, Brouwer-Brolsma, EM, and Feskens, EJ. The accuracy of portion size estimation using food images and textual descriptions of portion sizes: an evaluation study. J Hum Nutr Diet. (2021) 34:945–52. doi: 10.1111/jhn.12878
47. Radtke, MD, Chodur, GM, Bissell, MC, Kemp, LC, Medici, V, Steinberg, FM, et al. Validation of diet ID™ in predicting nutrient intake compared to dietary recalls, skin carotenoid scores, and plasma carotenoids in university students. Nutrients. (2023) 15:409. doi: 10.3390/nu15020409
48. Chan, KS, and Chin, YS. Validity and acceptability of image-based food record in assessing nutrient intake among selected Malaysian undergraduates. Malay J Med Health Sci. (2020) 16.
49. Ji, Y, Plourde, H, Bouzo, V, Kilgour, RD, and Cohen, TR. Validity and usability of a smartphone image-based dietary assessment app compared to 3-day food diaries in assessing dietary intake among Canadian adults: randomized controlled trial. JMIR Mhealth Uhealth. (2020) 8:e16953. doi: 10.2196/16953
50. Naaman, R, Parrett, A, Bashawri, D, Campo, I, Fleming, K, Nichols, B, et al. Assessment of dietary intake using food photography and video recording in free-living young adults: a comparative study. J Acad Nutr Diet. (2021) 121:749–761.e1. doi: 10.1016/j.jand.2020.09.040
51. Papathanail, I, Abdur Rahman, L, Brigato, L, Bez, NS, Vasiloglou, MF, van der Horst, K, et al. The nutritional content of meal images in free-living conditions—automatic assessment with goFOODTM. Nutrients. (2023) 15:3835. doi: 10.3390/nu15173835
52. Qiu, J, Lo, FPW, Jiang, S, Tsai, YY, Sun, Y, and Lo, B. Counting bites and recognizing consumed food from videos for passive dietary monitoring. IEEE J Biomed Health Inform. (2020) 25:1471–82. doi: 10.1109/JBHI.2020.3022815
53. Tufano, M, Lasschuijt, MP, Chauhan, A, Feskens, EJ, and Camps, G. Rule-based systems to automatically count bites from meal videos. Front Nutr. (2024) 11:1343868. doi: 10.3389/fnut.2024.1343868
54. Kong, NA, Moy, FM, Ong, SH, Tahir, GA, and Loo, CK. MyDietCam: development and usability study of a food recognition integrated dietary monitoring smartphone application. Digit Health. (2023) 9:20552076221149320. doi: 10.1177/20552076221149320
55. Harray, AJ, Boushey, CJ, Pollard, CM, Panizza, CE, Delp, EJ, Dhaliwal, SS, et al. Perception v. actual intakes of junk food and sugar-sweetened beverages in Australian young adults: assessed using the mobile food record. Public Health Nutr. (2017) 20:2300–7. doi: 10.1017/S1368980017000702
56. Ziesemer, K, König, LM, Boushey, CJ, Villinger, K, Wahl, DR, Butscher, S, et al. Occurrence of and reasons for “missing events” in mobile dietary assessments: results from three event-based ecological momentary assessment studies. JMIR Mhealth Uhealth. (2020) 8:e15430. doi: 10.2196/15430
57. Papathanail, I, Vasiloglou, MF, Stathopoulou, T, Ghosh, A, Baumann, M, Faeh, D, et al. A feasibility study to assess Mediterranean diet adherence using an AI-powered system. Sci Rep. (2022) 12:17008. doi: 10.1038/s41598-022-21421-y
58. Roux de Bézieux, H, Bullard, J, Kolterman, O, Souza, M, and Perraudeau, F. Medical food assessment using a smartphone app with continuous glucose monitoring sensors: proof-of-concept study. JMIR Format Res. (2021) 5:e20175. doi: 10.2196/20175
59. Gemming, L, Rush, E, Maddison, R, Doherty, A, Gant, N, Utter, J, et al. Wearable cameras can reduce dietary under-reporting: doubly labelled water validation of a camera-assisted 24 h recall. Br J Nutr. (2015) 113:284–91. doi: 10.1017/S0007114514003602
60. Doulah, A, Ghosh, T, Delwar, H, Masudul, I, and Edward, S. “Automatic ingestion monitor version 2”–a novel wearable device for automatic food intake detection and passive capture of food images. IEEE J Biomed Health Inform. (2020) 25:568–76. doi: 10.1109/JBHI.2020.2995473
61. Farooq, M, and Sazonov, E. A novel wearable device for food intake and physical activity recognition. Sensors. (2016) 16:1067. doi: 10.3390/s16071067
62. Pan, Z, Forjan, D, Marden, T, Padia, J, Ghosh, T, Hossain, D, et al. Improvement of methodology for manual energy intake estimation from passive capture devices. Front Nutr. (2022) 9:877775. doi: 10.3389/fnut.2022.877775
63. Alshurafa, N, Zhang, S, Romano, C, Zhang, H, Pfammatter, AF, and Lin, AW. Association of number of bites and eating speed with energy intake: wearable technology results under free-living conditions. Appetite. (2021) 167:105653. doi: 10.1016/j.appet.2021.105653
64. Shen, Y, Salley, J, Muth, E, and Hoover, A. Assessing the accuracy of a wrist motion tracking method for counting bites across demographic and food variables. IEEE J Biomed Health Inform. (2016) 21:599–606. doi: 10.1109/JBHI.2016.2612580
65. Wang, L, Chan, V, Allman-Farinelli, M, Davies, A, Wellard-Cole, L, and Rangan, A. Wearable cameras reveal large intra-individual variability in timing of eating among young adults. Nutrients. (2022) 14:4349. doi: 10.3390/nu14204349
66. Lorenzoni, G, Bottigliengo, D, Azzolina, D, and Gregori, D. Food composition impacts the accuracy of wearable devices when estimating energy intake from energy-dense food. Nutrients. (2019) 11:1170. doi: 10.3390/nu11051170
67. Chou, T, Hoover, AW, Goldstein, SP, Greco-Henderson, D, Martin, CK, Raynor, HA, et al. An explanation for the accuracy of sensor-based measures of energy intake: amount of food consumed matters more than dietary composition. Appetite. (2024) 194:107176. doi: 10.1016/j.appet.2023.107176
68. Pettitt, C, Liu, J, Kwasnicki, RM, Yang, GZ, Preston, T, and Frost, G. A pilot study to determine whether using a lightweight, wearable micro-camera improves dietary assessment accuracy and offers information on macronutrients and eating rate. Br J Nutr. (2016) 115:160–7. doi: 10.1017/S0007114515004262
69. Dimitratos, SM, German, JB, and Schaefer, SE. Wearable technology to quantify the nutritional intake of adults: validation study. JMIR Mhealth Uhealth. (2020) 8:e16405. doi: 10.2196/16405
70. Taylor, S, Korpusik, M, Das, S, Gilhooly, C, Simpson, R, Glass, J, et al. Use of natural spoken language with automated mapping of self-reported food intake to food composition data for low-burden real-time dietary assessment: method comparison study. J Med Internet Res. (2021) 23:e26988. doi: 10.2196/26988
71. Chan, V, Davies, A, Wellard-Cole, L, Lu, S, Ng, H, Tsoi, L, et al. Using wearable cameras to assess foods and beverages omitted in 24 hour dietary recalls and a text entry food record app. Nutrients. (2021) 13:1806. doi: 10.3390/nu13061806
72. Scott, JL, Vijayakumar, A, Woodside, JV, and Neville, CE. Feasibility of wearable camera use to improve the accuracy of dietary assessment among adults. J Nutr Sci. (2022) 11:e85. doi: 10.1017/jns.2022.81
73. Ofei, KT, Mikkelsen, BE, and Scheller, RA. Validation of a novel image-weighed technique for monitoring food intake and estimation of portion size in hospital settings: a pilot study. Public Health Nutr. (2019) 22:1203–8. doi: 10.1017/S1368980018001064
74. Papathanail, I, Brühlmann, J, Vasiloglou, MF, Stathopoulou, T, Exadaktylos, AK, Stanga, Z, et al. Evaluation of a novel artificial intelligence system to monitor and assess energy and macronutrient intake in hospitalised older patients. Nutrients. (2021) 13:4539. doi: 10.3390/nu13124539
75. Van Wymelbeke-Delannoy, V, Juhel, C, Bole, H, Sow, AK, Guyot, C, Belbaghdadi, F, et al. A cross-sectional reproducibility study of a standard camera sensor using artificial intelligence to assess food items: the Foodintech project. Nutrients. (2022) 14:221. doi: 10.3390/nu14010221
76. Honda, M, Muhammad, W, Kazumichi, Y, and Akiko, Y. A feasibility study for smartphone application to evaluate dietary realities after gastrointestinal surgery. Ann Cancer Res Therapy. (2022) 30:33–7. doi: 10.4993/acrt.30.33
77. Ryu, J, Kim, S, Lim, Y, Ohn, JH, Kim, SW, Cho, JH, et al. Sodium intake estimation in hospital patients using AI-based imaging: prospective pilot study. JMIR Format Res. (2024) 8:e48690. doi: 10.2196/48690
78. Moyen, A, Rappaport, AI, Fleurent-Grégoire, C, Tessier, AJ, Brazeau, AS, and Chevalier, S. Relative validation of an artificial intelligence–enhanced, image-assisted mobile app for dietary assessment in adults: randomized crossover study. J Med Internet Res. (2022) 24:e40449. doi: 10.2196/40449
79. Makhsous, S, Bharadwaj, M, Atkinson, BE, Novosselov, IV, and Mamishev, AV. Dietsensor: automatic dietary intake measurement using mobile 3D scanning sensor for diabetic patients. Sensors. (2020) 20:3380. doi: 10.3390/s20123380
80. Heikkilä, L, Vanhala, M, Korpelainen, R, and Tossavainen, P. Agreement between an image-based dietary assessment method and a written food diary among adolescents with type 1 diabetes. Nutrients. (2021) 13:1319. doi: 10.3390/nu13041319
81. Rhyner, D, Loher, H, Dehais, J, Anthimopoulos, M, Shevchik, S, Botwey, RH, et al. Carbohydrate estimation by a mobile phone-based system versus self-estimations of individuals with type 1 diabetes mellitus: a comparative study. J Med Internet Res. (2016) 18:e101. doi: 10.2196/jmir.5567
82. Vasiloglou, MF, Mougiakakou, S, Aubry, E, Bokelmann, A, Fricker, R, Gomes, F, et al. A comparative study on carbohydrate estimation: GoCARB vs. dietitians. Nutrients. (2018) 10:741. doi: 10.3390/nu10060741
83. Kerr, DA, Dhaliwal, SS, Pollard, CM, Norman, R, Wright, JL, Harray, AJ, et al. BMI is associated with the willingness to record diet with a mobile food record among adults participating in dietary interventions. Nutrients. (2017) 9:244. doi: 10.3390/nu9030244
84. Borges, TLD, de Lima, MFS, Lima, SCVC, and Bagni, UV. Accuracy of dietary intake assessments using food records based on photographic images captured by visually impaired people. PLoS One. (2023) 18:e0280725. doi: 10.1371/journal.pone.0280725
85. Murphy, J, Holmes, J, and Brooks, C. Measurements of daily energy intake and total energy expenditure in people with dementia in care homes: the use of wearable technology. J Nutr Health Aging. (2017) 21:927–32. doi: 10.1007/s12603-017-0870-y
86. Turner-McGrievy, GM, Wilcox, S, Boutté, A, Hutto, BE, Singletary, C, Muth, ER, et al. The dietary intervention to enhance tracking with mobile devices (DIET mobile) study: a 6-month randomized weight loss trial. Obesity. (2017) 25:1336–42. doi: 10.1002/oby.21889
87. Bell, BM, Alam, R, Mondol, AS, Ma, M, Emi, IA, Preum, SM, et al. Validity and feasibility of the monitoring and modeling family eating dynamics system to automatically detect in-field family eating behavior: observational study. JMIR Mhealth Uhealth. (2022) 10:e30211. doi: 10.2196/30211
Keywords: artificial intelligence, dietary assessments, mobile applications, machine learning, tele-nutrition, food image analysis, wearables
Citation: Phalle A and Gokhale D (2025) Navigating next-gen nutrition care using artificial intelligence-assisted dietary assessment tools—a scoping review of potential applications. Front. Nutr. 12:1518466. doi: 10.3389/fnut.2025.1518466
Edited by:
Guangming Zhang, University of Texas Health Science Center at Houston, United StatesReviewed by:
Basil H. Aboul-Enein, University of Massachusetts Dartmouth, United StatesAnna Kiss, University of Szeged, Hungary
Mingzhu Cai, Imperial College London, United Kingdom
Copyright © 2025 Phalle and Gokhale. This is an open-access article distributed under the terms of the Creative Commons Attribution License (CC BY). The use, distribution or reproduction in other forums is permitted, provided the original author(s) and the copyright owner(s) are credited and that the original publication in this journal is cited, in accordance with accepted academic practice. No use, distribution or reproduction is permitted which does not comply with these terms.
*Correspondence: Devaki Gokhale, YXNzdHByb2ZuZDJAc3NjYS5lZHUuaW4=
†These authors share first authorship