 Yunfei Xiao
 Yaqing Yang
 Shunyu Gao1
 Jia Wang
 Yunjin Bai
- 1Department of Urology, Institute of Urology, West China Hospital, Sichuan University, Chengdu, China
- 2Organ Transplantation Center, West China Hospital, Sichuan University, Chengdu, Sichuan, China
- 3Department of Respiratory and Critical Care Medicine, West China Hospital, Sichuan University, Chengdu, China
Introduction: This study explore the association between the dietary index for gut microbiota (DI-GM) and the prevalence of chronic kidney disease (CKD).
Method: A cross-sectional study of participants aged ≥20 years using the data drawn from NHANES (2007–2018). DI-GM is comprised 14 dietary components (10 beneficial and 4 unfavorable). CKD diagnosis based on urine albumin-to-creatinine ratio (uACR) and estimated glomerular filtration rate (eGFR). Logistic regression models were employed to evaluate the relationship between DI-GM and CKD while controlling for various covariates. Additionally, a spline smooth analysis was performed. Subgroup and interaction analyses were conducted to investigate whether any factors modified this relationship.
Results: A total of 28,843 participants were eligible for the study, of whom 5,461 were diagnosed with CKD, while 23,382 were not. Patients with CKD exhibited significantly lower DI-GM scores compared to healthy individuals. A negative association between DI-GM and the prevalence of CKD was observed across all models, with the relationship being more pronounced in individuals with DI-GM scores greater than 5 compared to those with scores ≤3. Beneficial components, such as dietary fiber, whole grains, and coffee, were identified as protective factors. Moreover, sex make an effect on this relationship, with stronger effects noted in women.
Conclusion: Higher DI-GM scores correlate with reduced CKD prevalence, and the effect appears to be more pronounced in women than in men. These findings suggest that enhancing gut health through diet may serve as a viable strategy for the prevention and management of CKD, with particular attention to sex-based differences in prevention.
1 Introduction
Chronic kidney disease (CKD) is a long-term condition characterized by progressive renal dysfunction, leading to impaired filtration and waste elimination. CKD frequently progresses to complications such as cardiovascular disease, anemia, and bone disorders, and may ultimately necessitate dialysis or transplantation. Globally, CKD affects over 850 million people and is projected to become the fifth leading cause of death by 2040 (1). The primary risk factors for CKD include diabetes, hypertension, obesity, and aging (2). Recent studies have highlighted the role of gut dysbiosis in CKD, as it exacerbates systemic inflammation, promotes insulin resistance, and generates uremic toxins like indoxyl sulfate and p-cresyl sulfate (3, 4). These toxins contribute to further kidney damage and cardiovascular complications, highlighting the connection between gut health and CKD progression (5, 6). Consequently, the gut microbiome is increasingly recognized as a potential therapeutic target in the management of CKD.
The dietary index for gut microbiota (DI-GM) is a novel metric designed to assess the impact of diet on the diversity of gut microbiota. This comprehensive index was developed through a review of 106 articles that investigated the association between diet and gut microbiota in adults. The DI-GM encompasses 14 dietary components, with beneficial components such as fermented dairy, whole grains, fiber, and specific fruits and vegetables, and unfavorable components like red and processed meats, refined grains, and high-fat diets (7, 8). This index serves as a standardized tool for evaluating dietary patterns that promote or hinder gut microbiota health. Research indicates that diet affecting gut microbiota diversity can influence systemic health, particularly concerning metabolic conditions such as diabetes and cardiovascular diseases (9, 10). Given the established roles of metabolic disturbances and gut dysbiosis in kidney disease, understanding whether DI-GM correlates with CKD prevalence is essential for developing dietary interventions aimed at preserving renal function. Despite the growing body of evidence linking diet, gut microbiota, and chronic diseases, there is a notable scarcity of research exploring the relationship between DI-GM and CKD. This study aims to investigate the association between the DI-GM and the prevalence of CKD, hypothesizing that higher DI-GM scores, indicative of a gut-friendly diet, are associated with a lower prevalence of CKD. The urgency of this research is emphasized by the global rise in CKD incidence, which is significantly influenced by lifestyle factors, including poor dietary habits and metabolic health. By examining this relationship within a cross-sectional adult population, the study aims to provide insights into how dietary strategies targeting gut microbiota may help mitigate the risk and progression of CKD.
2 Method
2.1 Study design and population
The data utilized in this research was obtained from the National Health and Nutrition Examination Survey (NHANES) database, which covers the period from 2007 to 2018. NHANES is a comprehensive, nationally representative survey designed to investigate the dietary patterns and health of individuals residing in the United States. Data were collected through structured interviews, physical evaluations, and laboratory tests, employing a multistage probability sampling technique. The primary objective is to accurately represent the demographics of the U.S. population, with stringent measures implemented during the data collection process to ensure the confidentiality and privacy of participants. The initial sample, collected over six consecutive cycles, comprised 59,842 individuals. First, individuals under 20 years of age were excluded from the sample (n = 34,770). Next, pregnant individuals were also removed (n = 372). Additionally, individuals with missing information regarding CKD diagnoses (n = 3,468) and DI-GM (n = 2,087) were excluded. Ultimately, 28,843 adults were included in the analysis, as detailed in Supplementary Figure S1.
All NHANES study protocols received approval from the Ethics Review Committee of the NCHS, and informed consent was obtained from all participants.
2.2 The dietary index for gut microbiota
The DI-GM is a literature-based index developed to assess dietary patterns that influence gut microbiota composition (7). It encompasses a set of dietary components that either positively or negatively impact gut microbial diversity. This index was constructed using dietary recall data and consists of 14 food components, categorized into beneficial and unfavorable groups based on their effects on gut microbiota diversity (Supplementary Table S1) (8). Beneficial components include foods such as fermented dairy, whole grains, fiber, soybean, broccoli, avocados, cranberries, chickpeas, coffee, and green tea, all of which have been shown to promote a healthier gut microbiome. Conversely, red meat, processed meats, refined grains, and high-fat diets (defined as ≥40% of total energy from fat) are classified as unfavorable due to their association with dysbiosis. For beneficial food components, a score of 1 is assigned when intake meets or exceeds the sex-specific median, indicating sufficient consumption. If intake falls below this threshold, a score of 0 is assigned. For unfavorable components, the scoring is reversed: a score of 1 is assigned if intake is below the median or under 40% of daily energy for high-fat diets, while a score of 0 is given. The total DI-GM score ranges from 0 to 14, with higher scores indicating diets that are more supportive of gut microbiota health. Participants are categorized into four subgroups based on the total score: (1) 0–3 points, (2) 4 points, (3) 5 points, and (4) ≥6 points.
2.3 Diagnosis of chronic kidney diseases
In this study, CKD was diagnosed based on the patient’s urine albumin-to-creatinine ratio (uACR) and estimated glomerular filtration rate (eGFR) (11). The uACR was categorized into three levels: A1 (<30 mg/g), A2 (30–300 mg/g), and A3 (>300 mg/g), while the eGFR was classified into six levels: G1 (≥90 mL/min/1.73 m2), G2 (60–89 mL/min/1.73 m2), G3a (45–59 mL/min/1.73 m2), G3b (30–44 mL/min/1.73 m2), G4 (15–29 mL/min/1.73 m2), and G5 (<15 mL/min/1.73 m2). Based on the combination of uACR and eGFR, CKD prognosis was stratified into four risk categories: (1) Low Risk: uACR <30 mg/g (A1) with eGFR ≥60 mL/min/1.73 m2 (G1 or G2), indicating minimal risk of kidney damage; (2) Moderate Risk: uACR <30 mg/g (A1) with eGFR 45–59 mL/min/1.73 m2 (G3a), or uACR 30–300 mg/g (A2) with eGFR ≥60 mL/min/1.73 m2, suggesting a moderate risk of kidney damage; (3) High Risk: uACR <30 mg/g (A1) with eGFR 30–44 mL/min/1.73 m2 (G3b), or uACR 30–300 mg/g (A2) with eGFR 45–59 mL/min/1.73 m2, or uACR >300 mg/g (A3) with eGFR ≥60 mL/min/1.73 m2, indicating significant kidney damage; (4) Very High Risk: eGFR <30 mL/min/1.73 m2, or uACR >30 mg/g with eGFR 30–59 mL/min/1.73 m2, indicating severe kidney damage and a poor prognosis. This stratification facilitates a precise assessment of CKD prognosis, confirming a diagnosis of CKD (‘yes’) for moderate or higher risk categories.
2.4 Covariates
The continuous variables included age, poverty income ratio (PIR, a ratio of family income to poverty threshold), and body mass index (BMI). The categorical variables encompassed sex, race, education, marital status, smoking status (never, former, or current), alcohol consumption (never, former, or current), diabetes, cardiovascular diseases (CVD), hypertension (HBP), cancer, vigorous activity, and moderate activity (all classified as yes/no). Specifically, age was categorized into the intervals of 20–34, 35–49, 50–64, and ≥ 65 years, while racial categories included Mexican American, other Hispanic, Non-Hispanic Black, non-Hispanic White, and other races. Participants were classified based on BMI into the following groups: <25, ≥25 & <30, and ≥ 30 kg/m2.
2.5 Statistical analysis
The baseline characteristics of all participants were presented using means ± standard deviations (SD) and proportions. Specifically, continuous variables were evaluated using a linear regression model, while categorical variables were analyzed using chi-square tests. To identify independent risk factors associated with CKD, logistic regression analyses were conducted. Participants were categorized into four groups based on the DI-GM, and three logistic regression models were developed to investigate the relationship between DI-GM and CKD. Furthermore, to assess the association between the components of DI-GM and the prevalence of CKD among adults, three additional logistic regression models were employed. In the unadjusted model, no variables were modified. The minimally adjusted model controlled for age, sex, race, PIR, BMI, marital status, and education. The fully adjusted model further included smoking habits, alcohol consumption, HBP, diabetes, CVD, cancer, vigorous activity, and moderate activity. Additionally, spline smoothing using a generalized additive model (GAM) was performed to illustrate whether a linear relationship between DI-GM and CKD present in the fully adjusted model. To further investigate whether any factors could influence the association between these two variables, interaction and subgroup analyses were conducted.
Moreover, sensitivity analyses of multivariable logistic regression were performed. The DI-GM was based on dietary information collected from a day-two recall. All statistical analyses were conducted using R version 4.2.2 (the R Foundation)1 and EmpowerStats (X&Y Solutions, Inc.).2 A p-value of less than 0.05 was considered statistically significant.
3 Results
3.1 Baseline characteristics of study participants
A total of 28,843 individuals were enrolled in the NHANES study from 2007 to 2018, among which 5,461 participants were diagnosed with CKD while 23,382 were not. As presented in Table 1, individuals with CKD exhibited a higher unfavorable to gut microbiota score (2.71 ± 1.07) and a lower DI-GM (4.54 ± 1.61) and beneficial to gut microbiota score (1.83 ± 1.32) compared to those without CKD. In comparison to healthy participants, those with CKD were older (63.07 ± 16.15 years), with a significant proportion aged ≥65 years (55.01%), and had a higher BMI (30.27 ± 7.33) with 45.50% classified as obese (≥30 kg/m2). Additionally, the proportion of females (52.10%), individuals with low education levels (less than college, 44.79%), smokers (49.59%), and those with diabetes (50.25%), HBP (72.77%), CVD (27.63%), and cancer (17.92%) was higher among CKD patients compared to those without. Conversely, participants with CKD had a lower PIR (2.26 ± 1.51 vs. 2.56 ± 1.64) and were less likely to be in non-single living situations (married/living with a partner, 53.98%), engage in moderate physical activity (29.88%), vigorous activity (13.50%), and consume alcohol (81.95%) when compared to healthy individuals. Regarding the components of the DI-GM, we observed that the scores for components beneficial to gut microbiota, such as avocado, broccoli, chickpeas, cranberries, fermented dairy, fiber, green tea, and soybeans, were predominantly lower in CKD patients, while the scores for components unfavorable to gut microbiota, specifically red meat and refined grains, were higher in this group (Supplementary Table S2 and Figure 1).
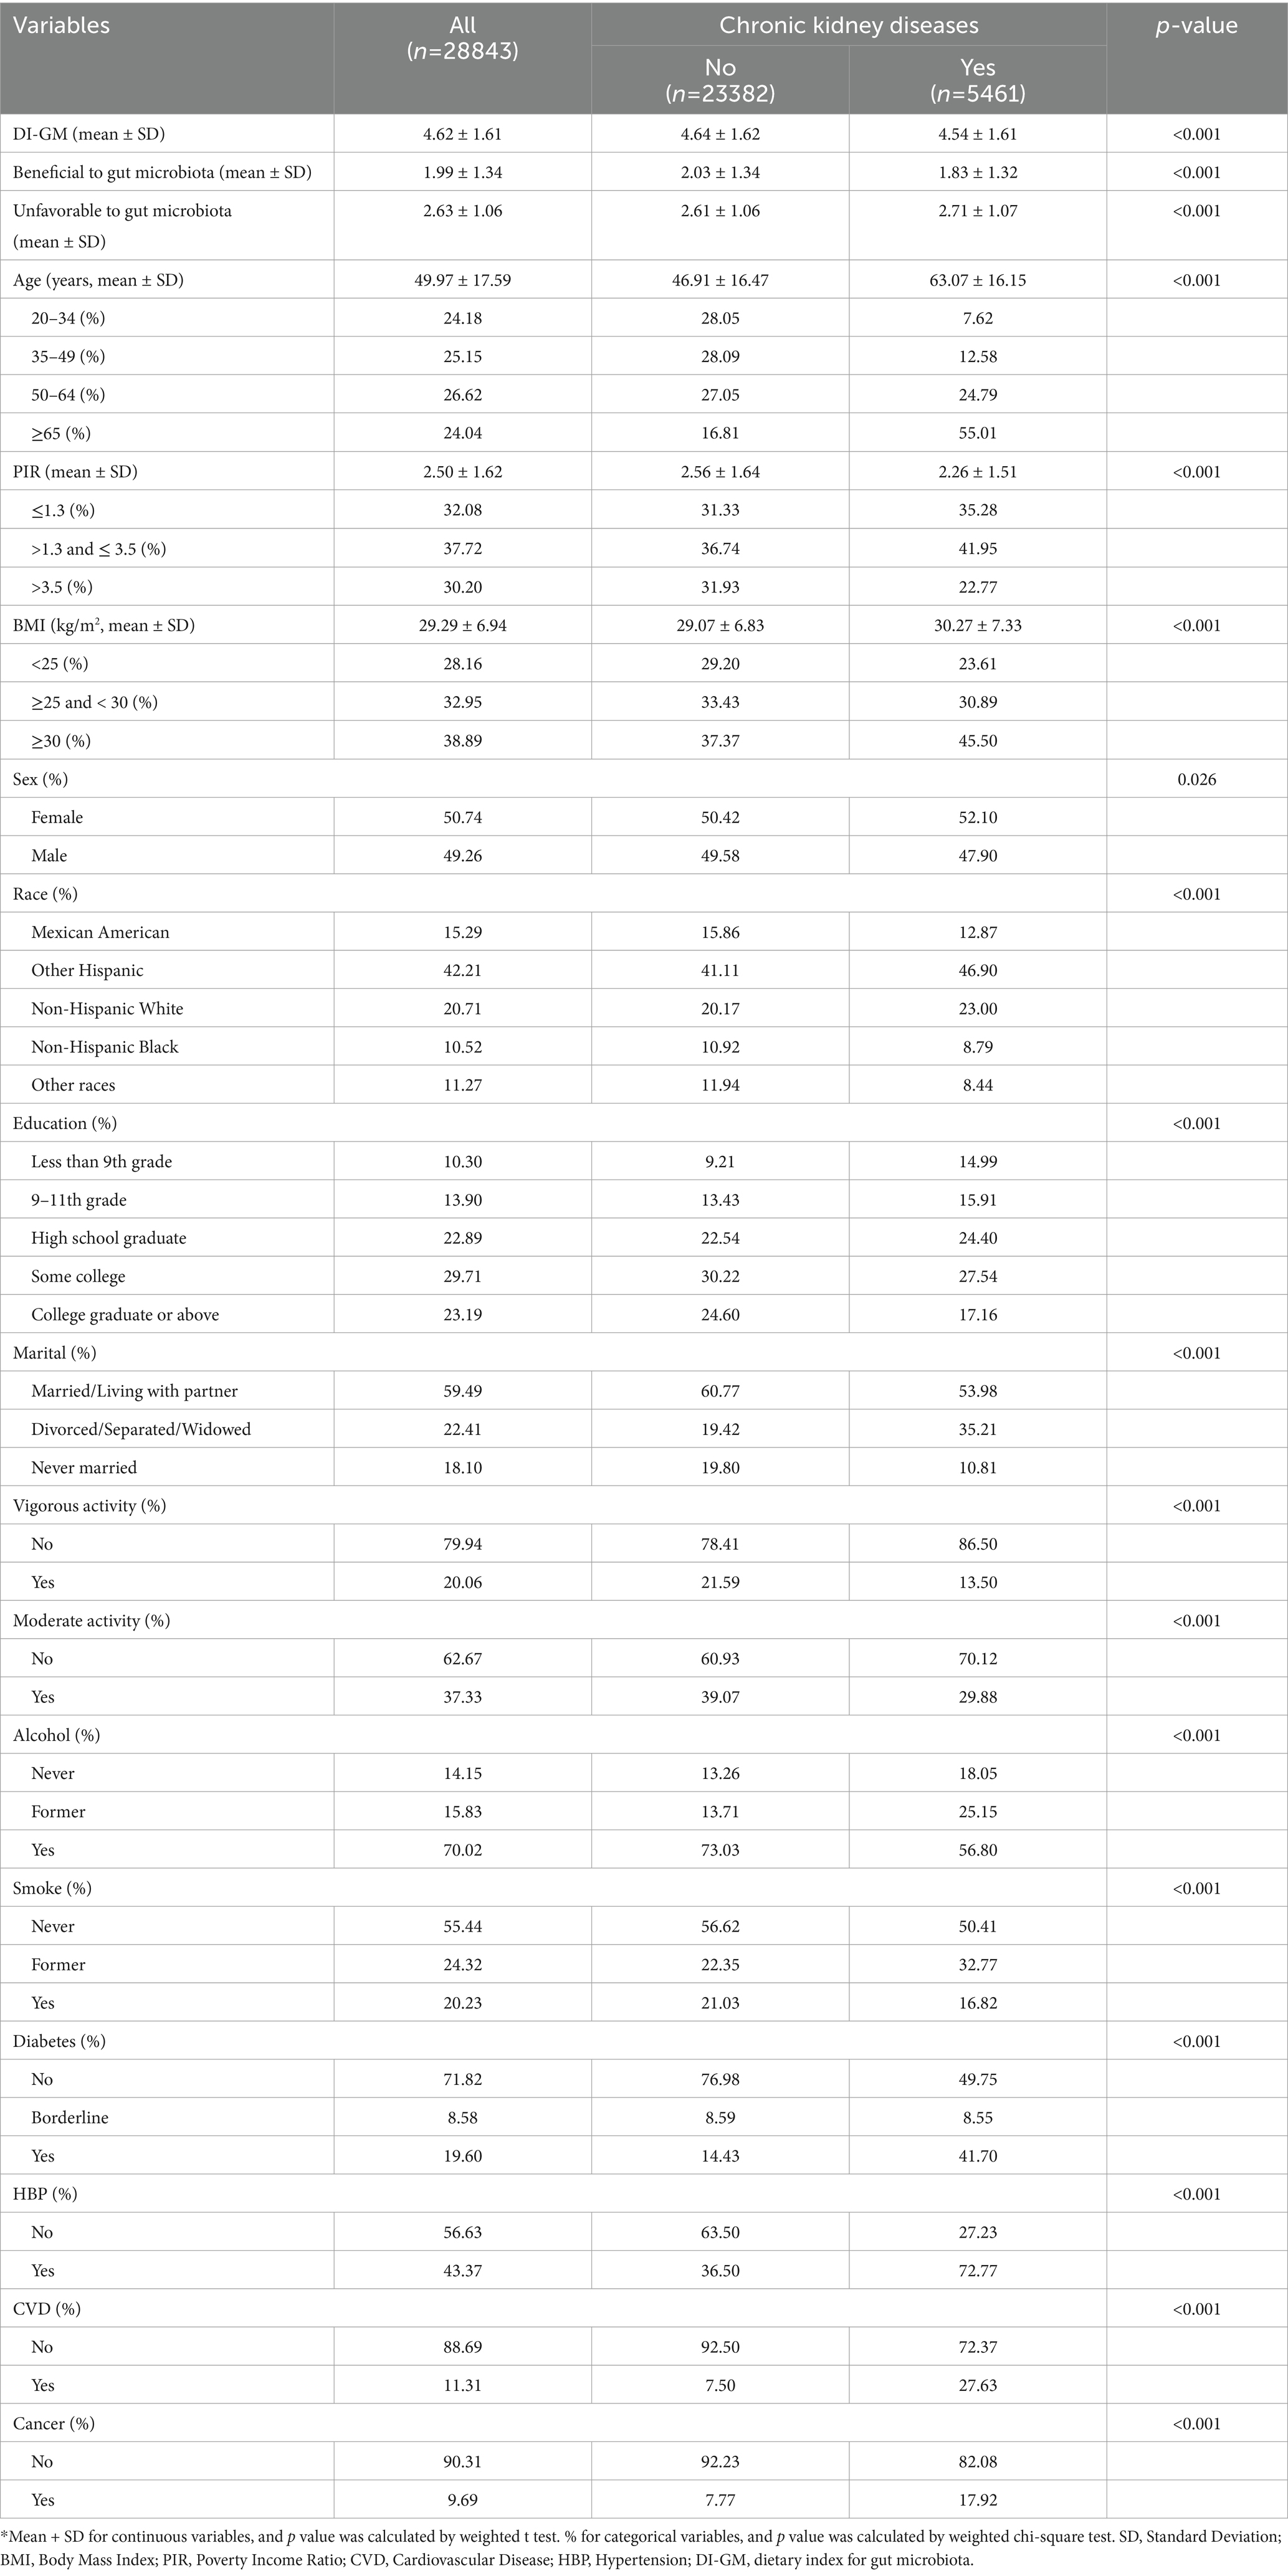
Table 1. Characteristics of participants by categories of Chronic kidney diseases: NHANES 2007–2018.*
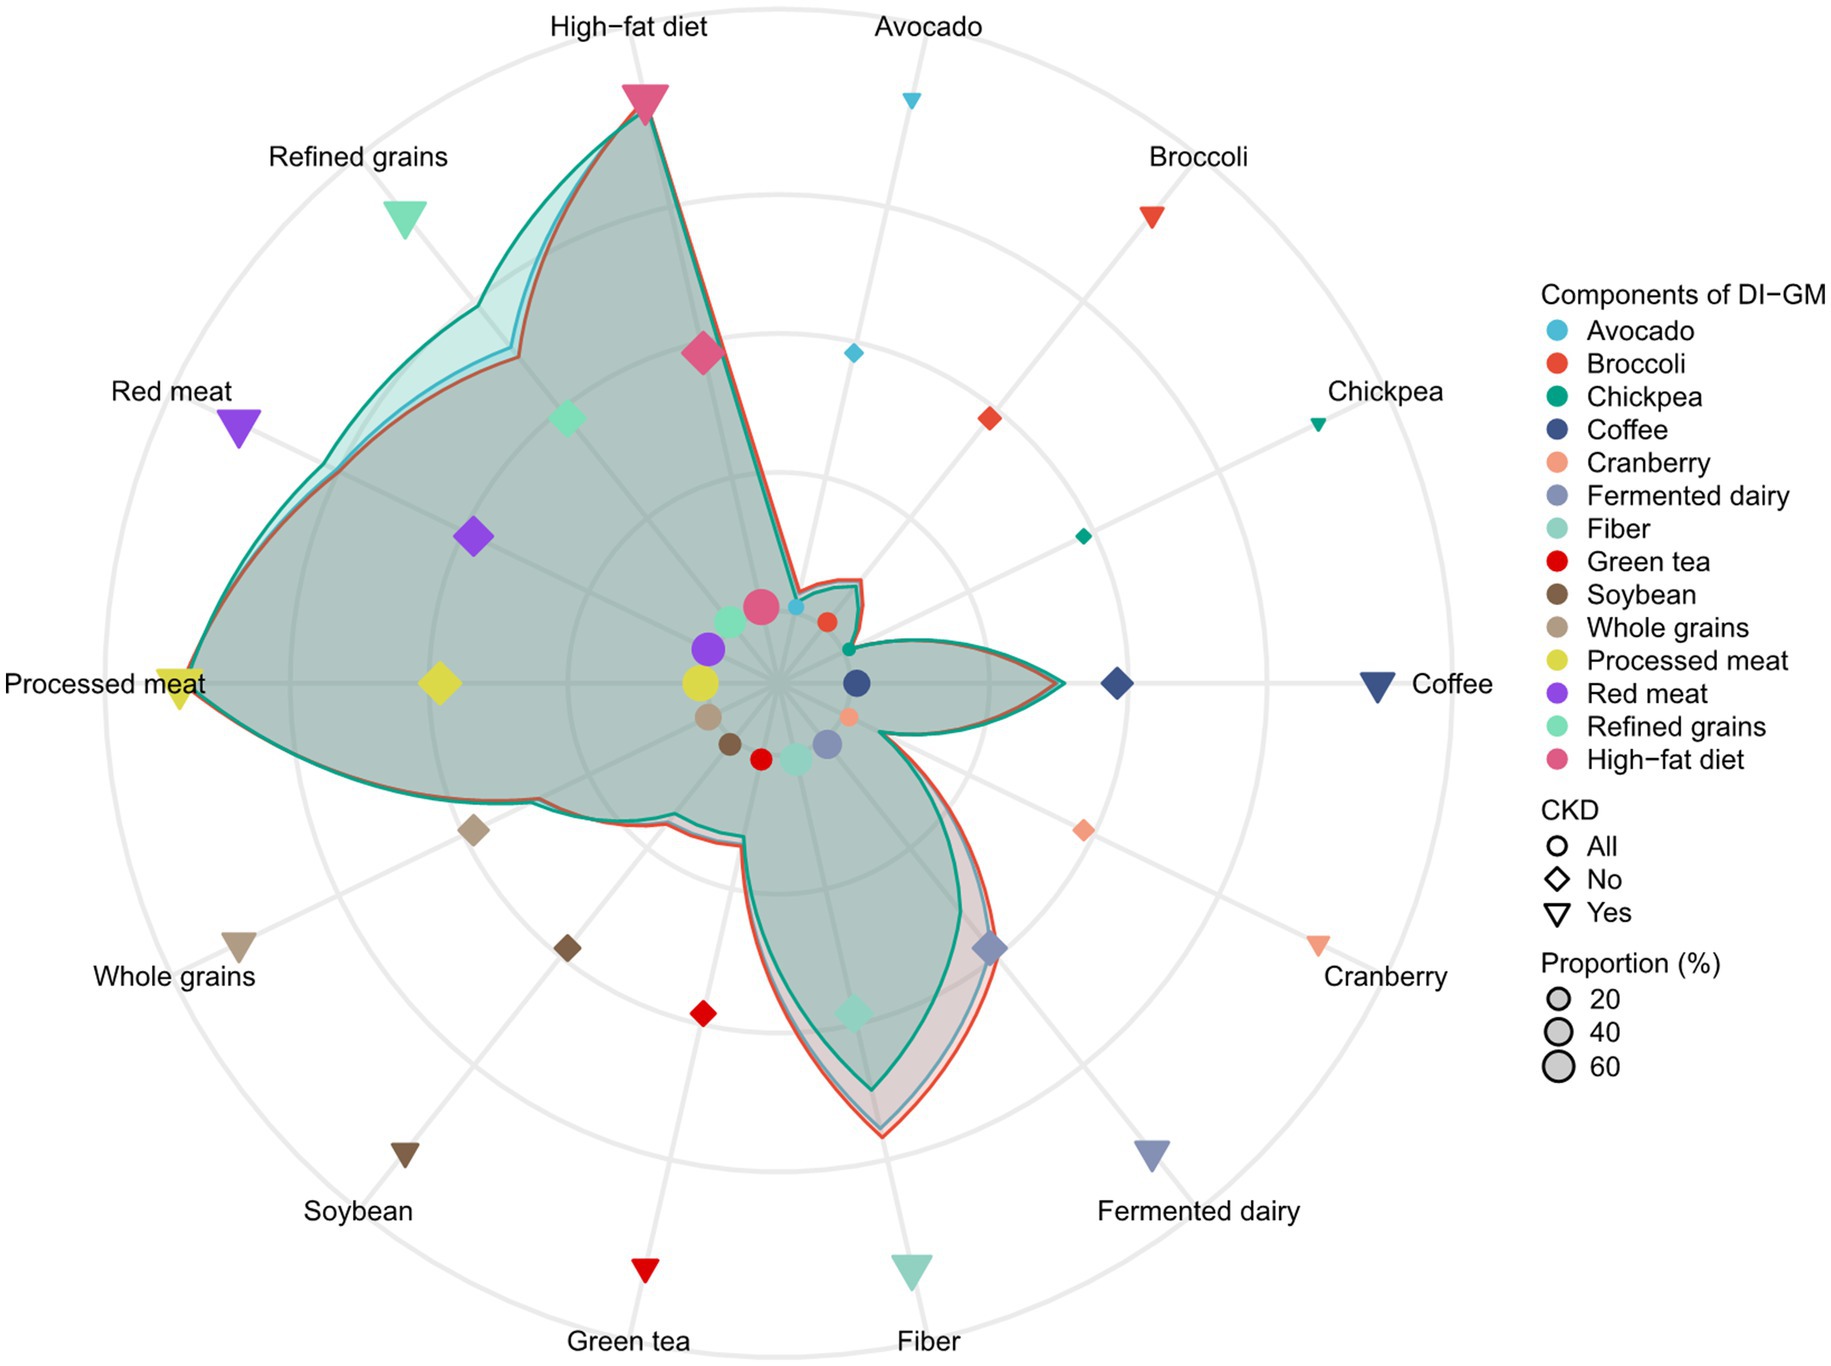
Figure 1. The distributions of dietary index for gut microbiota (DI-GM) components by categories of chronic kidney diseases (CKD).
3.2 Multivariable logistic regression
Table 2 demonstrates a negative association between DI-GM and the prevalence of CKD across all models. In the non-adjusted model, the odds ratio (OR) was 0.964 (95% CI, 0.946 to 0.982), in the minimally-adjusted model, it was 0.919 (95% CI, 0.901 to 0.937), and in the fully-adjusted model, the OR was 0.958 (95% CI, 0.936 to 0.980). Furthermore, individuals with a DI-GM score > 5 exhibited a significantly higher prevalence of CKD compared to those in the ≤3 score group (OR = 0.837, 95% CI, 0.754 to 0.928). Additionally, the P vale of trend test analyses was <0.5 in all three models.
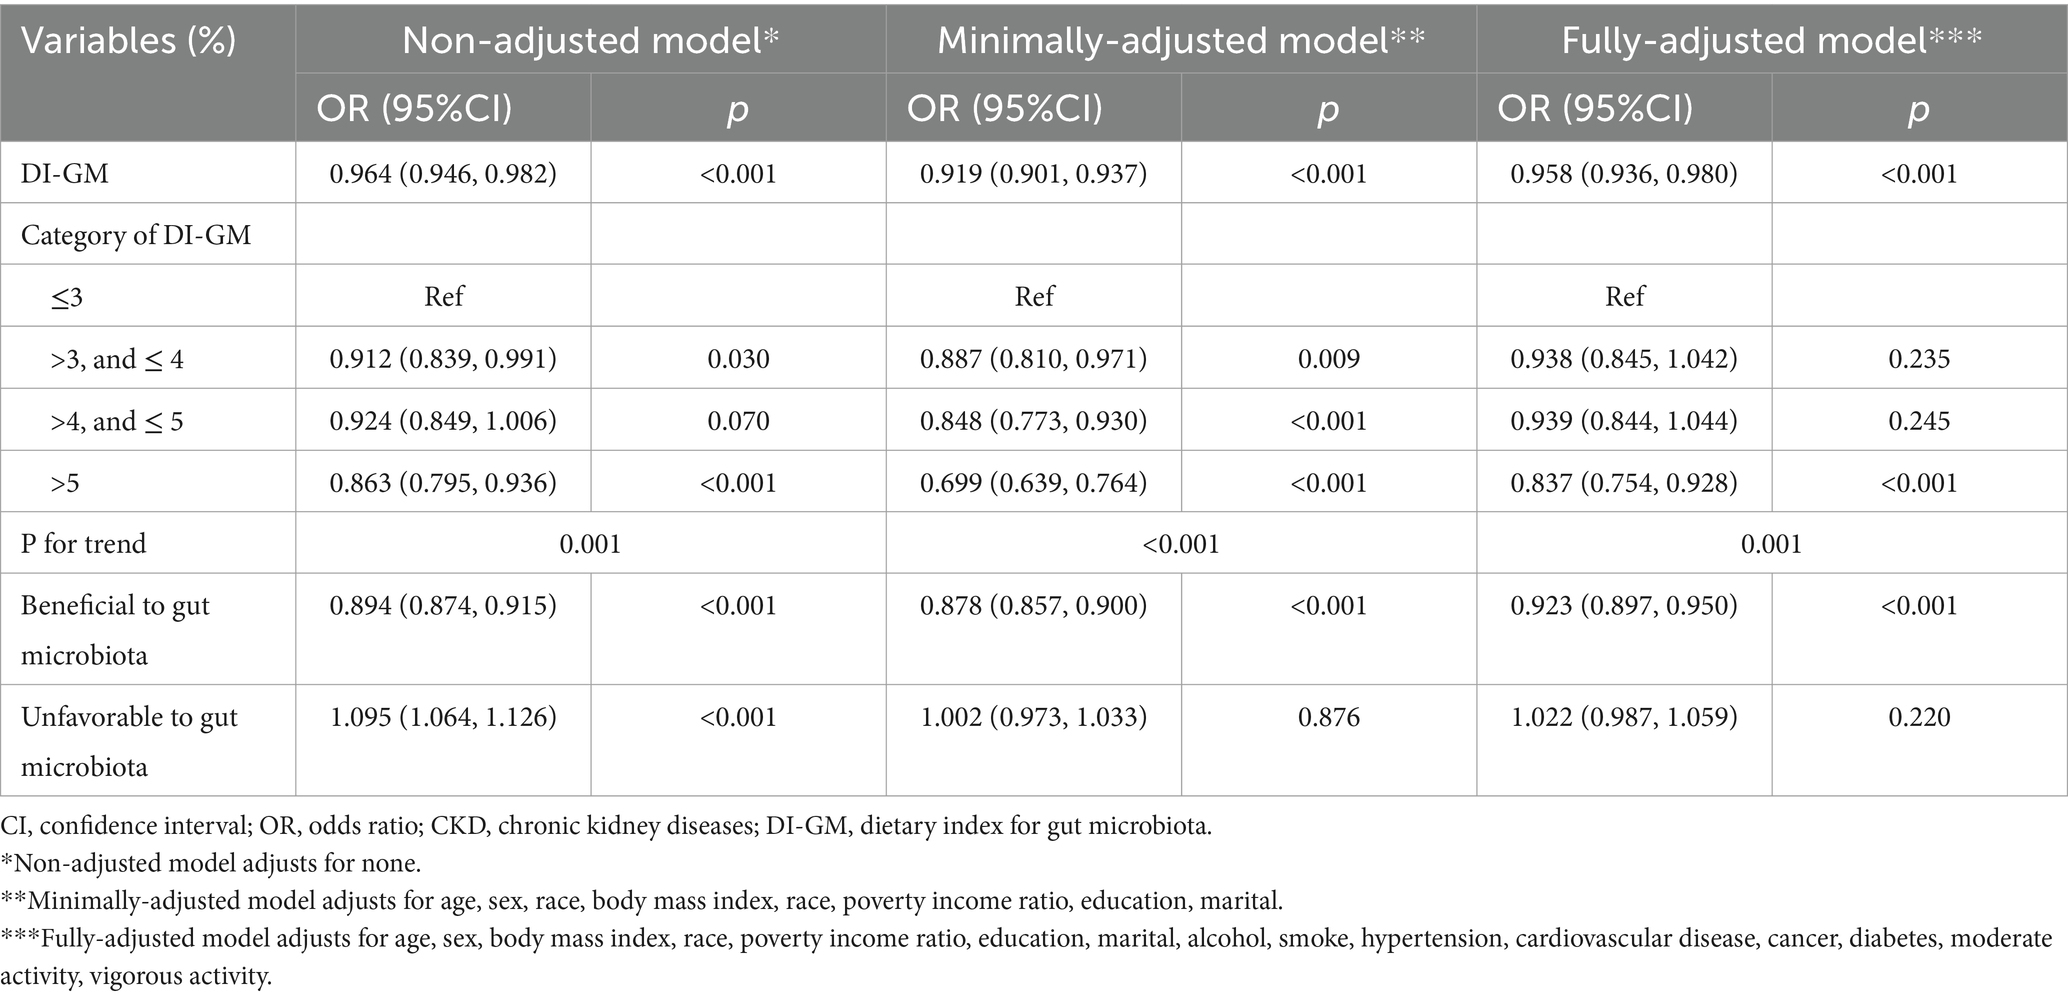
Table 2. Association between DI-GM and the prevalence of CKD in the adults.
Furthermore, the results showed that beneficial to gut microbiota serves as a protective factor for CKD (OR = 0.923, 95% CI 0.897 to 0.950), with no significant differences observed in the unfavorable to gut microbiota within the fully adjusted model. Additionally, components of beneficial to gut microbiota, such as coffee, fiber, and whole grains, play a crucial role in protecting CKD across the three models (Table 3).
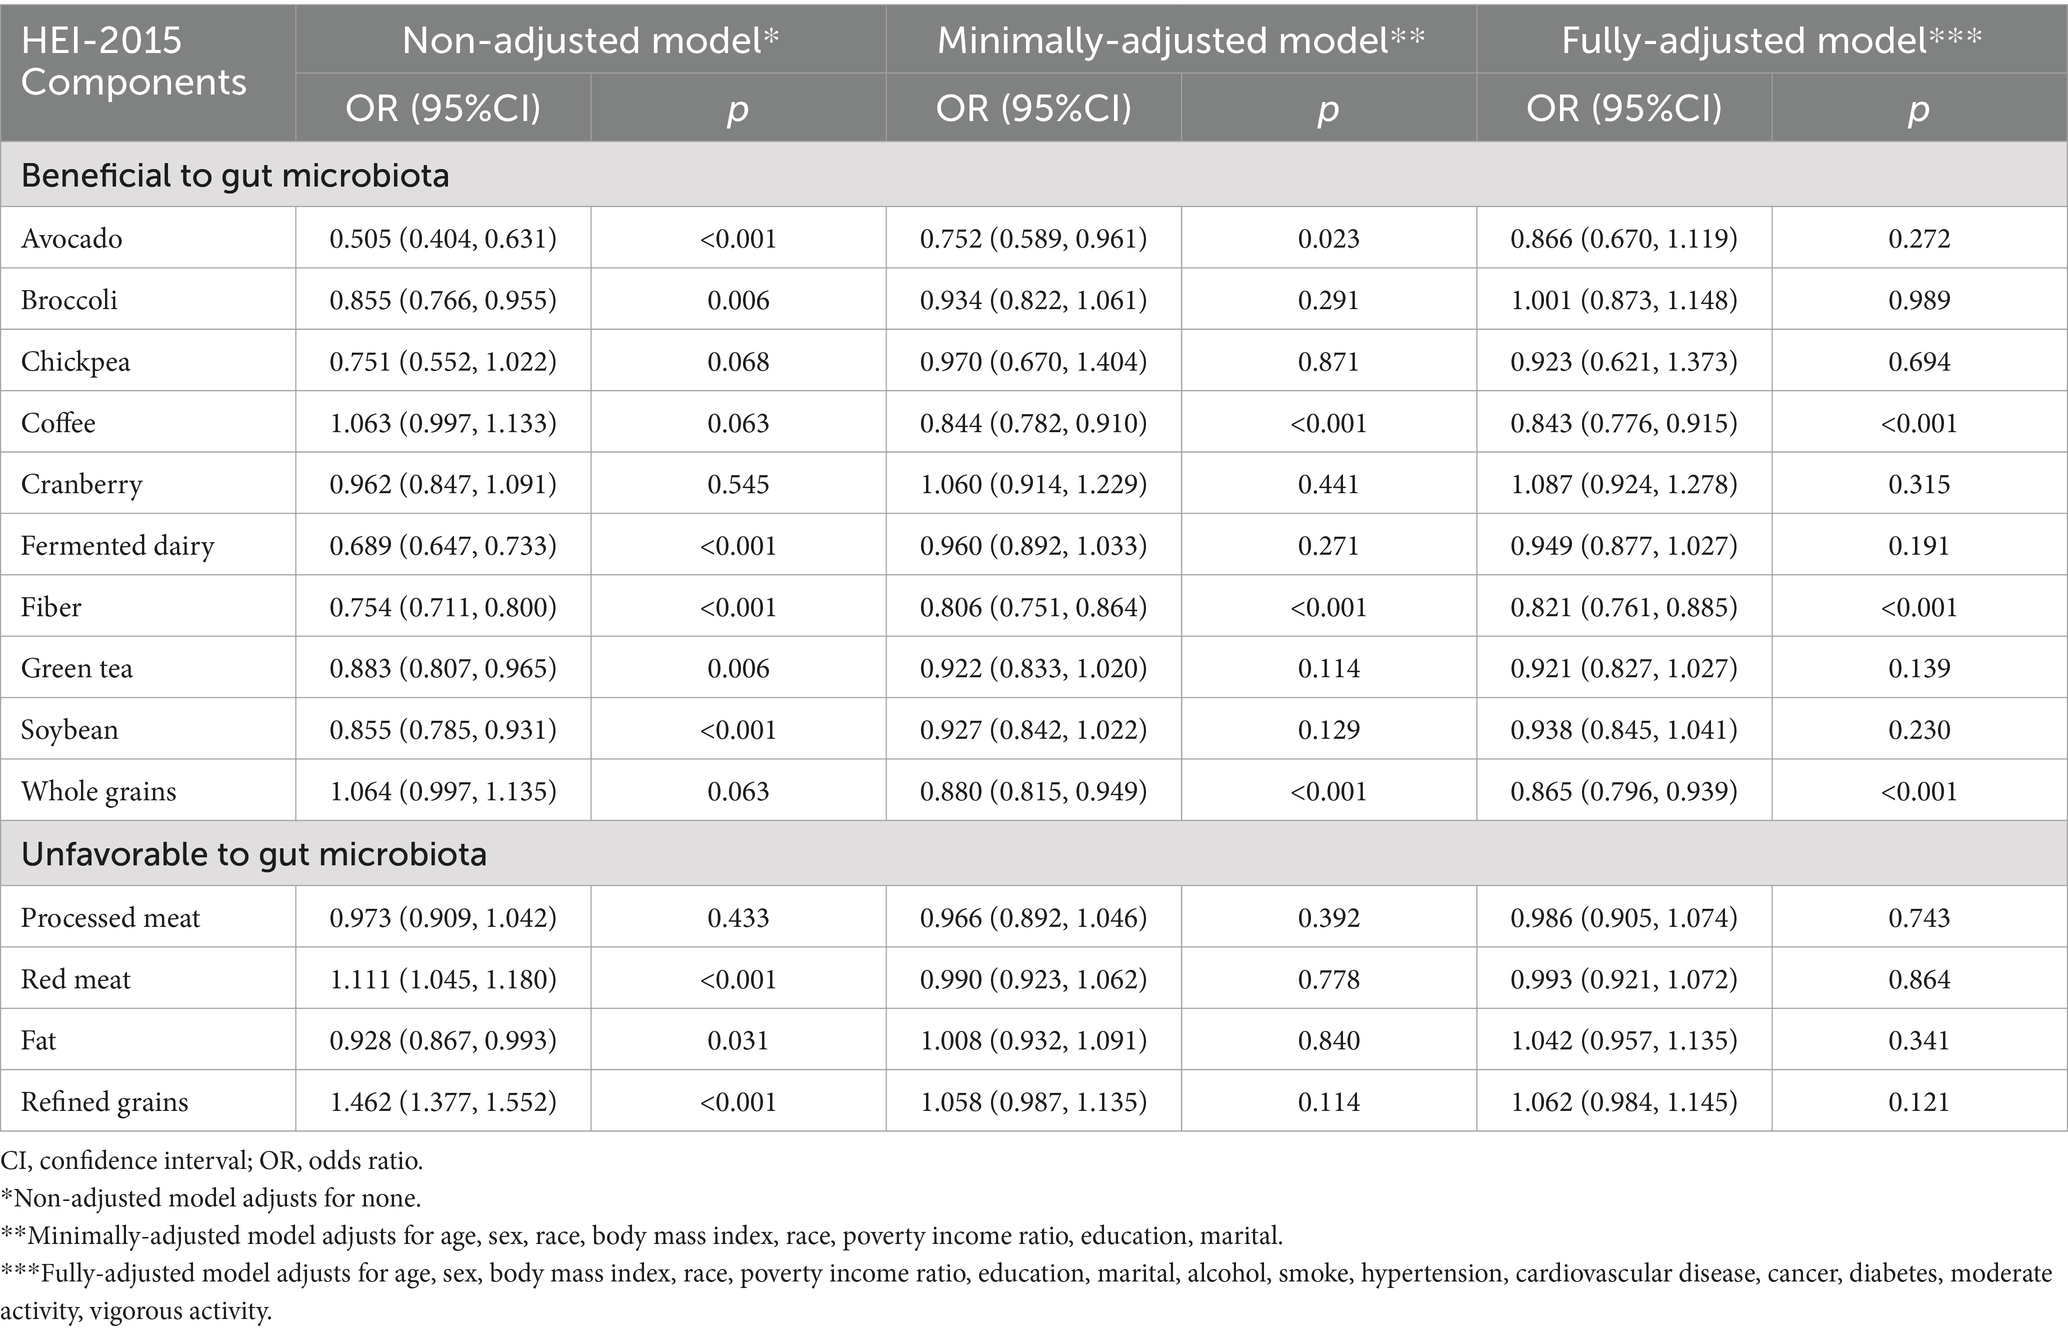
Table 3. Association between the components of DI-GM and the prevalence of CKD in the adults.
3.3 A smooth spline curve
The results demonstrate a negative linear association between DI-GM and the prevalence of CKD, as illustrated in Supplementary Figure S2. Specifically, the dose–response relationship indicates that higher levels of DI-GM are correlated with a lower prevalence of CKD.
3.4 Subgroup and interaction analysis
Our findings indicate that sex significantly influenced the relationship under investigation (Supplementary Figure S3). Specifically, the stratified analysis revealed notable differences in effects based on sex, with a p-value of 0.043 for the interaction, and the association was more pronounced in female. No other significant interactions were observed among the other variables.
3.5 Sensitivity analysis
Based on the dietary information collected on day two for DI-GM, the logistic regression analysis revealed consistent results, demonstrating a negative association between the two (Supplementary Table S3).
4 Discussion
This study utilized NHANES data from 2007 to 2018, encompassing a sample of 28,843 adults, to evaluate the association between DI-GM and the prevalence of CKD. Baseline characteristics of the study population indicated that patients with CKD had a higher median age and a greater proportion of individuals with high BMI, HBP, and diabetes. The results demonstrated a linear negative association between DI-GM and the prevalence of CKD, with sex influencing this relationship. Additionally, higher scores of beneficial to gut microbiota were significantly associated with a lower prevalence of CKD. Furthermore, specific dietary components within the beneficial to gut microbiota, such as dietary fiber, coffee, and whole grains, exhibited potential protective effects against CKD.
The above mentioned results underscore the critical role of healthy intestinal flora in preserving kidney health. Recent research suggests that an imbalance in intestinal flora can lead to increased production of uremic toxins, such as indoxyl sulfate and p-cresol sulfate (12). These toxins are detrimental to renal tubular cells and exacerbate CKD progression by promoting systemic inflammation (13, 14). Studies have shown that CKD patients experience a marked reduction in intestinal flora diversity, with this imbalance closely linked to elevated urinary toxin production (15). Moreover, a high DI-GM dietary pattern, which is abundant in dietary fiber and prebiotics, promotes the production of short-chain fatty acids (SCFAs), such as butyrate. These metabolites have been demonstrated to exert anti-inflammatory effects by inhibiting pro-inflammatory cytokines, including TNF-α and IL-6, and by mitigating oxidative stress (16, 17). Andrade-Oliveira et al. emphasized that butyrate plays a vital regulatory role in the gut-kidney axis, particularly in cases of ischemia–reperfusion-induced acute kidney injury, suggesting that SCFA production may help delay disease progression in CKD patients (18). This finding indicates that enhancing DI-GM scores, for instance, through increased dietary fiber intake, could offer renal protection for CKD patients. Clinically, improving the DI-GM score may contribute to delaying CKD progression. Future studies should further explore the potential of SCFAs as prognostic biomarkers for CKD and examine the varying protective effects of different types of intestinal flora on CKD.
This study found that sex significantly moderates the relationship between DI-GM and CKD, and a high DI-GM diet offers a more pronounced protective effect against CKD in women, potentially linked to estrogen’s role in regulating intestinal flora and barrier function. Gomez et al. highlighted that estrogen enhances the intestinal barrier by upregulating tight junction proteins, such as occludin, which reduces the production of pro-inflammatory uremic toxins and mitigates kidney damage (19, 20). Furthermore, women typically exhibit greater diversity in gut microbiota, which may enhance the benefits derived from a high DI-GM diet (21, 22). In contrast, men often favor high-fat and high-protein diets, which can disrupt bacterial balance and elevate pro-inflammatory bacteria, thereby diminishing the protective effects of DI-GM (23, 24). This study underscores the importance of considering sex differences in the dietary management of CKD patients, particularly for women who may experience greater advantages from a high DI-GM diet. Future personalized strategies should be developed to address these sex-specific dietary needs. Additionally, further research is warranted to elucidate the mechanisms by which estrogen contributes to intestinal barrier integrity and renal protection, thereby providing a more precise foundation for nutritional interventions targeting female CKD patients.
This study also analyzed the role of specific food components in dietary interventions for CKD and found that dietary fiber, coffee, and whole grains significantly contribute to kidney protection. As a prebiotic, dietary fiber promotes the proliferation of beneficial bacteria, such as Bifidobacteria, produces SCFAs, reduces pro-inflammatory factors, and enhances the intestinal environment (25). Research highlighted that dietary fiber intake is significantly associated with slowing the progression of CKD, with its mechanism closely linked to the improvement of bacterial flora diversity and the anti-inflammatory effects of dietary fiber (26). Furthermore, whole grain consumption has been shown to lower levels of chronic inflammatory markers, such as C-reactive protein, while improving metabolic health (27). Antioxidant components, such as polyphenols found in coffee, are also recognized for their protective effects against CKD. Research indicated that moderate coffee intake is associated with a deceleration in the progression of CKD, further corroborating the anti-inflammatory effects of coffee (28–30). This study provides specific guidance for the dietary management of CKD patients, suggesting that increasing the intake of dietary fiber, whole grains, and moderate amounts of coffee may enhance kidney protection. Future research should further explore the specific protective effects of these dietary components on CKD to optimize dietary strategies for renal health.
This study presents both strengths and weaknesses. It utilizes the NHANES large-scale database, which boasts a substantial sample size and broad representativeness, thereby enhancing the feasibility and generalizability of the results. Additionally, the study is noteworthy for being the first to analyze the correlation between DI-GM and CKD, providing a novel reference point for dietary interventions in CKD patients. However, the cross-sectional design of this study presents challenges in establishing a causal relationship between the two variables. Furthermore, the NHANES database lacks specific data on intestinal flora, which limits further investigation into the role of intestinal microorganisms in the mechanisms underlying CKD. Future research should incorporate longitudinal studies alongside microbiome technologies to elucidate the long-term effects of DI-GM on intestinal flora regulation and the protection of renal function.
5 Conclusion
This study provides compelling evidence that higher DI-GM scores are associated with a reduced prevalence of CKD in adults, with the protective effect being more pronounced in women than in men. Our findings highlight the significant contributions of beneficial dietary components, such as dietary fiber, whole grains, and coffee, which are integral to a gut-healthy diet. These results suggest that enhancing gut health through diet may serve as a viable strategy for the prevention and management of CKD, particularly by focusing on sex-based differences in prevention efforts. Future prospective cohort studies and microbiome analyses are warranted to further elucidate the role of gut microbiota in the progression of CKD and to support the development of more precise, individualized dietary intervention strategies.
Data availability statement
The datasets presented in this study can be found in online repositories. The names of the repository/repositories and accession number(s) can be found at: https://www.cdc.gov/nchs/nhanes/index.htm.
Ethics statement
This study was performed using public data from the National Center for Health Statistics (NCHS) program and the National Health and Nutrition Examination Survey (NHANES). The data have been de-identified and not merged or augmented in a way that has compromised the privacy of the participants. Therefore, the study requires no further approval and follows ethical guidelines.
Author contributions
YFX: Conceptualization, Data curation, Formal analysis, Investigation, Methodology, Resources, Software, Visualization, Writing – original draft, Writing – review & editing. YQY: Data curation, Formal analysis, Investigation, Methodology, Resources, Software, Validation, Visualization, Writing – original draft, Writing – review & editing. SYG: Data curation, Formal analysis, Investigation, Methodology, Resources, Software, Validation, Visualization, Writing – review & editing. HZ: Data curation, Formal analysis, Investigation, Methodology, Resources, Software, Validation, Visualization, Writing – review & editing. JW: Investigation, Resources, Validation, Visualization, Writing – review & editing. TL: Funding acquisition, Investigation, Project administration, Resources, Supervision, Validation, Visualization, Writing – review & editing. YJB: Conceptualization, Investigation, Project administration, Resources, Supervision, Visualization, Writing – review & editing.
Funding
The author(s) declare that financial support was received for the research and/or publication of this article. This work was supported by the National Natural Science Foundation of China (82370753).
Conflict of interest
The authors declare that the research was conducted in the absence of any commercial or financial relationships that could be construed as a potential conflict of interest.
Generative AI statement
The authors declare that no Gen AI was used in the creation of this manuscript.
Publisher’s note
All claims expressed in this article are solely those of the authors and do not necessarily represent those of their affiliated organizations, or those of the publisher, the editors and the reviewers. Any product that may be evaluated in this article, or claim that may be made by its manufacturer, is not guaranteed or endorsed by the publisher.
Supplementary material
The Supplementary material for this article can be found online at: https://www.frontiersin.org/articles/10.3389/fnut.2025.1561235/full#supplementary-material
SUPPLEMENTARY FIGURE S1 | Flow diagram of obtaining the final inclusion in the population.
SUPPLEMENTARY FIGURE S2 | A spline smoothing demonstrated the linear association between DI-GM and the prevalence of CKD.
SUPPLEMENTARY FIGURE S3 | Logistic regression analysis to identify variables that modify the correlation between DI-GM and the prevalence of CKD.
Footnotes
References
1. GBD Chronic Kidney Disease Collaboration. Global, regional, and national burden of chronic kidney disease, 1990-2017: a systematic analysis for the global burden of disease study 2017. Lancet. (2020) 395:709–33. doi: 10.1016/S0140-6736(20)30045-3
2. Glassock, RJ, Warnock, DG, and Delanaye, P. The global burden of chronic kidney disease: estimates, variability and pitfalls. Nat Rev Nephrol. (2017) 13:104–14. doi: 10.1038/nrneph.2016.163
3. Perna, AF, Glorieux, G, Zacchia, M, Trepiccione, F, Capolongo, G, Vigorito, C, et al. The role of the intestinal microbiota in uremic solute accumulation: a focus on sulfur compounds. J Nephrol. (2019) 32:733–40. doi: 10.1007/s40620-019-00589-z
4. Li, J, Shen, Y, Yan, K, Wang, S, Jiao, J, Chi, H, et al. The compositional and functional imbalance of the gut microbiota in CKD linked to disease patterns. J Transl Med. (2024) 22:773. doi: 10.1186/s12967-024-05578-w
5. Pan, L, Yu, H, Fu, J, Hu, J, Xu, H, Zhang, Z, et al. Berberine ameliorates chronic kidney disease through inhibiting the production of gut-derived uremic toxins in the gut microbiota. Acta Pharm Sin B. (2023) 13:1537–53. doi: 10.1016/j.apsb.2022.12.010
6. Yang, T, Richards, EM, Pepine, CJ, and Raizada, MK. The gut microbiota and the brain-gut-kidney axis in hypertension and chronic kidney disease. Nat Rev Nephrol. (2018) 14:442–56. doi: 10.1038/s41581-018-0018-2
7. Kase, BE, Liese, AD, Zhang, J, Murphy, EA, Zhao, L, and Steck, SE. The development and evaluation of a literature-based dietary index for gut microbiota. Nutrients. (2024) 16:1045. doi: 10.3390/nu16071045
8. Zhang, X, Yang, Q, Huang, J, Lin, H, Luo, N, and Tang, H. Association of the newly proposed dietary index for gut microbiota and depression: the mediation effect of phenotypic age and body mass index. Eur Arch Psychiatry Clin Neurosci. (2024). doi: 10.1007/s00406-024-01912-x
9. Flint, HJ, Duncan, SH, Scott, KP, and Louis, P. Links between diet, gut microbiota composition and gut metabolism. Proc Nutr Soc. (2015) 74:13–22. doi: 10.1017/S0029665114001463
10. Wang, H, Ainiwaer, A, Song, Y, Qin, L, Peng, A, Bao, H, et al. Perturbed gut microbiome and fecal and serum metabolomes are associated with chronic kidney disease severity. Microbiome. (2023) 11:3. doi: 10.1186/s40168-022-01443-4
11. Kidney Disease: Improving Global Outcomes (KDIGO) Glomerular Diseases Work Group. KDIGO 2021 clinical practice guideline for the Management of Glomerular Diseases. Kidney Int. (2021) 100:S1–S276. doi: 10.1016/j.kint.2021.05.021
12. Holle, J, Kirchner, M, Okun, J, Bayazit, AK, Obrycki, L, Canpolat, N, et al. Serum indoxyl sulfate concentrations associate with progression of chronic kidney disease in children. PLoS One. (2020) 15:e0240446. doi: 10.1371/journal.pone.0240446
13. Wang, X, Yang, S, Li, S, Zhao, L, Hao, Y, Qin, J, et al. Aberrant gut microbiota alters host metabolome and impacts renal failure in humans and rodents. Gut. (2020) 69:2131–42. doi: 10.1136/gutjnl-2019-319766
14. Chen, Z, Wu, S, Zeng, Y, Chen, Z, Li, X, Li, J, et al. FuZhengHuaYuJiangZhuTongLuoFang prescription modulates gut microbiota and gut-derived metabolites in UUO rats. Front Cell Infect Microbiol. (2022) 12:837205. doi: 10.3389/fcimb.2022.837205
15. Gryp, T, De Paepe, K, Vanholder, R, Kerckhof, FM, Van Biesen, W, Van de Wiele, T, et al. Gut microbiota generation of protein-bound uremic toxins and related metabolites is not altered at different stages of chronic kidney disease. Kidney Int. (2020) 97:1230–42. doi: 10.1016/j.kint.2020.01.028
16. Lee, J, d'Aigle, J, Atadja, L, Quaicoe, V, Honarpisheh, P, Ganesh, BP, et al. Gut microbiota-derived short-chain fatty acids promote poststroke recovery in aged mice. Circ Res. (2020) 127:453–65. doi: 10.1161/CIRCRESAHA.119.316448
17. Deehan, EC, Yang, C, Perez-Muñoz, ME, Nguyen, NK, Cheng, CC, Triador, L, et al. Precision microbiome modulation with discrete dietary fiber structures directs short-chain fatty acid production. Cell Host Microbe. (2020) 27:389–404.e6. doi: 10.1016/j.chom.2020.01.006
18. Andrade-Oliveira, V, Amano, MT, Correa-Costa, M, Castoldi, A, Felizardo, RJ, de Almeida, DC, et al. Gut Bacteria products prevent AKI induced by ischemia-reperfusion. J Am Soc Nephrol. (2015) 26:1877–88. doi: 10.1681/ASN.2014030288
19. Acharya, KD, Noh, HL, Graham, ME, Suk, S, Friedline, RH, Gomez, CC, et al. Distinct changes in gut microbiota are associated with estradiol-mediated protection from diet-induced obesity in female mice. Meta. (2021) 11:499. doi: 10.3390/metabo11080499
20. Ma, Y, Liu, T, Li, X, Kong, A, Xiao, R, Xie, R, et al. Estrogen receptor β deficiency impairs gut microbiota: a possible mechanism of IBD-induced anxiety-like behavior. Microbiome. (2022) 10:160. doi: 10.1186/s40168-022-01356-2
21. Yuan, X, Chen, R, Zhang, Y, Lin, X, and Yang, X. Sexual dimorphism of gut microbiota at different pubertal status. Microb Cell Factories. (2020) 19:152. doi: 10.1186/s12934-020-01412-2
22. Baldeon, AD, McDonald, D, Gonzalez, A, Knight, R, and Holscher, HD. Diet quality and the fecal microbiota in adults in the American gut project. J Nutr. (2023) 153:2004–15. doi: 10.1016/j.tjnut.2023.02.018
23. Amicis, R, Galasso, L, Cavallaro, R, Mambrini, SP, Castelli, L, Montaruli, A, et al. Sex differences in the relationship between Chronotype and eating behaviour: a focus on binge eating and food addiction. Nutrients. (2023) 15:4580. doi: 10.3390/nu15214580
24. Anguah, KO, Syed-Abdul, MM, Hu, Q, Jacome-Sosa, M, Heimowitz, C, Cox, V, et al. Changes in food cravings and eating behavior after a dietary carbohydrate restriction intervention trial. Nutrients. (2019) 12:52. doi: 10.3390/nu12010052
25. Spencer, CN, McQuade, JL, Gopalakrishnan, V, McCulloch, JA, Vetizou, M, Cogdill, AP, et al. Dietary fiber and probiotics influence the gut microbiome and melanoma immunotherapy response. Science. (2021) 374:1632–40. doi: 10.1126/science.aaz7015
26. Li, YJ, Chen, X, Kwan, TK, Loh, YW, Singer, J, Liu, Y, et al. Dietary Fiber protects against diabetic nephropathy through short-chain fatty acid-mediated activation of G protein-coupled receptors GPR43 and GPR109A. J Am Soc Nephrol. (2020) 31:1267–81. doi: 10.1681/ASN.2019101029
27. Mazidi, M, Katsiki, N, Mikhailidis, DP, and Banach, M. A higher ratio of refined grain to whole grain is associated with a greater likelihood of chronic kidney disease: a population-based study. Br J Nutr. (2019) 121:1294–302. doi: 10.1017/S0007114518003124
28. Kennedy, OJ, Pirastu, N, Poole, R, Fallowfield, JA, Hayes, PC, Grzeszkowiak, EJ, et al. Coffee consumption and kidney function: a Mendelian randomization study. Am J Kidney Dis. (2020) 75:753–61. doi: 10.1053/j.ajkd.2019.08.025
29. Zhou, X, Zhang, B, Zhao, X, Zhang, P, Guo, J, Zhuang, Y, et al. Coffee leaf tea extracts improve hyperuricemia nephropathy and its associated negative effect in gut microbiota and amino acid metabolism in rats. J Agric Food Chem. (2023) 71:17775–87. doi: 10.1021/acs.jafc.3c02797
Keywords: chronic kidney diseases, dietary index for gut microbiota, metabolism, cross-section, association
Citation: Xiao Y, Yang Y, Gao S, Zhang H, Wang J, Lin T and Bai Y (2025) Dietary index for gut microbiota, a novel protective factor for the prevalence of chronic kidney diseases in the adults: insight from NHANES 2007–2018. Front. Nutr. 12:1561235. doi: 10.3389/fnut.2025.1561235
Edited by:
Sofia Viana, University of Coimbra, PortugalReviewed by:
Sourish Bhattacharya, Central Salt and Marine Chemicals Research Institute (CSIR), IndiaSusana Rocha, University of Porto, Portugal
Copyright © 2025 Xiao, Yang, Gao, Zhang, Wang, Lin and Bai. This is an open-access article distributed under the terms of the Creative Commons Attribution License (CC BY). The use, distribution or reproduction in other forums is permitted, provided the original author(s) and the copyright owner(s) are credited and that the original publication in this journal is cited, in accordance with accepted academic practice. No use, distribution or reproduction is permitted which does not comply with these terms.
*Correspondence: Tao Lin, a2lkbmV5MTIzNEAxNjMuY29t; Yunjin Bai, QmFpeXVuamluQDE2My5jb20=
†These authors have contributed equally to this work