 Made Astawan1*
 Anisha Ayuning Tryas1
 Saraswati Saraswati1
 Tutik Wresdiyati2
 Diana Nur Afifah3
 Frima Elda4Rifqi Ahmad Riyanto5,6
 Sastia Prama Putri7
- 1Department of Food Science and Technology, Faculty of Agricultural Engineering and Technology, IPB University, Bogor, Indonesia
- 2School of Veterinary Medicine and Biomedicine Sciences, IPB University, Bogor, Indonesia
- 3Department of Nutrition Science, Faculty of Medicine, Universitas Diponegoro, Semarang, Central Java, Indonesia
- 4Nutrition Department, Faculty of Public Health, Universitas Andalas, Padang, Indonesia
- 5Bioresource Engineering Laboratory, Division of Advanced Science and Biotechnology, Fukusaki Laboratory Department of Biotechnology, Graduate School of Engineering, Osaka University, Suita, Japan
- 6Department of Food Technology, Faculty of Agriculture, Universitas Sultan Ageng Tirtayasa, Serang, Banten, Indonesia
- 7Department of Biotechnology, Graduate School of Engineering, Osaka University, Suita, Japan
High cholesterol is one of the risk factors for cardiovascular disease, which is currently a global health problem. This study aimed to compare the potential of tempe flour and soybean flour as functional foods for lowering blood lipid levels. This study evaluated both flour’s cholesterol-binding activity and anti-lipase activity in vitro. In addition, metabolomic profiling using GC-MS was conducted to identify bioactive compounds contributing to the hypolipidemic effect. The results showed that compared to soybean flour, tempe flour had a higher cholesterol-binding activity (27.66 vs. 14.98%, p < 0.05) and stronger anti-lipase activity (23.24 vs. 15.03%, p < 0.05). GC-MS analysis revealed that tempe flour was rich in isoflavones, amino acids, organic acids, meglutol, and GABA. These components are suspected to contribute to the hypolipidemic effect through mechanisms of inhibiting cholesterol synthesis, forming cholesterol esters, and increasing the excretion of cholesterol and bile acids. These findings suggest that tempe flour has greater potential as a functional food for preventing and managing dyslipidemia.
1 Introduction
Metabolic syndrome (MS) is a condition where the body is at high risk of developing chronic diseases such as cardiovascular disease (CVD). An individual is diagnosed with metabolic syndrome if they have at least three of the following six health conditions simultaneously: high blood glucose, high blood pressure, high blood fats or triglycerides, high blood cholesterol, low HDL cholesterol, and excess waist circumference/obesity (1). Elevated total cholesterol levels beyond the normal range in the blood are the most common health problems. Recently, this disease has not only been suffered by the elderly but also by the productive age group (2). The significant global burden of degenerative diseases underscores the urgent need for effective prevention strategies through the consumption of functional foods (3–5).
According to data from the Global Burden of Disease (GBD), in 2019, 3.78 million people worldwide died from ischemic heart disease, a condition associated with high LDL cholesterol levels in patients (6). GBD data also explains that countries in the Asian region have the highest number of deaths from ischemic heart disease and ischemic stroke due to high LDL cholesterol levels (7). In 2019, Indonesia was one of the Asian countries ranking fifth in the world with the highest number of deaths from heart disease (6). A healthy lifestyle, encompassing regular physical activity and a balanced, nutritious diet, is crucial for maintaining optimal cholesterol levels.
Indonesia produces a traditional fermented food derived from soybeans, shown in numerous studies to possess hypolipidemic and hypocholesterolemic properties. This food comes from the Central Java region, Indonesia, and is called tempe. Tempe is a multi-fermented product. The fermentation process of soybeans will increase their nutritional quality. The composition of amino acids, lipids, the antioxidant content of isoflavones, and carbohydrates will change into simpler monomers due to the hydrolysis process carried out by microorganisms (8–10). In addition, the fat content in tempe is also lower than in unfermented soybeans due to the hydrolysis of lipids into free fatty acids (11, 12). These components will be used by the fungus Rhizopus spp. as an energy source so that the fat content will decrease during the fermentation process. Based on the findings of Yuliani et al. (13) the tempe fermentation process can reduce the total fat content from 9.77%–13.59% in soybean seeds to 3.34%–5.37% in the final fermented tempe. Similarly, in a study by Polanowska et al. (14) tempe fermentation of faba bean samples also reduced total fatty acids by 38%–78%. The variation in reduction may be attributed to differences in lipase activity among tempe samples. Moreover, bioactive components from tempe fermentation, such as aglycone isoflavones, are more active and effective than soybeans in controlling blood cholesterol and triglyceride levels. Therefore, tempe is often referred to as a food for preventing obesity (15, 16).
Traditional Indonesian cuisine commonly features deep-fried tempe as a staple side dish, often served alongside rice. This common cooking method, however, may diminish the cholesterol-lowering benefits of tempe by introducing additional dietary fat. As reported by Yunigrum et al. (17) deep-frying increases the fat content of tempe, which can potentially elevate blood cholesterol levels. Alternative processing methods are necessary to fully leverage the cholesterol-lowering potential of tempe. Tempe flour and its derivatives offer a promising alternative for individuals with high cholesterol, as they retain significant nutritional value and may exhibit even greater cholesterol-lowering effects compared to soybean flour, as demonstrated by in vivo studies (18, 19). Tempe’s antioxidant compounds, which are more superior than those in unfermented soybeans, play a major role in preventing metabolic diseases. These antioxidants can work at the cellular level, especially in their extracted form (20). However, no exploratory research, such as a comparative metabolomic analysis to identify hypocholesterolemic compounds, or experimental studies, like those identifying the cholesterol-reducing ability of these two flours, have been conducted. Therefore, this study aims to fill these gaps by elucidating the underlying mechanisms by which tempe flour exerts its hypocholesterolemic effects. This will be achieved by evaluating the antioxidant activity (DPPH), isoflavone content, cholesterol-binding activity, and anti-lipase activity of both flours. Furthermore, metabolomic profiling using GC–MS will be employed to identify specific metabolites that may contribute to the observed bioactivities. By correlating these bioactivities with the metabolomic data, this research will provide a strong scientific foundation for the development of tempe flour as a functional food.
2 Materials and methods
2.1 Materials
The primary materials used in this study were soybeans and tempe, sourced from a small-scale enterprise (SME) in Bogor, Indonesia. The tempe produced by this SME has obtained Indonesia National Standard (SNI), HACCP, BPOM (Indonesia Food and Drug Surveillance Agency), and Halal certifications, indicating compliance with national and international food safety standards. The tempe production process at this SME adheres to good manufacturing practices (GMP) and meets export standards. The process involves cleaning soybean seeds, soaking and boiling, dehulling, inoculation with Rhizopus spp., plastic packaging, and fermentation at room temperature (28–30 °C) for 48 h.
2.2 Tempe and soybean flour production process
Tempe flour and soybean flour were processed separately according to the method described by Mahdi et al. (21). Fresh tempe was cut into 2 × 2 cm2 cubes and then comminuted using a chopper. Soybean flour was produced through the following steps: cleaning, soaking, boiling, dehulling, and comminuting using a chopper. Both the comminuted tempe and soybeans were dried using a fluidized bed dryer (FBD) at 50 °C for 6 h. Drying with a FBD at temperatures below 60 °C prevents the oxidation and degradation of antioxidant components like polyphenols (Elgamal et al.). Additionally, FBD ensures the sample’s surface dries evenly, a notable advantage over traditional tray or vacuum drying methods. Subsequently, the dried materials were ground into a fine powder using a grinder and sieved through a 100-mesh sieve.
2.3 Analysis of antioxidant activity
The antioxidant activity of the samples was determined using the 2,2-diphenyl-1-picrylhydrazyl (DPPH) radical scavenging assay. This method assesses the ability of antioxidant compounds in the samples to stabilize the DPPH radical. The procedure was adapted from Abdurrasyid et al. (22). Initially, 1 g of the powdered beverage sample was mixed with 10 mL of a methanol–water solution (80:20, v/v). The mixture was homogenized using a vortex mixer for 1 min and then centrifuged at 4 °C and 3,000 rpm for 45 min. Subsequently, 0.2 mL of the supernatant was added to 3.8 mL of 0.1 mM DPPH solution. The mixture was incubated in the dark for 30 min. The absorbance of the incubated samples was measured at 517 nm (A1) using a spectrophotometer. In parallel, a standard curve was constructed using serial dilutions of ascorbic acid (25–200 μg/mL) as a reference standard. This curve was used to convert the absorbance values into antioxidant capacity expressed as mg ascorbic acid equivalents (AAE)/100 g. Additionally, a blank sample (A0) was measured without the sample in the test solution. The DPPH radical scavenging activity was calculated using the following formula:
2.4 Analysis of isoflavone content
The isoflavone content of tempe flour and soybean flour was determined using a high-performance liquid chromatography (HPLC) method as described by Astawan et al. (23). Two grams of each sample were mixed with 30 mL of a 1:4 hydrochloric acid: acetonitrile solution to hydrolyze isoflavone glycosides into isoflavone aglycones. The mixture then extracted using a sonicator for 30 min. Thenincubated in a water bath for 1 h. After the hydrolysis process was complete, the sample was cooled and centrifuged. The supernatant was collected and filtered using a 0.45 μm syringe filter. A 20 μL aliquot of the filtrate was injected into an HPLC system equipped with a C-18 column (15 cm × 4.6 mm i.d., 5 μm particle size). The separation was performed using a reverse-phase mode, elution isocratic with a mobile phase consisting of a methanol:1 mM ammonium acetate mixture (6:4, v/v) at a flow rate of 1 mL/min. The UV detector was set at a wavelength of 265 nm, column temperature: 30 °C. Subsequently, the isoflavones were quantified using external standards of daidzein and genistein and a calibration curve. The concentrations of daidzein and genistein in the samples were then calculated based on the sample peak areas and the calibration equations.
2.5 Analysis of cholesterol binding activity
Cholesterol binding activity was determined using the Lieberman–Burchard (LB) method, as described by Muharni et al. (24) and Imtihani et al. (25). The LB method is a colorimetric assay that reacts cholesterol with the LB reagent. Samples were extracted by maceration with 70% ethanol for 3 × 24 h at room temperature, followed by sonication for 30 min. Preliminary analysis indicated that the optimal wavelength for measurement was 415 nm with an operating time of 45 min. A standard curve was constructed using serial concentrations of cholesterol (100, 150, 200, 250, and 300 ppm) to quantify the cholesterol content. Five milliliters of each sample extract and simvastatin (positive control) were mixed with 300 ppm cholesterol solution (A) in test tubes, vortexed for 30 s, and incubated at 37 °C for 60 min. After incubation, the tubes were centrifuged at 4,000 rpm for 5 min. The supernatant was transferred to new tubes, 1 mL of acetic anhydride was added, and the mixture was vortexed for 30 s and kept in the dark for 30 min. Subsequently, 0.1 mL of concentrated sulfuric acid was added, vortexed, and incubated in the dark for 45 min. Finally, the absorbance of the solution was measured at 415 nm. The cholesterol concentration in the test samples and positive control (B) was determined using the standard curve equation. A blank sample (C) was also measured, which consisted of the sample solution without sulfuric acid, to serve as a color baseline. The calculation was performed using the following equation:
2.6 Analysis of anti-lipase
Pancreatic lipase inhibitory activity was determined according to the methods described by Pradono et al. (26) and Aji et al. (27). The assay was performed by mixing 0.1 mL of lipase (1 mg/mL) with 0.2 mL of 70% ethanol extract of the sample (the same for each concentration) and 0.7 mL of Tris–HCl buffer (pH 8.0) in a test tube. The mixture was homogenized and incubated at 37 °C for 15 min. After incubation, 0.1 mL of p-nitrophenyl palmitate (p-NPP) was added, and the mixture was incubated for an additional 30 min at the same temperature. Finally, the absorbance was measured at 410 nm using a spectrophotometer. Orlistat was used as a positive control (100% inhibition) and was prepared following the same procedure. The percentage of inhibition was calculated as follows:
Note: A0, Absorbance of blank (without inhibitor); A, Absorbance of sample.
2.7 GC–MS analysis
2.7.1 Sample extraction and derivatization
GC–MS analysis was preceded by sample extraction and derivatization. The extraction technique involved freezing and homogenization of the sample using a multi-beads shocker (Yasui Kikai, Osaka, Japan), as described by Prativi et al. (28). A 50 μg/mL solution of ribitol was added to each homogenized sample as an internal standard. At the end of the extraction process, 200 μL of the aqueous phase was obtained. A quality control (QC) sample was prepared by pooling 200 μL of the aqueous phase from all samples. Both the samples and QC were centrifuged using a centrifugal concentrator (Taitec Co., Tokyo, Japan) for 2 h at room temperature. In the second step, the extracted samples were derivatized by mixing the dried extract with 100 μL of methoxyamine hydrochloride and incubating at 30 °C for 90 min with stirring at 1200 rpm. Subsequently, 50 μL of N-methyl-N-trimethylsilyltrifluoroacetamide (MSTFA) was added to the sample, followed by incubation at 37 °C for 30 min with stirring at 1200 rpm (Eppendorf Ltd.). The resulting samples were transferred to GC vials for GC–MS analysis.
2.7.2 GC–MS sample injection
The derivatized samples were immediately injected into the GC–MS instrument using an AOC-20i/s autosampler (Shimadzu) in split mode (25:1, v/v) at 230 °C. A 30 × 0.25 mm i.d. fused silica capillary column coated with 0.25 μm InertCap 5MS/NP (GL Science, Inc.) was used. Hydrogen was used as the carrier gas at a flow rate of 1.12 mL/min and a linear velocity of 39 cm/s. The initial column temperature was 80 °C for 2 min, followed by an increase to 330 °C at a rate of 15 °C/min and held for 6 min. Electron ionization (EI) was used as the ionization method, with an ion source temperature of 200 °C, and the mass-to-charge ratio (m/z) range was set from 85 to 500 with a scan rate of 6.67 scans per second. Retention indices (RI) were determined using a standard alkane mixture. In the final step, the data from the GC–MS instrument, in the form of chromatograms, was converted to netCDF format using the GC–MS-QP2010 Ultra instrument software (Shimadzu, Kyoto, Japan). The data was then exported to a CSV file. Retention indices (RI) were calculated based on the retention times of the standard alkane mixture. The RI and mass spectra were compared to the database in the instrument to identify the compounds in the samples.
2.8 Statistical data analysis
The antioxidant activity data was analyzed using SPSS 22. An independent t-test was performed at the 5% significance level. For multivariate data from GC–MS analysis, visualization was performed using SIMCA 18 (Umetrics, Umea, Sweden). Principal component analysis (PCA) was initially applied to the multivariate data to visualize sample discrimination and assess the initial model quality. If the PCA was satisfactory, orthogonal projection to latent structures (OPLS) analysis was performed. OPLS analysis generated a correlation model between metabolites (X) and bioactivity (Y). The output data from OPLS analysis included score plots, S-plots, Y-related coefficient plots, and VIP plots. The generated model was validated using R2X, R2Y, Q2, CV-ANOVA, and permutation tests.
3 Results and discussion
3.1 Antioxidant activity and isoflavone content of tempe flour and soybean flour
Soybeans and tempe contain a variety of antioxidant compounds. Consuming foods rich in antioxidants offers numerous health benefits. Many chronic diseases and metabolic syndromes are caused by oxidative stress in the body (29). The isoflavones in soybeans and tempe can prevent this from happening. Soybean isoflavones can act as anti-atherosclerotic agents by inhibiting oxidative stress, increasing nitric oxide (NO) availability, reducing LDL size, and preventing LDL peroxidation (30). Table 1 shows that the antioxidant activity of tempe flour (31.56 ± 2.27%) was significantly higher (p < 0.05) than that of soybean flour (27.99 ± 1.57%). This result is consistent with the isoflavone content of the samples. The content of daidzein and genistein in tempe flour was also significantly higher (p < 0.05) compared to soybean flour.
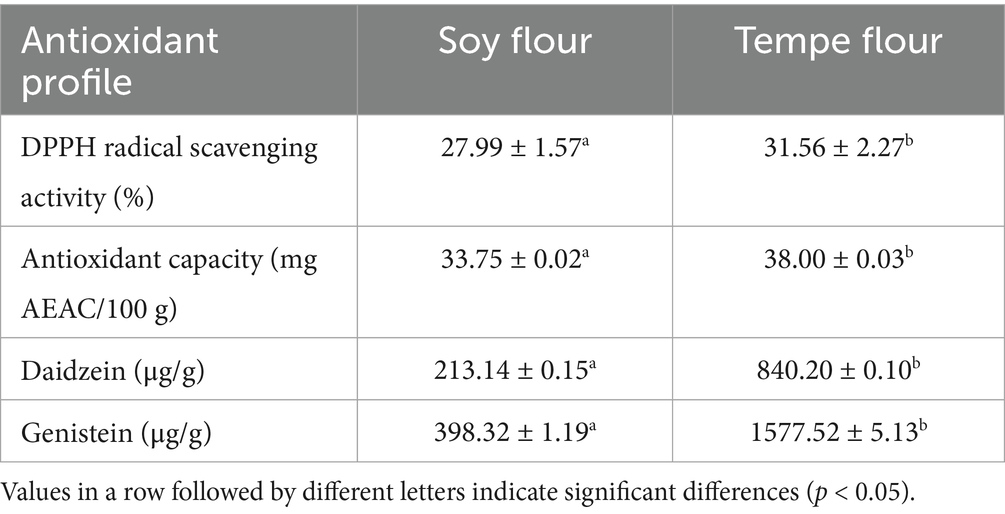
Table 1. Antioxidant profile of soybean flour and tempe flour.
Based on Barus et al.’s study (31), the antioxidant activity of tempe can reach 53%–84%. The values might decrease in powdered samples due to the drying process, which can reduce bioactive antioxidant components. However, this finding is consistent with the study by Kuligowski et al. (32) who observed that the isoflavones daidzein and genistein increased by 5–8 times during tempe fermentation. This demonstrates that the content of both isoflavones is indeed higher in tempe than in soybeans. The fermentation process in tempe increases the aglycone forms of daidzein and genistein due to the activity of microorganisms that hydrolyze the glycosidic bonds, namely β-glucosidase (23). The increase in aglycone isoflavones enhances their bioavailability and antioxidant activity, as both compounds are flavonoids that can donate electrons to free radicals. In addition to isoflavones, which are derivatives of flavonoids, soybeans also contain other antioxidant compounds such as phenolic compounds.
3.2 Cholesterol binding activity
The results of the Lieberman–Burchard analysis of tempe flour and soybean flour (Figure 1) showed significantly different binding percentages. Tempe flour had the highest binding value (27.66%), followed by soybean flour (14.98%), and the lowest was the positive control, statin (6.09%). These results indicate that tempe flour and soybean flour have a greater potential to control blood cholesterol levels compared to statins, which work through a different mechanism. The positive control, statin, showed the lowest percentage decrease in cholesterol, presumably due to the lack of direct binding with free cholesterol. This limited cholesterol-lowering effect of statins can be attributed to their mechanism of action, which primarily involves inhibiting HMG-CoA reductase, the rate-limiting enzyme in cholesterol biosynthesis, rather than directly binding to cholesterol molecules (33). The findings are largely comparable to the study by Zendrato et al. (34), where Porang glucomannan extract exhibited a cholesterol-binding capacity of 13.42–45.56% (at concentrations of 150–750 μg/mL). In contrast, research by Musa et al. (35) on Saurauia vulcani Korth. (Actinidiaceae), a tropical medicinal plant, reported a higher cholesterol-binding capacity ranging from 20 to 80%.
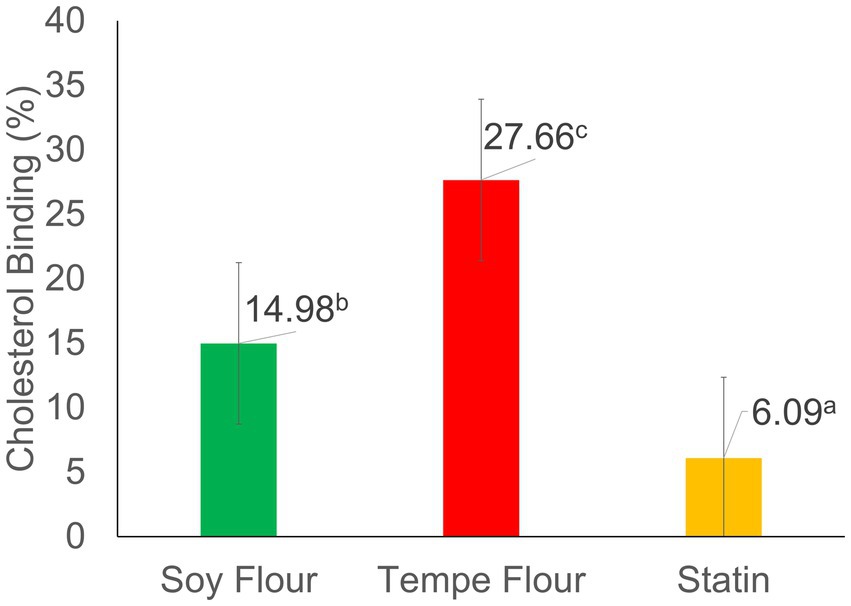
Figure 1. Cholesterol binding activity. Values followed by different letters indicate significant differences (p < 0.05).
The cholesterol-binding activity of tempe flour and soybean flour was analyzed using the photometric Lieberman–Burchard (LB) method. The LB method can be used for both qualitative and quantitative analysis. The principle of this analysis involves measuring the amount of free cholesterol in a solution that is not bound to metabolites in the sample. Free cholesterol undergoes derivatization with acetic anhydride and H2SO4, resulting in a strongly chromogenic blue–green cholesterol derivative, known as an aromatic sulfonic acid. The unbound cholesterol was quantified spectrophotometrically using a method adapted from Adu et al. (36). A higher absorbance value correlates with a higher concentration of free cholesterol, as evidenced by a more intense color of the solution. Conversely, if a sample effectively binds cholesterol, the resulting solution will exhibit a lighter color and a lower absorbance value. The samples used in the cholesterol binding activity test were ethanol extracts. Ethanol was chosen as the extraction solvent because it is considered a safe solvent and can effectively extract bioactive compounds, especially antioxidant derivatives such as phenolics, flavonoids, and saponins from the material. Ethanol can degrade non-polar walls through semi-polar interactions, allowing intracellular phenolic-flavonoid compounds to be extracted (37–39).
A positive correlation was also found between the cholesterol-binding activity and the antioxidant activity of the samples; the higher the antioxidant activity, the greater binding cholesterol activity. The cholesterol binding mechanism in the LB reaction involves the interaction of the cholesterol hydroxyl (-OH) group with antioxidant compounds, such as phenols and flavonoids. This interaction leads to the formation of stable hydrogen bonds, effectively preventing cholesterol from reacting with sulfuric acid. The crucial role of the hydroxyl group in this process is underscored by its involvement in the formation of a pharmacophore, as described by Musa et al. (35). The OH group in phenols is also thought to have the potential to bind with cholesterol, forming hydroxysterols. Hydroxysterols are another form of cholesterol that has accepted an oxygen atom. The remaining free cholesterol reacts with acetic anhydride and H2SO4, forming a colored compound.
This model of cholesterol binding in the LB analysis represents one of the body’s regulatory mechanisms for maintaining stable cholesterol levels (homeostasis). Cholesterol homeostasis can be controlled by four mechanisms: (1) cholesterol absorption from food through the small intestine, (2) cholesterol synthesis by various body tissues, especially the liver, and intestines, for release into the blood plasma, (3) cholesterol excretion through the excretory system regulated by the liver, and (4) conversion of cholesterol to various hormone compounds required by humans (40). Cholesterol exists in two forms: free cholesterol and cholesterol ester. Only monomeric cholesterol can be absorbed by the small intestine/basolateral membrane (41). Thus, bound cholesterol is presumably unable to be absorbed or is inhibited from absorption and can be excreted through feces, similar to the mechanism of dietary fiber binding bile acids or cholesterol. The percentage of cholesterol binding in this LB analysis is expected to reflect the difference in the cholesterol binding capacity of the samples. Tempe flour and soybean flour are known to have the potential to control blood cholesterol levels.
3.2.1 Lipase inhibition activity
Tempe flour extract had a higher inhibition value (23.24%) compared to soybean flour extract (15.03%), but both were much lower than the inhibition by the positive control, orlistat (55.34%). Figure 2 shows that tempe and soybean flour extracts had significantly different percentages of lipase inhibition. The lipase inhibition activity of the tempe sample in this study was higher than that of the cinnamon leaves sample (16.23%) in the research by Megawati et al. (42), yet lower than the activity found in the fruit of Solanum stramonifolium (33.4–94.6%), a plant native to Thailand (43). Meanwhile, the positive control, Orlistat, in this study had a value nearly identical to the one reported by Megawati et al. (42), who stated that orlistat has a high inhibition value of 46.79%. Orlistat, an anti-obesity medication, exerts its therapeutic effect by irreversibly inhibiting pancreatic lipase, a key enzyme involved in the hydrolysis of triglycerides, at its active site (44). Therefore, it has the highest inhibition value. The inhibition mechanism in tempe and soybean flour extracts is suspected to be due to the presence of proteins, peptides, and antioxidants (15).
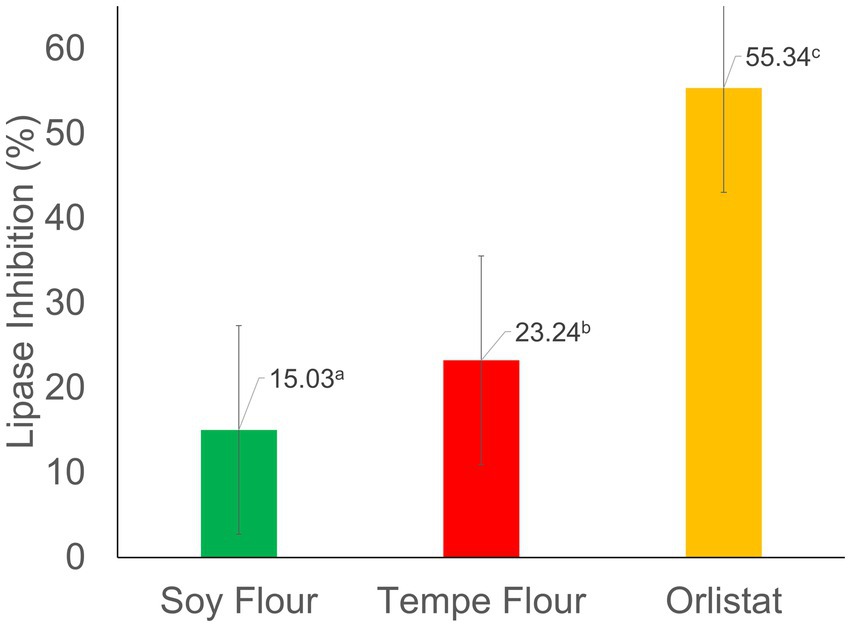
Figure 2. Percentage of lipase inhibition. Values followed by different letters indicate significant differences (p < 0.05).
Lipase, a critical enzyme in lipid metabolism, is a hydrolase that catalyzes the hydrolysis of dietary triglycerides into fatty acids and glycerol within the small intestine. The anti-lipase analysis aims to assess the ability of compounds to inhibit lipase activity, thereby preventing the digestion and subsequent absorption of dietary lipids. Consequently, these components cannot be absorbed by the small intestine and are excreted in the feces. If a compound has this ability, it has the potential to be a candidate for obesity prevention (45).
In vitro, the anti-lipase activity of tempe flour and soybean flour extracts was assessed using a colorimetric spectrophotometric assay. This method simulates the physiological conditions of the human digestive system, requiring pancreatic lipase as the primary enzyme along with its substrate and necessary cofactors to facilitate the enzymatic reaction (27). Pancreatic lipase, known for its high hydrolysis efficiency (50%–70%) for dietary lipids, was employed as the enzyme source in this study (46).
In vitro, anti-lipase activity analysis in soybeans is influenced by the content of antioxidant compounds, such as phenols and saponins, which can inhibit the enzyme’s ability to hydrolyze lipid substrates (47). In this study, it was found that tempe flour had higher antioxidant activity and isoflavone content compared to soybean flour. Phenolic compounds, including flavonoids, inhibit lipase activity by forming stable, irreversible bonds within the enzyme’s active site. The inhibitory potency of these compounds is influenced by their structural complexity, with more complex structures generally exhibiting greater inhibitory activity (48, 49). Polyphenols and saponins inhibit lipase through a competitive mechanism, competing with the substrate at the active site of the enzyme reversibly (50).
The differences in the percentage of lipase enzyme inhibition can be influenced by the extraction method, the type of solvent used, and the solvent-to-sample ratio in the extraction, which affect the bioactive components that can be extracted from the test sample (51). The ability to strongly inhibit lipase enzymes can affect blood cholesterol levels. One mechanism is that when the body breaks down fewer triglycerides, the transport of triglycerides from the lumen to the liver via the bloodstream, which requires a chylomicron structure (lipoprotein), decreases. When there are no triglycerides to transport, chylomicrons are not formed, and thus the amount of cholesterol in the blood also decreases (52).
3.3 Bioactive compound profile and its correlation with bioactivity
The results showed that 58 metabolites were detected (Table 2). Of these, 52 compounds were successfully annotated using an in-house library, and only six compounds remained unidentified. Of the 52 annotated compounds, there were six bioactive compounds in soybean flour and tempe flour, namely 3-hydroxy-3-methylglutaric acid, 4-aminobutyric acid, meso-erythritol, 3-phenyllactic acid, daidzein, and genistein. In addition, there were 20 amino acids and their derivatives, 8 organic acids and their derivatives, 10 carbohydrates and their derivatives, 1 mineral, and 7 other compounds.
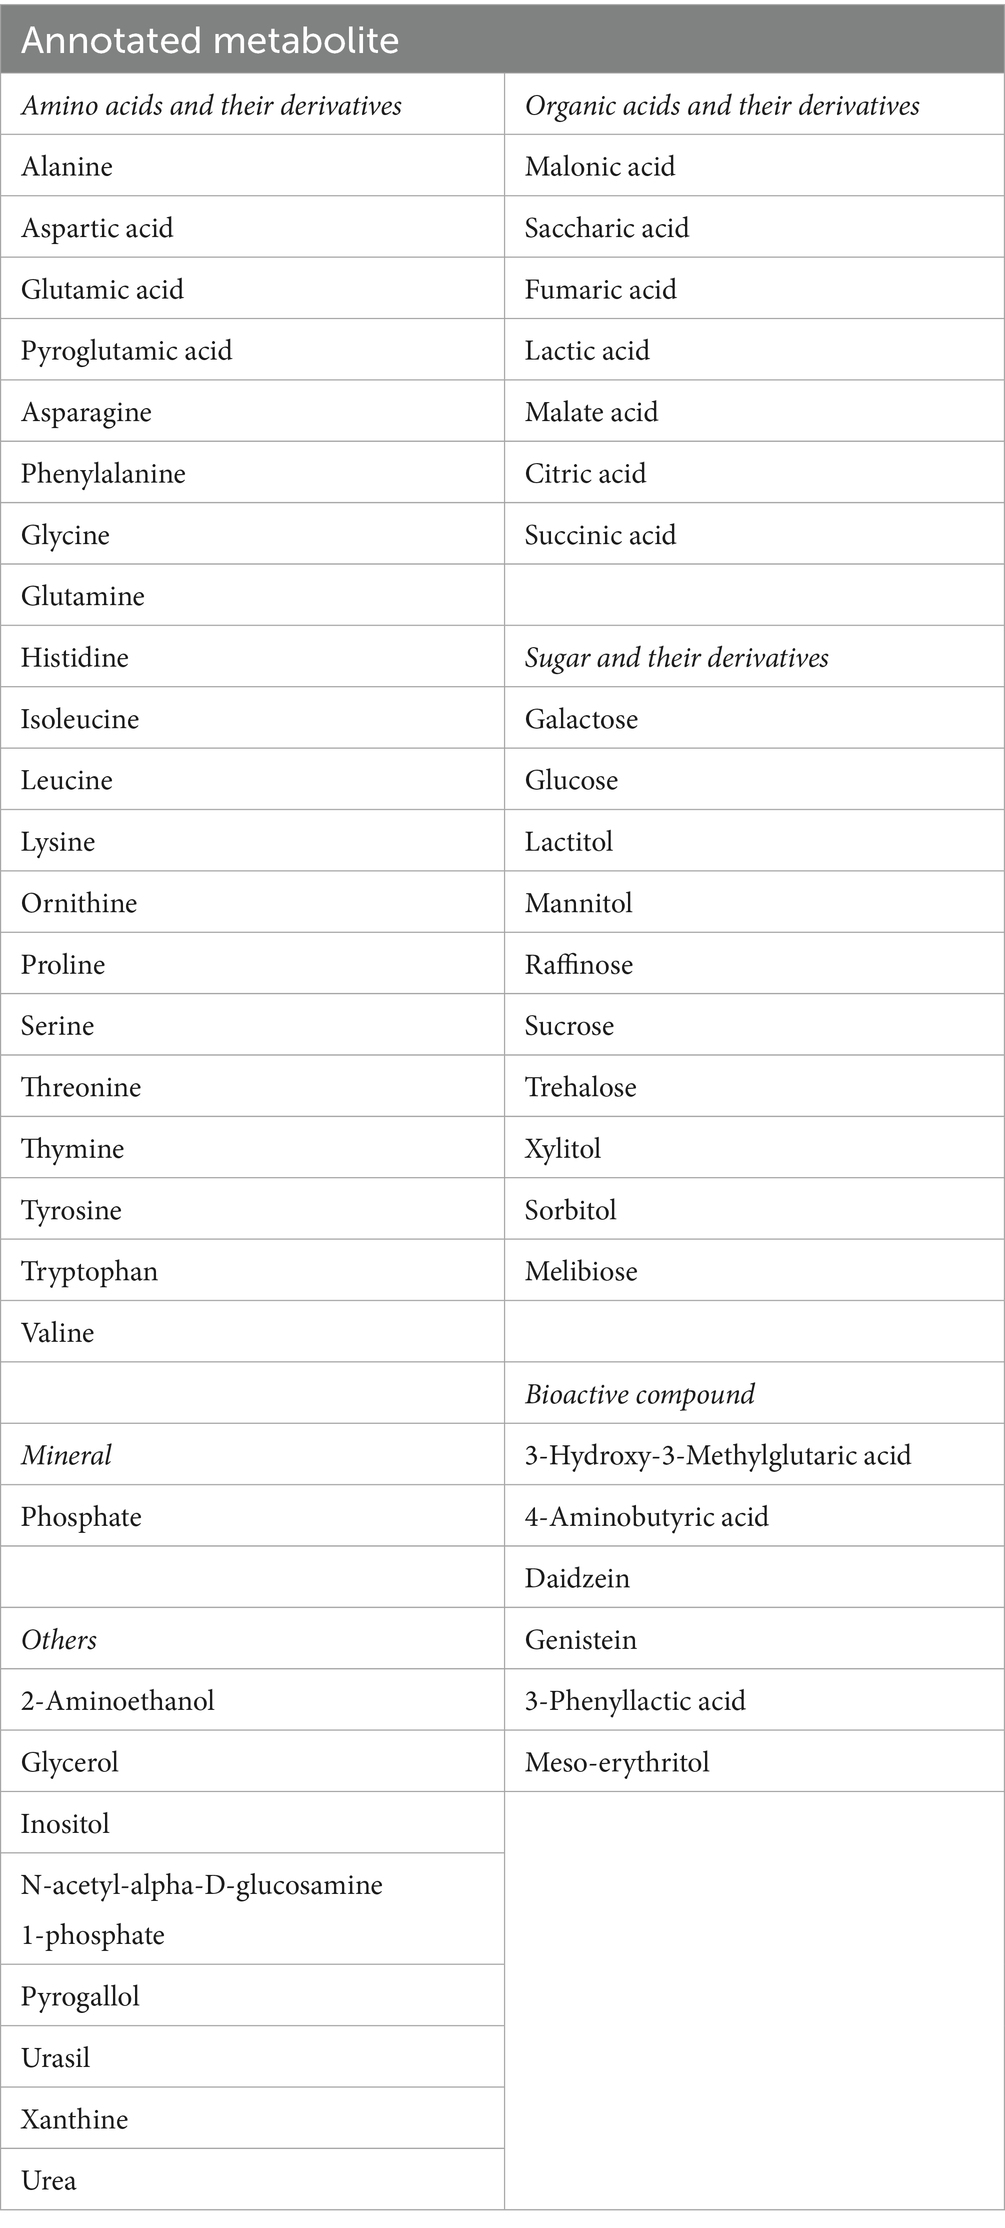
Table 2. Annotated metabolite by GC–MS/MS.
The GC–MS metabolomic data was processed using SIMCA 18 and showed significant differences in the characteristics of soybean flour and tempe flour based on their metabolites. PCA analysis showed that both samples could be well clustered in different quadrants (Figure 3). The metabolite components in tempe flour clustered in the positive quadrant relative to the x-axis, while the metabolite components in soybean flour were separated and located in the negative quadrant relative to the x-axis. Both flours had distinct compounds.
![PCA score plot showing two groups of data points within an ellipse. Green points labeled A1A, A1B, A2A, and A2B represent soy flour and are encircled by a green ellipse. Red points labeled B1A, B1B, B2A, and B2B represent tempe flour and are encircled by a red ellipse. The x-axis is labeled t[1] and the y-axis is labeled t[2].](https://www.frontiersin.org/files/Articles/1622952/fnut-12-1622952-HTML-r1/image_m/fnut-12-1622952-g003.jpg)
Figure 3. Principal component analysis (PCA) score plot of the chemical profiles of tempe flour and soybean flour.
Multivariate data analysis using PCA can illustrate class differences in a dataset, such as mapping differences in chemical profiles (53). The output of PCA is a score plot. The R2X value obtained from this PCA model was 0.87 with a Q2 value of 0.85. Both values are greater than 0.4, indicating that the resulting model is a good representation of the data (54). Metabolomics analysis serves as a valuable approach for comprehensively characterizing the dynamic metabolic shifts that occur during fermentation, enabling a deeper understanding of the biochemical alterations within the food matrix. Fermentation in food alters the food structure, which can increase or decrease the levels of certain compounds due to degradation processes (55). In the field of foodomics, metabolomics analysis is useful for comprehensively capturing these changes at one time. The complexity of fermentation products can be unraveled by identifying thousands of metabolites using analytical instruments. The metabolomics method used was an untargeted profiling analysis or an exploratory method that does not limit the discovery of specific compounds. By employing an untargeted approach, this study maximizes the potential for identifying a diverse range of metabolites, including novel compounds with potential biological significance (56).
Tempe fermentation is the result of synergistic activity between bacteria and fungi. Lactic acid bacterial fermentation is the first stage of the tempe-making process, which occurs during the soaking of boiled soybeans for 12 h at room temperature. Lactic acid bacteria utilize available sugars within the soybean substrate for growth and metabolic activity, resulting in the production of organic acids. This microbial activity leads to a significant reduction in sugar content, as evidenced by the diminished levels observed in tempe flour (Figure 4).
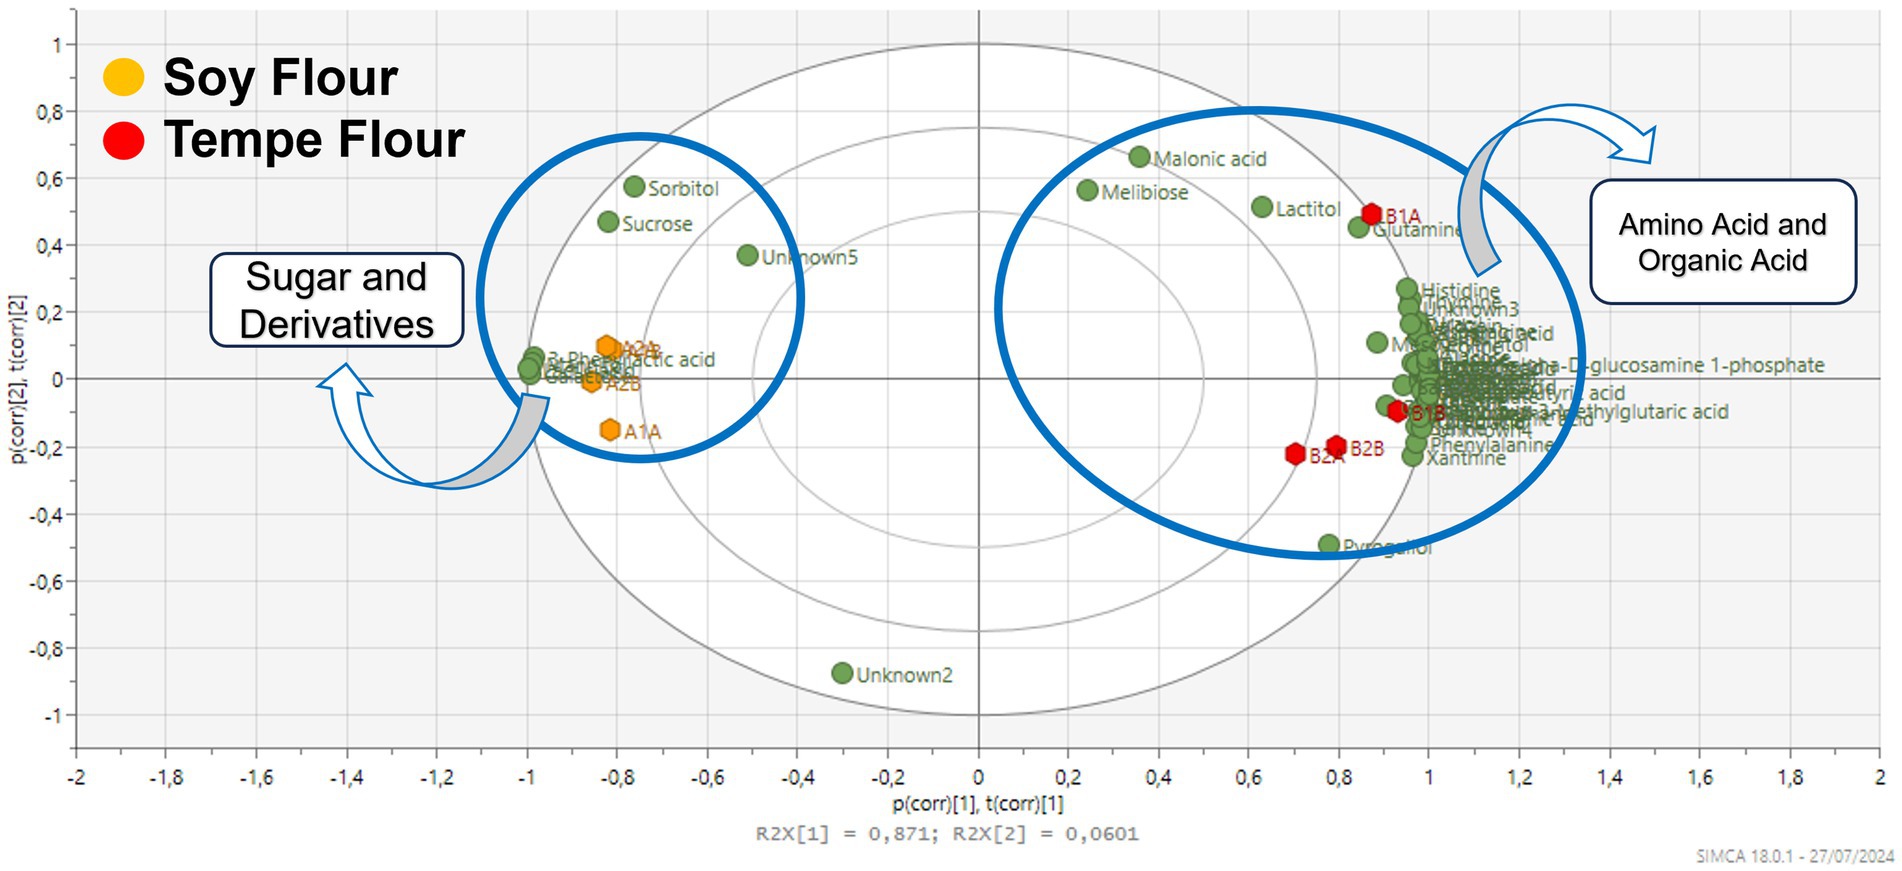
Figure 4. Loading plot of the chemical profile of tempe flour and soybean flour.
Tempe fermentation, facilitated by the action of Rhizopus spp. fungi, results in the accumulation of amino acids due to the degradation of proteins. The proteolytic activity of Rhizopus spp. leads to an increase in amino acids such as lysine, leucine, valine, and tyrosine in tempe, contributing to its characteristic bitter taste (28). Fermentation significantly alters the metabolic composition of soybeans, influencing both nutritional and sensory characteristics (28).
Metabolomic analysis revealed the presence of several derivative amino acids, including ornithine and pyroglutamic acid. Ornithine, a non-protein amino acid derived from arginine, has been shown to exhibit stress-relieving and sleep-promoting effects in clinical studies (57), while pyroglutamic acid is a derivative of glutamic acid. Pyroglutamic acid, another non-protein amino acid, is commonly found in fermented products produced by lactic acid bacteria (58) and exhibits anti-inflammatory and antidepressant effects (59). Both ornithine and pyroglutamic acid were found in higher quantities in tempe flour compared to soybean flour.
3.4 OPLS-based classification of tempe flour and soy flour based on cholesterol binding and anti-lipase activities
The OPLS score plot with Pareto scaling in Figure 5A illustrates the grouping based on cholesterol binding activity. Tempe and soybean flours are consistently separated into distinct quadrants. The OPLS model exhibited excellent performance with R2X = 0.98, R2Y = 0.99, and Q2 = 0.92, indicating a strong model fit. Figure 5B reveals that the cholesterol binding points align with the tempe flour samples in the positive quadrant of the x-axis. This suggests that the high cholesterol binding activity is likely attributed to the group of metabolites located in the same quadrant. Tempe flour samples clustered closely together in the same quadrant as the cholesterol binding points, indicating that tempe contains metabolites that significantly contribute to its high cholesterol binding activity. Metabolites close to the cholesterol points included amino acids and organic acids. These metabolite components are hypothesized to have a positive correlation with cholesterol-binding bioactivity.
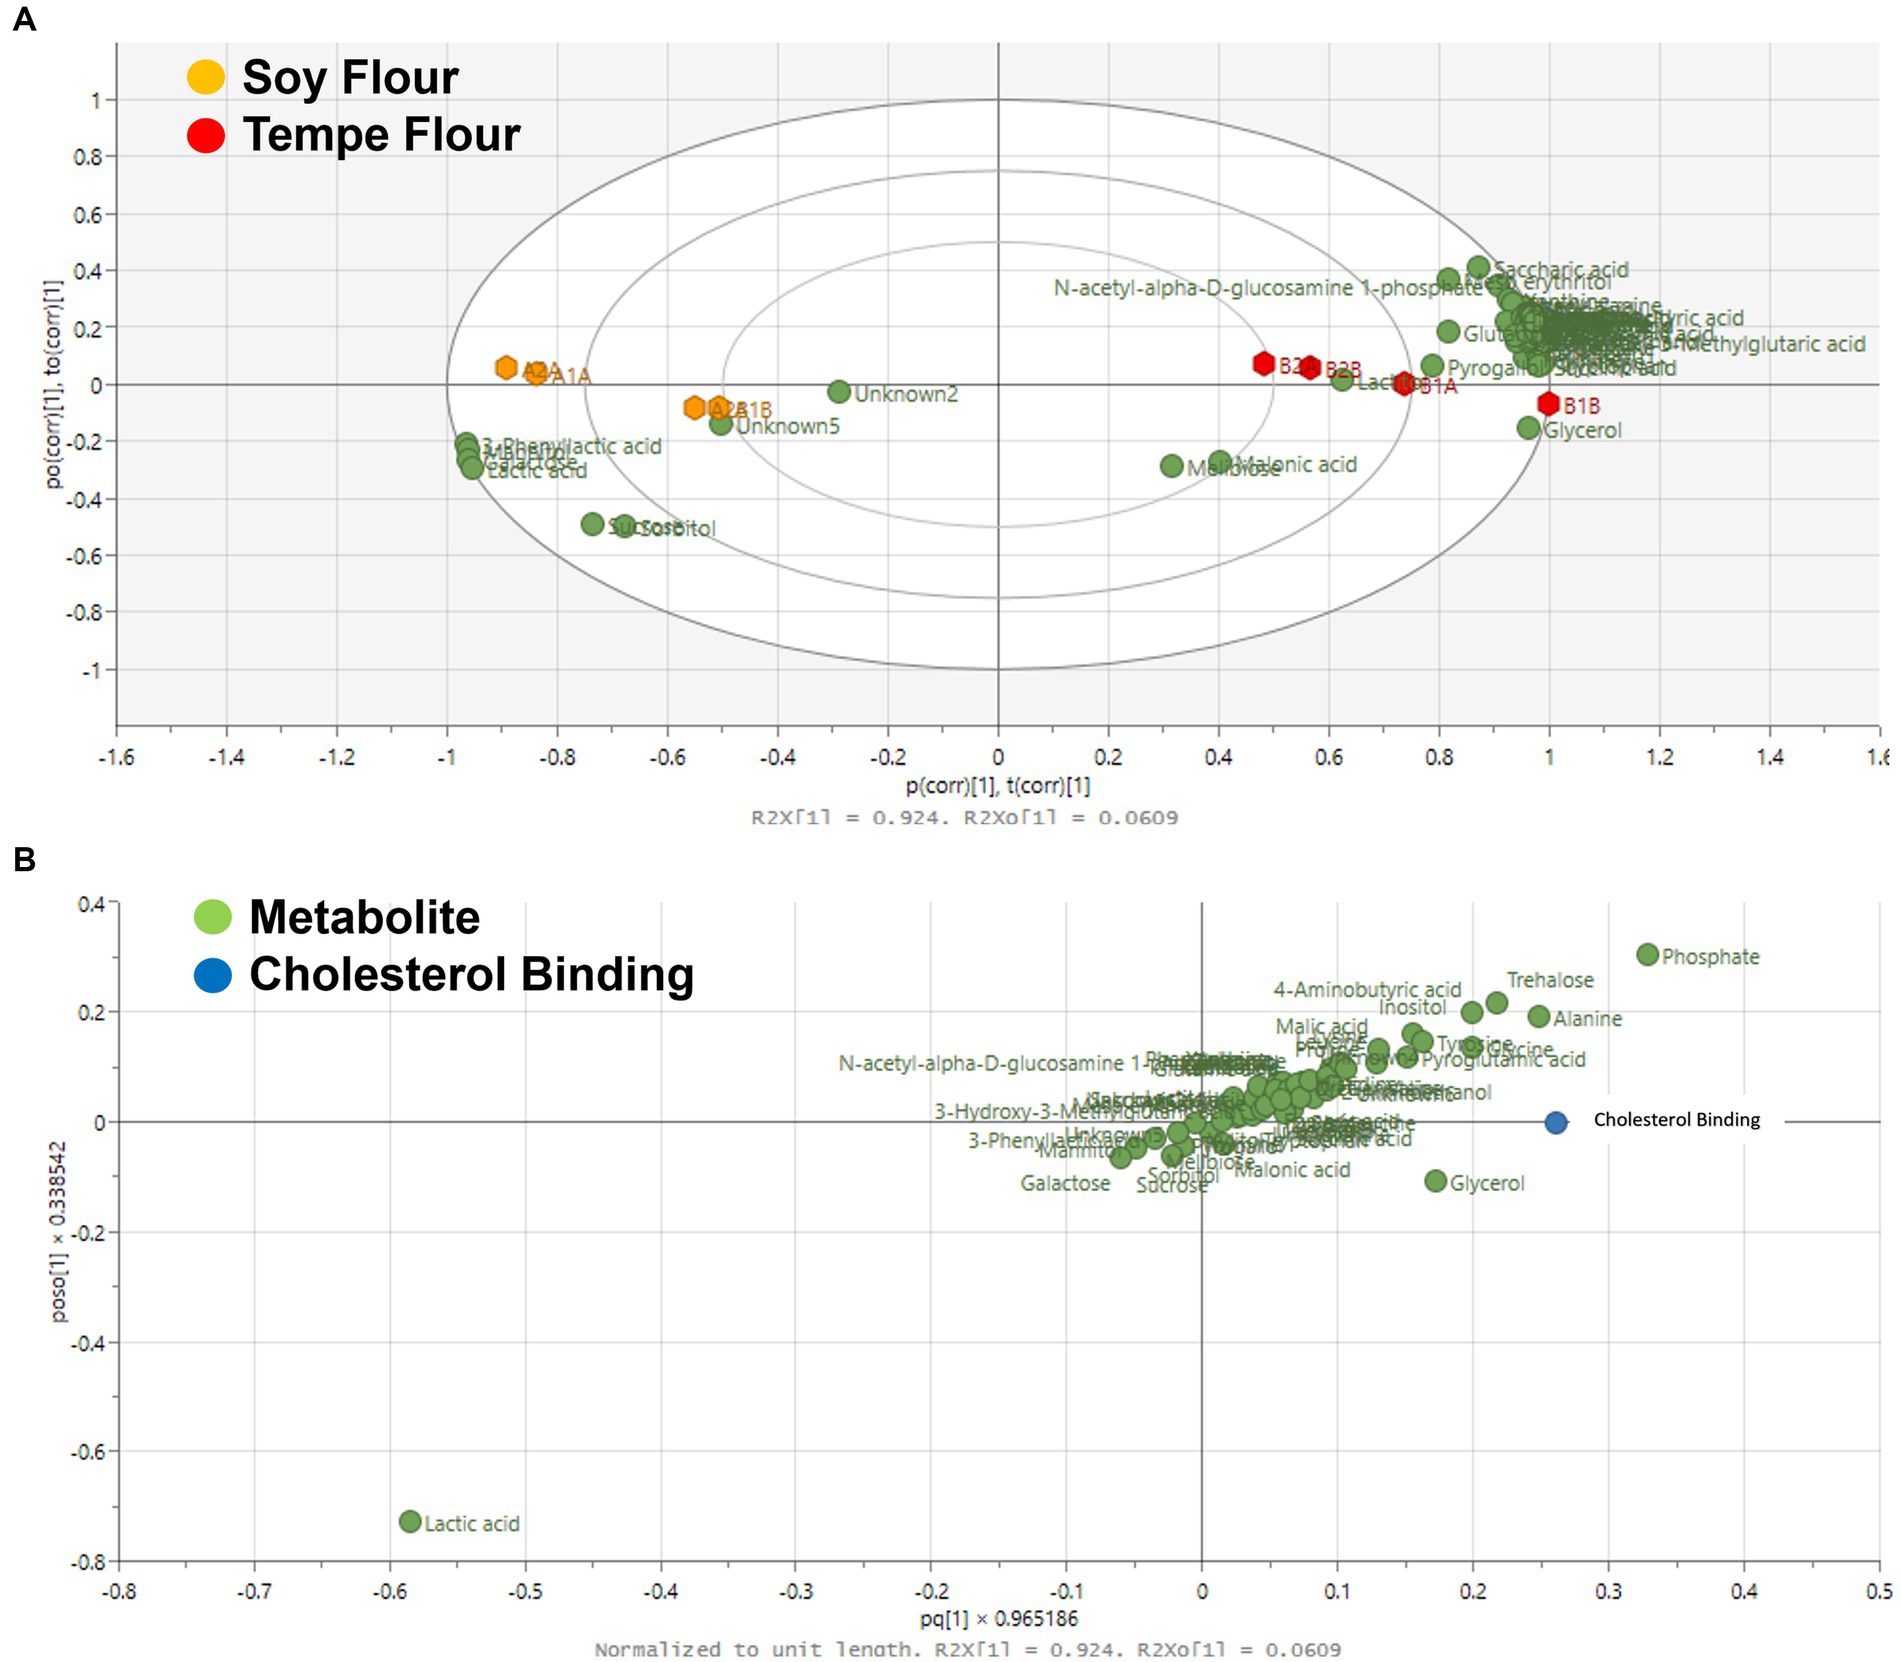
Figure 5. Score plot OPLS (A) and loading plot OPLS (B) based on cholesterol binding activity. (A) The x-axis (t[1]) and y-axis (t[2]) represent the predictive and orthogonal components, respectively. The model parameters R2X[1] = 0.924 and R2X[2] = 0.0609 indicate a strong predictive ability. The plot clearly shows that soy flour and tempe flour samples form two distinct clusters, indicating significant differences in their metabolite composition. (B) The x-axis (p[1]) and y-axis (p[2]) show the correlation of each metabolite with the predictive and orthogonal components. Cholesterol is highlighted as a significant marker distinguishing the two groups, confirming it is one of the key metabolites responsible for the separation between soy flour and tempe flour.
Orthogonal Projections to Latent Structures (OPLS) analysis was employed to examine the correlation between cholesterol binding activity and anti-lipase activity with the metabolite profiles of the two samples. OPLS can be used to assess the relationship between two data matrices, such as chemical profiles and bioactivity data (60). Consequently, this analysis can identify metabolites that contribute to bioactivity. The output of OPLS includes score plots, S-plots, Y-related coefficient plots, and VIP plots. The resulting OPLS model was validated using permutation tests.
Figure 6A presents the OPLS score plot, demonstrating the grouping of samples based on their lipase inhibition activity. Similar to the cholesterol-binding activity, tempe and soybean flour samples cluster distinctly in separate quadrants. The model exhibits excellent performance with R2X = 0.98, R2Y = 0.99, and Q2 = 0.93. Tempe samples consistently cluster in the positive quadrant, while soybean flour samples group in the negative quadrant relative to the x-axis.
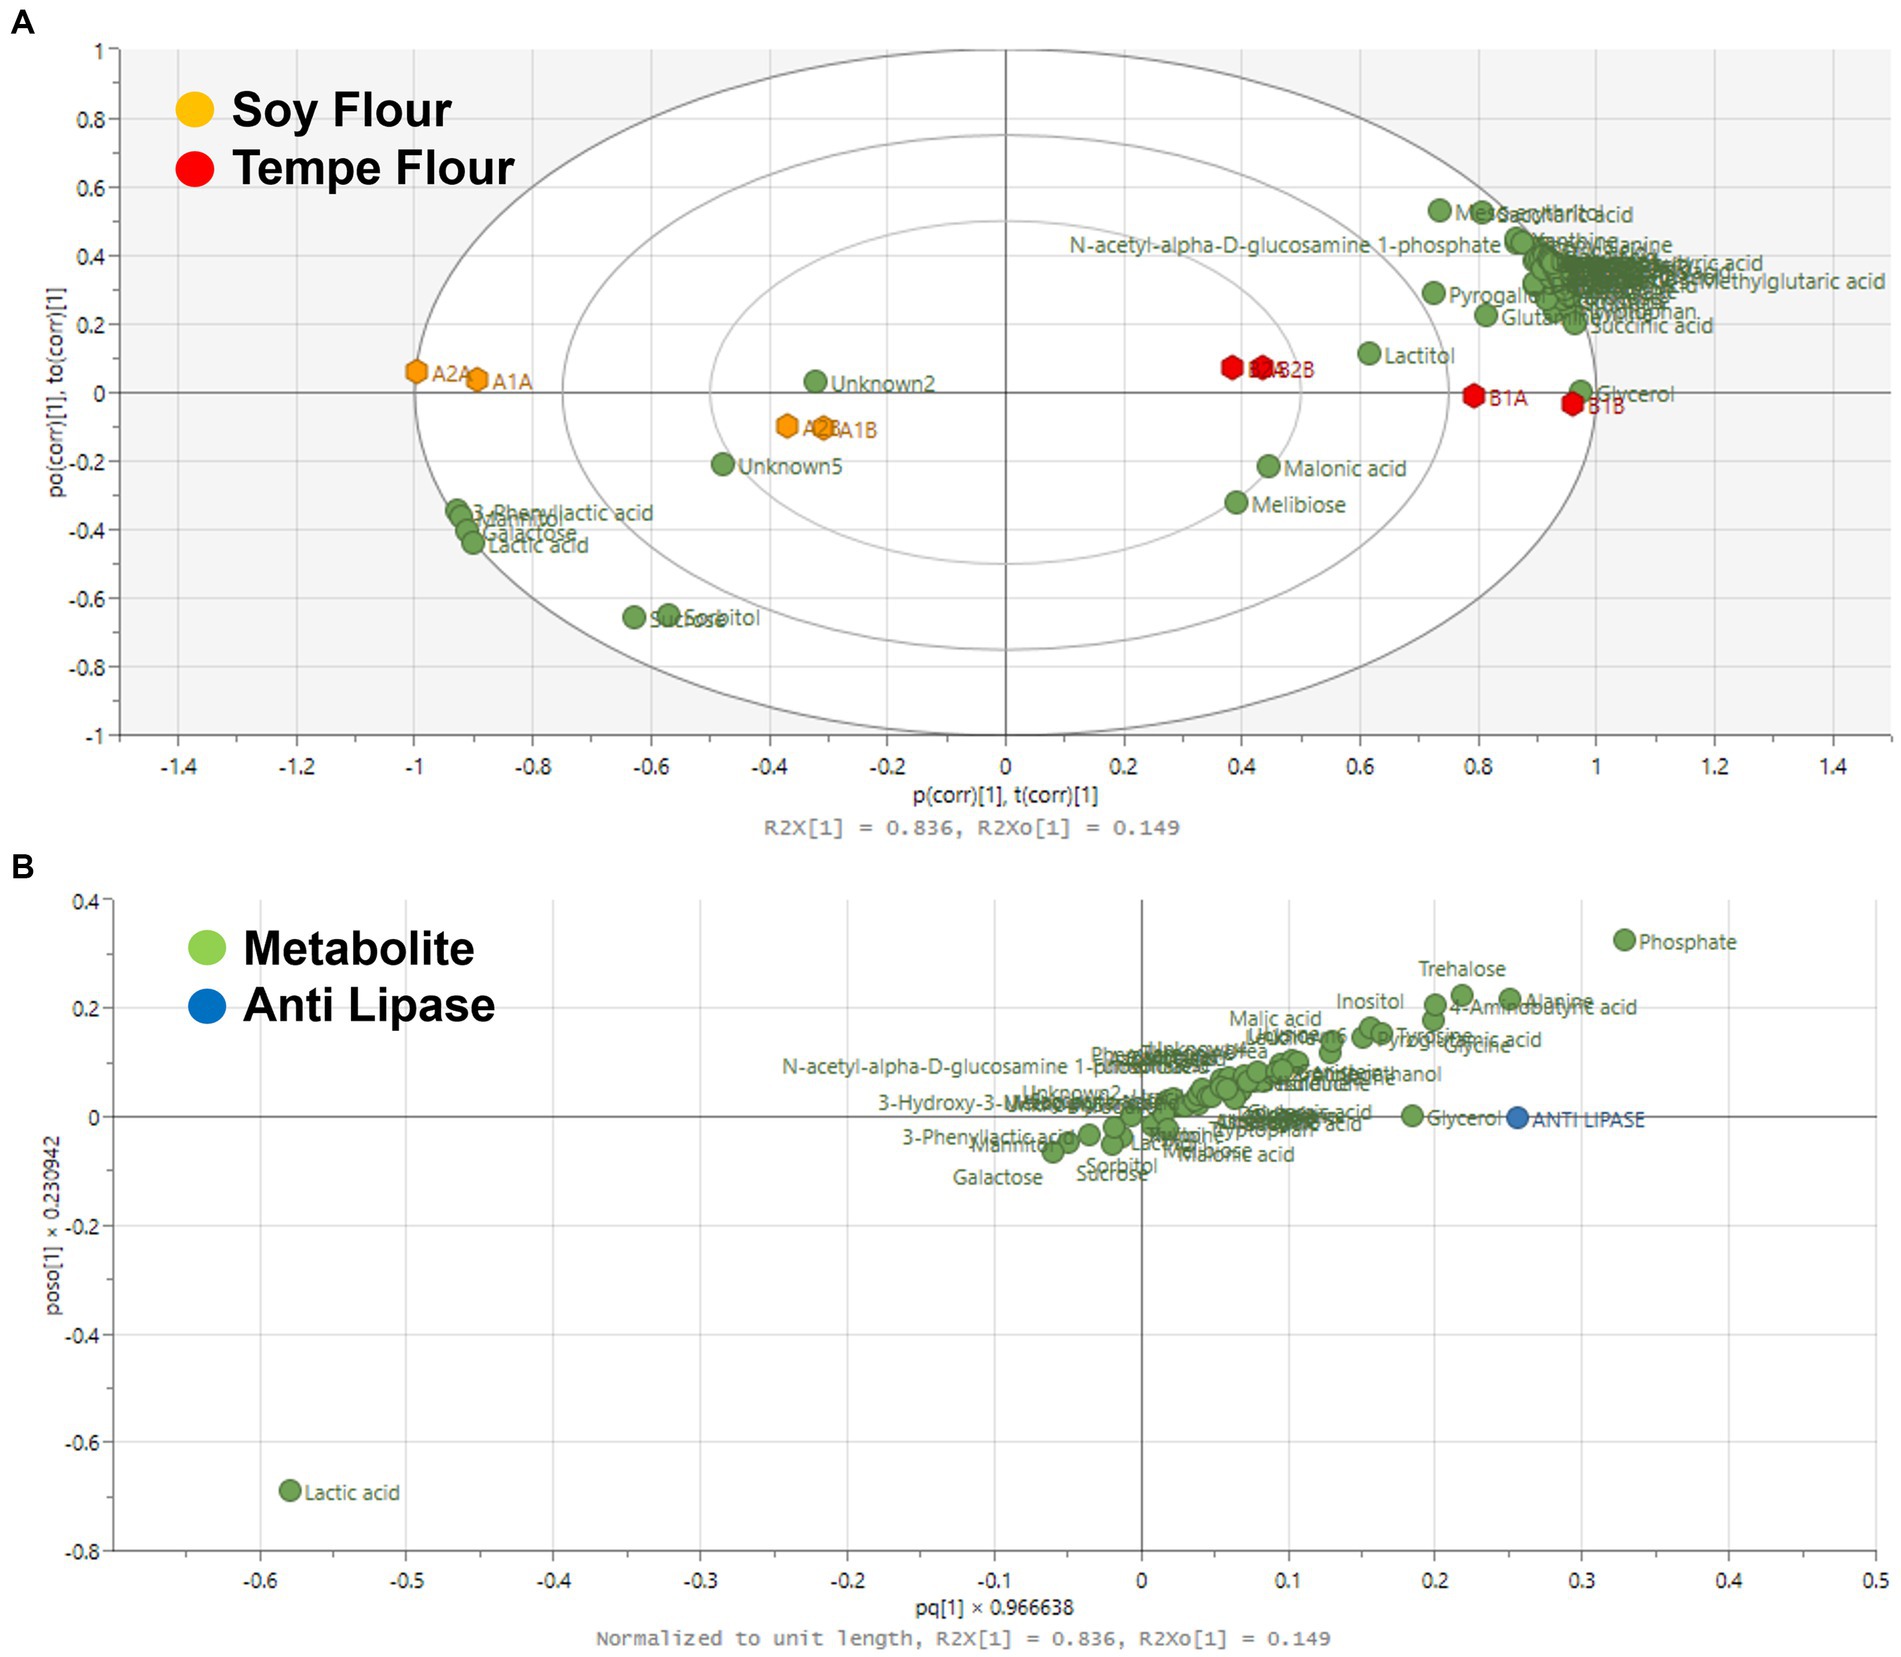
Figure 6. Score plot OPLS (A) and loading plot OPLS (B) based on lipase inhibition activity. (A) The x-axis (t[1]) and y-axis (t[2]) represent the predictive and orthogonal components, respectively. The model parameters R2X[1] = 0.836 and R2X[2] = 0.149 indicate a strong predictive ability. The plot clearly shows that soy flour and tempe flour samples form two distinct clusters, indicating significant differences in their metabolite composition. (B) The x-axis (p[1]) and y-axis (p[2]) show the correlation of each metabolite with the predictive and orthogonal components. Anti lipase is highlighted as a significant marker distinguishing the two groups, confirming it is one of the key metabolites responsible for the separation between soy flour and tempe flour.
The OPLS loading plot (Figure 6B) illustrates the relationship between individual metabolites and lipase inhibition. The lipase inhibition point is in the positive quadrant of the x-axis, closely aligned with one tempe sample but within the same quadrant as three other tempe samples. Similarly to the cholesterol-binding activity, all soybean flour samples are positioned in the opposite quadrant. Metabolites closest to the lipase inhibition point, such as amino acids, exhibit a positive correlation with lipase inhibition activity. This suggests that a higher abundance of these metabolites in tempe samples is associated with increased lipase inhibition.
3.5 Identification of key metabolites
To specifically identify the metabolites contributing to the OPLS model and their correlation with cholesterol binding and anti-lipase activities, Y-related coefficient, VIP, and S-plot analyses were conducted. Metabolites with VIP scores greater than 1 are considered to have a strong influence on the OPLS model and the separation of samples based on the relationship between X (metabolites) and Y (bioactivity) (61). Positive correlation coefficients (>0) indicate a strong positive correlation, while negative coefficients (<0) suggest a negative or reducing correlation (62). S-plots visualize the intensity of the correlation between metabolites and bioactivity based on their quadrant location. Metabolites in the upper right quadrant have a strong positive correlation, while those in the lower left quadrant have a weak negative correlation. Metabolites in the center have a negligible correlation. The combination of VIP, Y-related coefficient, and S-plot provides a comprehensive assessment of the importance of metabolites in the OPLS model and their relationship with bioactivity.
Supplementary Figures S1A–C, S2A–C present the scores for Y-related coefficient, S-plot, and VIP for cholesterol binding and lipase inhibition activities, respectively. Both bioactivities showed a strong positive correlation with amino acids and organic acids, as indicated by the Y-related coefficient and S-plot. Of the analyzed metabolites, 50 exhibited a positive correlation coefficient (>0), while 8 had a negative correlation coefficient (<0) in the Y-related coefficient plot.
The highest correlation score for both bioactivities was observed for phosphate metabolites, while the lowest score was found for lactic acid (−2.28). These results align with the S-plot, which shows phosphate metabolites in the upper right quadrant and lactic acid in the lower left quadrant. A significant advantage of the S-plot is its ability to visually identify metabolites with negligible correlations to bioactivity, as these metabolites are scattered in the central region of the plot. The study revealed that several organic acids, such as malonic acid and phenyl lactic acid, as well as certain carbohydrate derivatives, exhibited weak or negligible correlations with bioactivity. Metabolites with negligible correlations had correlation values close to zero.
To identify the specific metabolites contributing to model formation and sample separation, VIP scores were calculated for both models. The results showed that both models had 12 metabolites with VIP scores greater than 1.0, as presented in Table 3, and Y-related coefficient values ranging from 0.4 to 1.29. Lactic acid was the only metabolite that exhibited a negative correlation with both bioactivities but was a dominant contributor to the OPLS modeling. Of the remaining 11 biomarker metabolites, one was a mineral (phosphate), two were carbohydrates or their derivatives (trehalose and inositol), one was a lipid component (glycerol), four were amino acids (alanine, glycine, tyrosine, valine), and three were organic acids (4-aminobutyric acid, malic acid, pyroglutamic acid).
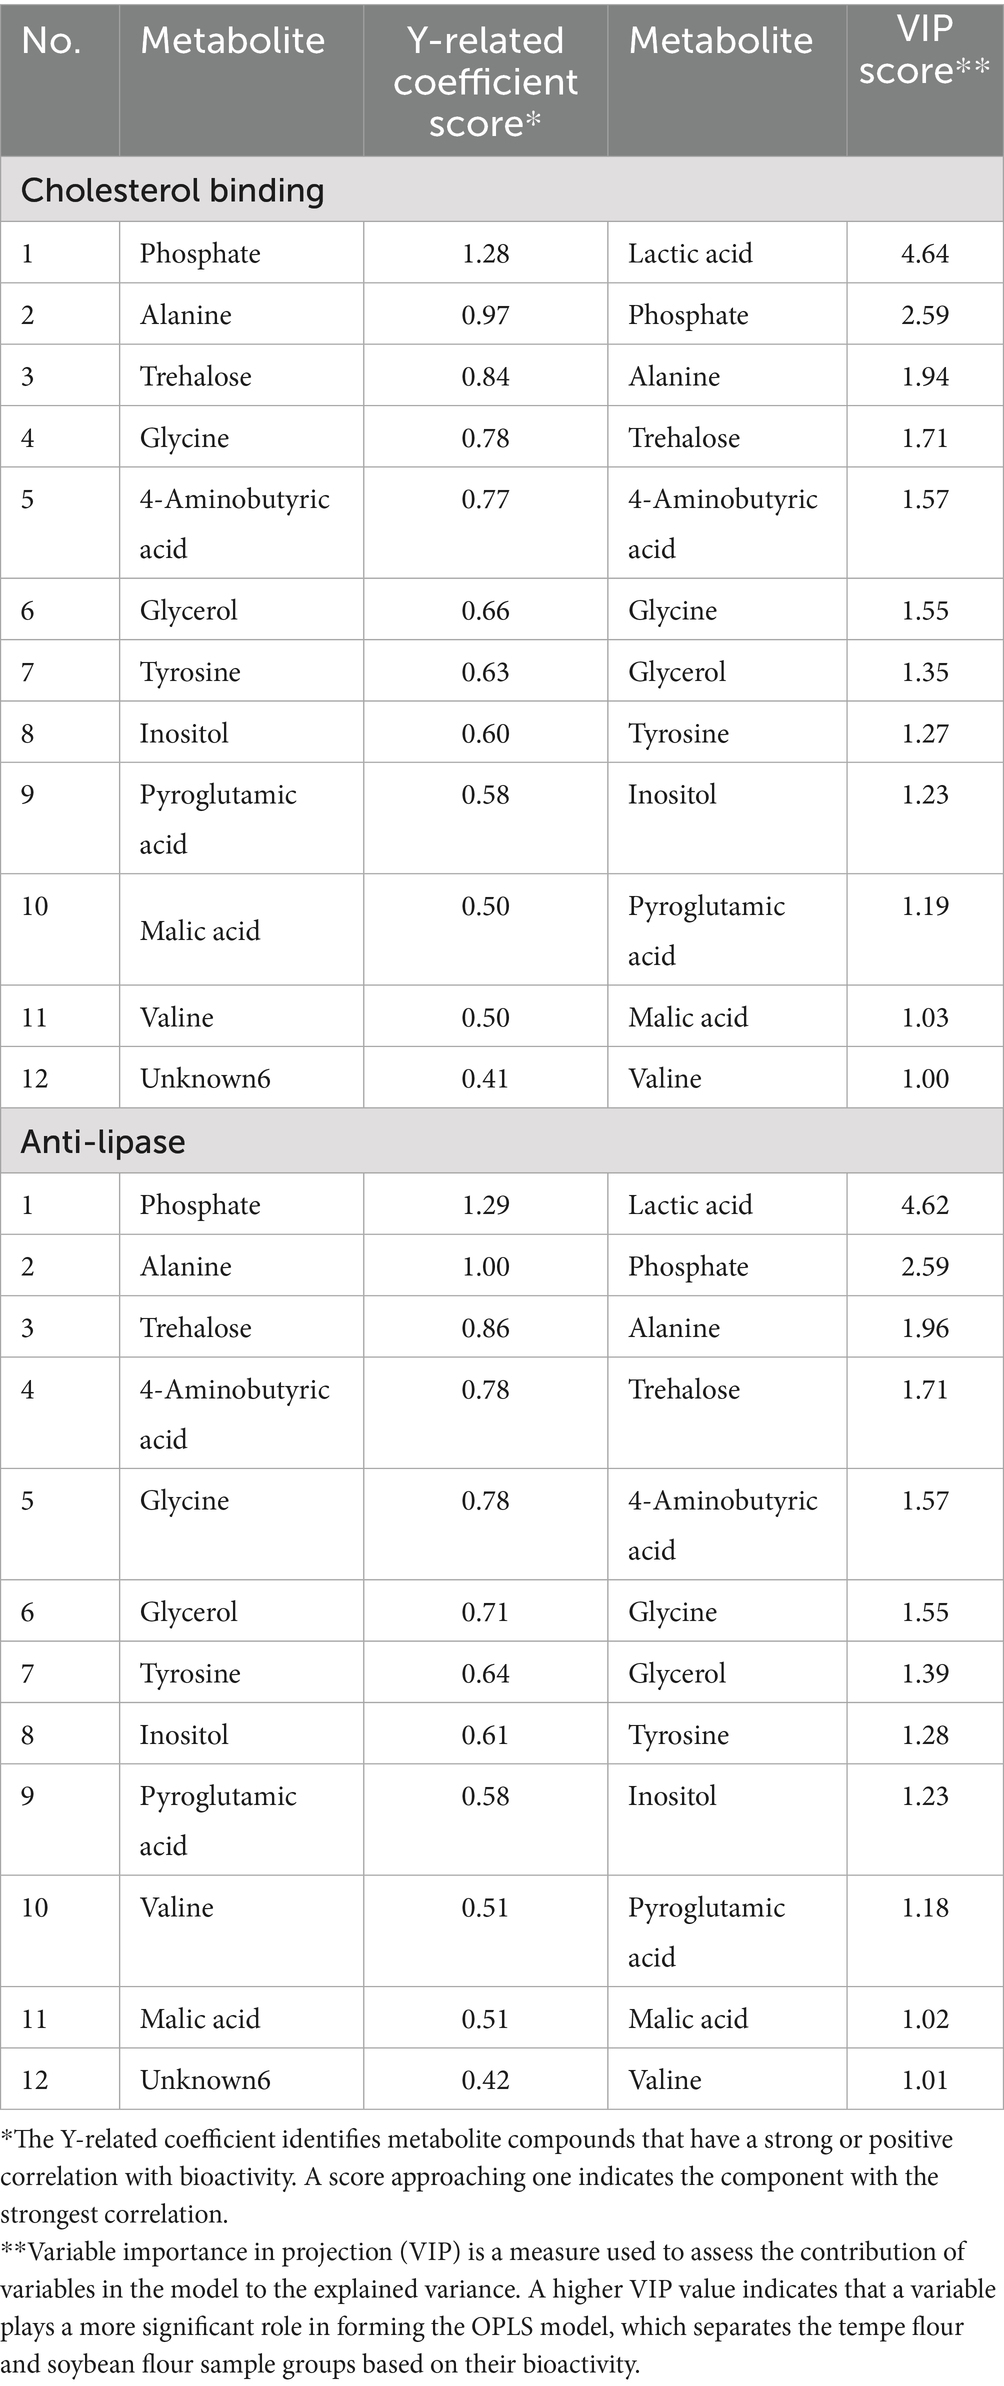
Table 3. Y-related coefficient and VIP score of bioactivity.
Phosphates, trehalose, inositol, and glycerol, metabolites formed during fermentation, contributed significantly to the clustering of tempe and soybean flour samples in PCA and OPLS analyses. The presence of these metabolites in higher concentrations in tempe flour can be attributed to the action of fungal enzymes. For instance, Rhizopus spp. possess phytase, which hydrolyzes phytate into phosphate and inositol (63), while yeasts metabolize glucose to produce trehalose and glycerol (8, 64, 65). Regarding the bioactivity of cholesterol binding and lipase inhibition, there have been no reports that the four metabolites identified can directly bind to cholesterol or inhibit lipase activity. Phosphate, for example, is an essential mineral for human health, particularly for bone health. However, a study by Trauttvetter et al. (66) found that the minerals calcium and phosphorus can form amorphous molecules that bind to bile acids in the small intestine, thus reducing blood cholesterol levels. Similarly, a meta-analysis by Tabrizi et al. (67) reported that inositol supplementation in patients with metabolic diseases can help improve blood lipid profiles by reducing cholesterol and triglyceride levels. Likewise, trehalose, a disaccharide component, can improve blood lipid profiles. In vivo studies have shown that trehalose can suppress fat absorption in the small intestine and increase its excretion via feces (68).
Amino acids and organic acids were also major contributors to the increased bioactivity and the OPLS modeling. While the specific mechanism of alanine’s influence on lipid metabolism remains unclear, glycine has been shown to reduce the risk of heart disease by lowering homocysteine levels (69). Branched-chain amino acids like valine have anti-atherogenic effects, and when combined with leucine, can reduce triglyceride and total cholesterol levels while increasing HDL-cholesterol (70). Furthermore, a synergistic effect between tyrosine and tryptophan has been observed, where specific ratios of these amino acids can effectively normalize triglyceride levels and reduce LDL-cholesterol in animal models of high-fat diet-induced obesity (71).
Gamma amino butyric acid (GABA) or 4-aminobutyric acid is similar compound which have four-carbon non-protein amino acid (72), a neurotransmitter, has been reported to have beneficial effects in preventing dyslipidemia. Malic acid and pyroglutamic acid, with VIP values of 1.02–1.19, indicated their significant roles in cholesterol binding and lipase inhibition. Studies on plums, rich in malic acid, have shown anti-lipase activity (73). Given that lipase activity is optimal at a pH of 7.5–8.5 (74), the presence of organic acids in fermented products may inhibit lipase activity by creating an acidic environment (75).
3.6 Model validation
The OPLS models were validated using R2Y and Q2Y values, with values closer to 1 indicating a better fit. The obtained R2Y and Q2Y values for both cholesterol binding and lipase inhibition models were high, suggesting good model performance (Supplementary Figure S3). Further validation was performed using permutation tests and CV-ANOVA (Supplementary Tables S1, S2), which confirmed the robustness of the models. While the study provided valuable insights, the relatively small sample size (n = 8) limited the generalizability of the findings. Future studies with larger sample sizes are recommended to enhance the robustness of the models and provide more conclusive evidence.
3.7 Bioactive components in tempe and soybean flours
GC–MS analysis identified six dominant bioactive compounds: 3-hydroxy-3-methylglutaric acid, 4-aminobutyric acid (GABA—Gamma aminobutyric acid), meso-erythritol, daidzein, and genistein in tempe flour, while 3-phenyllactic acid was predominantly found in soybean flour (Figure 7). These bioactive compounds are known to exert various effects on cholesterol metabolism. Based on the literature, only meso-erythritol and 3-phenyllactic acid have not been directly linked to cholesterol metabolism.
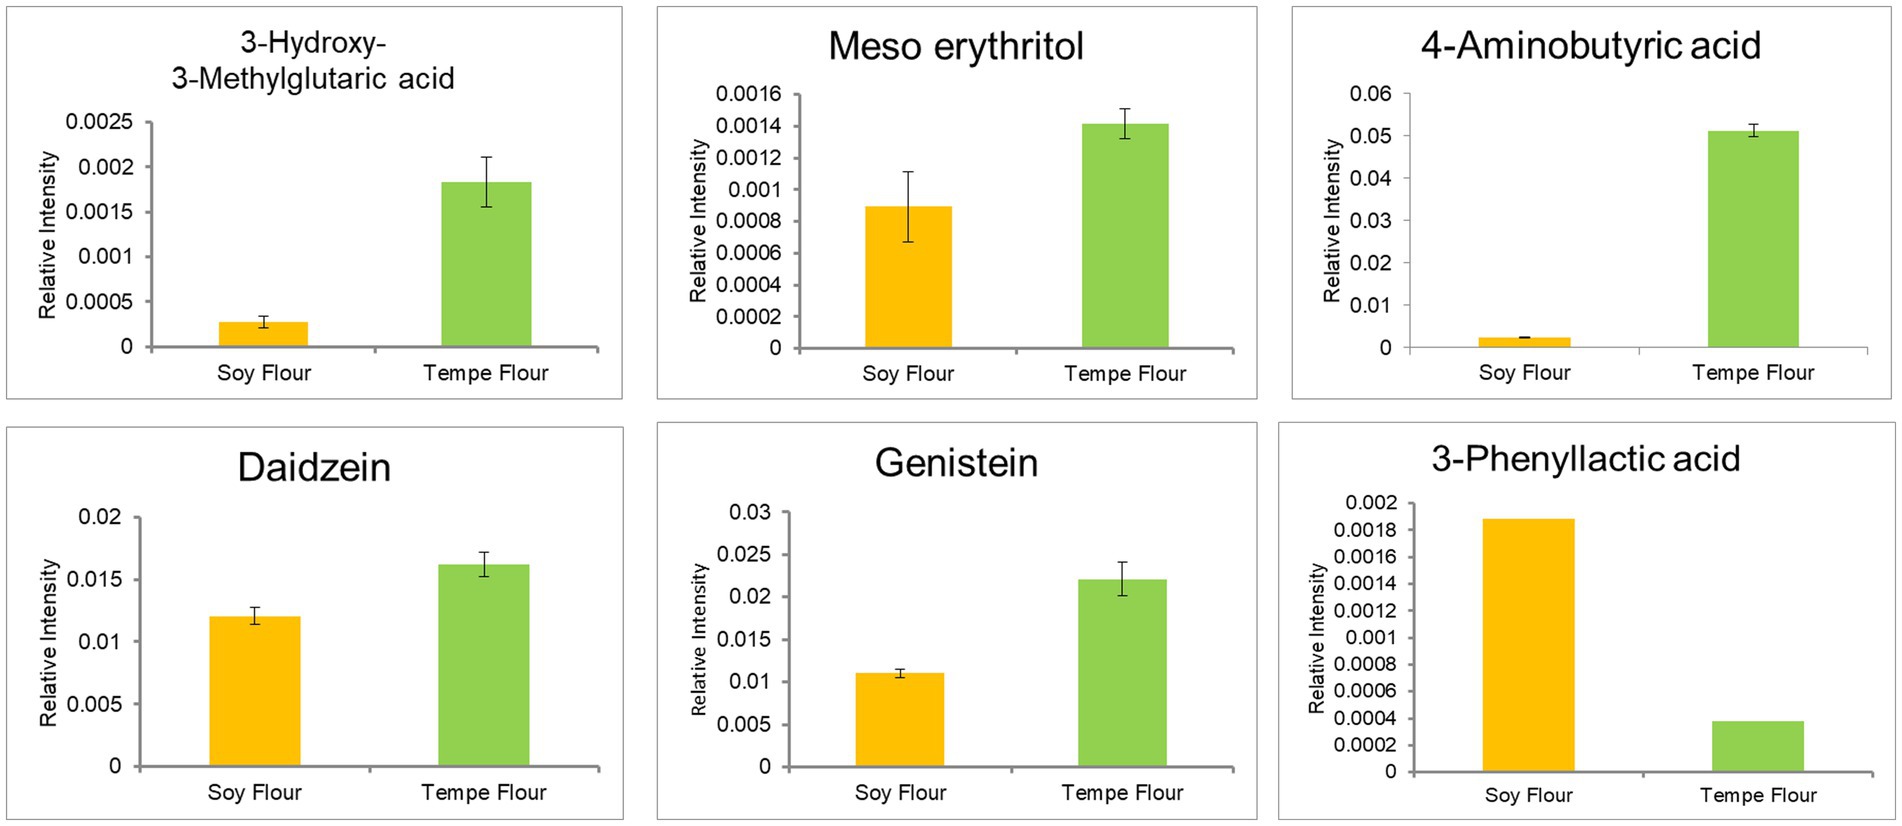
Figure 7. Bioactive compound of tempe flour and soybean flour.
Meso-erythritol, a sugar alcohol, is classified as a food additive by the European Commission Regulation No 231/2012 and is produced through carbohydrate fermentation. With a very low glycemic index (GI: 0), it is considered safe for consumption by individuals with diabetes and obesity (76). While it has negligible caloric content and minimal side effects, excessive consumption may lead to laxative effects. However, studies have shown that consumption of up to 50 g of erythritol does not induce laxative symptoms (77).
3-Phenyllactic acid is a compound produced by lactic acid bacteria and exhibits antifungal properties (78). To date, there is limited literature on its potential hypocholesterolemic or hypolipidemic effects. Therefore, this bioactive compound may have a weak or even negative contribution to cholesterol reduction and lipolysis inhibition based on the OPLS analysis
Another bioactive component, 3-hydroxy-3-methylglutaric acid (HMG) or meglutol, is an organic acid complex with hypolipidemic effects and is commonly found in seeds (79). Recent research by Iman et al. (80) detected increased levels of this compound in fermented edamame, suggesting a role in regulating blood cholesterol. Subsequent research by the same group (81) demonstrated that meglutol can lower LDL-cholesterol in plasma and is found in the highest concentrations in pea tempe. The mechanism of action involves inhibiting endogenous cholesterol synthesis by acting as an inhibitor of HMG-CoA reductase, the enzyme that converts mevalonate to cholesterol (82). This mechanism is similar to that of statins, which are widely used to treat hypercholesterolemia.
While the mechanism of gamma aminobutyric acid (GABA) in lowering blood cholesterol is less well understood, numerous in vivo and clinical studies have shown that GABA supplementation can reduce total cholesterol, LDL-cholesterol, and triglycerides while increasing HDL cholesterol (83–85). GABA has also been shown to prevent atherosclerosis by inhibiting the formation of foam cells in macrophages, thus reducing the risk of blood clots (86). Additionally, GABA can decrease adipogenesis and lipogenesis while increasing energy expenditure. In obese rats, GABA supplementation prevented weight gain despite a high-fat diet (87).
GABA is produced through the decarboxylation of glutamate. It can be synthesized chemically or, more environmentally friendly, through fermentation. During fermentation, lactic acid bacteria produce glutamate decarboxylase (GAD) enzyme, which catalyzes the synthesis of GABA from L-glutamate using pyridoxal-5-phosphate (PLP) as a cofactor (88, 89). Therefore, the fermentation process in tempe production enhances GABA concentration.
Similar to GABA, the soybean isoflavones daidzein and genistein have been reported to have hypocholesterolemic effects, although the mechanisms are not fully understood. Genistein is more potent than daidzein in lowering plasma cholesterol (90, 91). Genistein has the potential to inhibit cholesterol synthesis by targeting HMG-CoA reductase. Computational studies by Hermanto et al. (92) suggest that genistein has a high affinity for HMG-CoA reductase and low toxicity, making it a promising candidate for cholesterol reduction. Isoflavones also exhibit anti-obesity effects, with genistein preventing fat accumulation and daidzein reducing inflammation in obese individuals (93). Isoflavone consumption can prevent adipogenesis through specific mechanisms in the body (94, 95).
4 Conclusion
This study demonstrated that tempe flour exhibits higher cholesterol binding activity and lipase inhibition activity compared to soybean flour. Metabolomic analysis using the orthogonal partial least squares (OPLS) method revealed a group of biomarker compounds that were strongly and positively correlated with cholesterol binding and anti-lipase bioactivities. These biomarkers included bioactive compounds derived from amino acids and organic acids. GC–MS analysis identified higher levels of bioactive compounds such as meglutol (3-hydroxy-3-methylglutarate), GABA (gamma aminobutyric acid or 4-aminobutyric acid), and isoflavones in tempe flour. These compounds are believed to play significant roles in human cholesterol and lipid metabolism.
Data availability statement
The original contributions presented in the study are included in the article/Supplementary material, further inquiries can be directed to the corresponding author.
Author contributions
MA: Writing – review & editing, Validation, Supervision, Methodology, Conceptualization, Funding acquisition. AT: Formal analysis, Writing – review & editing, Writing – original draft. SS: Writing – review & editing, Project administration, Writing – original draft. TW: Writing – review & editing, Supervision, Resources, Conceptualization. DA: Validation, Supervision, Writing – review & editing. FE: Data curation, Formal analysis, Writing – original draft. RR: Data curation, Writing – original draft. SP: Supervision, Writing – review & editing, Validation.
Funding
The author(s) declare that financial support was received for the research and/or publication of this article. The authors are very grateful for financial support from IPB University through the “Riset Kolaborasi Indonesia” scheme, the fiscal year 2025, contract number 14989/IT3.D10/PT.01.03/P/B/2025, under MA.
Conflict of interest
The authors declare that the research was conducted in the absence of any commercial or financial relationships that could be construed as a potential conflict of interest.
Generative AI statement
The authors declare that no Gen AI was used in the creation of this manuscript.
Any alternative text (alt text) provided alongside figures in this article has been generated by Frontiers with the support of artificial intelligence and reasonable efforts have been made to ensure accuracy, including review by the authors wherever possible. If you identify any issues, please contact us.
Publisher’s note
All claims expressed in this article are solely those of the authors and do not necessarily represent those of their affiliated organizations, or those of the publisher, the editors and the reviewers. Any product that may be evaluated in this article, or claim that may be made by its manufacturer, is not guaranteed or endorsed by the publisher.
Supplementary material
The Supplementary material for this article can be found online at: https://www.frontiersin.org/articles/10.3389/fnut.2025.1622952/full#supplementary-material
References
1. Ali, NM, Yeap, SK, Yusof, HM, Beh, BK, Ho, WY, Koh, SP, et al. Comparison of free amino acids, antioxidants, soluble phenolic acids, cytotoxicity and immunomodulation of fermented mungbean and soybean. J Sci Food Agric. (2016) 96:1648–58. doi: 10.1002/jsfa.7267
2. Kementerian Kesehatan [KEMENKES]. Laporan Tematik Survei Kesehatan Indonesia Tahun 2023: Potret Kesehatan Indonesia. Jakarta: Kementerian Kesehatan (2024).
3. Firdaus, M, Astawan, M, Muchtadi, D, Wresdiyati, T, Waspadji, S, and Karyono, SS. Prevention of endothelial dysfunction in streptozotocin-induced diabetic rats by Sargassum echinocarpumn extract. Med J Indones. (2010) 19:32–5. doi: 10.13181/mji.v19i1.382
4. Astawan, M, Wresdiyati, T, Subarna,, Rokaesih,, and Yoshari, RM. Functional properties of Tempe protein isolates derived from germinated and non-germinated soybeans. IOP Conf Ser. (2020) 443:012001. doi: 10.1088/1755-1315/443/1/012001
5. Astawan, M, Prayudani, APG, Haekal, M, Wresdiyati, T, and Sardjono, RE. Germination effects on the physicochemical properties and sensory profiles of velvet bean (Mucuna pruriens) and soybean tempe. Front Nutr. (2024) 11:1383841. doi: 10.3389/fnut.2024.1383841
6. Roth, GA, Mensah, GA, Jhonson, CO, Addolorato, G, Ammirati, E, Baddour, LM, et al. Global burden of cardiovascular diseases and risk factors, 1990–2019. J Am Coll Cardiol. (2020) 76:2982–3021. doi: 10.1016/j.jacc.2020.11.010
7. Liu, T, Zhao, D, and Qi, Y. Global trends in the epidemiology and management of dyslipidemia. J Clin Med. (2022) 11:6377. doi: 10.3390/jcm11216377
8. Romulo, A, and Surya, R. Tempe: a traditional fermented food of Indonesia and its health benefits. Int J Gastron Food Sci. (2021) 26:100413. doi: 10.1016/j.ijgfs.2021.100413
9. Rachmawati, NA, Astawan, M, Wresdiyati, T, and Yoshari, RM. The effects of tempe protein isolate from non-germinated and germinated soybean on oxidative stress in diabetic rats. Food Res. (2023) 7:14–26. doi: 10.26656/fr.2017.7(S1).19
10. Nurkolis, F, Taslim, NA, Lee, D, Park, MN, Moon, S, Hardinsyah, H, et al. Mechanism of action of isoflavone derived from soy-based tempeh as an antioxidant and breast cancer inhibitor via potential upregulation of miR-7-5p: a multimodal analysis integrating pharmacoinformatics and cellular studies. Antioxidants. (2024) 13:632. doi: 10.3390/antiox13060632
11. Astuti, M, Meliala, A, Dalais, FS, and Wahlqvist, ML. Tempe, a nutritious and healthy food from Indonesia. Asia Pac J Clin Nutr. (2000) 9:322–5. doi: 10.1046/j.1440-6047.2000.00176.x
12. Damayanti, AF, Astawan, M, Wresdiyati, T, and Sardjono, RE. The potential of velvet bean tempe to improve hematology and serum biochemical profiles in experimental rats. IOP Conf Ser Earth Environ Sci. (2024) 1359:012007:1–9. doi: 10.1088/1755-1315/1359/1/012007
13. Yuliani, S, Juniawati, R, and Suryana, EA. Characteristics of tempeh prepared from several varieties of Indonesian soybeans: correlations between soybean size and tempeh quality properties. IOP Conf Ser Earth Environ Sci. (2022). doi: 10.1088/1755-1315/1024/1/012051
14. Polanowska, K, Grygier, A, Kuligowski, M, Rudzińska, M, and Nowak, J. Effect of tempe fermentation by three different strains of Rhizopus oligosporus on nutritional characteristics of faba beans. LWT-Food Sci Technol. (2020) 122:109024. doi: 10.1016/j.lwt.2020.109024
15. Astawan, M, Mardhiyyah, YS, and Wijaya, CH. Potential of bioactive components in tempe for the treatment of obesity. J Gizi Pangan. (2018) 13:79–86. doi: 10.25182/jgp.2018.13.2.79-86
16. Fikri, MDI, Setyawati, AR, Nafisah, AG, Syauqy, A, Mahati, E, Astawan, M, et al. Blood pressure-lowering and anti-obesity potential of sacha inchi tempeh (plukenetia volubilisl.): study in metabolic syndrome rats. J Med Pharm Allied Sci. (2024) 13:6640–7. doi: 10.55522/jmpas.V13I3.6537
17. Yuningrum, H, Rahmumiyati, ME, and Sumiratsi, NNR. Consumption of fried foods as a risk factor for hypercholesterolemia: study of eating habits in public health students. J Health Educ. (2020) 5:78–5. doi: 10.15294/jhe.v5i2.38683
18. Astawan, M, Wresdiyati, T, Yoshari, RM, Rachmawati, NA, and Fadilla, R. The physicochemical properties of tempe protein isolated from germinated and non-germinated soybeans. J Nutr Sci Vitaminol. (2020) 66:S215–21. doi: 10.3177/jnsv.66.S215
19. Astawan, M, Wresdiyati, T, and Subarna, AK. Calcium bioavailability of tempe and boiled soybean flours and its effect on osfemurs in experimental rats. J Nutr Sci Vitaminol. (2020) 66:S314–9. doi: 10.3177/jnsv.66.S314
20. Surya, R, Amalia, N, Gunawan, WB, Taslim, NA, Ghafoor, M, Mayulu, N, et al. Tempe as superior functional antioxidant food: from biomechanism to future development of soybean-based functional. Pharmacia. (2023) 71:1–7. doi: 10.3897/pharmacia.71.e116748
21. Mahdi, SA, Astawan, M, Wulandari, N, and Muhandri, T. Sensory profiling of tempe functional drink powder using rate-all-that-apply (RATA) method. Food Res. (2023) 7:19–26. doi: 10.26656/fr.2017.7(S2).3
22. Abdurrasyid, Z, Astawan, M, Lioe, HN, and Wresdiyati, T. Physicochemical and antioxidant properties of germinated soybean tempe after two days additional fermentation time. Biointerface Res Appl Chem. (2023) 13:238. doi: 10.33263/BRIAC133.238
23. Astawan, M, Cahyani, AP, and Wresdiyati, T. Antioxidant activity and isoflavone content of overripe Indonesian Tempe. Food Res. (2023) 7:42–50. doi: 10.26656/fr.2017.7(S1).16
24. Muharni, M, Julinar, J, Yohandini, H, Fitrya, F, and Melati, R. In vitro anti-cholesterol and anti-hypertensive activity of stem bark the Flacourtia rukam. IOP Conf Ser Earth Environ Sci. (2021) 713:012056. doi: 10.1088/1755-1315/713/1/012056
25. Imtihani, HN, Permatasari, SN, and Prasetya, RA. In vitro evaluation of cholesterol-reducing ability of chitosan from mangrove crab (Scylla serrata) shell solid dispersion using pvp k-30 as a carrier. Galenika J Pharm. (2021) 7:99–109. doi: 10.22487/j24428744.2021.v7.i2.15597
26. Pradono, DI, Darusman, LK, and Susanti, A. Inhibisi lipase pankreas secara in vitro oleh ekstrak air dan etanol daun asam jawa (Tamarindus indica) dan rimpang kunci pepet (kaempferiae rotunda). J Nat Indones. (2011) 13:146–1154. doi: 10.31258/jni.13.02.%25p
27. Aji, OR, Hudaya, RA, and Putri, DA. In vitro pancreatic lipase inhibitor activity of Mangifera foetida leaves extract. J Biodjati. (2021) 6:82–92. doi: 10.15575/biodjati.v6i1.10646
28. Prativi, MBN, Astuti, DI, Putri, SP, Lavina, WA, Fukusaki, E, and Aditiawati, P. Metabolite changes in Indonesian tempe production from raw soybeans to over-fermented tempe. Meta. (2023) 13:300. doi: 10.3390/metabo13020300
29. Rizzo, G. Soy-based tempeh as a functional food: evidence for human health and future perspective. Front Biosci. (2024) 16:3. doi: 10.31083/j.fbe1601003
30. Chadha, R, Bhalla, Y, Jain, A, Chada, K, and Karan, M. Dietary soy isoflavone: a mechanistic insight. Nat Prod Commun. (2017) 12:627–34. doi: 10.1177/1934578X1701200439
31. Barus, T, Titarsole, NN, Mulyonon, N, and Prasasty, VD. Tempeh antioxidant activity using DPPH method: effects of fermentation, processing, and microorganisms. J Food Eng Technol. (2019) 8:75–80. doi: 10.32732/jfet.2019.8.2.75
32. Kuligowski, M, Pawłowska, K, Jasińska-Kuligowska, I, and Nowak, J. Isoflavone composition, polyphenols content and antioxidative activity of soybean seeds during tempeh fermentation. CyTA J Food. (2017) 15:27–33. doi: 10.1080/19476337.2016.1197316
33. Murphy, C, Deplazes, E, Cranfield, CG, and Garcia, A. The role of structure and biophysical properties in the pleiotropic effects of statins. Int J Mol Sci. (2020) 21:8745. doi: 10.3390/ijms21228745
34. Zendrato, DP, Hanafi, ND, Julianti, E, and Tafsin, M. Porang glucomannan as a prebiotic and cholesterol reducer in broiler chickens: effects on carcass quality, meat cholesterol, and immune response. Adv Anim Vet Sci. (2025) 13:1900. doi: 10.17582/journal.aavs/2025/13.9.1900.1911
35. Musa, WJA, Situmeang, B, and Sianturi, J. Anti-cholesterol triterpenoid acids from Saurauia vulcani Korth (Actinidiaceae). Int J Food Prop. (2019) 22:1439–44. doi: 10.1080/10942912.2019.1650762
36. Adu, JK, Amengor, CDK, Kabiri, N, Orman, E, Patamia, SAGP, and Okrah, BK. Validation of a simple and robust Liebermann–Burchard colorimetric method for the assay of cholesterol in selected milk products in Ghana. Int J Food Sci. (2019) 2019:1–7. doi: 10.1155/2019/9045938
37. Le, XT, Vi, VLL, Toan, TQ, Bach, LG, Truc, TT, and Ha, PTH. Extraction process of polyphenols from soybean (Glycine max l.) sprouts: optimization and evaluation of antioxidant activity. Processes. (2019) 7:489. doi: 10.3390/pr7080489
38. Hikmawanti, NPE, Fatmawati, S, and Asri, AW. The effect of ethanol concentrations as the extraction solvent on antioxidant activity of Katuk (Sauropus androgynus (l.) Merr.) leaves extracts. IOP Conf Ser Earth Environ Sci. (2020) 755:012060. doi: 10.1088/1755-1315/755/1/012060
39. Muflihah, YM, Gollavelli, G, and Ling, YC. Correlation study of antioxidant activity with phenolic and flavonoid compounds in 12 Indonesian indigenous herbs. Antioxidants. (2021) 10:1530. doi: 10.3390/antiox10101530
40. Wang, HH, Garruti, G, Liu, M, Portincasa, P, and Wang, DQH. Cholesterol and lipoprotein metabolism and atherosclerosis: recent advances in reverse cholesterol transport. Hepatology. (2017) 16:s27–42. doi: 10.5604/01.3001.0010.5495
41. Wang, DQH. New concepts of mechanisms of intestinal cholesterol absorption. Ann Hepatol. (2003) 2:113–21. doi: 10.1016/S1665-2681(19)32136-2
42. Megawati, M, Artanti, N, Mulyani, H, Darmawan, A, Syahrian, H, Lotulung, PD, et al. In vitro lipase enzyme inhibitory activities of green tea and other herbs. Jurnal Gizi Indonesia. (2020) 9:48–52. doi: 10.14710/jgi.9.1.48-52
43. Chanmee, W, Chaicharoenpong, C, and Petsom, A. Lipase inhibitor from fruits of Solanum stramonifolium Jacq. Food Nutr Sci. (2013) 4:554–8. doi: 10.4236/fns.2013.45071
44. Fadillah, WN, Sukarno, N, Iswantini, D, Rahminiwati, M, Hanif, N, and Waite, M. In vitro pancreatic lipase inhibition by marine fungi purpureocillium lilacinum associated with stylissa sp. sponge as anti-obesity agent. Hayati J Biosci. (2021) 29:76–86. doi: 10.4308/hjb.29.1.76-86
45. Sahib, NG, Hamid, AA, Saari, N, Abas, F, Dek, MSP, and Rahim, M. Anti-pancreatic lipase and antioxidant activity of selected tropical herbs. Int J Food Prop. (2012) 15:569–78. doi: 10.1080/10942912.2010.494754
46. Sari, IP, Nurrochmad, A, and Setiawan, IM. Indonesian herbals reduce cholesterol levels in diet-induced hypercholesterolemia through lipase inhibition. Malay J Pharm Sci. (2013) 11:13–20. doi: 10.21315/mjps2013.11.1.2
47. Liu, R, and Dan Xu, B. Inhibitory effects of phenolics and saponins from commonly consumed food legumes in China against digestive enzymes pancreatic lipase and α-glycosidase. Int J Food Prop. (2015) 18:2246–55. doi: 10.1080/10942912.2014.971178
48. Gonzales, AIM, Sanchez, AGD, Rosa, LA, Requena, CIV, Jaimes, IB, and Parrilla, EA. Polyphenolic compounds and digestive enzymes: in vitro non-covalent interactions. Molecules. (2017) 22:669. doi: 10.3390/molecules22040669
49. Cordova, C, Vivanco, JP, Quintero, J, and Mahn, A. Effect of drum-drying conditions on the content of bioactive compounds of broccoli pulp. Foods. (2020) 9:1224. doi: 10.3390/foods9091224
50. Lunagariya, NA, Patel, NK, Jagtap, SC, and Bhutani, KK. Inhibitors of pancreatic lipase: state of the art and clinical perspectives. EXCLI J. (2014) 13:897–921. doi: 10.17877/DE290R-6941
51. Hasim, FDN, Afandi, FA, and Qomaliyah, EN. Evaluation of Indonesian anti-obesity traditional plants: a systematic review and meta-analysis on pancreatic lipase inhibition activity. Food Res. (2023) 7:145–59. doi: 10.26656/fr.2017.7(6).892
52. Ros, E. Intestinal absorption of triglyceride and cholesterol. Dietary and pharmacological inhibition to reduce cardiovascular risk. Atherosclerosis. (2000) 151:357–79. doi: 10.1016/s0021-9150(00)00456-1
53. Worley, B, and Powers, R. PCA as a practical indicator of OPLS-DA model reliability. Curr Metab. (2016) 4:97–103. doi: 10.2174/2213235x-04666160613122429
54. Eriksson, L, Johansson, E, Antti, H, and Holmes, E. Multi- and megavariate data analysis: finding and using regularities in metabonomics data. Sweden: CRC Press (2005).
55. Adebo, OA, Njobeh, PB, Adebiyi, JA, Gbashi, S, and Kayitesi, E. Food metabolomics: a new frontier in food analysis and its application to understanding fermented foods In: MC Hueda, editor. Functional Food: improve health through adequate food. Croatia: INTECH (2017). 211–34.
56. Utpott, M, Rodrigues, E, Rios, AO, Mercali, GD, and Flores, SH. Review metabolomic: an analytical technique for food processing evaluation. Food Chem. (2021):366. doi: 10.1016/j.foodchem.2021.130685
57. Miyake, M, Kirisako, T, Kokubo, T, Miura, Y, Morishita, K, Okamura, H, et al. Randomised controlled trial of the effects of L-ornithine on stress markers and sleep quality in healthy workers. Nutr J. (2014) 13:53. doi: 10.1186/1475-2891-13-53
58. Aiello, A, Pepe, E, De Luca, L, and Pizzolongo, F. Preliminary study on kinetics of pyroglutamic acid formation in fermented milk. Int Dairy J. (2022) 126:105233. doi: 10.1016/j.idairyj.2021.105233
59. Gazme, B, Boachie, RT, Tsopmo, A, and Udenigwe, CC. Occurrence, properties and biological significance of pyroglutamyl peptides derived from different food sources. Food Sci Human Wellness. (2019) 8:268–74. doi: 10.1016/j.fshw.2019.05.002
60. Yuliana, ND, Khatib, A, Choi, YH, and Verpoorte, R. Metabolomics for bioactivity assessment of natural products. Phytother Res. (2011) 25:157–69. doi: 10.1002/ptr.3258
61. Chen, L, Zheng, Y, Zhao, L, Zhang, Y, Yin, L, He, Y, et al. Lipid profiles and differential lipids in serum related to severity of community-acquired pneumonia: A pilot study. PLoS One. (2021) 16:e0245770. doi: 10.1371/journal.pone.0245770
62. Zheng, R, Chen, Z, Guan, Z, Zhao, C, Cui, H, and Shang, H. Variable importance for projection (vip) scores for analyzing the contribution of risk factors in severe adverse events to xiyanping injection. Chin Med. (2023) 18:15. doi: 10.1186/s13020-023-00718-8
63. Wikandari, R, Utami, TAN, Hasniah, N, and Sardjono,. Chemical, nutritional, physical and sensory characterization of Tempe made from various underutilized legumes. Pak J Nutr. (2020) 19:179–90. doi: 10.3923/pjn.2020.179.190
64. Ruhal, R, Kataria, R, and Choudhury, B. Trends in bacterial trehalose metabolism and significant nodes of metabolic pathway in the direction of trehalose accumulation. Microb Biotechnol. (2012) 6:493–502. doi: 10.1111/1751-7915.12029
65. Wang, ZX, Zhuge, J, Fang, H, and Prior, BA. Glycerol production by microbial fermentation: a review. Biotechnol Adv. (2001) 19:201–23. doi: 10.1016/S0734-9750(01)00060-X
66. Trautvetter, U, Ditscheid, B, Jahreis, G, and Glei, M. Calcium and phosphate metabolism, blood lipids and intestinal sterols in human intervention studies using different sources of phosphate as supplements—pooled results and literature search. Nutrients. (2018) 10:936. doi: 10.3390/nu10070936
67. Tabrizi, R, Ostadmohammadi, V, Lankarani, KB, Peymani, P, Akabari, M, Kolahdooz, F, et al. The effects of inositol supplementation on lipid profiles among patients with metabolic diseases: a systematic review and meta analysis of randomized controlled trials. Lipids Health Dis BMC. (2018) 17:123. doi: 10.1186/s12944-018-0779-4
68. Arai, C, Suyama, A, Arai, S, Arai, N, Yoshizane, C, Koya-Miyata, S, et al. Trehalose itself plays a critical role on lipid metabolism: trehalose increases jejunum cytoplasmic lipid droplets which negatively correlated with mesenteric adipocyte size in both hfd-fed trehalase KO and WT mice. Nutr Metab. (2020) 17:22. doi: 10.1186/s12986-020-00443-1
69. Venkatesh, R, Srinivasan, K, and Singh, SA. Effect of arginine:lysine and glycine:methionine intake ratios on dyslipidemia and selected biomarkers implicated in cardiovascular disease: a study with hypercholesterolemic rats. Biomed Pharmacother. (2017) 91:408–14. doi: 10.1016/j.biopha.2017.04.072
70. Cojocaru, E, Leon-Constantin, MM, Ungureanu, C, Trandafirescu, MF, Mastaleru, A, Trandafir, LM, et al. Hypolipemiant actions and possible cardioprotective effects of valine and leucine: an experimental study. Medicina. (2021) 57:239. doi: 10.3390/medicina57030239
71. Shipelin, VA, Trusov, NV, Apryatin, SA, Shumakova, AA, Balakina, AS, Riger, NA, et al. Effects of tyrosine and tryptophan in rats with diet-induced obesity. Int J Mol Sci. (2021) 22:2429. doi: 10.3390/ijms22052429
72. Rabah, HAO, Madden, EF, Roe, AL, and Betz, JM. United States pharmacopeia (USP) safety review of gamma-aminobutyric acid (GABA). Nutrients. (2021) 13:2742. doi: 10.3390/nu13082742
73. Rybak, M, and A, d W. Inhibition of α-amylase, α-glucosidase, pancreatic lipase, 15-lipooxygenase and acetylcholinesterase modulated by polyphenolic compounds, organic acids, and carbohydrates of Prunus domestica fruit. Antioxidants. (2023) 12:1380. doi: 10.3390/antiox12071380
74. Colin, DY, Deprez-Beauclair, P, Silva, N, Infantes, L, and Kerfelec, B. Modification of pancreatic lipase properties by directed molecular evolution. Protein Eng Des Sel. (2010) 22:365–73. doi: 10.1093/protein/gzq008
75. Yunita, D, Varizki, E, Rohaya, S, Irfan, I, and Muzaifa, M. Application of optimized Streptococcus thermophilus and Lactobacillus bulgaricus on coconut milk in the production of niyoghurt. J Nat. (2023) 23:131–138. doi: 10.24815/jn.v23i2.29310
76. Livesey, G. Health potential of polyols as sugar replacers, with emphasis on low glycaemic properties. Nutr Res Rev. (2003) 16:163–91. doi: 10.1079/NRR200371
77. Rzechonek, DA, Dobrowolski, A, Rymowicz, W, and Mironczuk, AM. Recent advances in biological production of erythritol. Crit Rev Biotechnol. (2018) 38:620–33. doi: 10.1080/07388551.2017.1380598
78. Lunavath, R, Mohammad, SH, Bhukya, KK, Barigela, A, Banoth, C, Banothu, AK, et al. Antimycotic effect of 3-phenyllactic acid produced by probiotic bacterial isolates against Covid-19 associated mucormycosis causing fungi. PLoS One. (2023) 18:e0279118. doi: 10.1371/journal.pone.0279118
79. Hierro, JN, Reglero, G, and Martin, D. Chemical characterization and bioaccessibility of bioactive compounds from saponin-rich extracts and their acid-hydrolysates obtained from fenugreek and quinoa. Foods. (2020) 9:1159. doi: 10.3390/foods9091159
80. Iman, MN, Irdiani, R, Rahmawati, D, Fukusaki, E, and Putri, SP. Improvement of the functional value of green soybean (edamame) using germination and tempe fermentation: a comparative metabolomics study. J Biosci Bioeng. (2023) 136:205–12. doi: 10.1016/j.jbiosc.2023.05.012
81. Iman, MN, Haslam, DE, Liang, L, Guo, K, Joshipura, K, Perez, CM, et al. Multidisciplinary approach combining food metabolomics and epidemiology identifies meglutol as an important bioactive metabolite in tempe, an Indonesian fermented food. Food Chem. (2024) 446:138744. doi: 10.1016/j.foodchem.2024.138744
82. Laka, K, Makgoo, L, and Mbita, Z. Cholesterol-Lowering Phytochemicals: Targeting the Mevalonate Pathway for Anticancer Interventions. Frontiers in Genetics. (2022). 13:841639. doi: 10.3389/fgene.2022.841639
83. Ullah, A, Jahan, S, Razak, S, Pirzada, M, Ullah, H, Almajwal, A, et al. Protective effects of GABA against metabolic and reproductive disturbances in letrozole induced polycystic ovarian syndrome in rats. J Ovar Res. (2017) 10:62. doi: 10.1186/s13048-017-0359-7
84. Dastgerdi, AH, Sharifi, M, and Soltani, N. GABA administration improves liver function and insulin resistance in of spring of type 2 diabetic rats. Nature. (2021) 11:23155. doi: 10.1038/s41598-021-02324-w
85. de Bie, TH, Witkamp, RF, Balvers, MGJ, and Jongsma, MA. Effects of γ-aminobutyric acid supplementation on glucose control in adults with prediabetes: a double-blind, randomized, placebo-controlled trial. Am J Clin Nutr. (2023) 118:708–19. doi: 10.1016/j.ajcnut.2023.07.017
86. Yang, Y, Lian, YT, Huang, SY, Yang, Y, Cheng, LX, and Liu, K. GABA and topiramate inhibit the formation of human macrophage-derived foam cells by modulating cholesterolmetabolism-associated molecule. Cell Physiol Biochem. (2014) 33:1117–29. doi: 10.1159/000358681
87. Jin, H, Han, H, Song, G, Ji Oh, H, and Lee, BY. Anti-obesity effects of GABA in C57BL/6J mice with high-fat diet-induced obesity and 3T3-l1 adipocytes. Int J Mol Sci. (2024) 25:995. doi: 10.3390/ijms25020995
88. Dhakal, R, Bajpai, VK, and Baek, KH. Production of GABA (Γ-aminobutyric acid) by microorganisms: a review. Braz J Microbiol. (2012) 43:1230–41. doi: 10.1590/S1517-83822012000400001
89. Sahab, NRM, Subroto, E, Balia, RL, and Utama, GL. Γ-Aminobutyric acid found in fermented foods and beverages: current trends. Heliyon. (2020) 6:e05526. doi: 10.1016/j.heliyon.2020.e05526
90. Takahashi, Y, Odbayar, TO, and Ide, T. A comparative analysis of Genistein and Daidzein in affecting in rat liver. J Clin Biochem Nutr. (2009) 44:223–30. doi: 10.3164/jcbn.08-211
91. Legette, LL, Lee, WH, Martin, BR, Story, JA, Aarabshahi, A, Barnes, S, et al. Genistein, a phytoestrogen, improves total cholesterol and synergy®, a prebiotic, improved calcium utilization but there were no synergistic effects. Menopause. (2011) 18:923–31. doi: 10.1097/gme.0b013e3182116e81
92. Hermanto, FE, Warsiti, W, Rifa’I, M, and Widodo, N. Understanding hypocholesterolemic activity of soy isoflavones: completing the puzzle through computational simulations. J Biomol Struct Dyn. (2023) 41:9931–7. doi: 10.1080/07391102.2022.2148752
93. Yamagata, K, and Yamori, Y. Potential effects of soy isoflavones on the prevention of metabolic syndrome. Molecules. (2021) 26:5863. doi: 10.3390/molecules26195863
94. Kim, MH, Park, JS, Seo, MS, Jung, JW, Lee, YS, and Kang, KS. Genistein and daidzein repress adipogenic differentiation of human adipose tissue-derived mesenchymal stem cells via Wnt/b-catenin signalling or lipolysis. Cell Prolif. (2010) 43:594–605. doi: 10.1111/j.1365-2184.2010.00709.x
Keywords: anti-lipase, GC–MS, cholesterol, metabolomic, tempe
Citation: Astawan M, Tryas AA, Saraswati S, Wresdiyati T, Afifah DN, Elda F, Riyanto RA and Putri SP (2025) Metabolite profiling of bioactive compounds in tempe flour and its potential as a hypocholesterolemic functional food. Front. Nutr. 12:1622952. doi: 10.3389/fnut.2025.1622952
Edited by:
Morena Gabriele, National Research Council (CNR), ItalyReviewed by:
Chaoyang Ma, Jiangnan University, ChinaAmardeep Singh Virdi, Amity University, Mohali, India
Copyright © 2025 Astawan, Tryas, Saraswati, Wresdiyati, Afifah, Elda, Riyanto and Putri. This is an open-access article distributed under the terms of the Creative Commons Attribution License (CC BY). The use, distribution or reproduction in other forums is permitted, provided the original author(s) and the copyright owner(s) are credited and that the original publication in this journal is cited, in accordance with accepted academic practice. No use, distribution or reproduction is permitted which does not comply with these terms.
*Correspondence: Made Astawan, YXN0YXdhbkBhcHBzLmlwYi5hYy5pZA==