 Marie Tassy1,2*
 Andreas Rytz3
 Alison L. Eldridge2
 Tsz Ning Mak2
 Frank Ekow Atta Hayford4
 Edith J. M. Feskens1
- 1Division of Human Nutrition and Health, Wageningen University & Research, Wageningen, Netherlands
- 2Nestlé Institute of Health Sciences, Nestlé Research, Société des Produits Nestlé, Lausanne, Switzerland
- 3Nestlé Institute of Agricultural Sciences, Nestlé Research, Société des Produits Nestlé, Lausanne, Switzerland
- 4Department of Dietetics, School of Biomedical and Allied Health Sciences, College of Health Sciences, University of Ghana, Accra, Ghana
Introduction: As packaged foods consumption increases in low- and middle-income countries (LMICs), certain governments have introduced front-of-pack labeling (FOPL) schemes to promote healthier food choices. This study assesses the evolution and nutritional quality of packaged foods in LMICs from 2015 to 2023 and examines trends in countries where FOPLs have been implemented.
Methods: On-pack information from products in the top 20 packaged food categories was retrieved from the Mintel Global New Product Database (2015–2023) in 19 LMICs. The number of new products introduced and median content of energy, sugars, sodium, saturated fatty acids (SFA), protein, and fiber were analyzed by product category, country, region and type of FOPL implemented. Evolution of the percentage of products with an improved nutritional content was compared from 2015–2017 to 2021–2023.
Results: Our findings indicate that from 2015 to 2023, the percentage of packaged meat and coffee products increased in LMICs, while more indulgent products such as cookies declined. The nutritional quality of products improved, particularly toward a reduction in total sugars and an increase in protein content. The implementation of FOPL was associated with further reductions in total sugars, and, depending on the type of scheme implemented, with reduction in sodium.
Discussion: These findings offer insights on the food environment in LMICs undergoing a nutrition transition, and on how certain food policies can be associated with reformulation of packaged foods in those countries.
Introduction
Over the last decades, low- and middle-income countries (LMICs) have faced a double burden of malnutrition, characterized by the coexistence of undernutrition, micronutrient deficiencies and overnutrition (1). The rise in overweight and obesity prevalence is, at least in part, due to a change in the food system. Packaged foods and beverages, that are industrially pre-prepared and sealed to be suitable for retail sale, are becoming more available and affordable (2, 3) leading to a transition from traditional to more westernized diets (4). As this phenomenon also known as the nutrition transition occurs, high fiber, low fat products are being replaced with animal-based and packaged foods, that can be higher in sodium, fats and sugars (5).
To encourage the consumption of healthier foods, 16 LMICs had implemented food policies such as front-of-pack labeling (FOPL) schemes, food taxes, and claims regulations (6). Those policies are supported by nutrient profiling models (NPMs) which enable the “classification or ranking foods according to their nutritional composition for reasons related to preventing disease and promoting health” (7). Most NPMs rank foods according to their content in fats, sugars and salt. Additionally, some NPMs include micronutrients to address the issue of malnutrition such as the Healthier Choice logo in Malaysia and Thailand. Other models include whole grains and fiber in countries where overnutrition is highly prevalent (6).
Most NPMs in LMICs support FOPL schemes to improve consumer awareness in making healthier food choices (8). FOPL provides clear and concise nutritional information on-pack and therefore mitigates information asymmetry between consumers and suppliers, addressing the challenge of quality uncertainty that consumers face when making purchasing decisions (9). Additionally, FOPL encourages reformulation of packaged foods toward levels of nutrients aligned with dietary guidelines (8). FOPL represents a cost–benefit response to labeling regulations for the food industry as it can enhance market positioning and build consumer trust. Ultimately, FOPL not only empowers consumers with better information but also encourages firms to maintain higher quality standards. In LMICs, implementation of FOPL schemes has been efficient and has positively impacted consumer awareness in making healthier food choices. Brazilian High In labels were widespread on packaged foods in top consumed categories 1 year after their adoption (10). Peruvian High In labels were efficient in informing consumers from different settings and socio-economic status on the healthfulness of packaged products (11). Ecuadorian Traffic Lights were understood by most participants in a recent study; however, this did not always lead to a change in attitude and practices (12). Except in Peru and Mexico where High In labels have encouraged reformulation of critical nutrients, particularly energy and saturated fats (13–15), the impact of FOPL on reformulation of packaged foods in LMICs remains unclear.
In fact, new product introductions and nutritional quality of the packaged food supply in LMICs have rarely been evaluated. Some analyzes were performed cross-sectionally and at a country level. Ndanuko et al. studied the sodium content of more than 6,000 packaged products in Kenya in 2019 and compared it with the South-African food supply finding wide variabilities within categories (16). Similarly, Pongutta et al. observed that only 9% of ready-to-eat packaged foods in 2015 in Thailand were classified as healthier according to the Thai nutrient profiling system (17). On the global scale, newly launched packaged foods were significantly lower in total sugars and sodium in 2020 than in 2016 (18), but this study did not evaluate changes in the packaged food supply by country’s level of income. Therefore, it is unclear if the same trends are observed across LMICs.
The aim of this study was to assess the evolution of the nutritional quality of the packaged food supply in LMICs and to evaluate if trends have been any different after the implementation of a FOPL in each country. This study focused on packaged foods and food policies targeting the general population, therefore products specific to infants and children are not considered.
Methods
Food supply database
The number of new products introduced, and the nutritional quality of packaged foods was characterized by performing a secondary analysis of the Mintel Global New Product Database (GNPD) (19). Mintel GNPD is a commercial repository of new packaged food products launched globally. It reports all information available on-pack in 141 categories and across 81 countries and is used to monitor claims and nutrient content of packaged products (20–22).
A subset of Mintel GNPD featuring packaged food products launched from 2015 to 2023 in 19 LMICs was extracted. Countries were classified using the World Bank 2023 classification by region and income (23). A LMIC was selected if information was available for more than 1,000 products every year in Mintel GNPD (Table 1). The presence or absence of a FOPL scheme was determined based on a recent systematic review of nutrient profiling models supporting food policies in LMICs (6). Three FOPL have been implemented in the countries considered: High In labels, Traffic Light schemes and Choices schemes. High In labels are a type of mandatory FOPL implemented across most Latin American LMICs and more recently in South Africa. They convey negative messaging by framing in black nutrients present in excess (12). Traffic Lights schemes are implemented in Ecuador and Sri Lanka and deliver a mixed message by coloring nutrient in red if their content is high, yellow if moderate and green if low (6). The Choices scheme, implemented mainly in South Asia, highlights the healthiest options per food category with a logo (6). Since High In labels were implemented in South Africa in 2023 (24), they could not have had an impact on nutritional quality from 2015 to 2022 and therefore South Africa was not considered in this analysis.
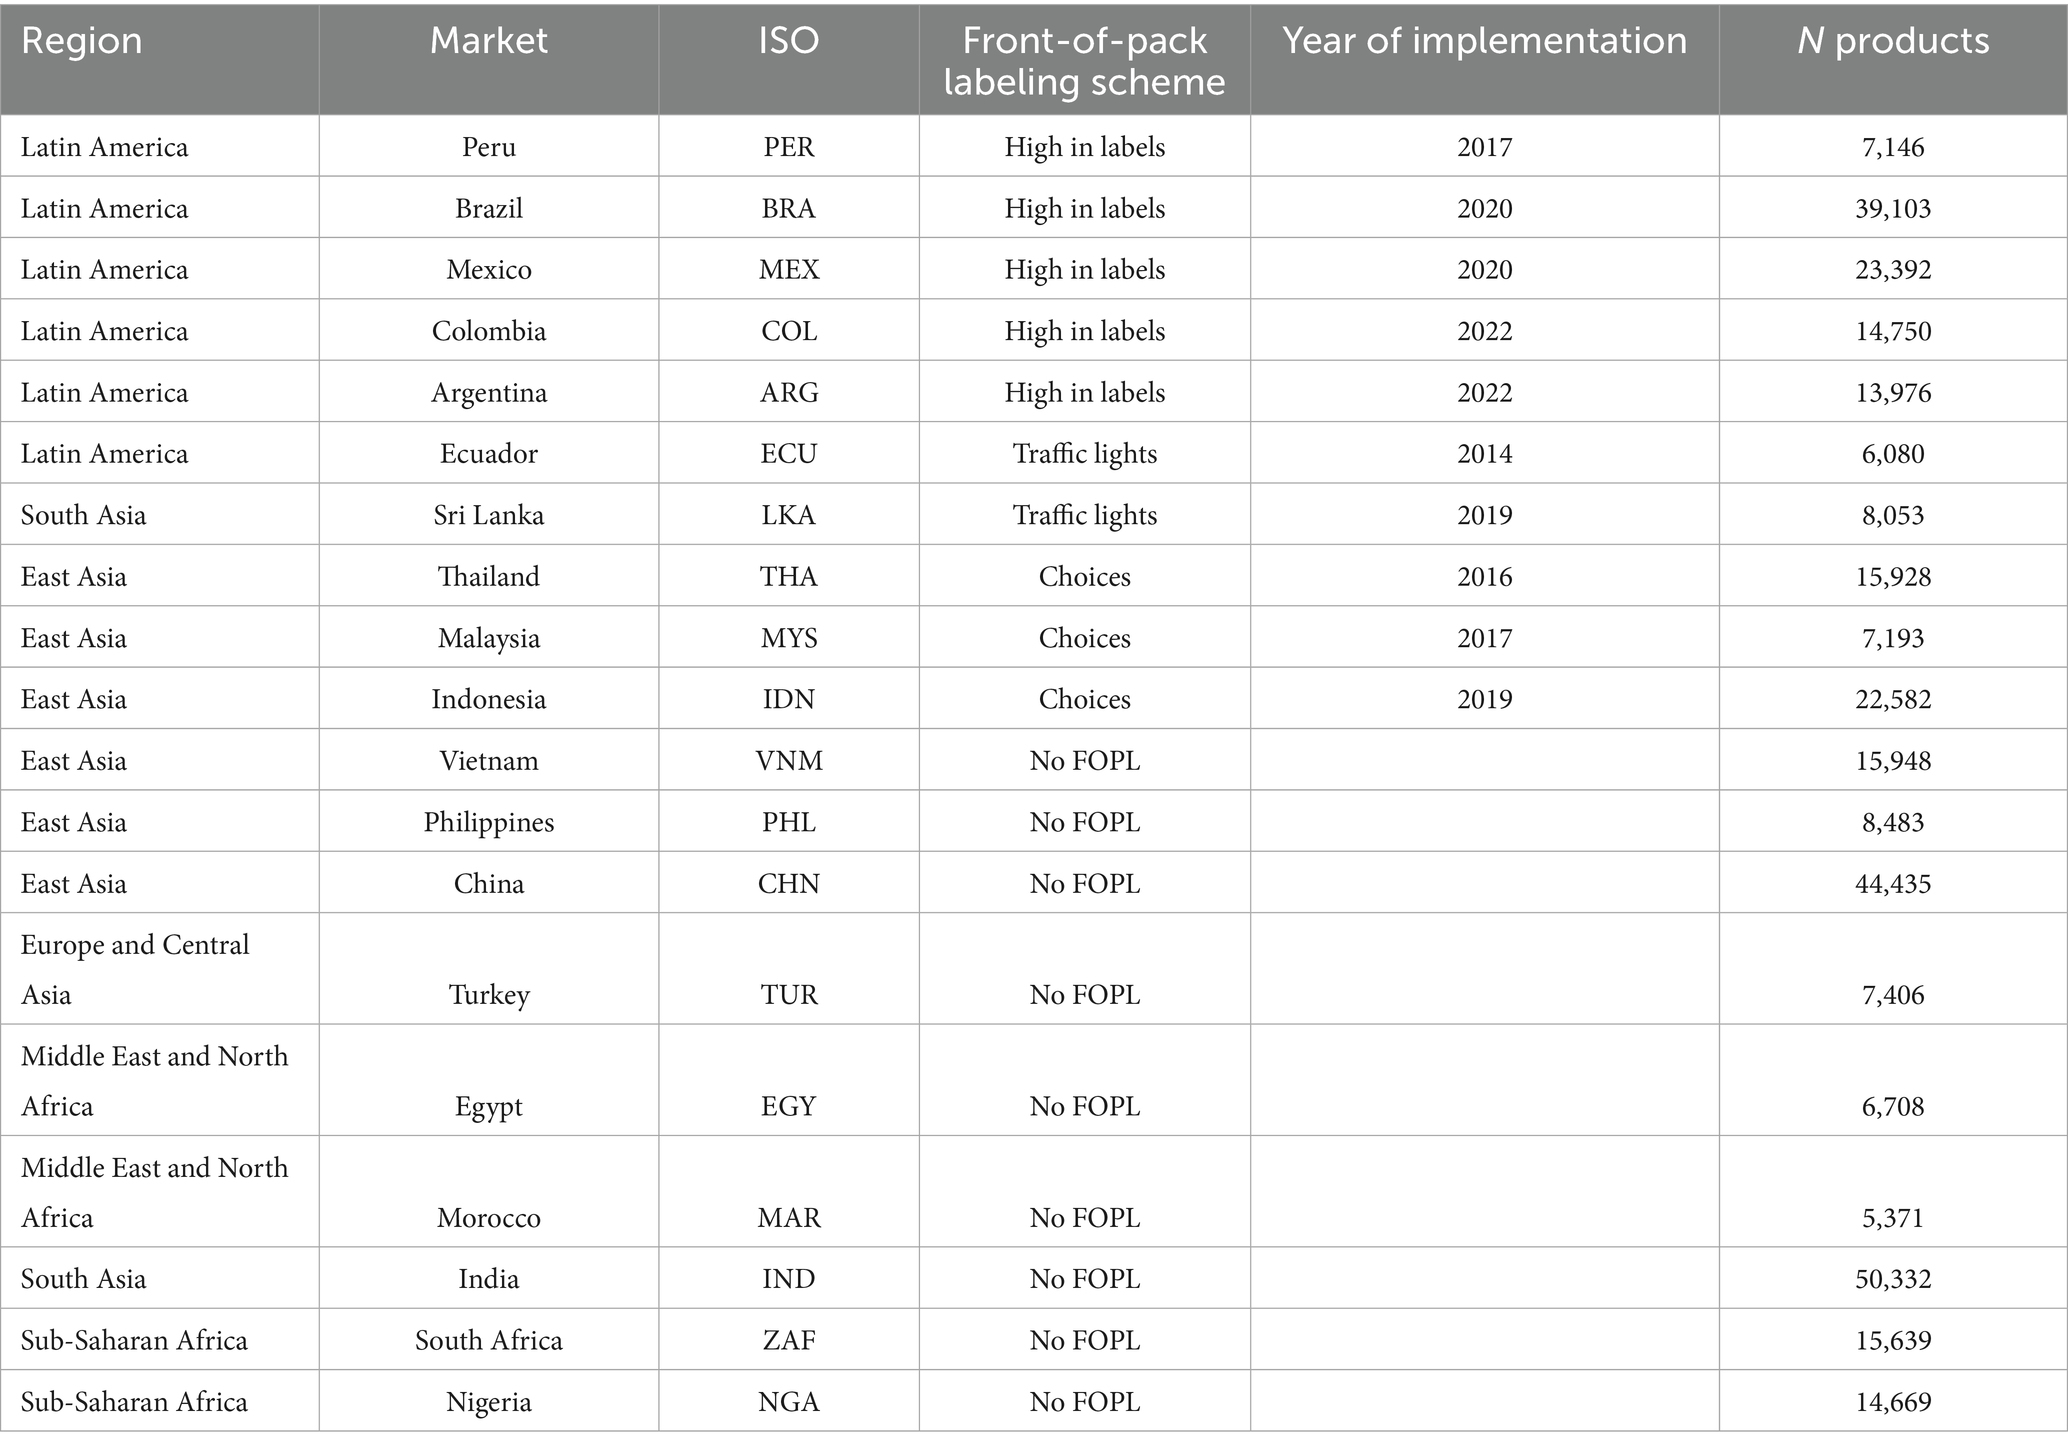
Table 1. List of LMICs considered with their region, front-of-pack labeling scheme and number of products.
Food categories were selected based on the percentage of products per category for each LMIC and averaged across countries. Only the top 20 categories were selected for further analysis (Table 2). These foods represent each more than 1.5% of the food supply summing to nearly half of newly launched packaged foods in LMICs. A total of 327′194 packaged food products were included in the final dataset.
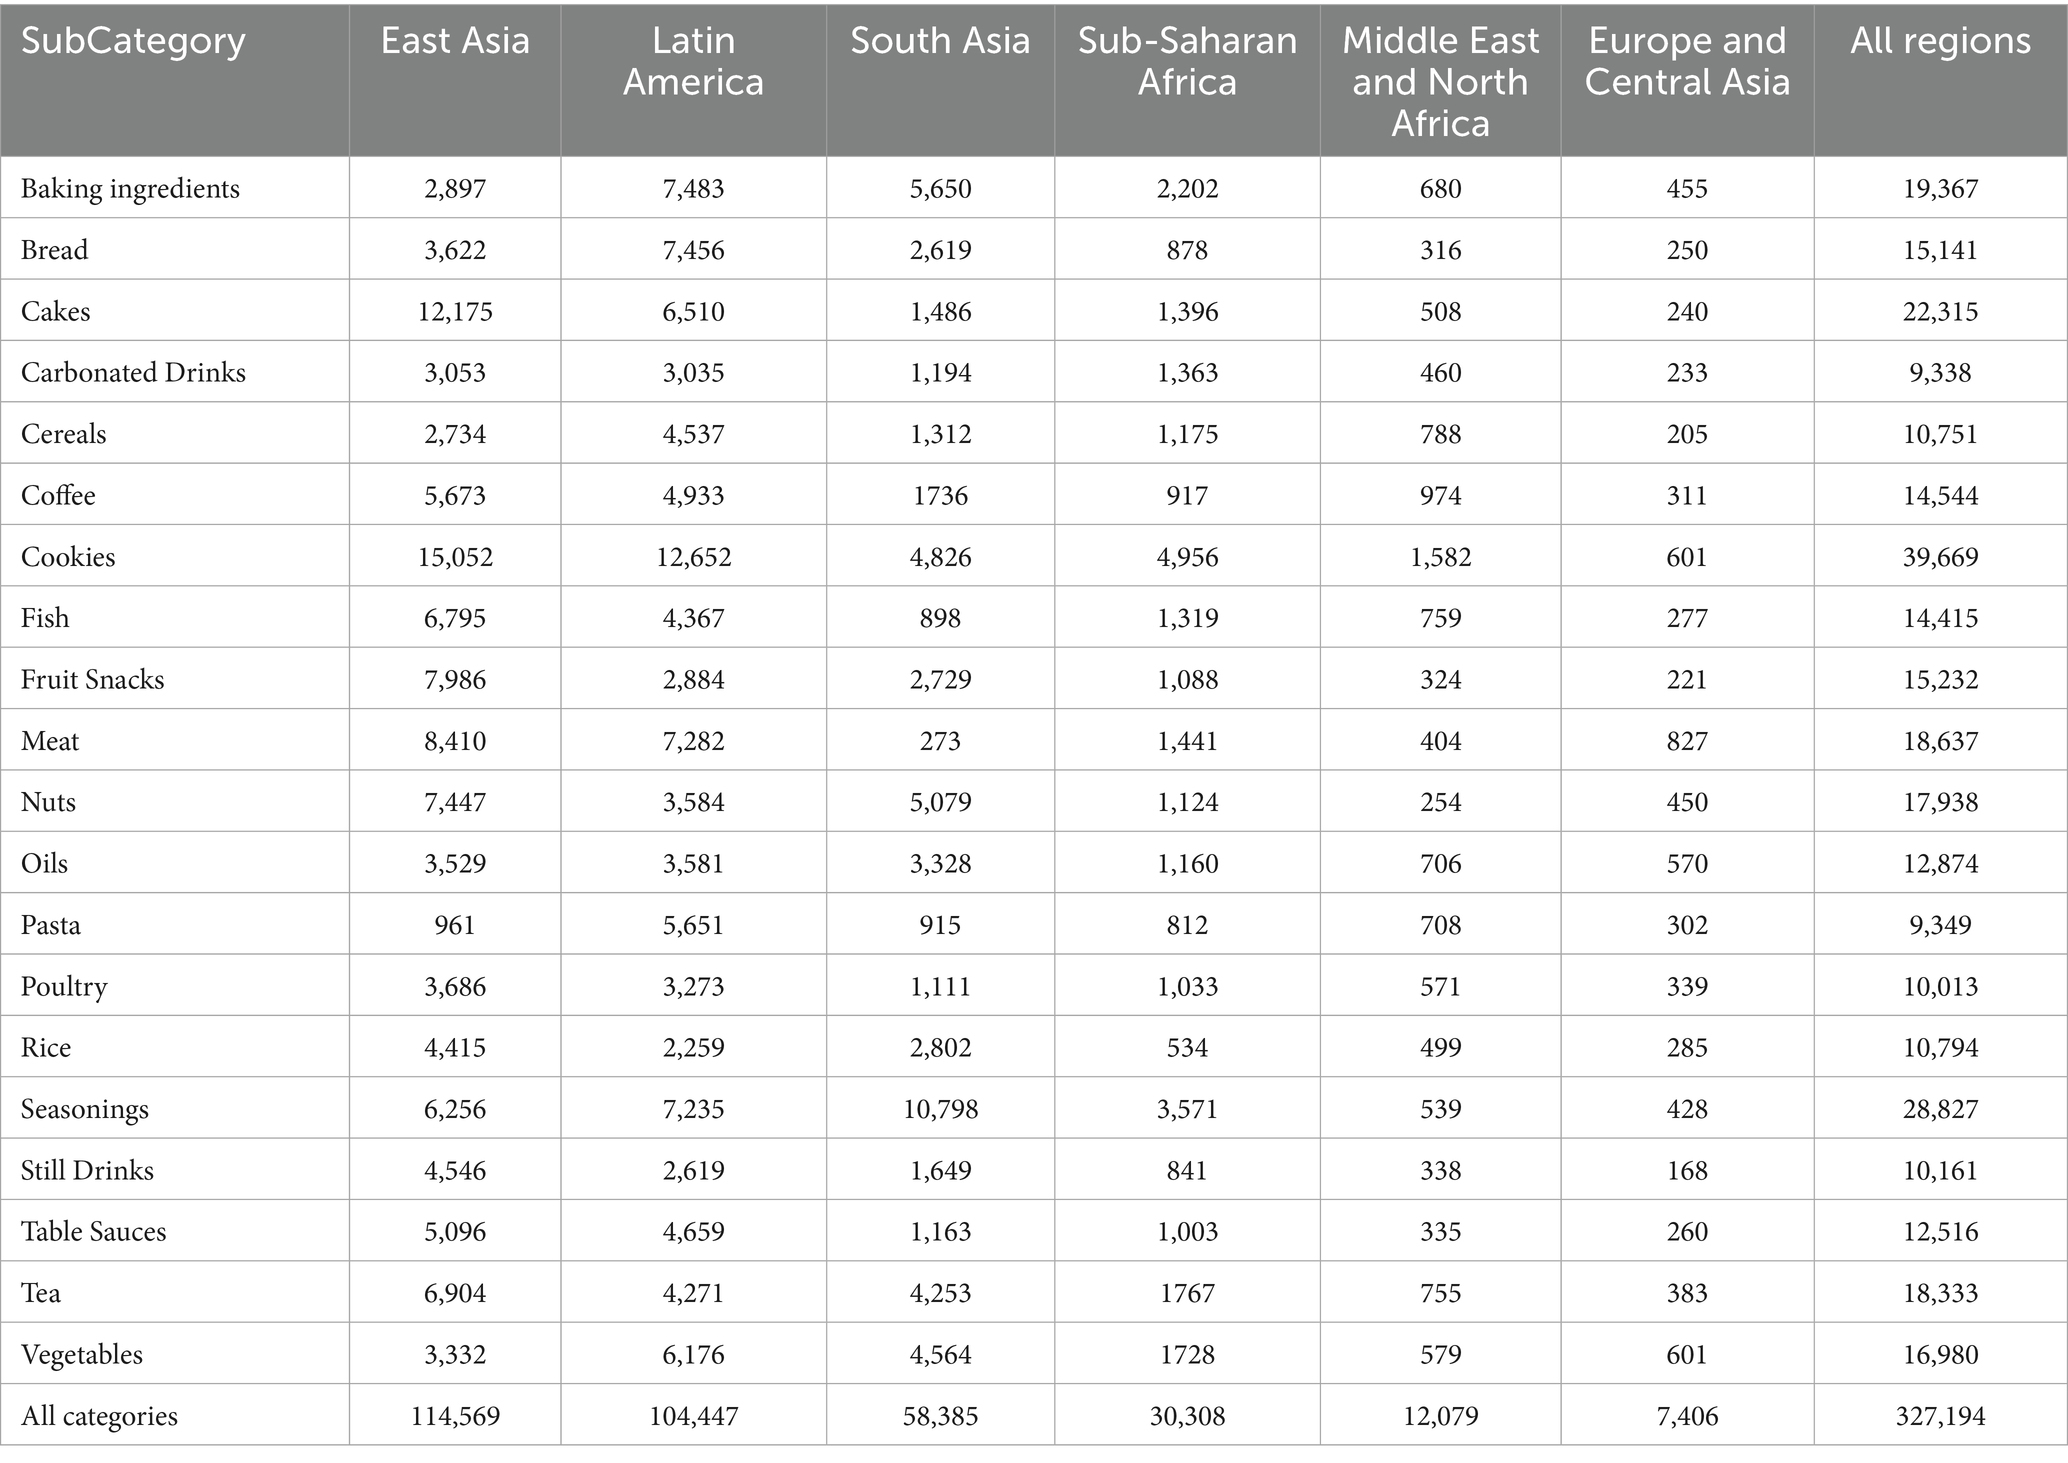
Table 2. List of packaged food product categories and respective number of products.
For each product considered, information was extracted on declared content of energy, total sugars, sodium, saturated fatty acids (SFA), protein and fiber. Those nutrients were selected because they are relevant to public health, included in most nutrient profiling models (25, 26) and mandatory to declare in a majority of countries (27). However, the rate of declaration was variable per country and per nutrient (Figure 1). In Argentina and Brazil, less than 30% of packaged foods declare content of total sugars because declaration was not mandatory in those two countries before 2021/2022 (28–30). In China, only sodium is declared in more than 80% of products despite existing regulations (31). Variation in the number of products with a declared nutrient content by country has been taken into account in the statistical analyses.
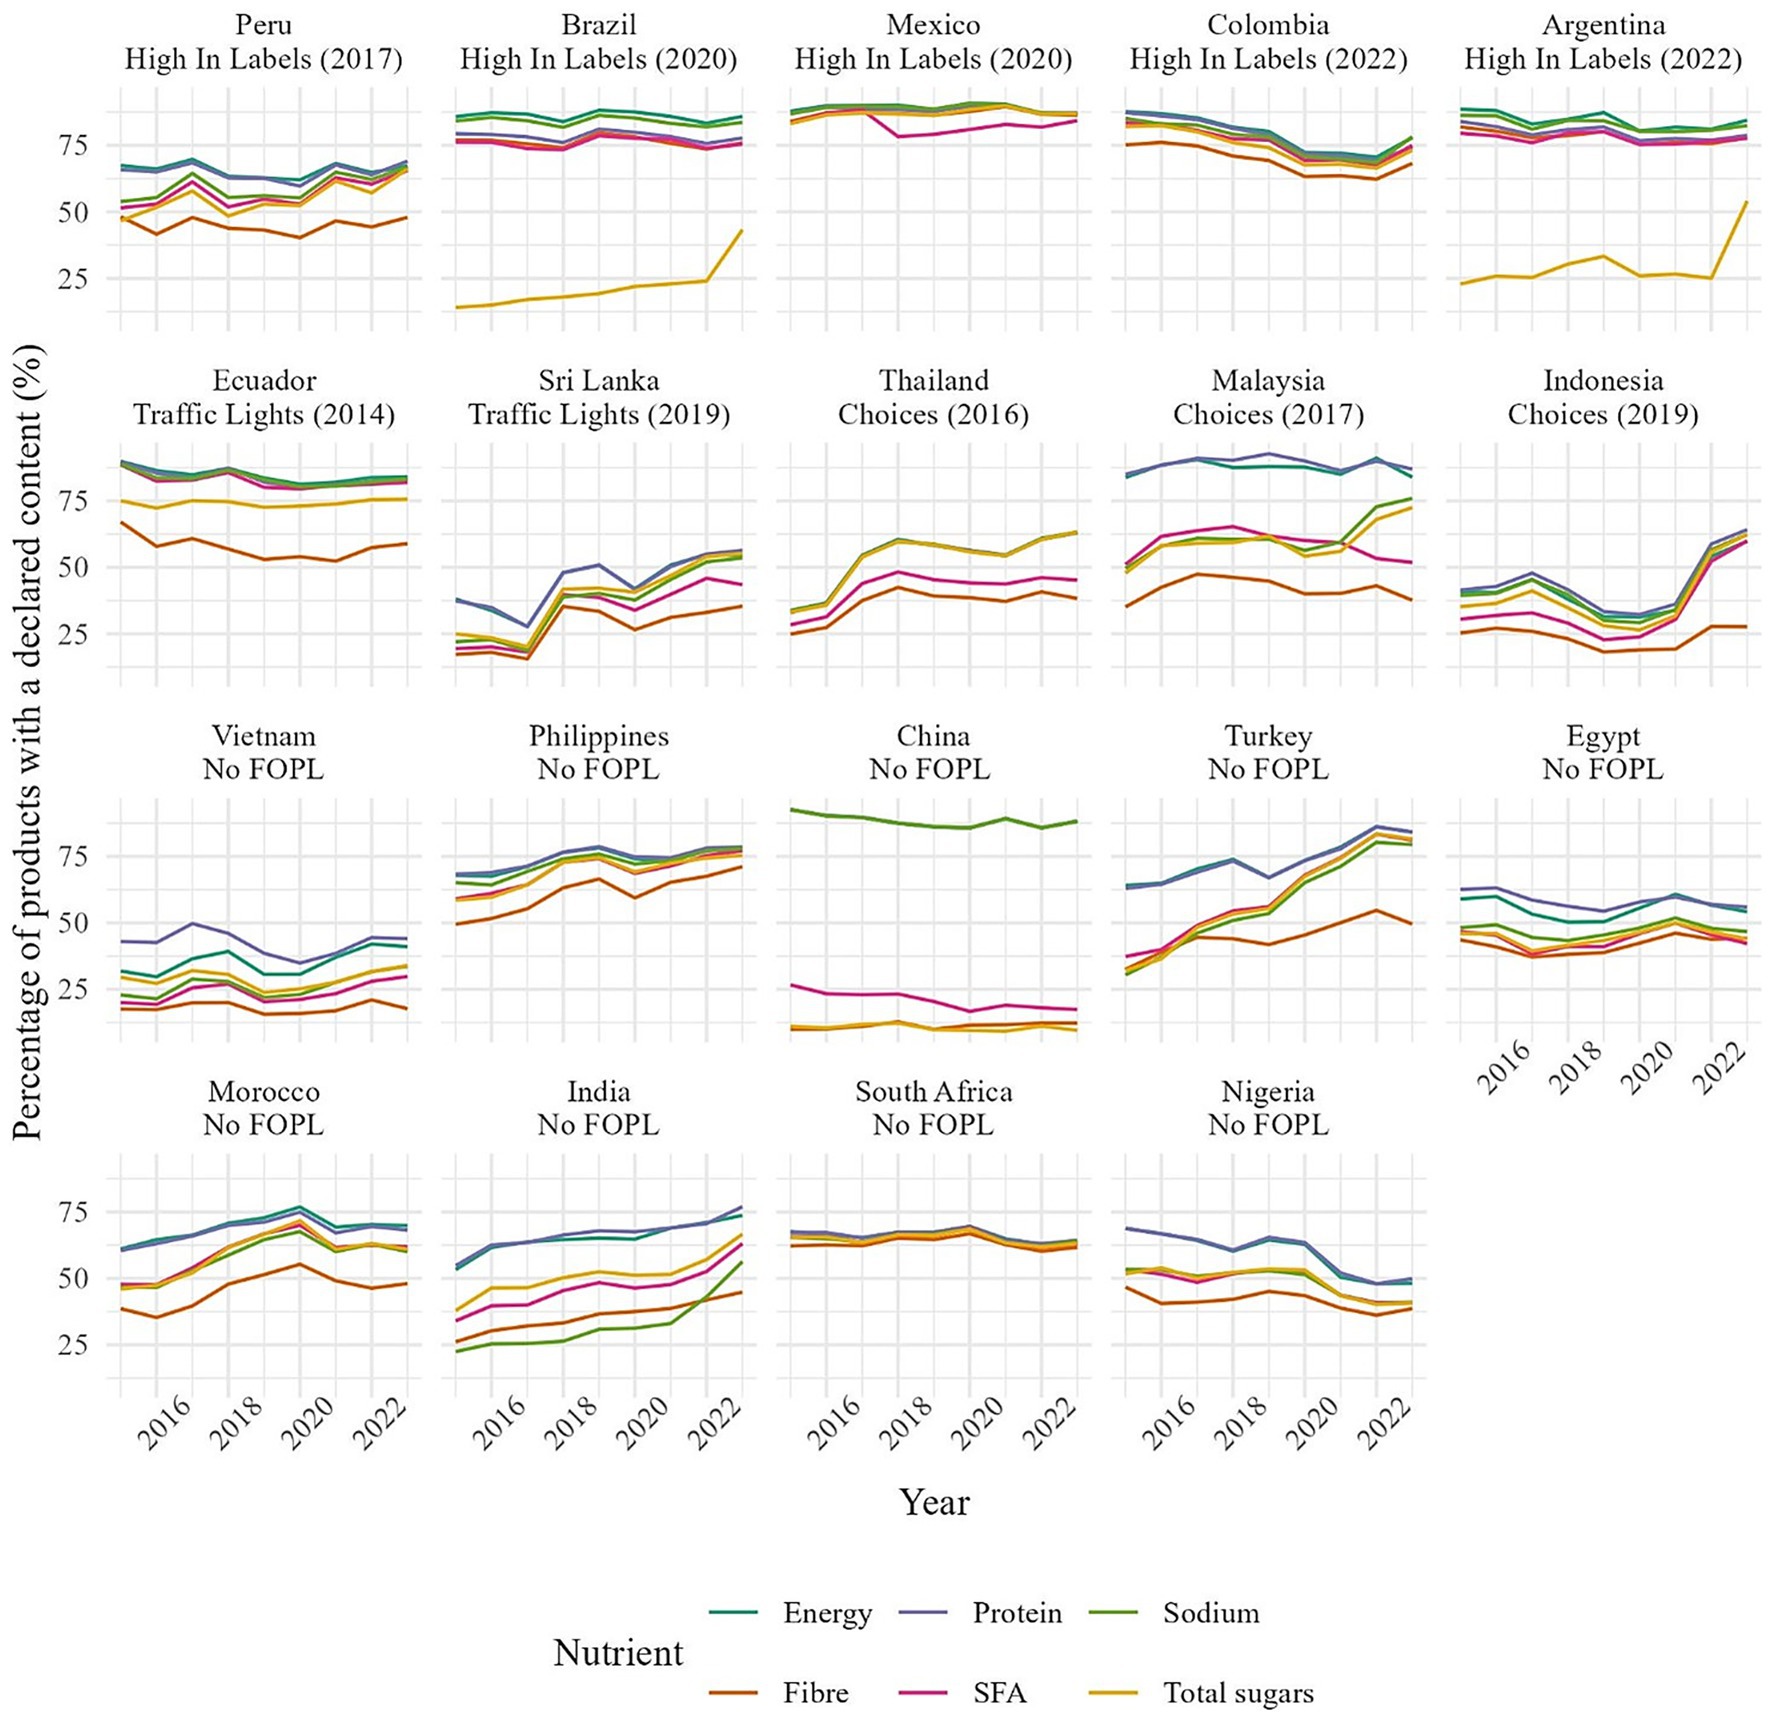
Figure 1. Percentage of products with a declared content in energy, SFA, sugars, sodium, protein and fiber by country.
Data extracted from the Mintel GNPD was split into three periods of 3 years: from 2015 to 2017, from 2018 to 2020 and from 2021 to 2023. Each period featured more than 100,000 products, enough products to analyze the evolution of food supply at a country, region and category level.
Statistical analysis
Change of the number of products in each food category and the nutritional quality of the packaged food supply was evaluated by comparing the number and median nutrient content of the five nutrients of interest by country and category, in 2015–2017 and 2021–2023. Median nutrient content was selected over mean to give more importance to central values than to extreme ones in each category. Percentage of products and median nutrient content by category were averaged across countries to identify category-specific changes. A t-test was used for comparison between the two time periods, with Benjamini-Hochberg (BH) correction to account for multiple testing (α = 5%).
Country-specific changes in number of products and nutritional quality were mapped using Principal Components Analysis (PCA) in 2015–2017 and in 2021–2023. Countries were colored by regions to identify regional patterns.
In addition, change in nutrient content was assessed by difference-in-difference analysis in countries where a FOPL has been implemented. The percentage of products with an “improved” nutrient content in 2018–2020 and 2021–2023 was compared to the 2015–2017 median value for each category within each country to identify improvements in nutrient content independently of the baseline value and by type of FOPL. Percentages were then aggregated at a country level with a 95% confidence interval. “Improved” was defined as lower content than the 2015–2017 median for energy, total sugars, SFA and sodium and higher content than the 2015–2017 median for protein and fiber. Chinese products as well as total sugars in Brazilian and Argentinian products were excluded from the analysis due to inconsistent declaration rates over the years (Figure 1). Only categories with a non-null median were considered.
Changes in nutrient content were aggregated by type of FOPL to assess the impact of this food policy across countries. Percentages of products with an “improved” nutrient content as well as 95% confidence interval were aggregated by type of FOPL implemented in the country, i.e., High in labels, Traffic Lights or Choices schemes. Nutrient content in 2018–2020 and 2021–2023 was compared to country-specific and category specific medians in 2015–2017 to assess nutritional improvement irrespective of baseline values which may be affected by local regulatory and socio-economic factors.
Results
Evolution of the composition of the food supply
From 2015–2017 to 2021–2023, the composition of the food supply has evolved while the total number of products launched in the two periods of time remained steady. The percentage of new launches in four product categories decreased by more than 1 percentage point: Cakes (−1.0), Cookies (−2.6), Still Drinks (−1.2) and Vegetables (−1.5) while it increased by more than 1 percentage point in Coffee (+2.2), Meat (+2.0) and Poultry (+1.0) (Table 3).
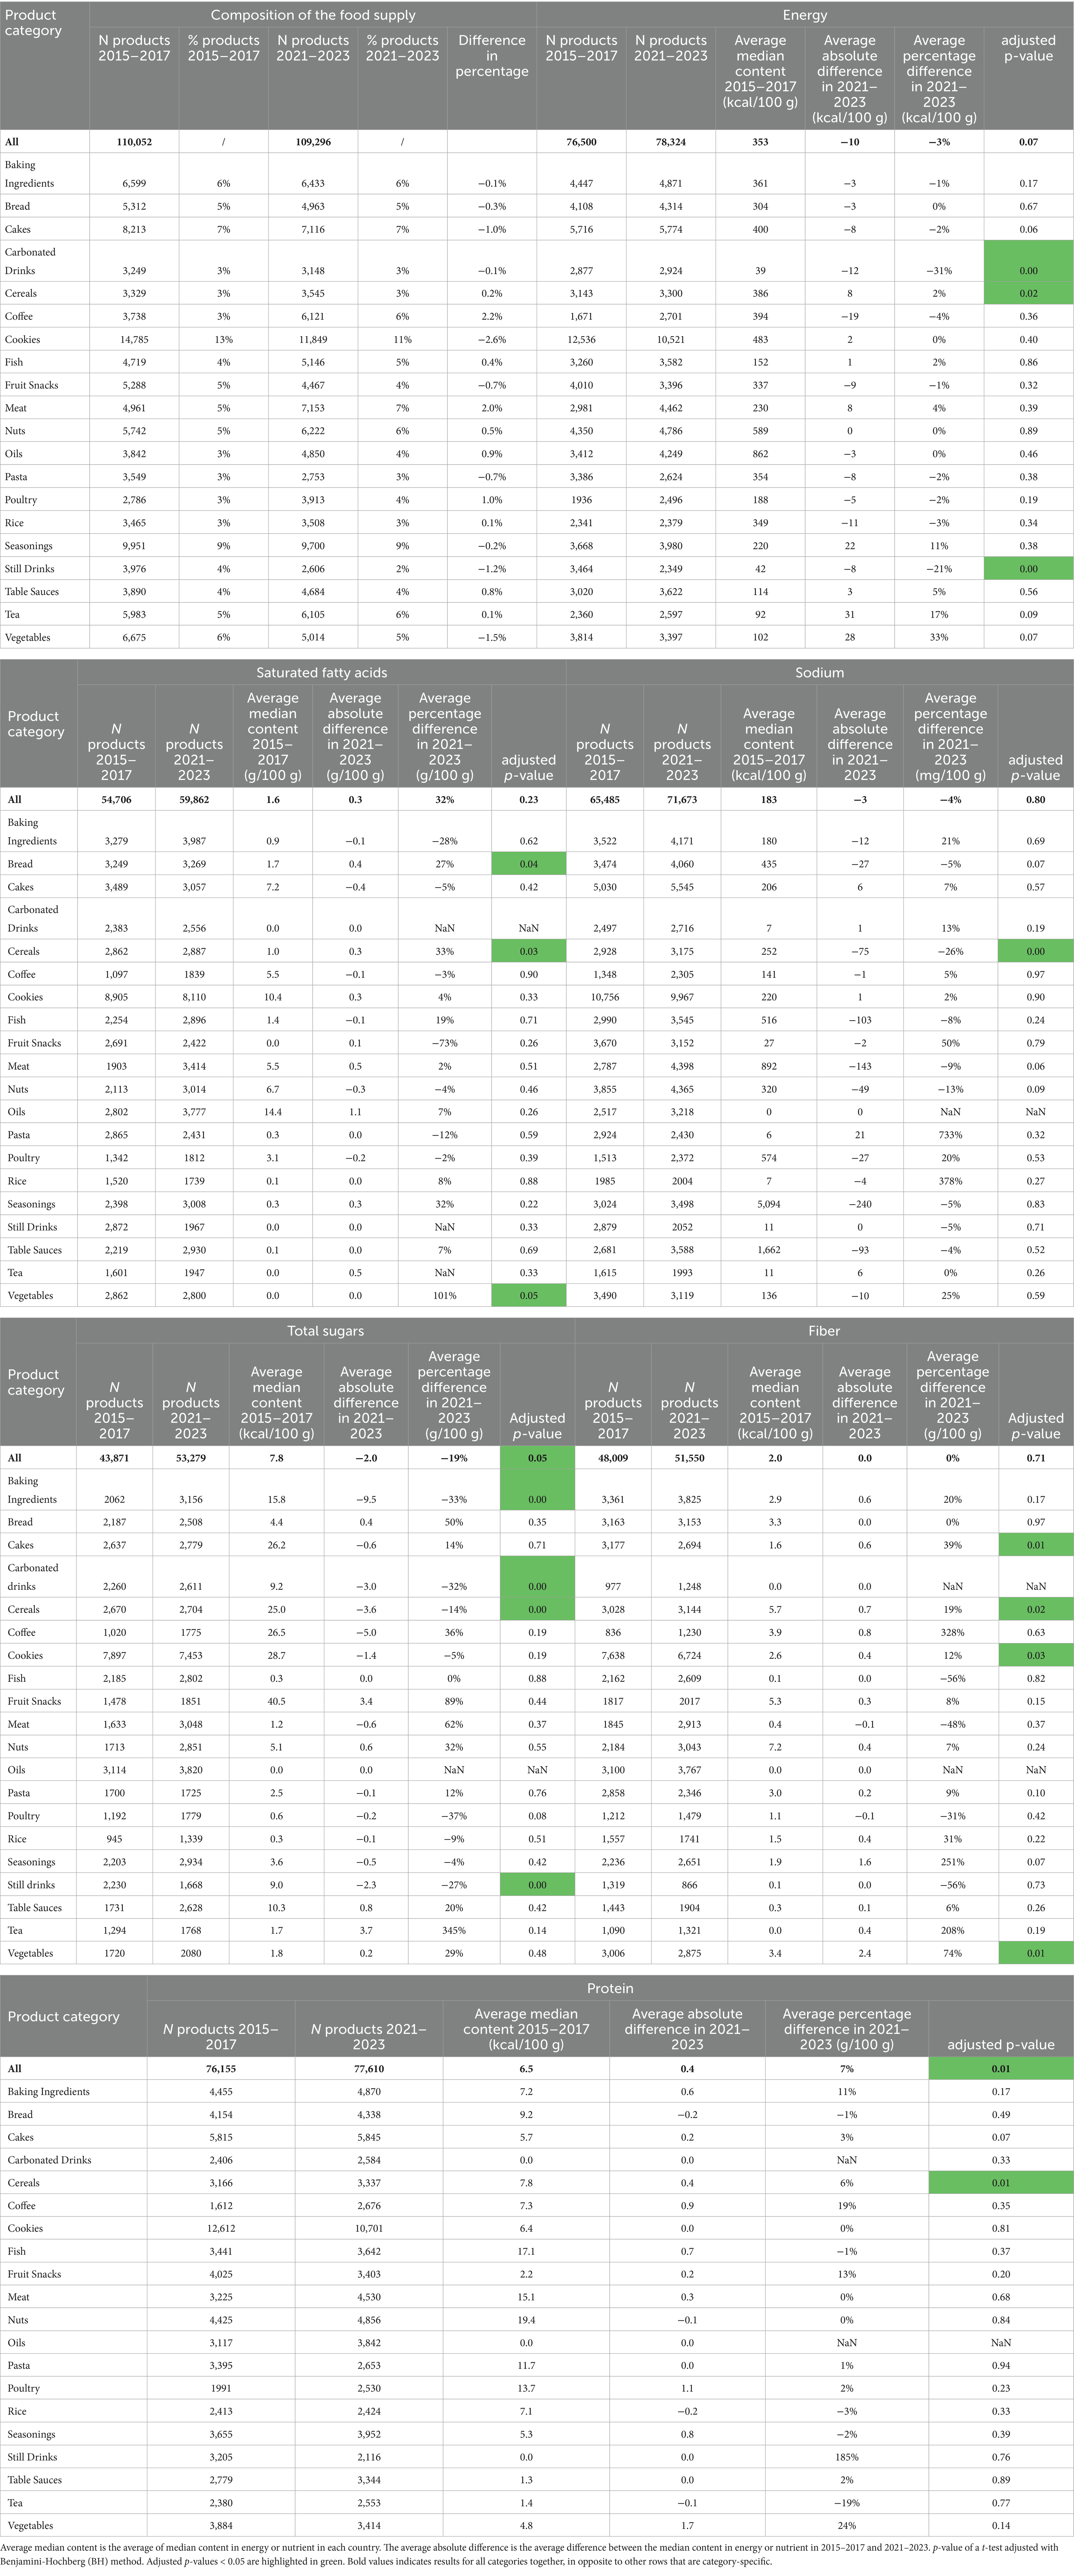
Table 3. Average median content of energy, saturated fatty acids, sodium, total sugars, fiber and proteins in top 20 categories across countries in 2015–2017 and average absolute differences with 2021–2023.
LMICs were mapped according to the top 20 product categories in their food supply using PCA (Figure 2a). Changes in the newly launched food supply from the period 2015–2017 to 2021–2023 are represented with arrows. Food supply from countries in the same region are grouped together and most arrows are short except for Sri Lanka, Nigeria Vietnam and China suggesting that the composition of the food supply remains regionalized over time. Additionally, East Asian newly launched packaged foods belonged mostly to animal-based categories (Poultry, Meat, Fish), as well as Table Sauces, and Snacks. In India, Sri Lanka, and in Nigeria, most launches happened in staples and ingredients (Seasonings, Tea, Baking Ingredients, Vegetables). Latin American and Mediterranean countries relied mostly on wheat-based products such as Pasta, Bread, and Cereals.
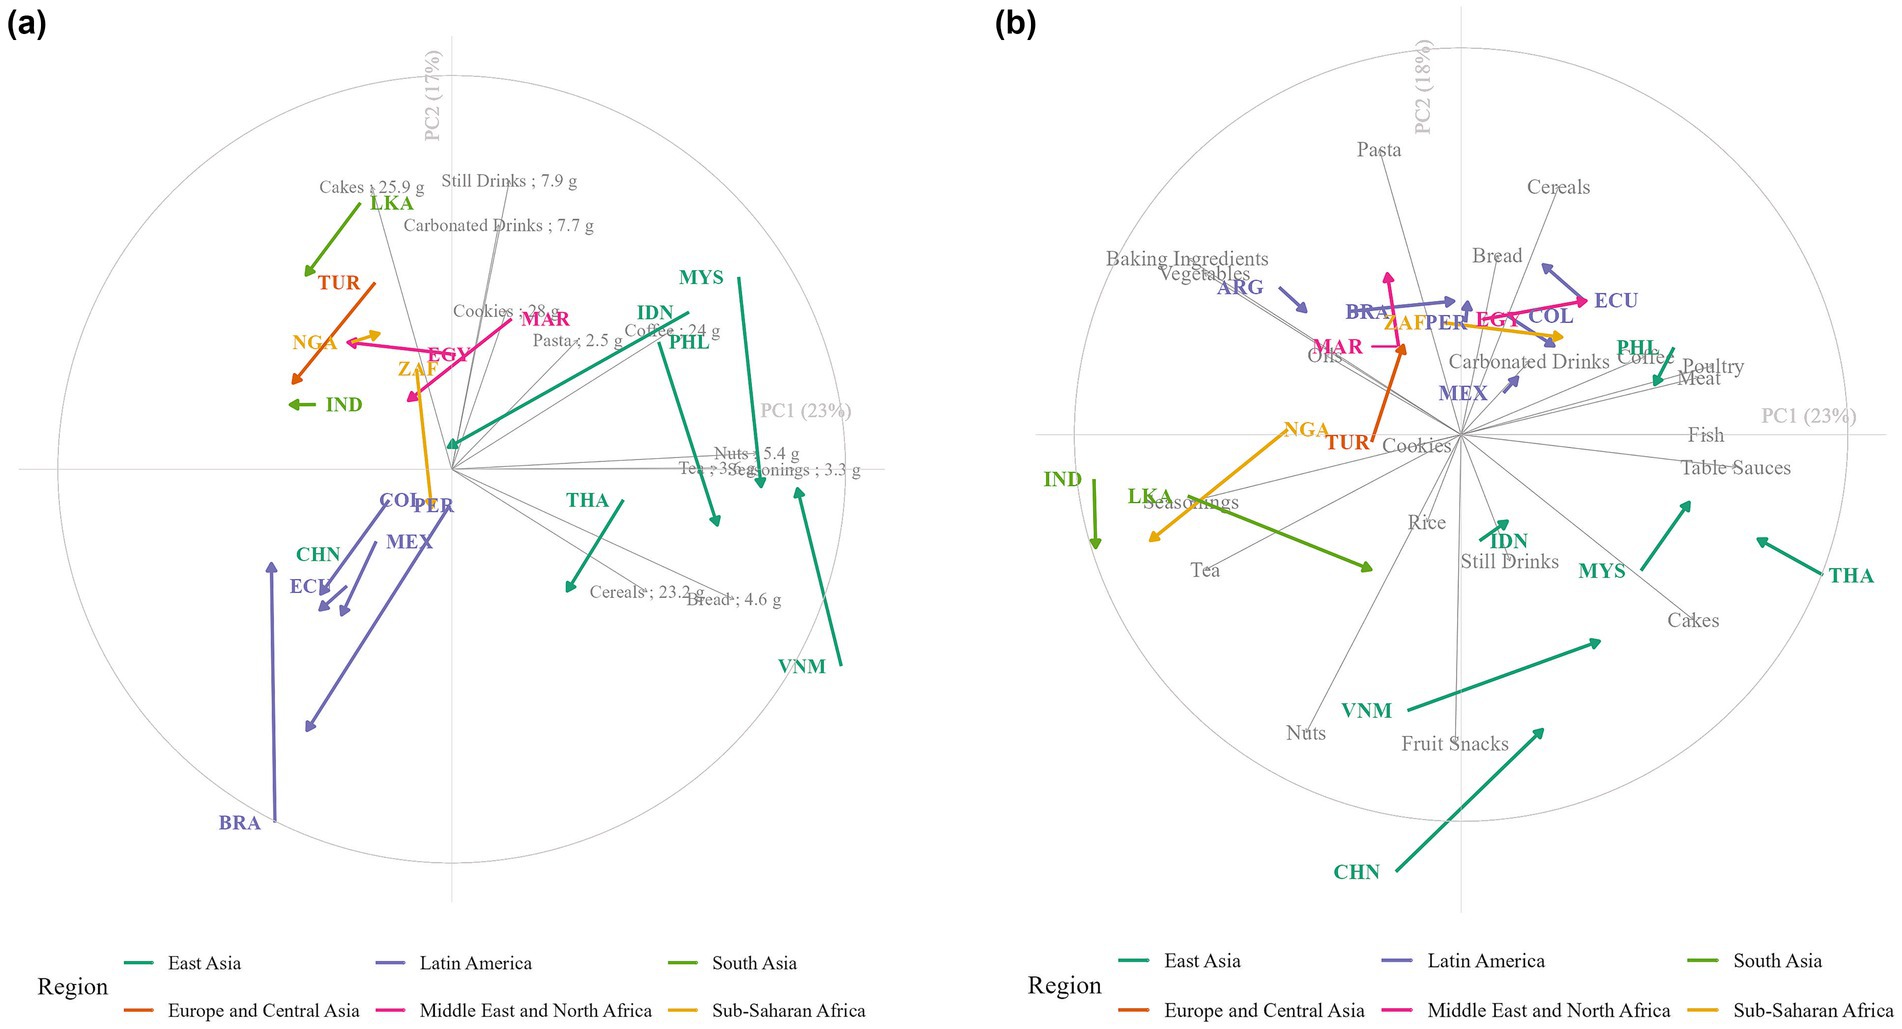
Figure 2. Principal component analysis of (a) the food supply and (b) the median content in sugars of packaged foods in top 20 categories in LMICs. Country-specific change from period 2015–2017 to 2021–2023 is indicated with an arrow. Countries are labeled with their ISO code. In (b), product categories’ names are followed by the average median content in total sugars in grams per 100 grams in the product category.
Evolution of the nutritional quality of the food supply
Newly launched packaged foods had significantly lower content in total sugars in 2021–2023 than in 2015–2017. Median content in total sugars decreased by 2.0 g/100 g (−19%) on average over the past 9 years across categories, in particular Baking Ingredients (−9.5 g/100 g; −33%), Carbonated Drinks (−3 g/100 g; −32%), Breakfast Cereals (−3.6 g/100 g; −14%) and Still Drinks (−2.3 g/100 g; −27%) (Table 3). Country-specific evolution in total sugars content is represented with an arrow in Figure 2b. Most arrows except for Brazil, Egypt, Nigeria and Vietnam are directed toward the bottom or the left corner which demonstrates that the reduction in total sugars is observed across most countries. Longer arrows such as for Malaysia, Philippines, Indonesia and Peru suggest larger reductions in those countries. Additionally, median total sugars content varied by region. New launches were lower in total sugars content in sweet product categories such as Carbonated and Still Drinks or Cookies in Latin America than in other regions (Figure 2b). The East Asian food supply was higher in total sugars in savory categories such as Seasonings, Bread and Nuts than any other region.
Packaged food launches were significantly higher in protein content in 2021–2023 than in 2015–2017. Median protein content increased by 7% between the two periods, particularly in breakfast Cereals (+0.4 g/100 g) (Table 3). No pattern could be observed across regions using PCA.
No significant change nor pattern could be observed in energy, SFA, sodium or fiber across categories (Table 3). However, there were changes at the category level. Energy content dropped by −31% and −21% in Carbonated and Still Drinks, respectively, in 2021–2023. Breakfast Cereals had a lower content of sodium (−26%) and total sugars (−14%) but a higher content of energy (+2%), SFA (+33%), protein (+6%) and fiber (+19%). Fiber content also increased in Cakes (+0.6 g/100 g), Cookies (+0.4 g/100 g) and in packaged Vegetables (+2.4 g/100 g) (Table 3).
Association with front-of-pack labeling: difference-in-difference analysis
The type of FOPL is region-specific, with Choices in South East Asia, High In Labels for most Latin American countries except Ecuador and one LMIC, Sri Lanka, in other regions. The percentage of products with a lower total sugars content than the 2015–2017 median increased in all LMICs with a FOPL, except for Brazil (Figure 3). Regional trends could also be observed. In East Asian countries, the percentage of products with a sugar content higher than the 2015–2017 median increased by more than 5% in 2021–2023. In Latin America, the percentage of products with a lower sodium content increased by 1–9% in 2021–2023. Some countries have also performed better than others in the same region. In Latin America, the biggest improvement for energy, protein, SFA and total sugars happened in Peru, the first LMIC in which High In labels were implemented (Figure 3).
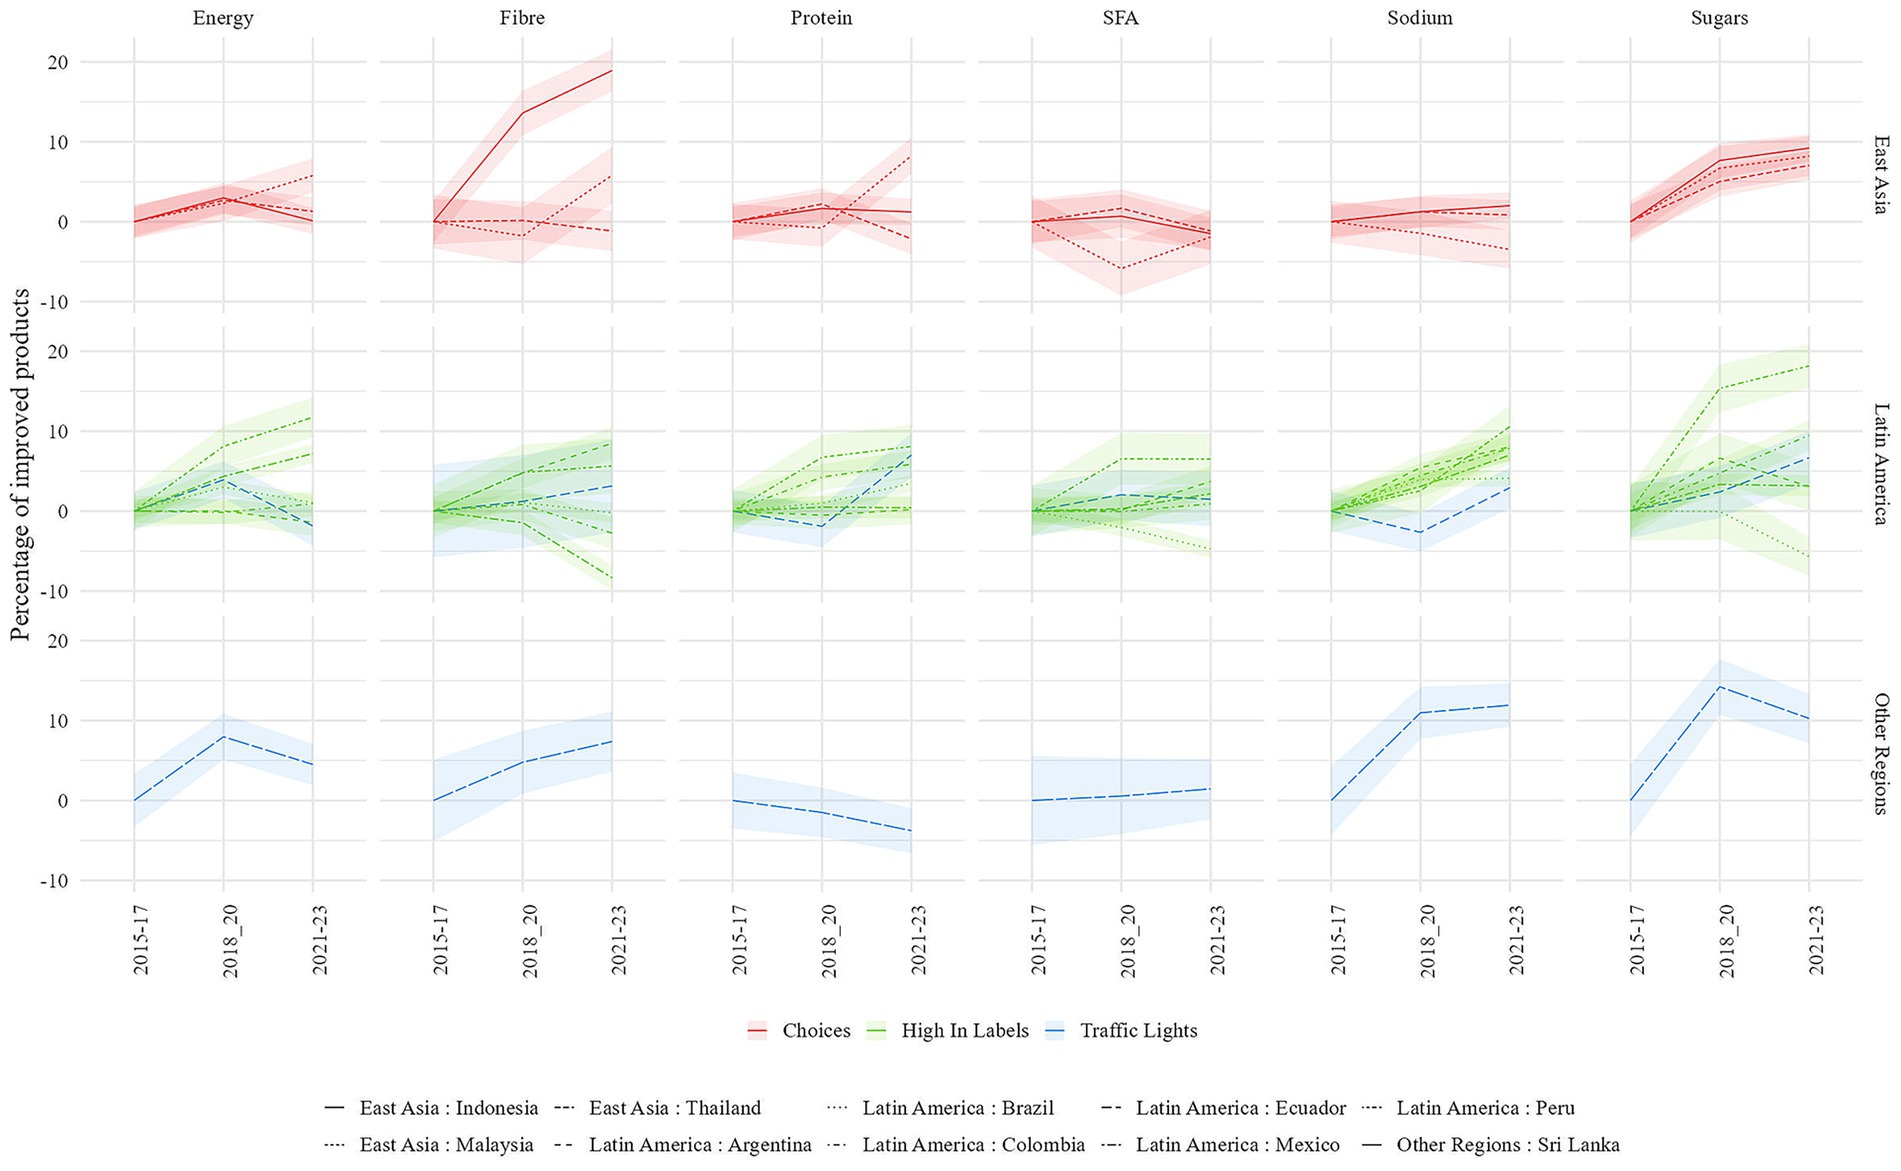
Figure 3. Difference in the percentage of products having an improved median content in energy, fiber, saturated fatty acids, protein, sodium and total sugars compared with 2015–2016-2017 by country and region. Only countries with a FOPL implemented are presented. Ribbon represents confidence interval at 95%. Only categories with a non-null median are considered in this analysis.
The number of products having an improved median content of energy and nutrients compared to the 2015–2017 median varied depending on the type of FOPL implemented. In 2021–2023, more than 55% of products had a total sugars content lower than 2015–2017 median in countries with a FOPL. This is significantly higher than in countries without FOPL (52%) and was true regardless of the type of FOPL implemented (Figure 4). The percentage of products with a sodium content lower than the 2015–2017 median increased from 49 to 55% in countries with High In labels and from 48 to 55% in countries with Traffic Lights, while it did not increase to more than 51% in other countries. The percentage of products with an improved content in fiber increased significantly from 46 to 54% in countries with the Choices label, from 46 to 53% in countries with Traffic Lights, from 48 to 52% in countries with no FOPL but did not change significantly in countries with High In labels. No patterns could be observed for energy and SFA (Figure 4).
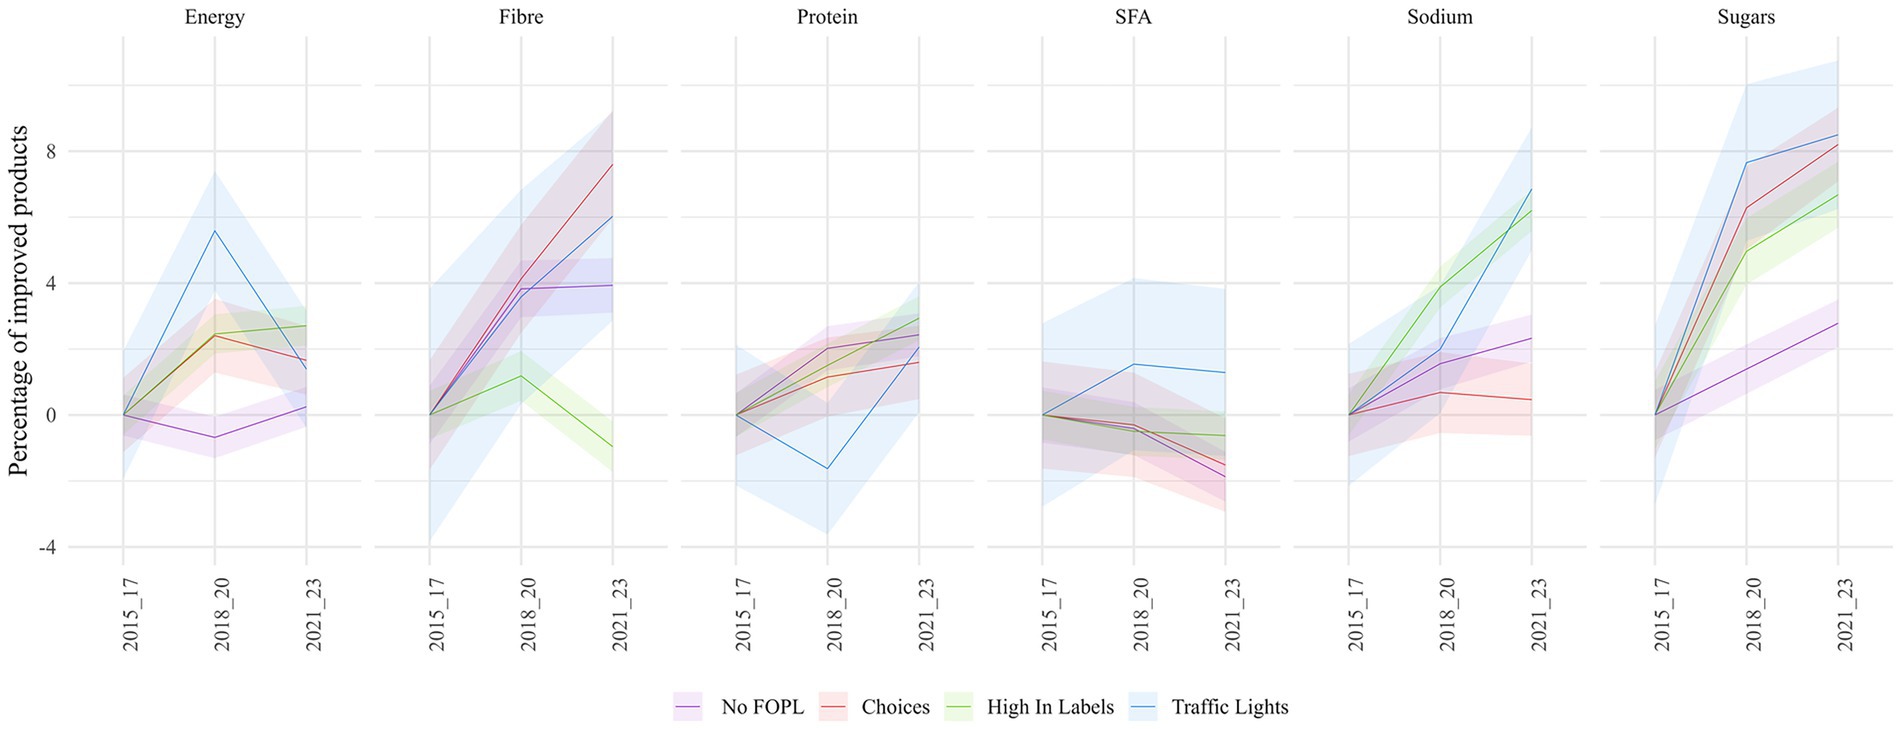
Figure 4. Difference in the percentage of products having an improved median content in energy, fiber, saturated fatty acids, protein, sodium and total sugars compared with 2015-2016-2017 by front-of-pack labeling. Ribbon represents confidence interval at 95%. Only categories with a non-null median are considered in this analysis.
Discussion
This study is the first to assess the changes in product offerings and nutritional quality of the packaged food supply in 19 LMICs across continents over 9 years, and to describe how trends have changed after the implementation of a FOPL. From 2015 to 2023, the number of animal-based and coffee products launched has increased, while fewer sweet products such as cookies, cakes, and soft drinks have been introduced. This shift in product offerings, together with category-specific improvements in the nutritional quality of packaged foods, are correlated with a reduction in total sugars content and an increase in protein content of newly launched foods in LMICs. Additionally, in countries where a FOPL has been implemented, there was a further reduction in total sugars content and, where High In labels or Traffic Lights were used, a reduction in sodium content.
Over the 9 years studied, the proportion of Poultry and Meat increased, respectively, by 1 and 2 percentage points, but the protein content did not change significantly in most product categories except for breakfast cereals. This suggests that the overall increase in protein content in LMICs newly launched packaged food supply could be due to a change in the increased number of products on the market rather than to reformulation. There are some exceptions such as Peru where protein content has increased in newly-launched products. This global rise in animal-based products consumption in LMICs has previously been described in the scientific literature as the protein transition. As LMICs consumers transition from traditional to westernized diets, the main sources of protein in their diet are not staple grains, pulses, and root crops anymore but meat, eggs and dairy (32, 33). This shift in protein consumption primarily results from economic growth and increased income levels and leads to higher demand for livestock in LMICs (34).
The proportion of newly launched Cookies, Cakes and Still Drinks has reduced by at least 1 percentage point from 2015 to 2023. In addition, median content in total sugars decreased by 2.0 g/100 g on average across categories and in Baking Ingredients, Carbonated Drinks, Breakfast Cereals and Still Drinks. Therefore, both the proportion of sweet products categories and the absolute total sugars content of packaged foods in LMICs were reduced over the 9 years studied. These results align with recent global trends of sugar reduction in the packaged food supply (18). The reduction in total sugars in soft drinks had also previously been described in Colombia between 2016 and 2018 (35). This suggests that fewer soft drinks are being launched in LMICs following 2015, while previous studies highlight the growth in sales of sugar sweetened beverages globally (36). Purchase data analyses are required to confirm if the trends in soft drinks have actually reversed over time, or if patterns are different in LMICs compared to other countries.
Implementation of High In labels and Traffic Lights have also been associated with significant sodium reductions in LMICs where they are used. This is in agreement with what has been observed in high-income countries. High In labels in Chile, Traffic Lights in the U.K and Choices in the Netherlands have fostered reformulation of the food supply toward lower sugar and sodium (37, 38). High In labels have also been previously associated with product reformulation toward a reduction in public health sensitive nutrients in Peru and Mexico (14, 15). However, implementation of Choices, a voluntary FOPL used in South East Asia, was not associated with an improvement in sodium content, despite its proven efficacy on reformulation in the Netherlands. In general, voluntary FOPL results in lower and less consistent effects on products reformulation (39). Nonetheless, improvements observed in this study with the implementation of a FOPL suggest that food policies, such as High In labels, may assist LMICs in curbing the rise in packaged foods high in sugar, SFA and sodium and combat the nutrition transition toward a stage of high obesity and non-communicable disease prevalence (5).
In Peru, improvements in energy, protein, SFA and total sugars were significantly higher than in most other Latin American countries. Peru is the first LMIC in Latin America to have used High In labels. These were implemented in 2017 (40), 3 years before Brazil (29) and Mexico (41) and 5 years before Argentina (30) and Colombia (42). Since reductions are observed in nutrients discouraged by the FOPL, those reductions may be due to a sustained impact of High-In labels and suggests that the same trends could be observed in other Latin American countries in a few years.
Our study provides new insights into the evolution of the products sold and nutritional quality of newly launched packaged foods in 19 LMICs across 6 world regions. This information is critical to understanding the food environment in LMICs and how it has changed in the context of nutrition transition toward higher consumption of packaged foods. Furthermore, the database and statistical methods chosen for this analysis enabled the characterization of trends by country, region, product category and type of FOPL implemented. The data extracted from the Mintel GNPD spans over 9 years allowing to evaluate trends in the evolution of the packaged food supply, which could not be done using generic food composition databases. The use of Principal Components Analysis on the products sold and median nutrient content by country and category was key to identifying regional and country-specific patterns in the quality of the packaged food supply in LMICs. Additionally, analyzing the percentage of products with an improved content compared to the 2015–2017 median was necessary to assess association of FOPL with the nutritional quality of the food supply regardless of the baseline content, which differed by country and category.
However, there are some limitations to consider. The Mintel GNPD captures only launches advertised as new in a retail store. Products reformulated silently and legacy products are missing from this evaluation. In addition, new launches may not contribute the most to overall intake, so evolution in nutritional quality observed in this analysis captures the impact of FOPL on reformulation but may not reflect actual changes in nutrient intakes. Future studies could be performed on other commercial food purchase databases featuring sales such as Nielsen or Euromonitor (20) to better assess the impact of FOPL on the whole food supply.
Another limitation is that the Mintel GNPD only captures nutrient content declared on-pack, which depends on local regulations. Evolution in the percentage of products with a declared content could influence perceived nutritional quality. This is why sugar content was excluded from the analysis of the evolution of the percentage of “improved” products in Brazil and Argentina where declaration of total sugars was only made mandatory in 2021/2022. Harmonization of nutrient labeling across countries would greatly improve monitoring of packaged foods nutritional quality globally. Additionally, some nutrients relevant for public health in LMICs such as free sugars or micronutrients could not be monitored. Some studies have attempted to tackle this issue using machine learning to predict the content in free sugars of packaged foods (43). Future research may use this algorithm or alternative datasets to assess free sugar levels in packaged foods and investigate potential substitution effects between total sugars and free sugars. Notably, Labonté et al. recently demonstrated, through a French-Canadian survey, that substituting total sugars with free sugars in three nutrient profiling models had little to no effect on the association with diet quality and health markers. These findings suggest that tracking total sugars remains relevant for public health (44).
In this study, we focused on the top 20 categories in terms of new launches in Mintel GNPD to study the most relevant product categories in LMICs and avoid analyzing changes in smaller less consumed categories. This was based on the assumption that the more numerous the launches, the higher the demand for this product offering in LMICs. This methodological choice explains for instance the absence of dairy products in the analysis. Further studies could replicate the same methodology on specific food categories of interest.
Statistically significant improvements were identified in total sugar (−2.0 g/100 g) and protein content (+0.4 g/100 g) but the clinical relevance of these findings has yet to be established. Additionally, these changes were measured per 100 g, and their overall impact may be influenced by concurrent trends in portion sizes. Future research should consider examining shifts in consumer behavior and portion size across the relevant countries.
The impact of FOPL on product reformulation can be influenced by other existing national nutrition policies. For instance, food and sugar taxes, i.e., a levy applied to a certain food category or to products considered as high in a public health sensitive nutrient, may also encourage manufacturers to reduce sugar or sodium content in their products (45). Among the countries considered in this study, 10 had a food or sugar tax implemented before 2023: Mexico (2014), Ecuador (2016), Sri Lanka (2017), Peru (2018), and Malaysia (2019), all of which have FOPL, as well as India (2017), Turkey (2017), South Africa (2018), Philippines (2018), and Nigeria (2022), where there are no FOPL regulations (46, 47). The proportion of countries implementing a food tax being similar among countries with a FOPL (5 out of 10) and those without (5 out of 11), this was not considered as limitation in our study.
In conclusion, this study examines the changes in product offerings and nutritional quality of newly launched packaged food products in 19 low- and middle-income countries (LMICs) from 2015 to 2023. A shift toward more animal-based products and fewer sweet products was observed, with notable improvements in protein and total sugars content. The implementation of front-of-package labeling was further correlated with reductions in total sugars, and, depending on the type of scheme implemented, with reduction in sodium. These findings provide insights on the food environment in LMICs undergoing a nutrition transition and on certain food policies implementation is associated with reformulation of packaged foods. Future research should attempt to establish causality between food policies and food reformulation and continue to examine the broader implications of these trends and impact on dietary intakes and public health outcomes.
Data availability statement
GNPD is a commercial dataset produced and distributed by Mintel. Requests to access these datasets should be directed to https://mintel.com.
Author contributions
MT: Writing – review & editing, Writing – original draft, Formal analysis, Visualization, Conceptualization, Data curation, Methodology. AR: Writing – original draft, Writing – review & editing, Formal analysis, Methodology, Supervision, Visualization, Conceptualization. AE: Writing – review & editing, Supervision, Writing – original draft, Conceptualization. TM: Writing – review & editing, Formal analysis, Supervision, Methodology, Conceptualization. FH: Writing – review & editing. EF: Writing – review & editing, Methodology, Supervision, Conceptualization.
Funding
The author(s) declare that financial support was received for the research and/or publication of this article. This study was sponsored by Société des Produits Nestlé S.A.
Conflict of interest
MT, AE, TM, and AR were employed by Société des Produits Nestlé S.A. at the time of the study. No company-specific analyses were conducted as part of this research and only category level data were presented.
The author(s) declare that financial support was received for the research and/or publication of this article. This study was sponsored by Société des Produits Nestlé S.A. Employées of Société des Produits Nestlé were involved in the design, data analysis, preparation of the manuscript, and decision to publish.
Generative AI statement
The authors declare that Gen AI was used in the creation of this manuscript. During the preparation of this work the authors used NesGPT (OpenAI’s GPT-4 language model for Nestlé corporate use) in order to finetune R codes in data analysis and to improve readability of the manuscript. After using this tool/service, the authors reviewed and edited the content as needed and take full responsibility for the content of the publication.
Any alternative text (alt text) provided alongside figures in this article has been generated by Frontiers with the support of artificial intelligence and reasonable efforts have been made to ensure accuracy, including review by the authors wherever possible. If you identify any issues, please contact us.
Publisher’s note
All claims expressed in this article are solely those of the authors and do not necessarily represent those of their affiliated organizations, or those of the publisher, the editors and the reviewers. Any product that may be evaluated in this article, or claim that may be made by its manufacturer, is not guaranteed or endorsed by the publisher.
References
1. Popkin, BM, Corvalan, C, and Grummer-Strawn, LM. Dynamics of the double burden of malnutrition and the changing nutrition reality. Lancet. (2020) 395:65–74. doi: 10.1016/S0140-6736(19)32497-3
2. Shetty, P. Nutrition transition and its health outcomes. Indian J Pediatr. (2013) 80:21–7. doi: 10.1007/s12098-013-0971-5
3. Drewnowski, A, and Popkin, BM. The nutrition transition: new trends in the global diet. Nutr Rev. (1997) 55:31–43.
4. Morgan, AE, and Fanzo, J. Nutrition transition and climate risks in Nigeria: moving towards food systems policy coherence. Curr Environ Health Reports. (2020) 7:392–403. doi: 10.1007/s40572-020-00292-3
5. Popkin, BM, and Ng, SW. The nutrition transition to a stage of high obesity and noncommunicable disease prevalence dominated by ultra-processed foods is not inevitable. Obes Rev. (2022) 23:e13366. doi: 10.1111/obr.13366
6. Tassy, M, van Dijk, R, Eldridge, AL, Mak, TN, Drewnowski, A, and Feskens, EJ. Nutrient profiling models in low- and middle-income countries considering local nutritional challenges: a systematic review. Curr Dev Nutr. (2025) 9:104530. doi: 10.1016/j.cdnut.2024.104530
7. WHO. Nutrient profiling: Report of a WHO/IASO technical meeting. London, United Kingdom: WHO (2010).
8. Drewnowski, A. Uses of nutrient profiling to address public health needs: from regulation to reformulation. Proc Nutr Soc. (2017) 76:220–9. doi: 10.1017/S0029665117000416
9. Francesco Mazzù, M, Donato, C, and Marozzo, V. An investigation on the interplay between front-of-pack nutritional labels and plastic packaging materials in healthy foods. Food Qual Prefer. (2025) 122:105291. doi: 10.1016/j.foodqual.2024.105291
10. Senda, MVG, Raposo, A, Teixeira-Lemos, E, Chaves, C, Alturki, HA, Alsharari, ZD, et al. Brazilian front-of-package labeling: a product compliance analysis 12 months after implementation of regulations. Nutrients. (2024) 16:343. doi: 10.3390/nu16030343
11. Diez-Canseco, F, Najarro, L, Cavero, V, Saavedra-Garcia, L, Taillie, LS, Carpentier, FRD, et al. Recall, understanding, use, and impact of front-of-package warning labels on ultra-processed foods: a qualitative study with mothers of preschool children in Peru. PLOS Glob Public Health. (2024) 4:e0003938. doi: 10.1371/journal.pgph.0003938
12. Crosbie, E, Gomes, FS, Olvera, J, Rincón-Gallardo Patiño, S, Hoeper, S, and Carriedo, A. A policy study on front-of-pack nutrition labeling in the Americas: emerging developments and outcomes. Lancet Regional Health Americas. (2023) 18:100400. doi: 10.1016/j.lana.2022.100400
13. Mamani-Urrutia, V, Durán, R, and Bustamante-López, A. Evaluating nutrient profiles of packaged foods in Peru pre-and post-introduction of front-of-pack warning labels, 2018–2021. Romanian J Diabetes Nutr Metab Diseases. (2025) 32:26–33.
14. Saavedra-Garcia, L, Meza-Hernández, M, Diez-Canseco, F, and Taillie, LS. Reformulation of top-selling processed and ultra-processed foods and beverages in the Peruvian food supply after front-of-package warning label policy. Int J Environ Res Public Health. (2022) 20:424. doi: 10.3390/ijerph20010424
15. Salgado, JC, Pedraza, LS, Contreras-Manzano, A, Aburto, TC, Tolentino-Mayo, L, and Barquera, S. Product reformulation in non-alcoholic beverages and foods after the implementation of front-of-pack warning labels in Mexico. PLoS Med. (2025) 22:e1004533. doi: 10.1371/journal.pmed.1004533
16. Ndanuko, R, Maganja, D, Kibet, A, Coyle, DH, Kimiywe, J, Raubenheimer, D, et al. Sodium content and labelling completeness of packaged foods and beverages in Kenya. Nutrients. (2021) 13:1385. doi: 10.3390/nu13041385
17. Pongutta, S, Chongwatpol, P, Tantayapirak, P, and Vandevijvere, S. Declaration of nutrition information on and nutritional quality of Thai ready-to-eat packaged food products. Public Health Nutr. (2018) 21:1409–17. doi: 10.1017/S1368980017003792
18. Tassy, M, Rytz, A, Drewnowski, A, Lecat, A, Jacquier, EF, and Charles, VR. Monitoring improvements in the nutritional quality of new packaged foods launched between 2016 and 2020. Front Nutr. (2022) 9:983940. doi: 10.3389/fnut.2022.983940
19. Mintel. Mintel Data Integration | Mintel. Available online at: https://www.mintel.com/products/data-integration/ (Accessed January 1, 2025).
20. Spiteri, SA, Olstad, DL, and Woods, JL. Nutritional quality of new food products released into the Australian retail food market in 2015–is the food industry part of the solution? BMC Public Health. (2018) 18:1–10. doi: 10.1186/s12889-018-5127-0
21. Phulkerd, S, Thongcharoenchupong, N, Dickie, S, Machado, P, Woods, J, Mo-Suwan, L, et al. Profiling ultra-processed foods in Thailand: sales trend, consumer expenditure and nutritional quality. Glob Health. (2023) 19:64. doi: 10.1186/s12992-023-00966-1
22. Kikuta, C, Borges, CA, and Duran, AC. Monitoring health and nutrition claims on food labels in Brazil. Front Nutr. (2024) 11:1308110. doi: 10.3389/fnut.2024.1308110
23. World Bank. World Bank country and lending groups World Bank data help desk. (2024) Available online at: https://datahelpdesk.worldbank.org/knowledgebase/articles/906519-world-bank-country-and-lending-groups (Accessed October 10, 2025).
24. Department of Health. Food stuffs, cosmetics and disinfectants act, 197 (act no. 54 or 1972) regulations relating to the labelling and advertising of foodstuffs, Pretoria: Ministry of Health of South Africa. vol. 3337 (2023).
25. Labonté, M-È, Poon, T, Gladanac, B, Ahmed, M, Franco-Arellano, B, Rayner, M, et al. Nutrient profile models with applications in government-led nutrition policies aimed at health promotion and noncommunicable disease prevention: a systematic review. Adv Nutr. (2018) 9:741–88. doi: 10.1093/advances/nmy045
26. Martin, C, Turcotte, M, Cauchon, J, Lachance, A, Pomerleau, S, Provencher, V, et al. Systematic review of nutrient profile models developed for nutrition-related policies and regulations aimed at noncommunicable disease prevention -an update. Adv Nutr. (2023) 14:1499–522. doi: 10.1016/j.advnut.2023.08.013
27. Leroy, F, Rytz, A, Drewnowski, A, Tassy, M, Orengo, A, Charles, VR, et al. A new method to monitor the nutritional quality of packaged foods in the global food supply in order to provide feasible targets for reformulation. Nutrients. (2021) 13:576. doi: 10.3390/nu13020576
28. Scapin, T, Louie, JCY, Pettigrew, S, Neal, B, Rodrigues, VM, Fernandes, AC, et al. The adaptation, validation, and application of a methodology for estimating the added sugar content of packaged food products when total and added sugar labels are not mandatory. Food Res Int. (2021) 144:110329. doi: 10.1016/j.foodres.2021.110329
29. Agência Nacional de Vigilância Sanitária. Resolução De Diretoria Colegiada - RDC N° 429, De 8 De Outubro de 2020, Brasilia: Ministério da Saúde (2020).
30. Ministerio de Salud. Promoción de la alimentación saludable - Decreto 151/2022 DCTO-2022-151-APN-PTE - Apruébase la Reglamentación de la Ley N° 27.642., Beijing: Ministry of Health. (2022).
31. National Health and Family Planning Commission. National Food Safety Standard Standard for nutrition labelling of prepackaged foods GB 28050—2011. Buenos Aires: Republica Argentina. (2011).
32. Drewnowski, A, and Hooker, K. The protein transition: what determines the animal-to-plant (a:P) protein ratios in global diets. Front Nutr. (2025) 12:1518793. doi: 10.3389/fnut.2025.1518793
33. Aurino, E, Fernandes, M, and Penny, ME. The nutrition transition and adolescents’ diets in low- and middle-income countries: a cross-cohort comparison. Public Health Nutr. (2017) 20:72–81. doi: 10.1017/S1368980016001865
34. Balehegn, M, Duncan, A, Tolera, A, Ayantunde, AA, Issa, S, Karimou, M, et al. Improving adoption of technologies and interventions for increasing supply of quality livestock feed in low- and middle-income countries. Glob Food Sec. (2020) 26:100372. doi: 10.1016/j.gfs.2020.100372
35. Lowery, CM, Mora-Plazas, M, Gómez, LF, Popkin, B, and Taillie, LS. Reformulation of packaged foods and beverages in the Colombian food supply. Nutrients. (2020) 12:3260. doi: 10.3390/nu12113260
36. Popkin, BM, and Hawkes, C. Sweetening of the global diet, particularly beverages: patterns, trends, and policy responses. Lancet Diabetes Endocrinol. (2016) 4:174–86. doi: 10.1016/S2213-8587(15)00419-2
37. Packer, J, Michalopoulou, S, Cruz, J, Dhar, D, Stansfield, C, Kaczmarska, H, et al. The impact of non-fiscal mandatory and voluntary policies and interventions on the reformulation of food and beverage products: a systematic review. Nutrients. (2024) 16:3484. doi: 10.3390/nu16203484
38. van der Bend, DLM, Jansen, L, van der Velde, G, and Blok, V. The influence of a front-of-pack nutrition label on product reformulation: a ten-year evaluation of the Dutch choices programme. Food Chem. (2020) 6:100086. doi: 10.1016/j.fochx.2020.100086
39. Ganderats-Fuentes, M, and Morgan, S. Front-of-package nutrition labeling and its impact on food industry practices: a systematic review of the evidence. Nutrients. (2023) 15:2630. doi: 10.3390/nu15112630
40. Ministerio de la Producción. Aprueban Manual de Advertencias Publicitarias en el marco de lo establecido en la Ley N° 30021, Ley de promoción de la alimentación saludable para niños, niñas y adolescentes, y su Reglamento aprobado por Decreto Supremo N° 017-2017-SA, Lima: Ministerio de Salud del Perú. (2019).
41. Mexico DOF, LINEAMIENTOS por los que se dan a conocer los criterios nutrimentales y de publicidad que deberán observar los anunciantes de alimentos y bebidas no alcohólicas para publicitar sus productos en televisión abierta y restringida, así como en salas de exhibición cinematográfica, conforme a lo dispuesto en los artículos 22 Bis, 79, fracción X y 86, fracción VI, del Reglamento de la Ley General de Salud en Materia de Publicidad. In: Salud Sd, editor (2014)
42. Ministerio de salud y proteccion social. Resolución 2492 de 2022, por la cual se modifican artículos de la Resolución 810 de 2021 que establece el reglamento técnico sobre los requisitos de etiquetado nutricional y frontal que deben cumplir los alimentos envasados y empacados para consumo humano, Bogota: Ministerio de Salud y Protección Social. (2022).
43. Scuccimarra, EA, Arnaud, A, Tassy, M, Lê, K-A, and Mainardi, F. Predicting carbohydrate quality in a global database of packaged foods. Frontiers. Nutrition. (2025) 12. doi: 10.3389/fnut.2025.1530846
44. Corriveau, A, Turcotte, M, Bergeron, A, Lemieux, S, and Labonté, M-È. Does the inclusion of free sugars as opposed to Total sugars in nutrient profiling models improve their performance? A cross-sectional analysis from the PREDISE study. J Nutr. (2025) 155:2459–74. doi: 10.1016/j.tjnut.2025.05.038
45. Wierzejska, RE. The impact of the sweetened beverages tax on their reformulation in Poland-the analysis of the composition of commercially available beverages before and after the introduction of the tax (2020 vs. 2021). Int J Environ Res Public Health. (2022) 19:14464. doi: 10.3390/ijerph192114464
46. Global Food Research Program U-CH. Fiscal policies: sweetened soft drink taxes 2025. (2025). Available online at: https://www.globalfoodresearchprogram.org/resource/taxes-on-unhealthy-foods-and-beverages/ (Accessed October 10, 2025).
47. Global Food Research Program U-CH. Fiscal policies: unhealthy food taxes 2025. (2025). Available online at: https://www.globalfoodresearchprogram.org/resource/taxes-on-unhealthy-foods-and-beverages/ (Accessed October 10, 2025).
Keywords: food supply, nutrient content, low- and middle-income countries, front-of-pack labeling, nutrient profiling
Citation: Tassy M, Rytz A, Eldridge AL, Mak TN, Hayford FEA and Feskens EJM (2025) Evolution of the nutritional quality of packaged food supply in low- and middle-income countries following the implementation of a front-of-pack labeling scheme. Front. Nutr. 12:1636713. doi: 10.3389/fnut.2025.1636713
Edited by:
Ionel Dumitru, Bucharest Academy of Economic Studies, RomaniaReviewed by:
Muhammad Naeem, University of Education Lahore, PakistanHesti Permata Sari, Jenderal Soedirman University, Indonesia
Copyright © 2025 Tassy, Rytz, Eldridge, Mak, Hayford and Feskens. This is an open-access article distributed under the terms of the Creative Commons Attribution License (CC BY). The use, distribution or reproduction in other forums is permitted, provided the original author(s) and the copyright owner(s) are credited and that the original publication in this journal is cited, in accordance with accepted academic practice. No use, distribution or reproduction is permitted which does not comply with these terms.
*Correspondence: Marie Tassy, bWFyaWUudGFzc3lAd3VyLm5s